Light reintroduction after dark exposure reactivates plasticity in adults via perisynaptic activation of MMP-9
- University of Maryland, United States
Figures
Figure 1

Degradation of ECM in primary visual cortex by light reintroduction (LRx).
Top: Experimental paradigm. C57B/L6J mice raised in 12/12 hr light/dark cycle until postnatal day 90 (P90) received 10 days of dark exposure (DE) with subsequent light reintroduction (1 day; LRx). (A-C) Low magnification (10X) double labeled images of the binocular region of primary visual cortex with FITC-wisteria floribunda agglutinin (WFA; green) and Alexa-546 anti-parvalbumin antibody (PV; red) in control subjects (A), following dark exposure (B) and following dark exposure/light reintroduction (C). Approximate locations of layers I to VI and hippocampus (HP) are shown. (D-F) High magnification images (100X). (G) Quantification of mean fluorescence intensities for WFA (left) and PV (right) in maximal intensity projections (Z-stack 3 × 7.5 μm x of an area 450 μm wide x 750 μm deep; spanning all cortical layers). Mean±SEM; n=6, 6, 7 subjects for Con, DE, LRx, respectively. One way ANOVA, WFA; F=13.57, p=0.0004. PV; F=3.79, p=0.045. (H) Quantification of WFA intensity in region of interest 250 – 400 μm from surface, normalized to average control (n=5 subjects each). One-way ANOVA, F=6.01; p=0.0016. *p<0.05, Tukey-Kramer post hoc. (I) LRx induced a decrease in WFA intensity in PV+ and PV- pixels. (Control 6 subjects, 240 ROIs) versus LRx (4 subjects, 249 ROIs); *p<0.005, Student’s T-test.
-
Figure 1—source data 1
- https://doi.org/10.7554/eLife.27345.003
Figure 2 with 1 supplement
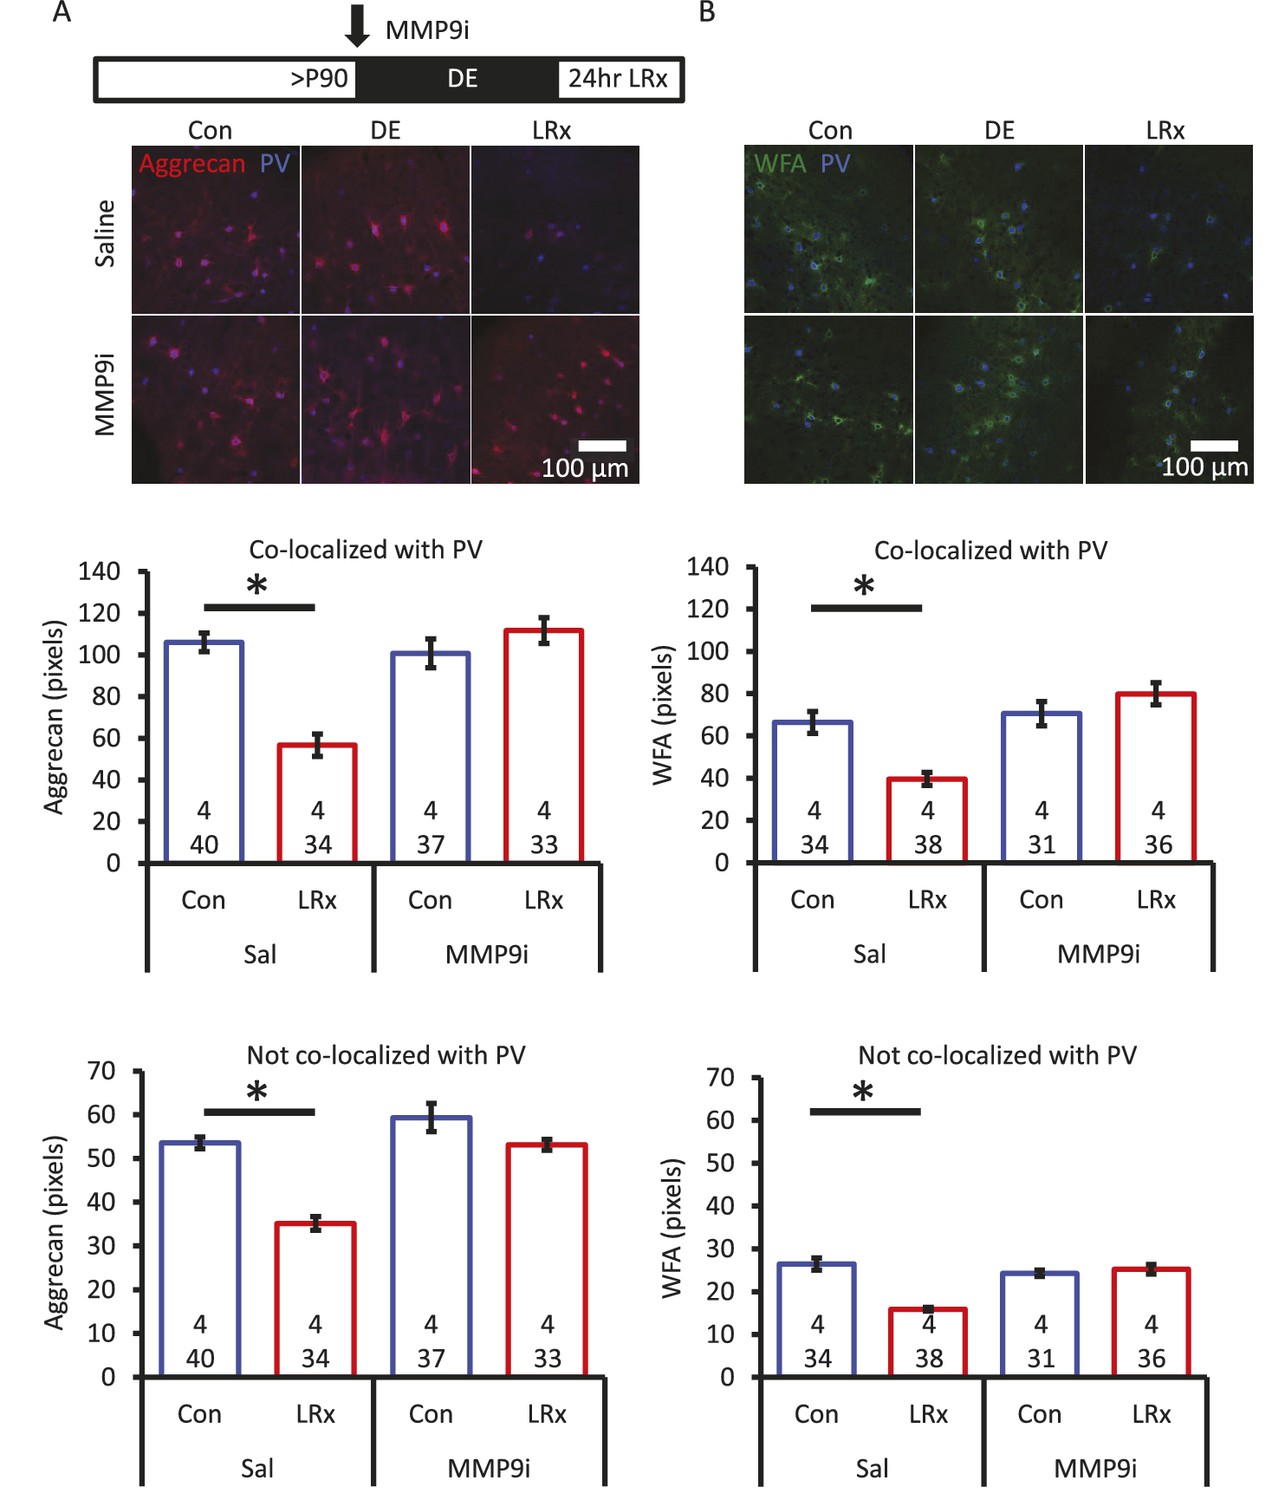
Degradation of ECM by light reintroduction is blocked by MMP-9 inhibitor.
Inset: experimental paradigm. MMP-9 inhibitor (MMP9i; 5 nM) was delivered i.c. via Alzet 1007D micro-osmotic mini pumps 6 days prior to LRx, concurrent with DE. (A) Top: Double label confocal micrographs of anti-aggrecan (red) and anti-parvalbumin immunoreactivity (blue) in each experimental condition. Bottom: Population data. Aggrecan intensity measured in the region 250 – 400 μm from cortical surface. One-way ANOVA, Aggrecan, co-localized with PV: F=18.81, p<0.0001, not co-localized with PV: F=26.32, p<0.0001. *p<0.01, Tukey-Kramer post hoc. (B) Top: Double label confocal micrographs of WFA staining (green) and anti-parvalbumin immunoreactivity (blue) in each experimental condition. Bottom: Population data. WFA intensity measured 250 – 400 μm from cortical surface. One-way ANOVA, WFA, co-localized with PV: F=12.92, p<0.0001, not co-localized with PV: F=22.49, p<0.0001. *p<0.01, Tukey-Kramer post hoc. n=(subjects, cells).
-
Figure 2—source data 1
- https://doi.org/10.7554/eLife.27345.007
Figure 2—figure supplement 1
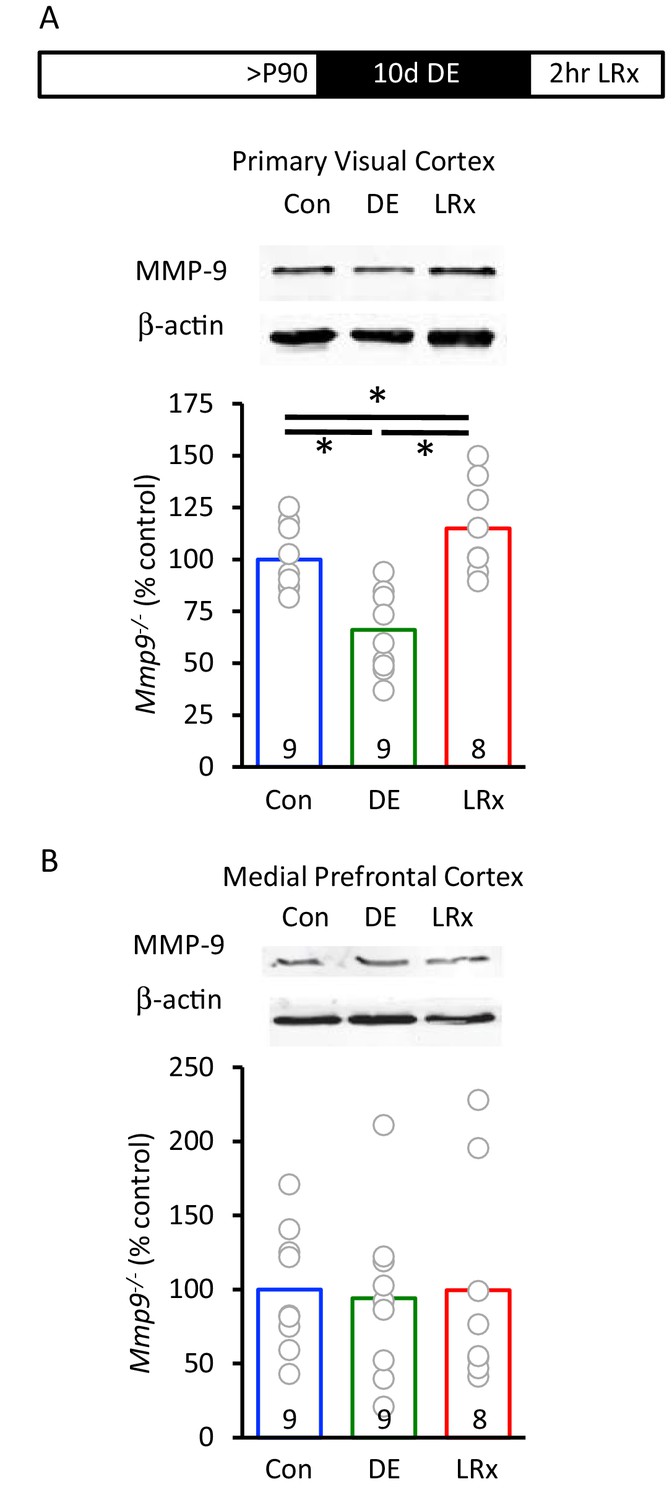
Rapid increase in active MMP-9 in V1 by light reintroduction.
(A) Inset: Experimental paradigm. Dark exposure followed by light reintroduction (2 hr) induced an increase in active MMP-9 (~95 kDa) in V1. MMP-9 was normalized to β-actin as gel loading control (n=9, 9, 8 subjects for Con, DE, LRx, respectively). One-way ANOVA, F=15.99; p<0.001. *p<0.05, Tukey-Kramer post hoc. (B) No change in active MMP-9 in medial prefrontal cortex (n=9, 9, 8 subjects for Con, DE, LRx, respectively). One-way ANOVA, F=0.03; p=0.97.
-
Figure 2—figure supplement 1—source data 1
- https://doi.org/10.7554/eLife.27345.006
Figure 3 with 1 supplement
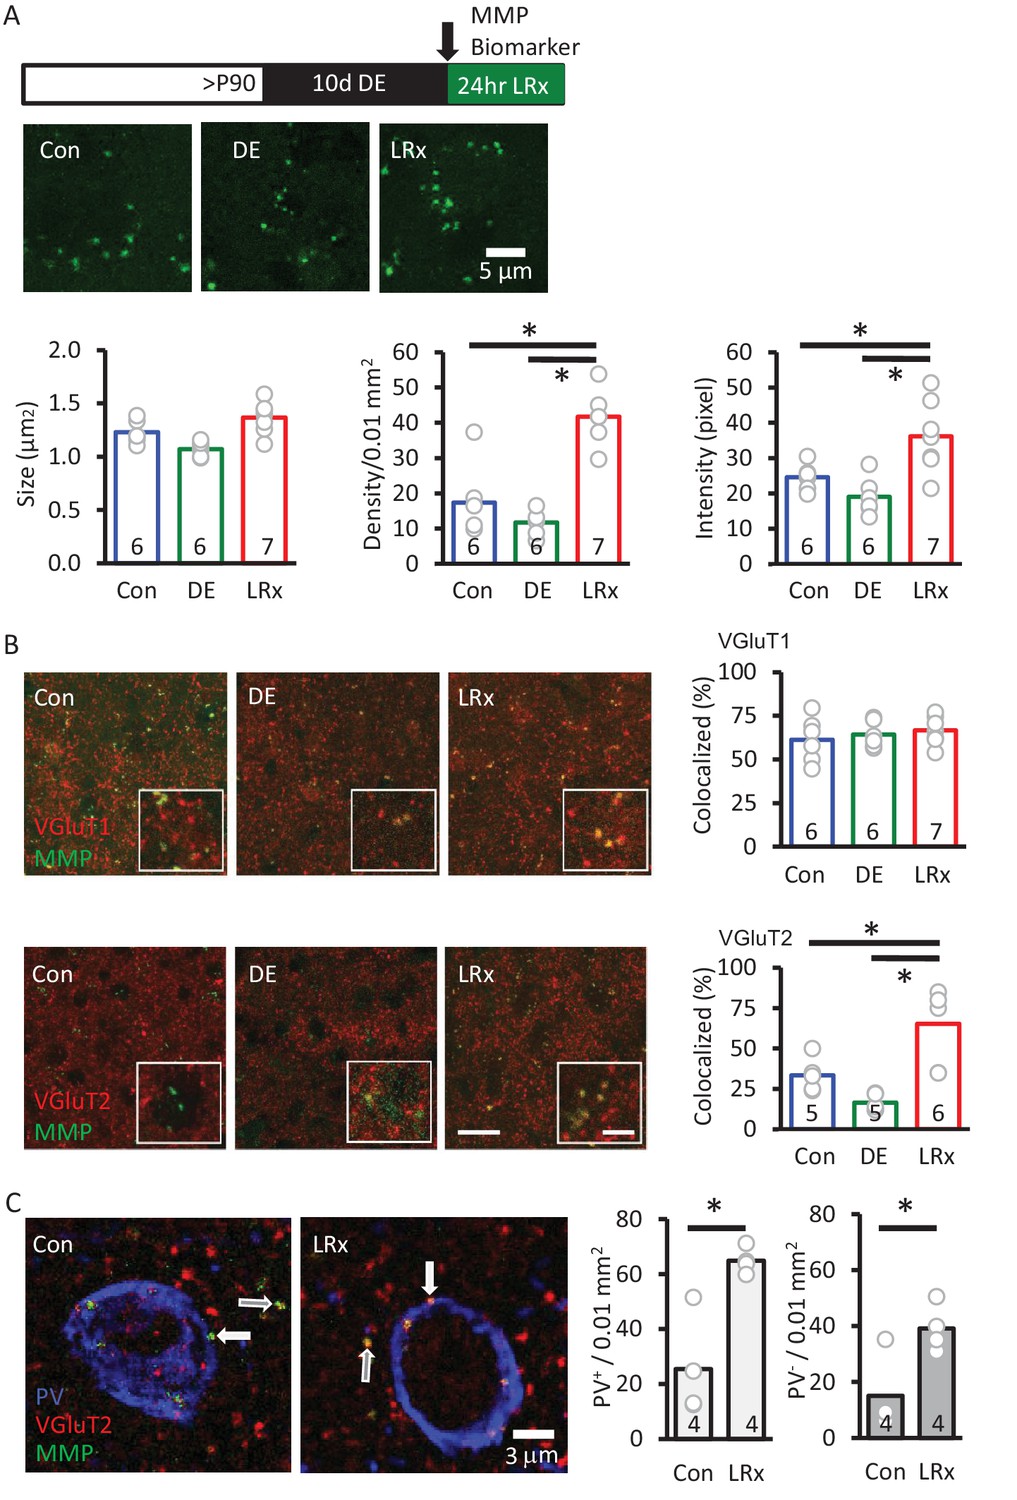
MMP biomarker reports in vivo proteolyis at synapses following LRx.
Inset: experimental paradigm. The MMP biomarker, dye-quenched gelatin (2 mg/ml), was delivered i.c. via cannula at the initiation of LRx. (A) The biomarker reveals punctate staining, and a significant increase in density and intensity following LRx (n=6, 6, 8 subjects for Con, DE, LRx, respectively). One-way ANOVA, F=9.2; p=0.002 for intensity, F=27.74; p<0.0001 for density, F=10.17, p=0.0014 for size; *p<0.05, Tukey-Kramer post hoc. (B) Double labeled confocal micrographs of control, DE and LRx visual cortex labeled with MMP biomarker (green) and marker for cortical axons (top: VGluT1; red) or thalamic axons (bottom: VGluT2; red). Scale bars: 20 μm (insets: 5 μm). Co-localization with VGluT2, but not VGluT1, is significantly increased by LRx. One-way ANOVA, F=0.95, p=0.41 for VGluT1 (n=6, 6, 7 subjects for Con, DE, LRx, respectively). F=16.16, p=0.0003 for VGluT2 (n=5, 5, 6 subjects for Con, DE, LRx, respectively). *p<0.05, Tukey-Kramer post hoc. (C) Increase in co-localization of MMP biomarker/VGluT2 with PV+ and PV- immunoreactive puncta following LRx (n=4 subjects each for Con and LRx). *p<0.005, Student’s T-test. All quantifications were performed 250 – 400 μm from the cortical surface in V1b.
-
Figure 3—source data 1
- https://doi.org/10.7554/eLife.27345.010
Figure 3—figure supplement 1

Expression of markers of reactive astrocytes (GFAP) and microglia (Iba1) inV1b following single cortical delivery of saline, MMP-9 biomarker, hyaluronidase and active MMP-9.
4 μl (total volume) was delivered at 100 nl/min with a Hamilton syringe attached to a Microsyringe Pump Controller (World Precision Instruments) through a cannula (2 mm projection, PlasticsOne) implanted 3–4 weeks prior to injection: saline, DQ gelatin (2 mg/ml), active rmMMP-9 (1 μg/ml), Hyl (200 U/ml). Scale bar: 100 μm. Cannula was implanted 500 μm medial and dorsal to V1b (not shown). Analyzed 24 hr after a single injection.
Figure 4
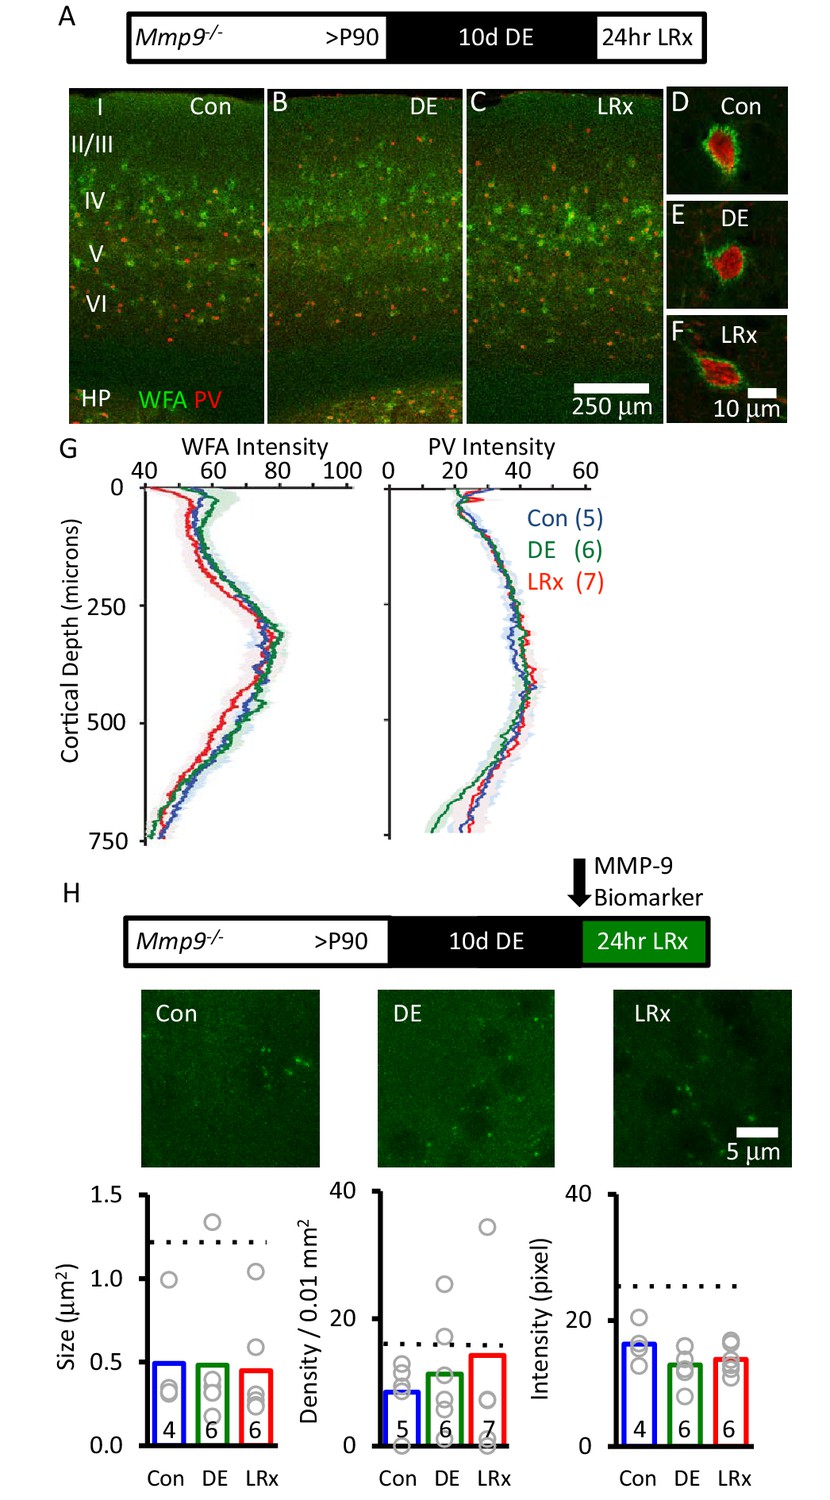
Absence of ECM degradation by light reintroduction in Mmp9−/− mice.
Top Inset: Experimental paradigm. Mmp9−/− mice (P90) raised in 12/12 hr light/dark cycle until postnatal day 90 (P90) received 10 days of dark exposure (DE) with subsequent reintroduction to light (1 day; LRx). (A-C) Low magnification (10X) double labeled images of binocular region of primary visual cortex with FITC-wisteria floribunda agglutinin (WFA; green) and Alexa-546 anti-parvalbumin antibody (PV; red) in normal reared control (A) following dark exposure (B) and following dark exposure/light reintroduction (C). Approximate locations of layer I to VI, and hippocampus (HP) are shown. (D-F) High magnification images (100X). (G) Quantification of mean fluorescence intensities for WFA (left) and PV (right) in maximal intensity projections (Z-stack 3 × 7.5 μm in an area 450 μm wide x 750 μm deep; spanning all cortical layers). Mean±SEM (n=5, 6, 7 subjects for Con, DE, LRx, respectively). One way ANOVA for WFA, F=0.21, p=0.81; for PV F=0.25, p=0.78. (H) Top: experimental paradigm. The MMP biomarker, dye-quenched gelatin (2 mg/ml), was delivered i.c. via cannula at the initiation of LRx. No change in MMP biomarker puncta size (n=4, 6, 6 subjects for Con, DE, LRx, respectively), density (n=5, 6, 7 subjects) or intensity (n=4, 6, 6 subjects) was observed following DE or LRx in Mmp9−/− mice. Dotted lines show values for the wild type controls presented in Figure 3. One-way ANOVA, F=0.02, p=0.98 for size F=1.92; p=0.724 for density; F=0.33; p=0.186 for intensity.
-
Figure 4—source data 1
- https://doi.org/10.7554/eLife.27345.012
Figure 5 with 2 supplements
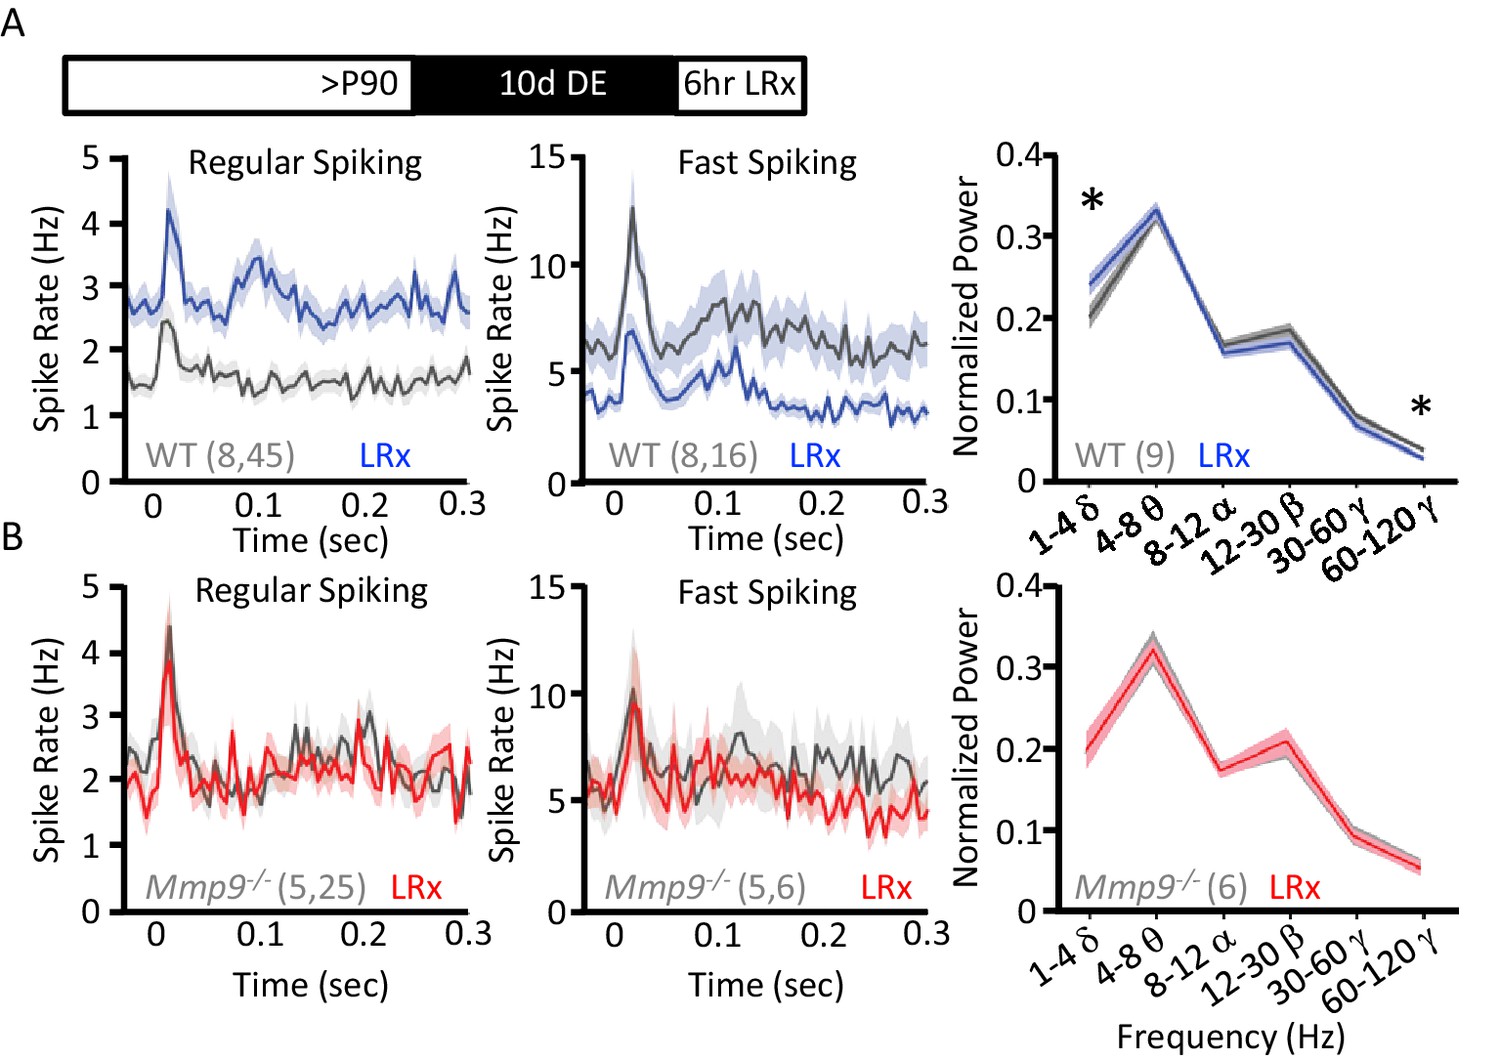
LRx regulates neuronal excitability and synchrony in WT but not Mmp9−/− mice.
(A) Inset: Experimental paradigm. 10 days of dark exposure, followed by LRx (6 hr) induced an increase in visually evoked activity of regular spiking neurons (RS; n=8 subjects, 45 units) and a decrease in evoked activity of fast spiking neurons (FS; n=8 subjects, 16 units) in WT mice. Post-stimulus time histograms (average ±SEM). 200 stimulus presentations of 100% contrast, 0.05 cycle per degree gratings, reversing at 1 Hz, stimulus onset = time 0 s. Right, Fourier transform of spontaneous LFP, normalized to within subject total power, and binned by frequency. In WT mice (n=9 subjects), LRx induces an increase in δ and a decrease in high γ power. (B) No change in regular spiking (n=5 subjects, 25 units) or fast-spiking (n=5 subjects, 6 units) visually evoked activity following LRx in Mmp9−/− mice. Post-stimulus time histograms (average ±SEM). 200 stimulus presentations of 100% contrast, 0.05 cycle per degree gratings, reversing at 1 Hz, stimulus onset = time 0 s). Right, no change in oscillatory activity following LRx in Mmp9−/− mice (n=6 subjects). *p<0.03; paired Student’s T-test.
-
Figure 5—source data 1
- https://doi.org/10.7554/eLife.27345.018
Figure 5—figure supplement 1
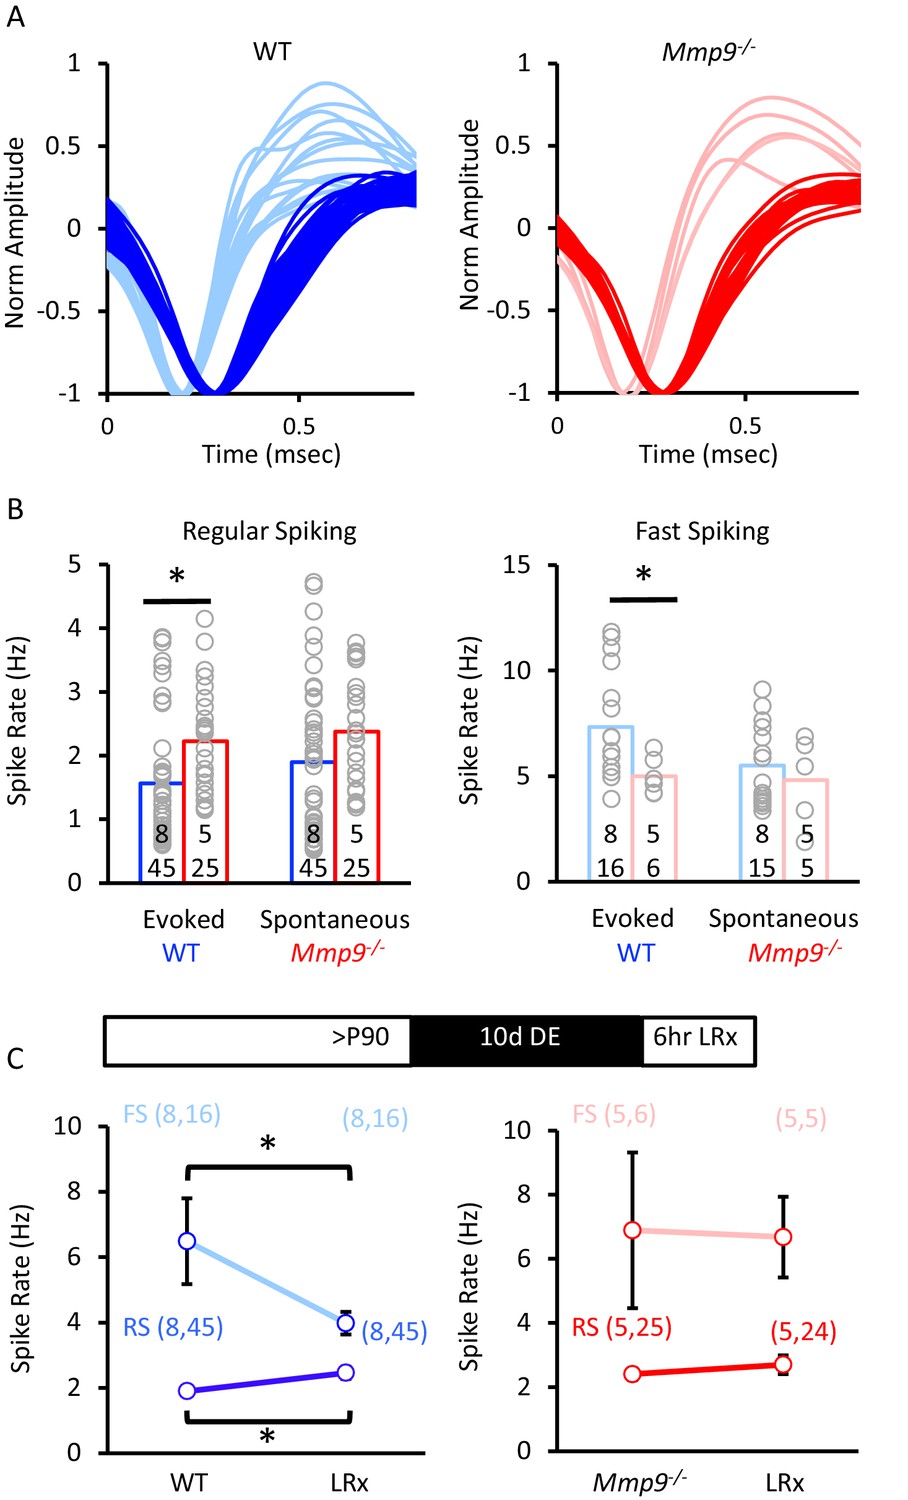
Change in neuronal excitability by LRx in WTs is absent in Mmp9−/− mice.
(A) Sorting of single units into two populations based on waveform characteristic in normal-reared WT (left, blue) and Mmp9−/− mice (right, red). (B) Single unit recordings of visually evoked and spontaneous regular spiking (left: WT blue, n=8 subjects, 45 evoked and 45 spontaneous units and Mmp9−/− red, n=5 subjects, 25 evoked and 25 spontaneous units) and fast spiking neurons (right: WT blue, n=8 subjects, 16 evoked units, 15 spontaneous units and Mmp9−/− red, n=5 subjects, 6 evoked units, 5 spontaneous units). (C) LRx changes mean spontaneous spike rates in WT (blue, n=45 RS, 16 FS in control; 45 RS, 16 FS LRx) but not Mmp9−/− (red, n=25 RS, 6 FS in control; 24 RS, 5 FS in LRx) mice. *p<0.05 unpaired Student’s T-test.
-
Figure 5—figure supplement 1—source data 1
- https://doi.org/10.7554/eLife.27345.016
Figure 5—figure supplement 2

Normal functional organization of Mmp9−/− mouse visual system.
(A) Representative examples of CSD distribution derived from visually-evoked LFP of WT (left) and Mmp9−/− mice (right). The distribution of current sinks/sources is similar across the two genotypes, although the layer 5 current source is stronger in WTs and current sources and sinks are prolonged in Mmp9−/− mice. (B) No difference in the time to peak VEP in WT versus Mmp9−/− mice, n=number of subjects, displayed in histogram. (C) Larger amplitude contralateral and ipsilateral eye VEPs (evoked with 0.05 cycle per degree 100% contrast grating, reversing at 1 Hz; *p<0.03, unpaired Student’s T-test) but no change in the contralateral bias index Mmp9−/− mice (CBI: contra-ipsi/contra + ipsi = WT: 0.28±0.03, Mmp9−/−: 0.29±0.02). (D) Similar variation of VEP amplitudes as a function of visual stimulus spatial frequency (log scale), presented at 50% contrast, in WT and Mmp9−/− mice. (E) Similar variation of VEP amplitudes as a function of visual stimulus contrast (log scale), presented at 0.02 cpd and 100% contrast, in WT and Mmp9−/− mice (WT n=11, Mmp9−/− n=10); n=subjects in parentheses.
-
Figure 5—figure supplement 2—source data 1
- https://doi.org/10.7554/eLife.27345.017
Figure 6
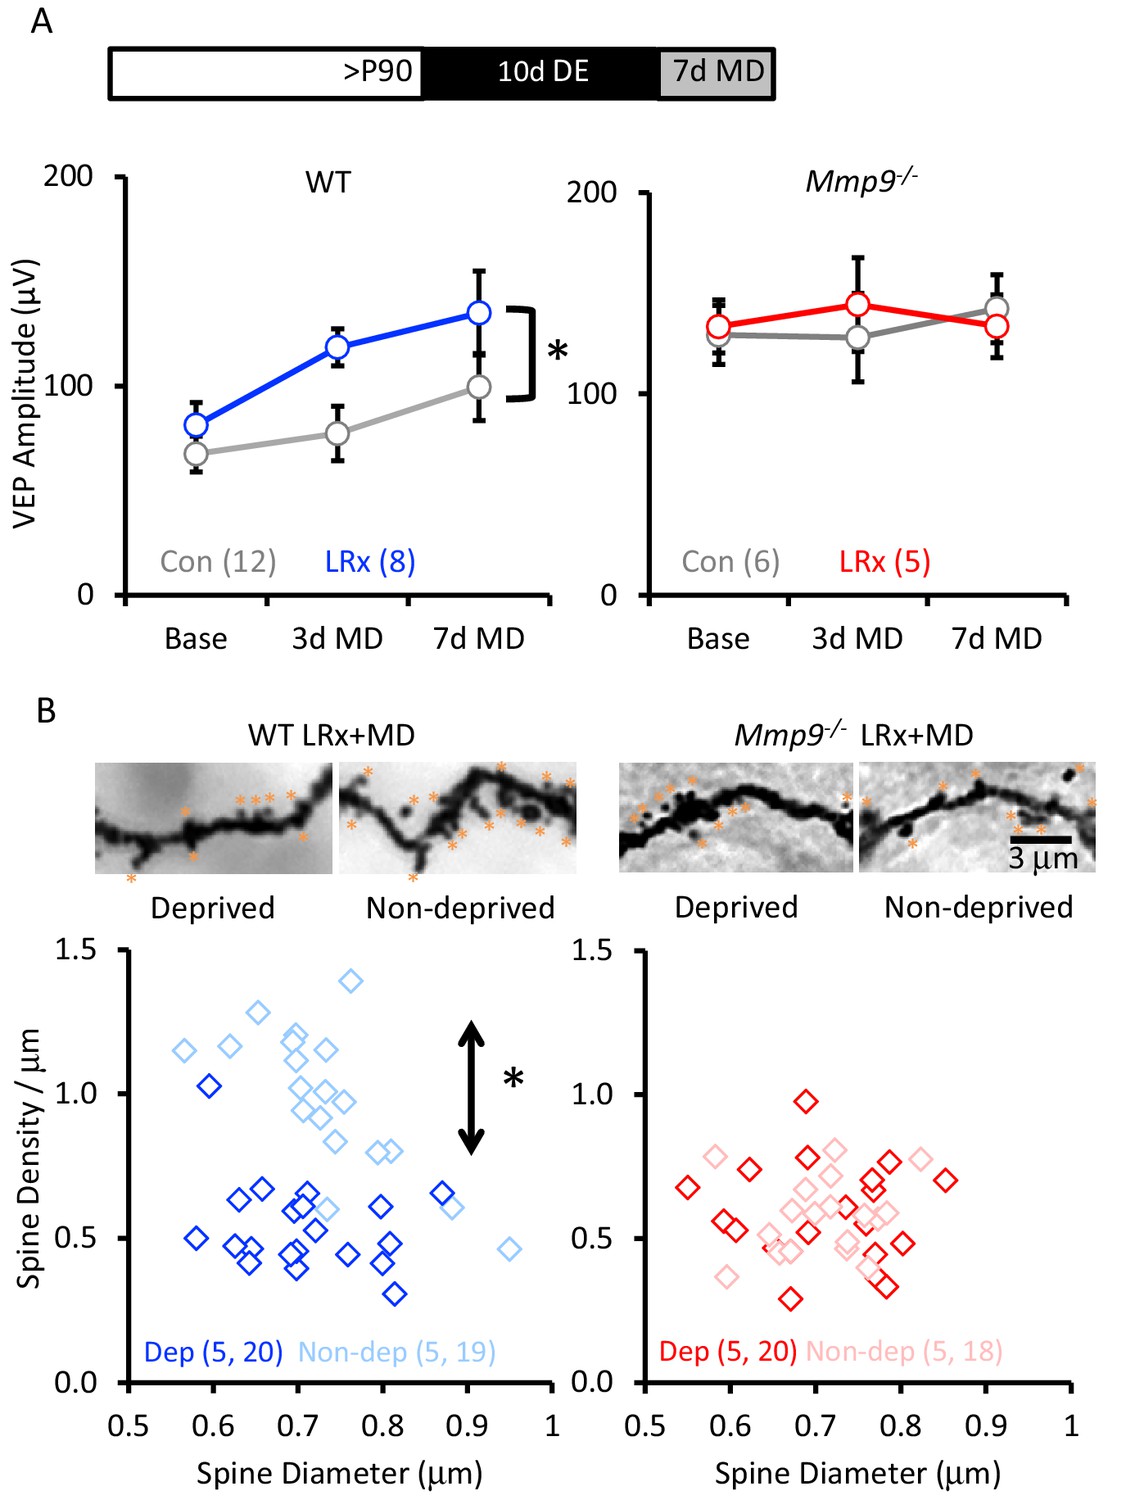
LRx reactivates structural and functional plasticity in visual cortex of adult WT, but not Mmp9−/− mice.
(A) Inset: Experimental paradigm. VEP amplitudes in response to presentation of visual stimuli (100% contrast gratings, 0.05 cycle per degree, reversing at 1 Hz) to non-deprived contralateral eye, prior to monocular dperivation (MD) and following 3 and 7 days of MD. LRx promotes significant enhancement of non-deprived eye VEP following MD in WT adults (left, n=12, 8 subjects for Con and LRx, respectively) but not Mmp9−/− mice (right, n=6, 5 subjects for Con and LRx, respectively). Between subjects repeated measures ANOVA, WT: F=6.33, *p=0.026; Mmp9−/−: F=0.020, p=0.890. (B) Top: Representative images of Golgi stained basolateral dendrites of layer 4 neurons in binocular region of primary visual cortex following 7 days of MD in WT LRx (left) and Mmp9−/− LRx (right) subjects. Significant difference in the distribution of spine densities in deprived versus non-deprived V1b following 7 days of MD in WT LRx but not Mmp9−/− mice. Spine densities and diameters of the basolateral dendrites of layer 4 neurons were measured 75 – 100 μm from soma, spines are labeled with orange asterisks. One-way ANOVA, F=24.9, p<0.0001. KS tests (deprived versus non-deprived) WT LRx+MD Diameter: p=0.37; Density: p<0.0001; Mmp9−/− LRx+MD: Diameter: p=0.62; Density: p=0.95; n=(subjects, neurons).
-
Figure 6—source data 1
- https://doi.org/10.7554/eLife.27345.020
Figure 7

Rescue of structural and functional plasticity in Mmp9−/− mouse by hyaluronidase.
(A) Hyaluronidase (Hyl, 4 μl of 200 U/ml at 100 nl/min) or vehicle was delivered i.c. via cannula at the initiation of LRx (1X/2 days for 7 days). Top: Reduction in WFA-FITC labeling following hyaluronidase treatment. Bottom: Reduction in aggrecan immunoreactivity following hyaluronidase treatment. (B) Reduction in WFA labelling following hyaluronidase treatment in Mmp9−/− mice compared to LRx in WT mice. WFA intensities was quantified 250 – 400 μm from cortical surface (WT Con: 100±14.3%, WT LRx: 48.8±5.3%, Mmp9−/− saline: 100.1±3.5%, Mmp9−/− Hyl: 47.8±2.6%, One-way ANOVA, F=12.7; p=0.0002, *p<0.01) n=subjects. (C) No change in the excitability of FS neurons from Mmp9−/− mice following hyaluronidase treatment (light red, n=6 subjects, 9 units; +Hyl n=6 subjects, 13 units) or RS (red, n=6 subjects, 19 units; +Hyl n=6 subjects, 14 units). (D) Hyluronidase-induced change in neuronal synchrony does not mimic the response to LRx in WTs (n=6 subjects, *p<0.03, paired Student’s T-test). Comparison of oscillatory activity in two cohorts of subjects that exhibit robust adult ocular dominance plasticity: WT+LRx (n=9 subjects) and Mmp9−/−+Hyl; *p<0.03, unpaired Student’s T-test. (E) Inset: Experimental paradigm. Hyaluronidase treatment (n=8 subjects; red) promotes significant enhancement of non-deprived eye VEP following monocular deprivation in adult Mmp9−/− mice (n=6 subjects; gray). Repeated measures ANOVA, F=16.668, p=0.001, Bonferroni post-hoc *p=0.001, Baseline versus 7d. MD alone, repeated measures ANOVA, F=0.446, p=0.655 (n.s.=not significant). (F) Representative images of Golgi stained basolateral dendrites of layer 4 neurons in V1bfollowing 7 days of MD in Mmp9−/−+Hyl subject. (G) Significant difference in distribution of spine densities and diameters in deprived versus non-deprived visual cortex following 7 days of MD in Mmp9−/−+Hyl mice, quantified 75 – 100 μm from soma). One-way ANOVA, F=6.6, p<0.0001. KS for diameter: p=0.0149; density: p<0.0001. n=(subjects, neurons).
-
Figure 7—source data 1
- https://doi.org/10.7554/eLife.27345.022
Additional files
-
Transparent reporting form
- https://doi.org/10.7554/eLife.27345.023
Download links
A two-part list of links to download the article, or parts of the article, in various formats.
Downloads (link to download the article as PDF)
Open citations (links to open the citations from this article in various online reference manager services)
Cite this article (links to download the citations from this article in formats compatible with various reference manager tools)
Light reintroduction after dark exposure reactivates plasticity in adults via perisynaptic activation of MMP-9
eLife 6:e27345.
https://doi.org/10.7554/eLife.27345


