Presynaptic LRP4 promotes synapse number and function of excitatory CNS neurons
- Thomas Jefferson University, United States
- Howard Hughes Medical Institute, Stanford University, United States
- Stanford University, United States
Figures
Figure 1 with 3 supplements
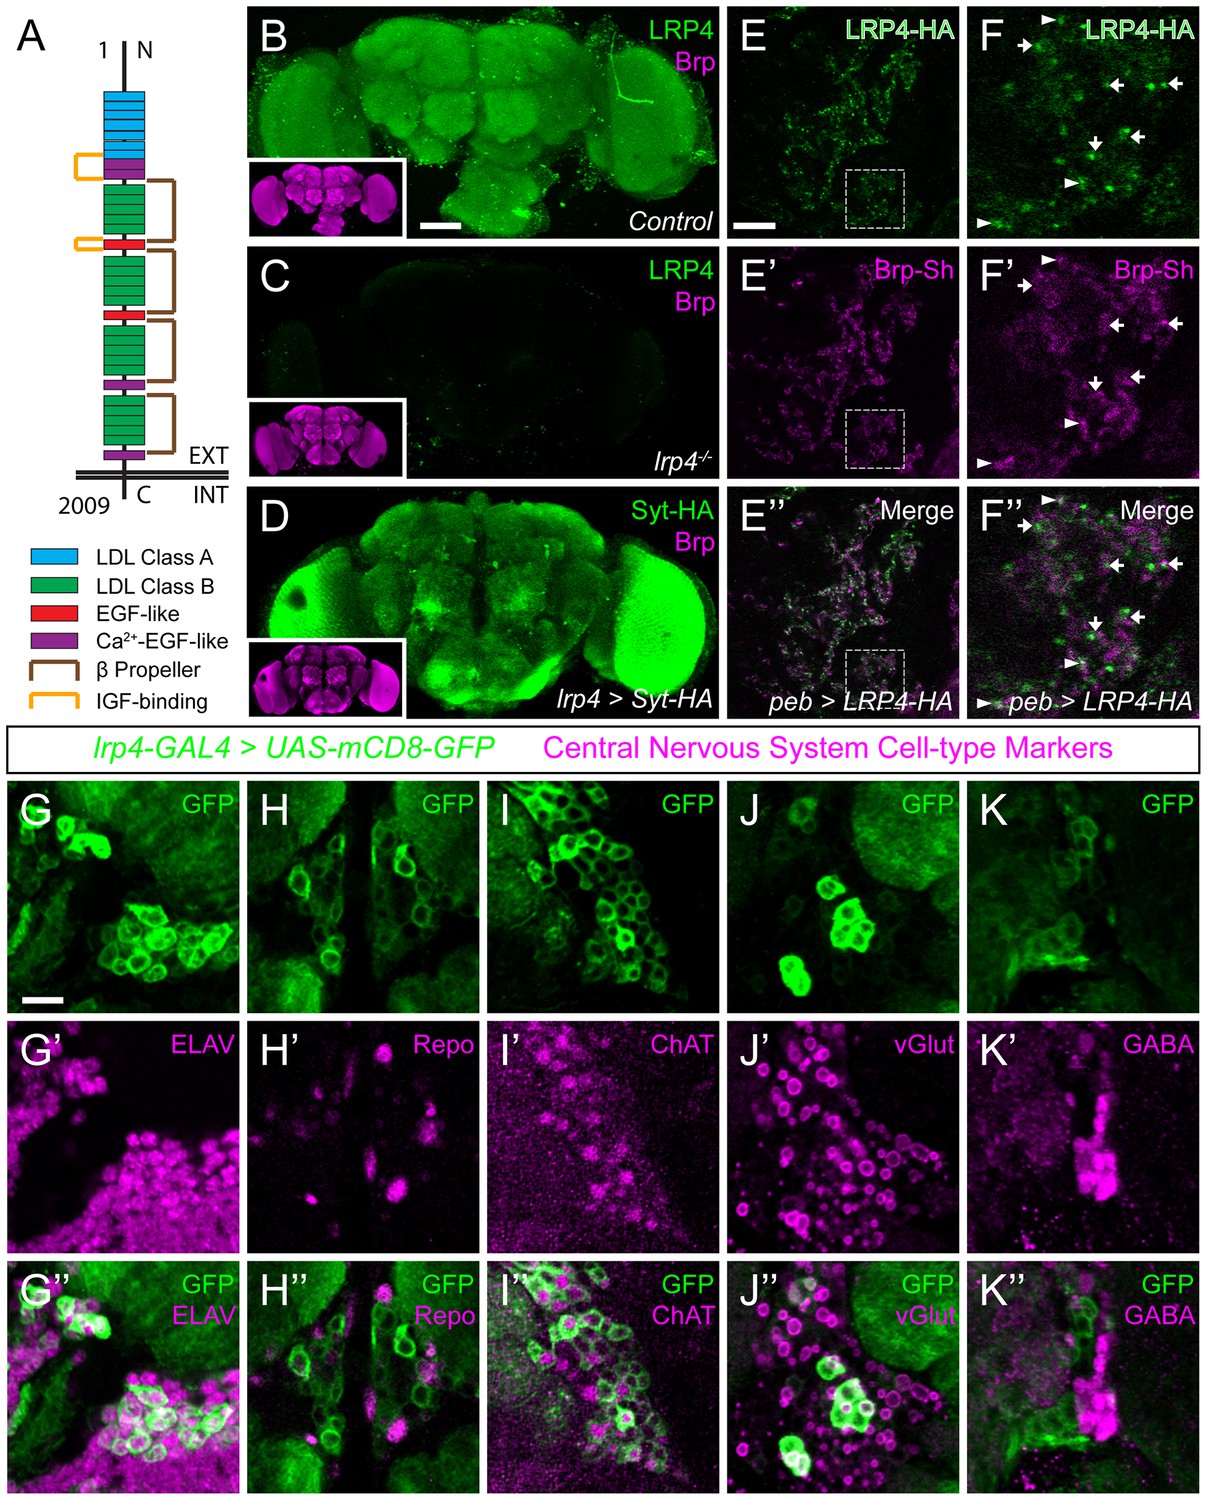
LRP4 is a synaptic protein expressed in excitatory neurons.
(A) Domain structure of Drosophila LRP4. Numbers indicate amino acids. EXT, extracellular side. INT, intracellular side. (B) Representative confocal image stack of a control Drosophila brain stained with antibodies against endogenous LRP4 (green) and Bruchpilot (inset, magenta) demonstrating expression throughout the brain. (C) Representative confocal image stack of an lrp4dalek null brain stained with antibodies against LRP4 (green) and Brp (inset, magenta) demonstrating antibody specificity. (D) Representative confocal image of a Drosophila brain expressing UAS-Syt-HA via lrp4-GAL4 and stained with antibodies to HA (D, green) and N-Cadherin (inset, magenta). The expression pattern resembles that of endogenous LRP4, supporting the specificity of lrp4-GAL4. (E) Representative single slice within a single antennal lobe glomerulus of a brain processed for expansion microscopy (proExM) expressing LRP4-HA and Brp-Short-mStraw in all ORNs via pebbled-GAL4 and stained with antibodies to HA (E, E”, green) and mStraw (E’-E”, magenta). LRP4 localizes to synaptic neuropil regions. (F) High magnification image of the region bounded by dashed lines in (E) and stained as above. Arrows indicate LRP4-HA localization adjacent to / not directly overlapping with Bruchpilot-Short. Arrowheads indicate overlapping LRP4-HA and Brp-Short localization. (G–K) Representative high magnification confocal stack images of neuronal cell bodies surrounding the antennal lobe in animals expressing UAS-mCD8-GFP via lrp4-GAL4 and stained for antibodies against GFP (G-K, green) and other cell-type markers (G’-K’, magenta). Merge channels (G’’–K’’) show colocalization of lrp4 with the neuronal marker ELAV (G’’) but not the glial cell marker Repo (H’’). Neurons positive for lrp4 show colocalization with choline acetyltransferase (ChAT, I’’), and the vesicular glutamate transporter (vGlut, J’’), but little to no colocalization with the inhibitory neurotransmitter GABA (K’’), suggesting that lrp4-positive cells are largely excitatory neurons. The percentage of GFP-positive cells that are ALSO positive for the cell-type specific marker are as follows: Elav = 99.50 ± 0.19% overlap; Repo = 0.38 ± 0.18% overlap; ChAT = 59.13 ± 2.48% overlap; vGlut = 22.38 ± 1.28% overlap; GABA = 0.25 ± 0.16% overlap. For all cases, n = 8 animals, ≥ 200 cells per animal. Values = mean ± s.e.m. Scale bars = 50 µm (B–D), 150 μm (B-D, insets), 25 μm (E–F), 10 μm (G–K).
Figure 1—figure supplement 1
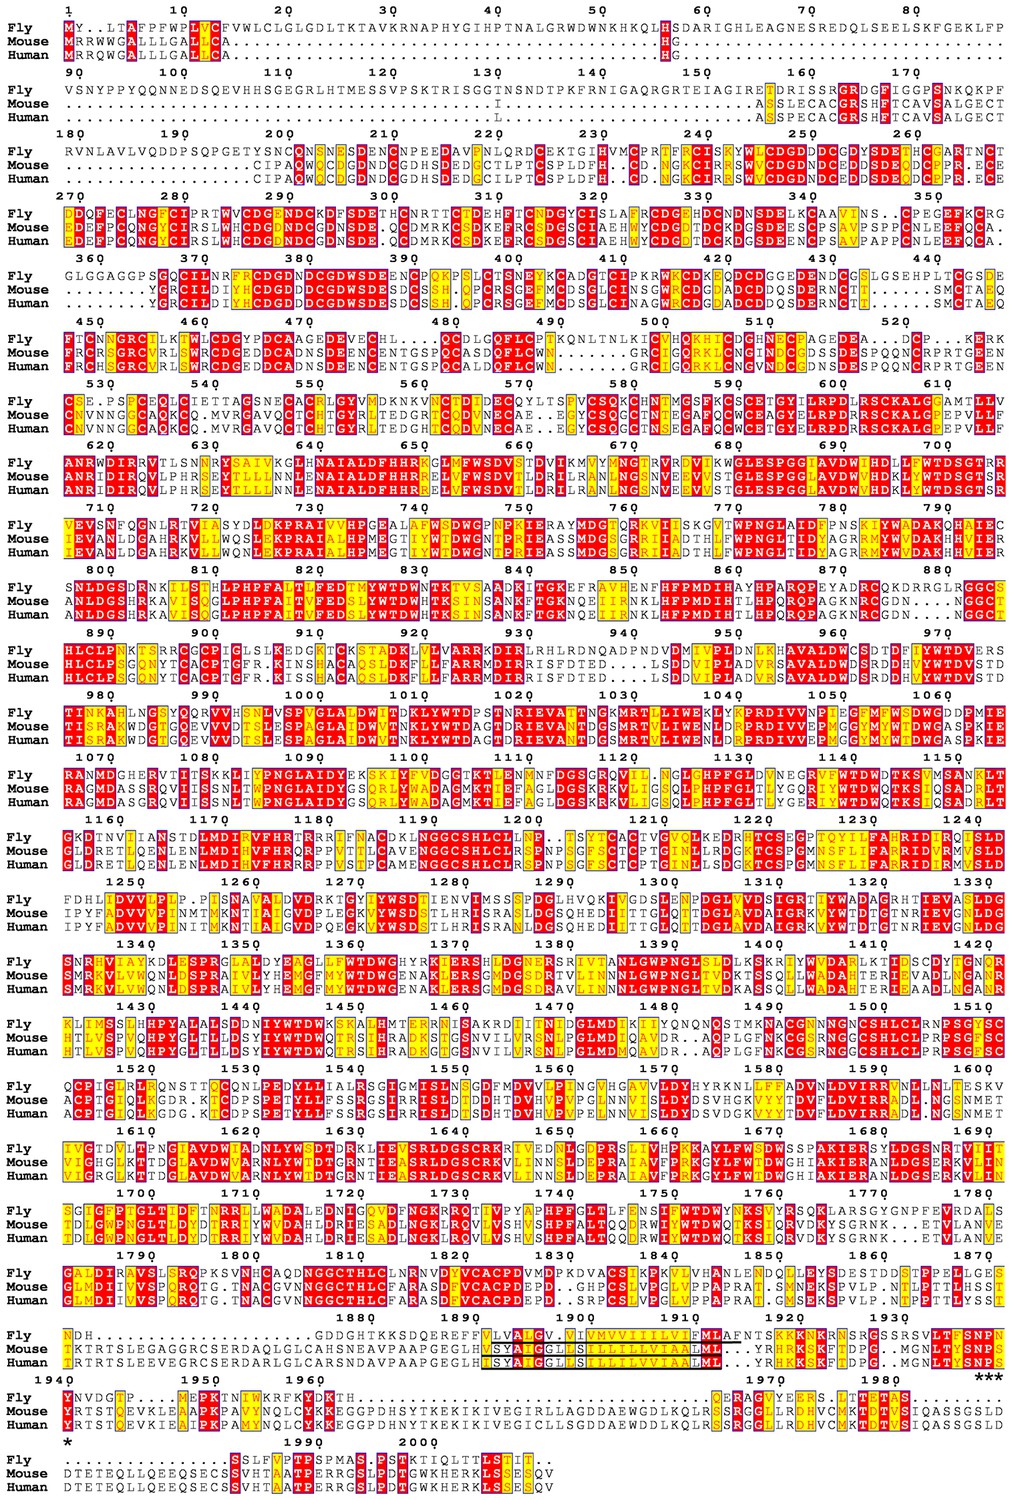
Sequence alignment of Drosophila, mouse, and human LRP4 homologues.
Multiple sequence alignment of Drosophila LRP4 (CG8909; accession AAF48538.1), Mus musculus LRP4 (accession NP_766256.3), and Homo sapiens LRP4 (accession NP_002325.2). Red shading = identical residues. Yellow shading = similar residues. The transmembrane domains are underlined. Considerable identity is seen throughout the extracellular side of the protein, and stretches of identity and similarity are also observed in the intracellular side. Asterisks denote a putative internalization signal, NPxY (Hussain, 2001), which is conserved on the intracellular side of all three species.
Figure 1—figure supplement 2
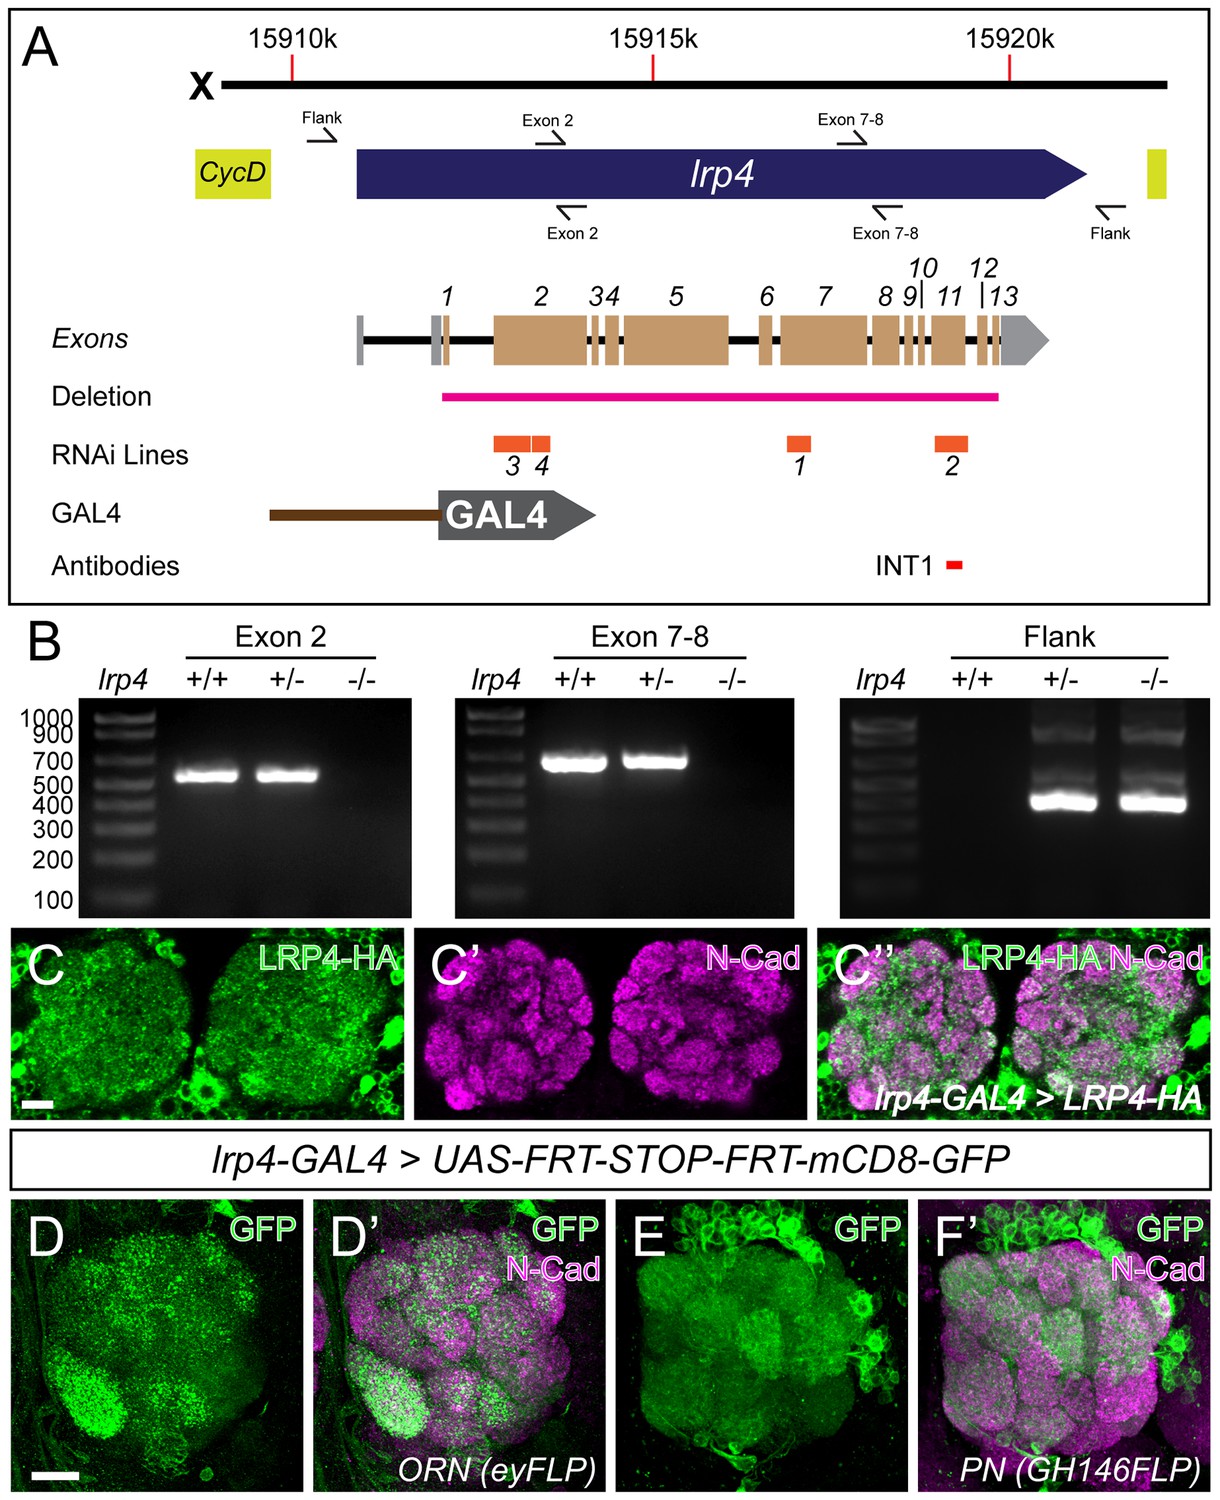
LRP4 reagents and patterns of LRP4 expression.
(A) Genomic region of lrp4. Top bar represents physical position on the X chromosome (in base pairs), and the blue arrow represents the lrp4 genomic region flanked by other genes (yellow). Primer sets are indicated by forward and reverse arrows (see B). The exon structure is displayed with 5’ and 3’ UTRs shaded in gray and coding exons numbered and shaded in beige. The region deleted by the lrp4dalek mutation is indicated in pink. RNAi targets are shown below in orange. The position of the GAL4 in the GMR90B08-GAL4 line is shown below and region of the protein against which antibodies were raised are noted below. (B) PCR analysis of genomic DNA from control and lrp4dalek adults. The presence of bands corresponding to Exon 2 and Exon 7–8 in control and heterozygous flies and their absence in lrp4dalek demonstrate loss of the coding region. The presence of a 315 bp band in heterozygous and homozygous lrp4dalek flies (Flank) but not in control is a result of non-homologous end joining of the 5’ and 3’ UTRs following deletion of the gene. (C) Representative confocal maximum intensity projections of the antennal lobe region of an lrp4-GAL4 animal expressing HA-tagged LRP4 and stained with antibodies to HA (C, C’’, green) and N-Cadherin (C’-C’’, magenta). LRP4-HA localizes to regions of synaptic neuropil, similar to endogenous staining (Figure 1). (D–E) Representative confocal maximum intensity projections of antennal lobes in animals expressing UAS-FRT-Stop-FRT-mCD8-GFP using lrp4-GAL4 but where FLP expression (removing the stop codon) is restricted to either ORNs using eyFLP (D) or PNs using GH146-FLP (E) and stained with antibodies to GFP (green) and N-Cadherin (magenta). Intersectional analysis reveals lrp4 expression in both ORNs as well as PNs. Scale bars = 10 µm (C), 5 μm (D–E).
Figure 1—figure supplement 3
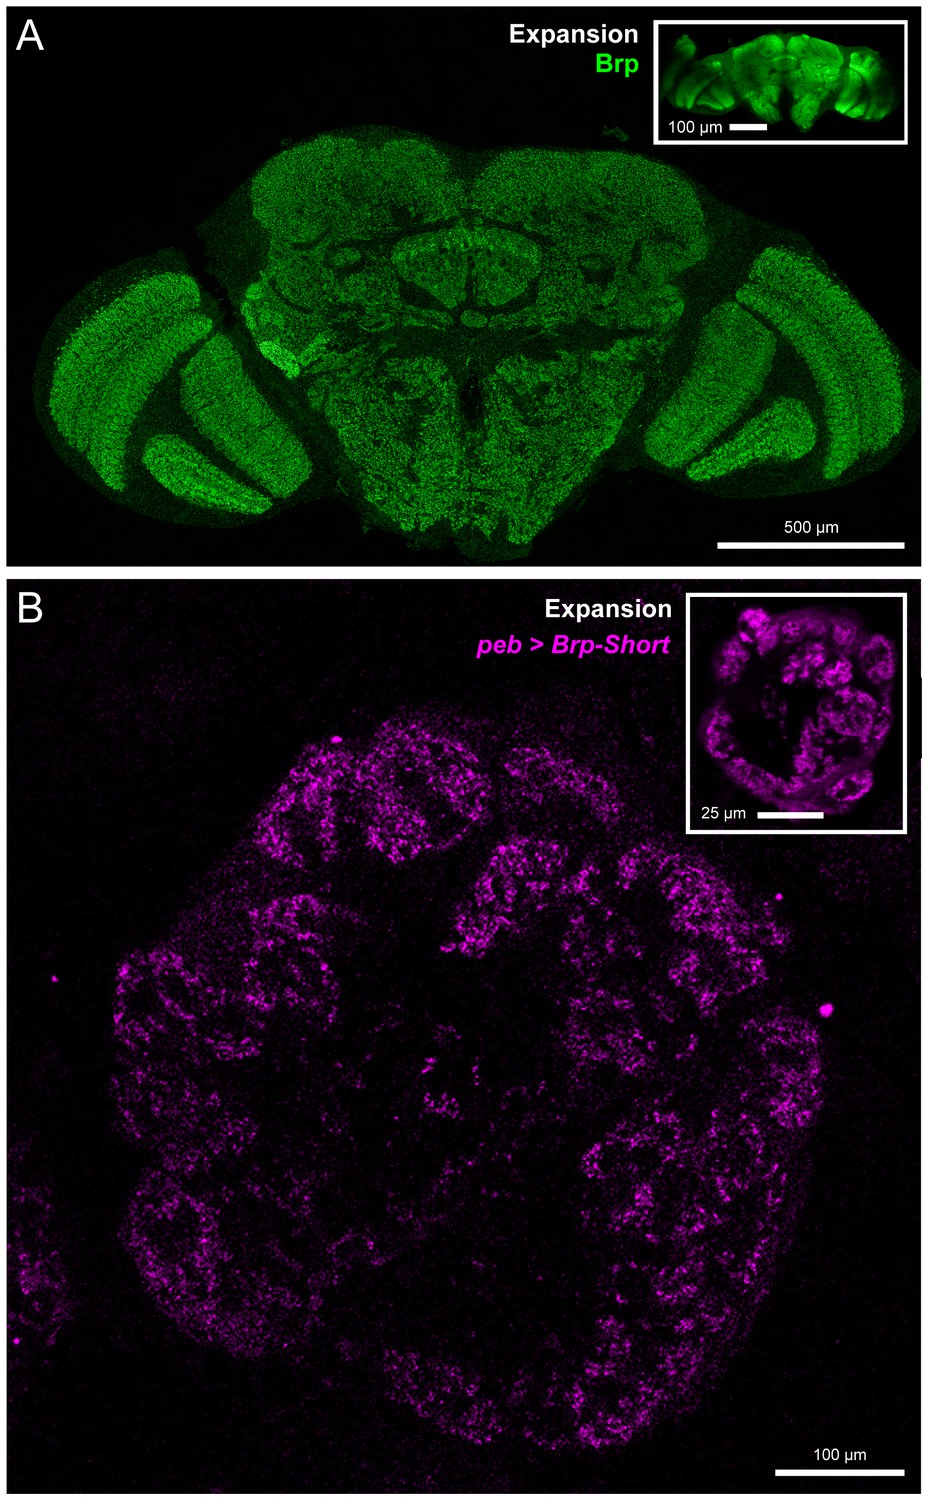
Validation of expansion microscopy in Drosophila.
(A) A representative Drosophila brain stained with antibodies against endogenous Brp (green) and processed for proExM. Organization of the fly brain is maintained as are identifiable landmarks. (inset) Unexpanded brain stained with antibodies against Brp, shown at the same scale as the expanded brain. Individual Brp puncta are resolvable in the expanded brain but not in the unexpanded brain. (B) A representative antennal lobe in a Drosophila brain expressing Brp-Short-mStraw (magenta) in all ORNs using the pebbled-GAL4 driver and stained with antibodies against mStraw (magenta). Following proExM processing, glomerular structure and fine synaptic detail are still present. (inset) An equivalent single section from a different brain of the same genotype. In all cases, note the 4–5 fold isotropic expansion of tissue allowing for enhanced resolution while still using confocal microscopy. Scale bars as indicated.
Figure 2 with 4 supplements
LRP4 perturbation in excitatory neurons alters synapse number.
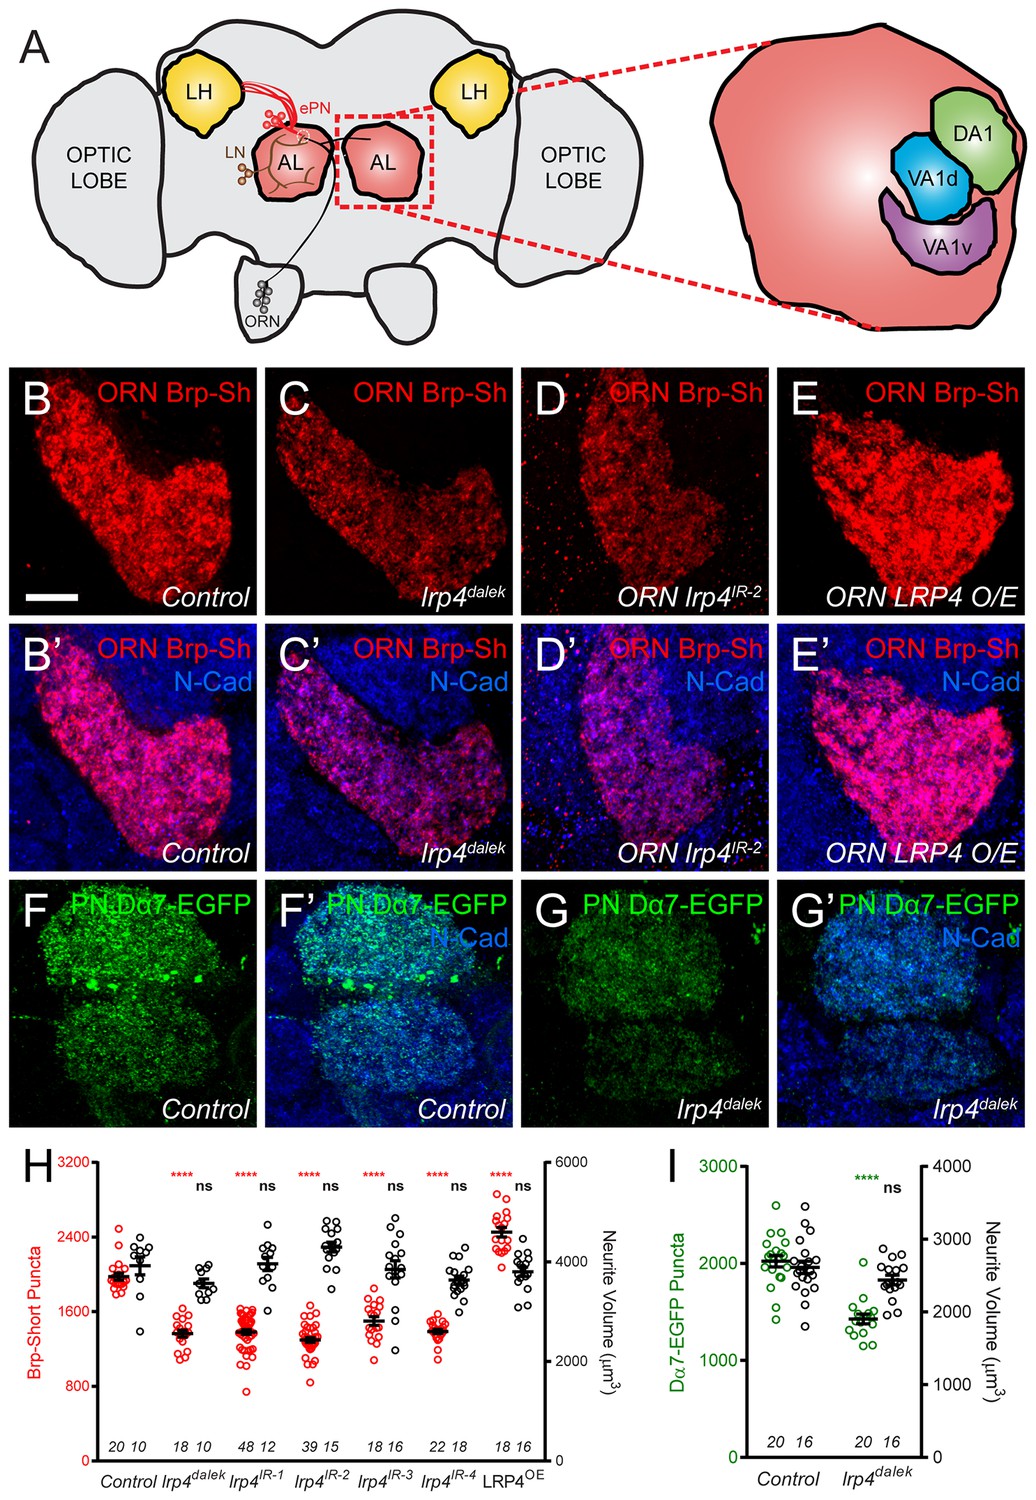
(A) Schematic diagram of the fly brain with major regions labeled and the olfactory regions examined in this study shaded in red (AL, antennal lobe) or yellow (LH, the lateral horn). Olfactory receptor neurons (ORNs, black), excitatory projection neurons (ePNs, red), and local interneurons (LNs, brown) are indicated. White dashed lines represent a glomerulus. Magnification: the antennal lobe region with the three glomeruli examined here highlighted: DA1 (green), VA1d (blue), and VA1v (purple). (B–E) Representative high magnification confocal stack images of VA1v ORN axon terminals in the VA1v glomerulus of males expressing Brp-Short-mStraw and stained with antibodies against mStraw (red) and N-Cadherin (blue). Loss of lrp4 (lrp4dalek) and RNAi against lrp4 expressed only in ORNs (ORN lrp4IR-2) show fewer Brp-Short-mStraw puncta while LRP4 overexpression in ORNs (ORN LRP4 OE) increases the number of Brp-Short-mStraw puncta. (F–G) Representative high magnification confocal maximum intensity projections of DA1 and VA1d PN dendrites in males expressing Dα7-EGFP, a tagged acetylcholine receptor subunit. Loss of lrp4 (lrp4dalek) also results in fewer Dα7-EGFP puncta. (H) Quantification of Brp-Short-mStraw puncta (red, left axis) and neurite volume (black, right axis) in VA1v ORNs. (I) Quantification of Dα7-EGFP puncta (green, left axis) and neurite volume (black, right axis). ****p<0.0001; ***p<0.001; ns, not significant. Statistical comparisons in 2H (one-way ANOVA with correction for multiple comparisons) are with control. Statistical comparisons between two samples are done via Student’s t-test. Error bars represent mean ± s.e.m. n (antennal lobes) is noted at the bottom of each column. Scale bars = 10 µm.
Figure 2—figure supplement 1
Representative antennal lobe images for genetic lrp4 manipulations.
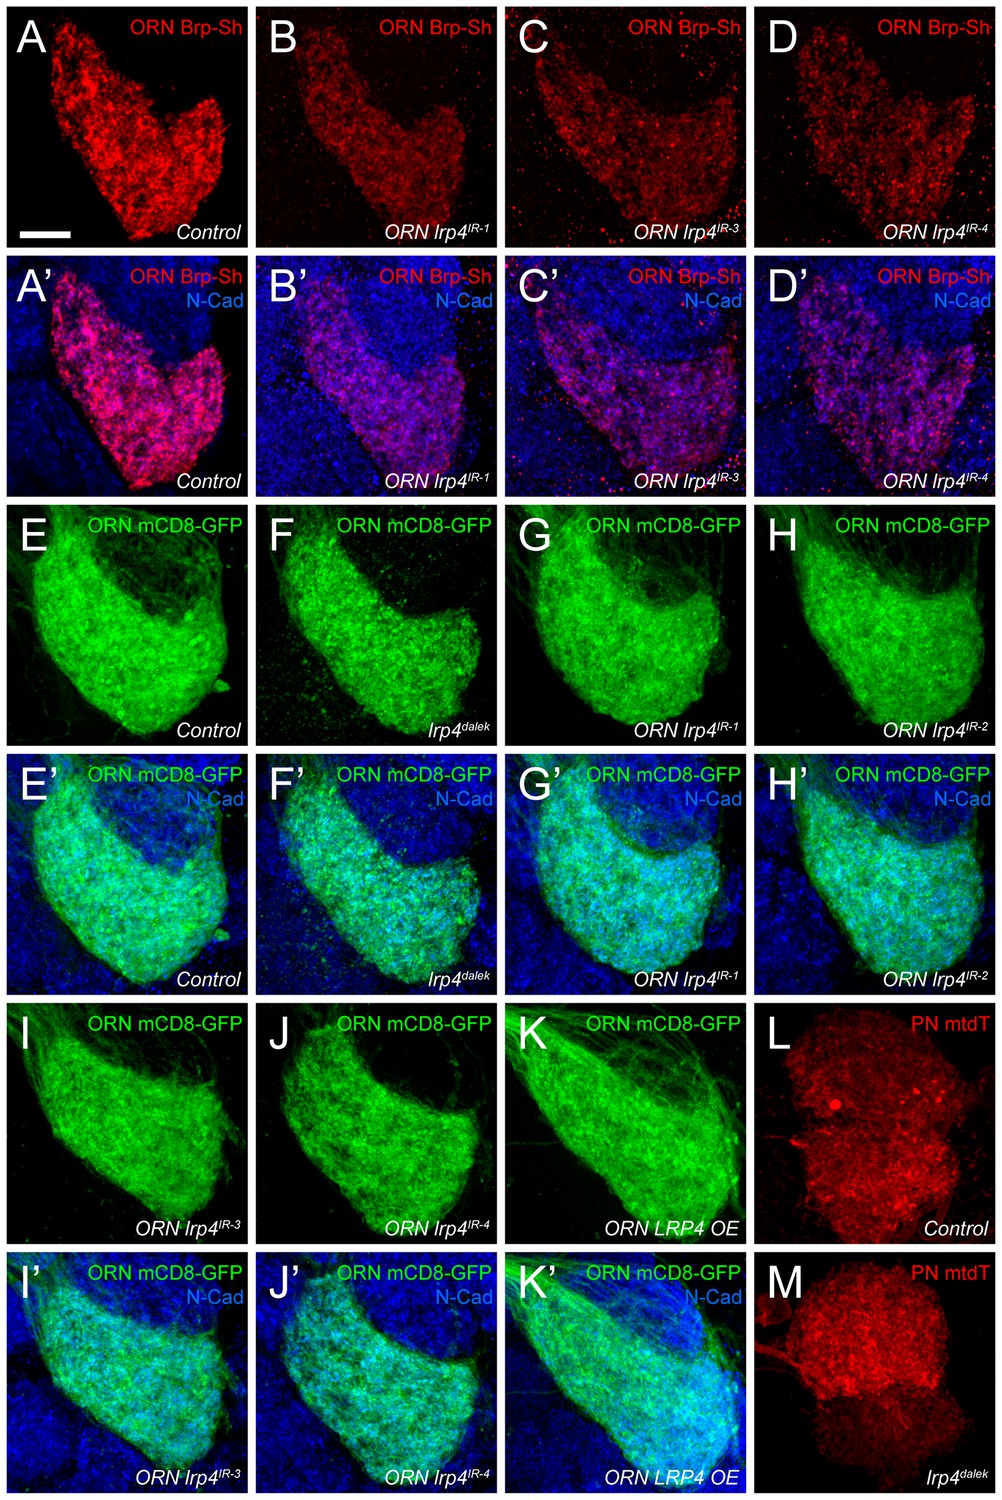
(A–D) Representative high magnification confocal maximum intensity projections of VA1v ORN axon terminals in males expressing Brp-Short-mStraw and stained with antibodies against mStraw (red) and N-Cadherin (blue). Loss of lrp4 using independent RNAi transgenes expressed only in ORNs all result in fewer Brp-Short-mStraw puncta. (E–K) Representative high magnification confocal maximum intensity projections of VA1v ORN axon terminals in males expressing mCD8-GFP and stained with antibodies against GFP (green) and N-Cadherin (blue). mCD8-GFP staining (and thus, neurite volume) is unchanged by loss of lrp4 via null mutation (F, lrp4dalek) or ORN expressed RNAi (G-J, ORN lrp4IR1-4), or LRP4 overexpression (K, ORN LRP4 OE). (L–M) Representative high magnification confocal stack images of DA1 and VA1d PN dendrites expressing membrane-tagged tdTomato (mtdT) and stained with antibodies against tdTomato (red). Loss of lrp4 (M) does not affect neurite volume as measured by surface rendering of tdTomato staining. Scale bars = 10 µm.
Figure 2—figure supplement 2
lrp4 perturbation in females affects synapse number.
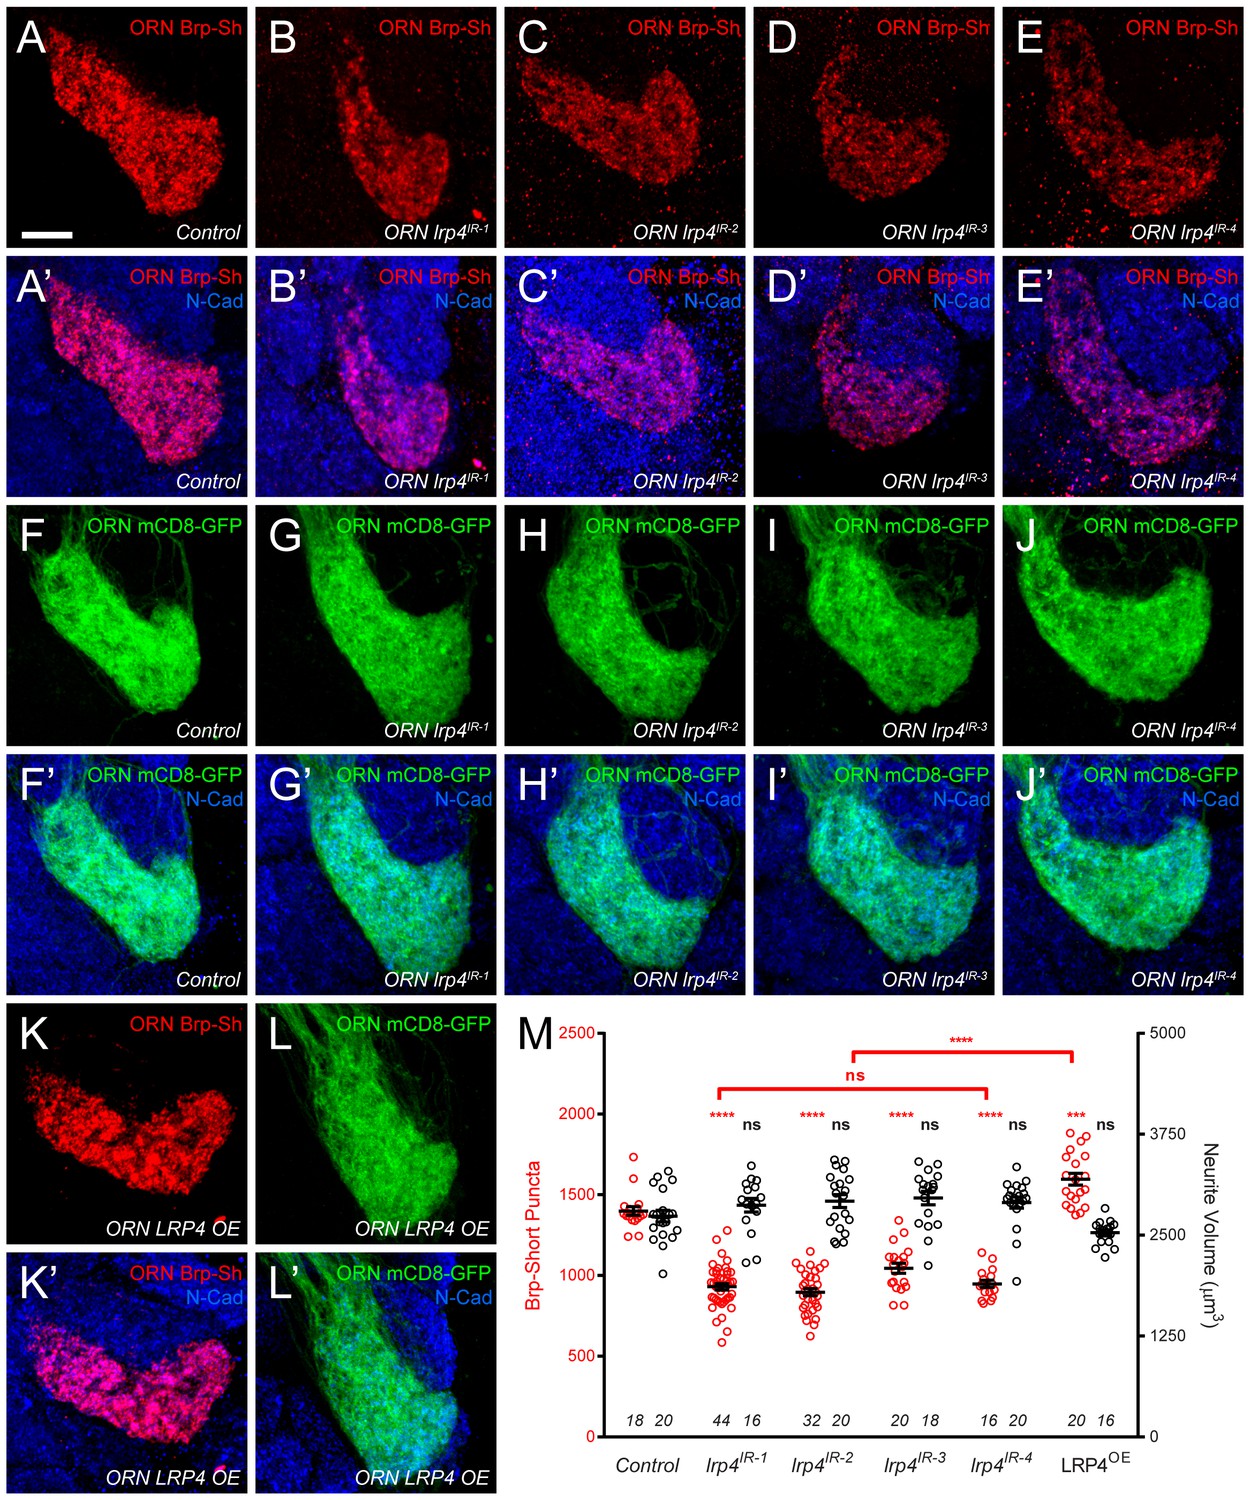
(A–E) Representative high magnification confocal maximum intensity projections of VA1v ORN axon terminals in females expressing Brp-Short-mStraw and stained with antibodies against mStraw (red) and N-Cadherin (blue). Loss of lrp4 using independent RNAi transgenes expressed in ORNs (b-e, ORN lrp4IR-1-4) result in fewer Brp-Short-mStraw puncta. Note that VA1v is sexually dimorphic in size and synapse number (Mosca and Luo, 2014; Stockinger et al., 2005) hence we examined males and females separately. (F–J) Representative high magnification confocal maximum intensity projections of VA1v ORN axon terminals in females expressing mCD8-GFP and stained with antibodies against GFP (green) and N-Cadherin (blue). In all cases, mCD8-GFP staining is unaffected by lrp4 loss. (K–L) Representative high magnification confocal maximum intensity projection of VA1v ORNs in females expressing Brp-Short-mStraw (K) or mCD8-GFP (L) while concomitantly overexpressing LRP4 and stained with antibodies against mStraw (K, red) or GFP (L, green) and N-Cadherin (blue). LRP4 overexpression increases Brp-Short-mStraw puncta number without affecting mCD8-GFP staining. (M) Quantification of Brp-Short-puncta (red, left axis) and neurite volume (black, right axis) in ORNs. In both cases, n (antennal lobes) is noted at the bottom of each column. **** p<0.0001; ns, not significant. Statistical comparisons (one-way ANOVA corrected for multiple comparisons) are with control unless noted. Error bars represent mean ± s.e.m. n (antennal lobes) is noted at the bottom of each column. Scale bars = 10 µm.
Figure 2—figure supplement 3
lrp4 RNAi reduces synapse number in multiple glomeruli.
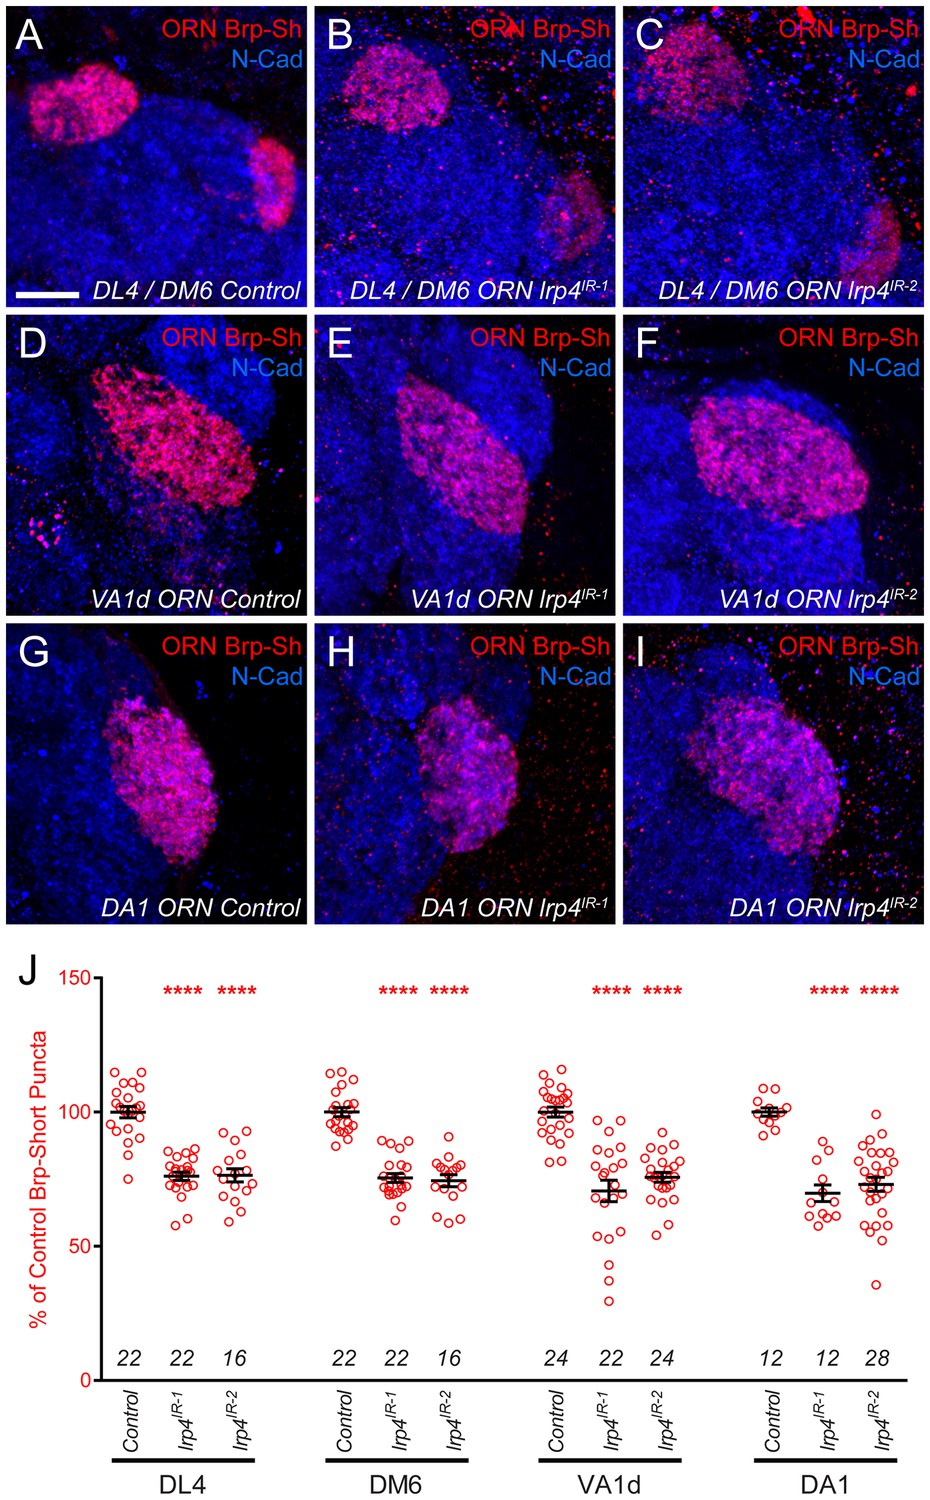
(A–I) Representative high magnification confocal maximum intensity projections of ORN axon terminals in males expressing Brp-Short-mStraw (red) projecting to the DL4 and DM6 (A–C), VA1d (D–F), or DA1 glomeruli (G–I) and stained with antibodies to mStraw (red) and N-Cadherin (blue). RNAi-mediated knockdown of lrp4 reduces Brp-Short puncta number in multiple glomeruli (B–C,E–F,H–I) demonstrating that lrp4 generally affects synapse number in olfactory glomeruli and is not restricted to the VA1v ORNs. (J) Quantification of Brp-Short-mStraw puncta expressed as a percentage of control puncta for different glomeruli. For all glomeruli, a similar reduction in puncta number was observed. ****p<0.0001. Statistical comparisons (one-way ANOVA with correction for multiple comparisons) are with control. Error bars represent mean ± s.e.m. n (antennal lobes) is noted at the bottom of each column. Scale bars = 10 μm.
Figure 2—figure supplement 4
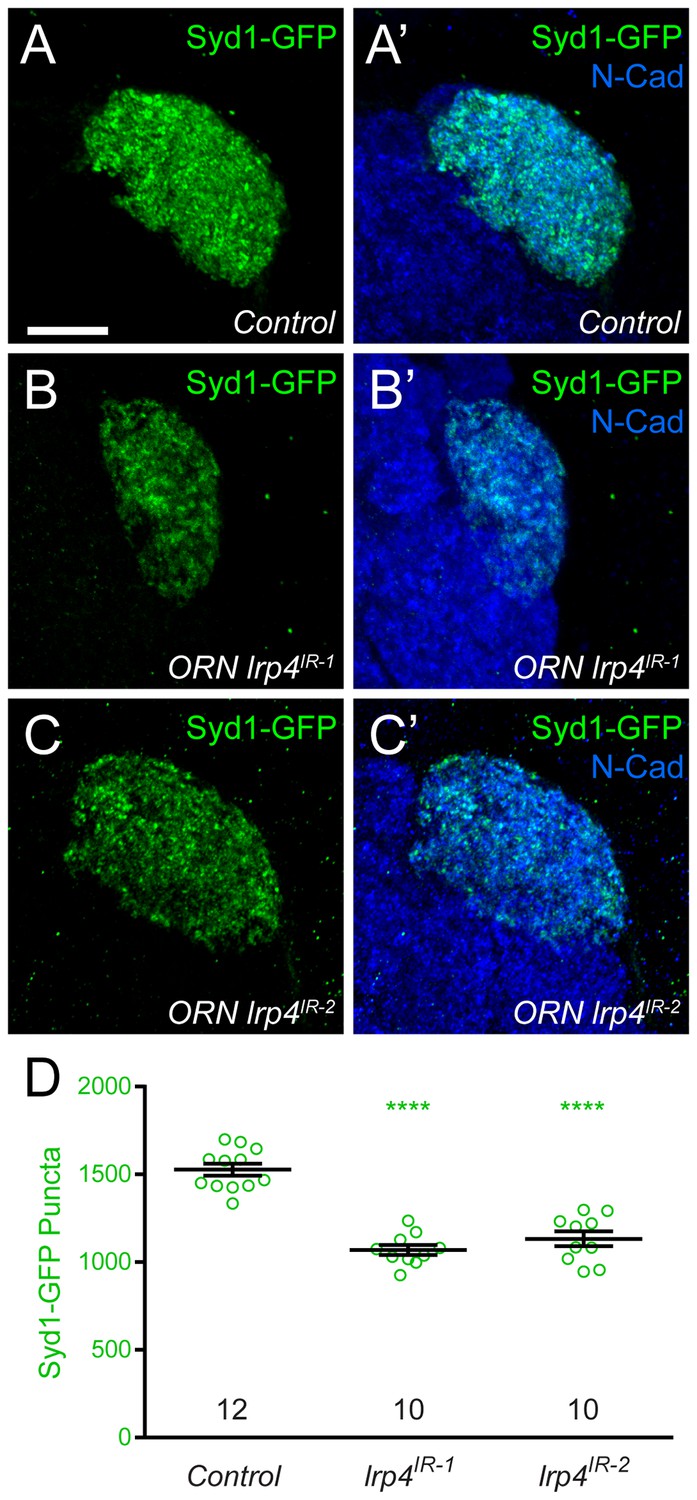
lrp4 RNAi reduces Syd1 puncta in presynaptic ORN terminals.
(A–C) Representative high magnification confocal maximum intensity projections of DA1 ORN axon terminals in males expressing DSyd1-GFP and stained with antibodies to GFP (green) and N-Cadherin (blue). Presynaptic knockdown of lrp4 (B, lrp4IR-1; C, lrp4IR-2) reduces the number of DSyd1-GFP puncta when compared to Control (A). (D) Quantification of DSyd1-GFP puncta. ****p<0.0001. Statistical comparisons (one-way ANOVA corrected for multiple comparisons) are with control unless noted. Error bars represent mean ± s.e.m. n (antennal lobes) is noted at the bottom of each column. Scale bars = 10 µm.
Figure 3
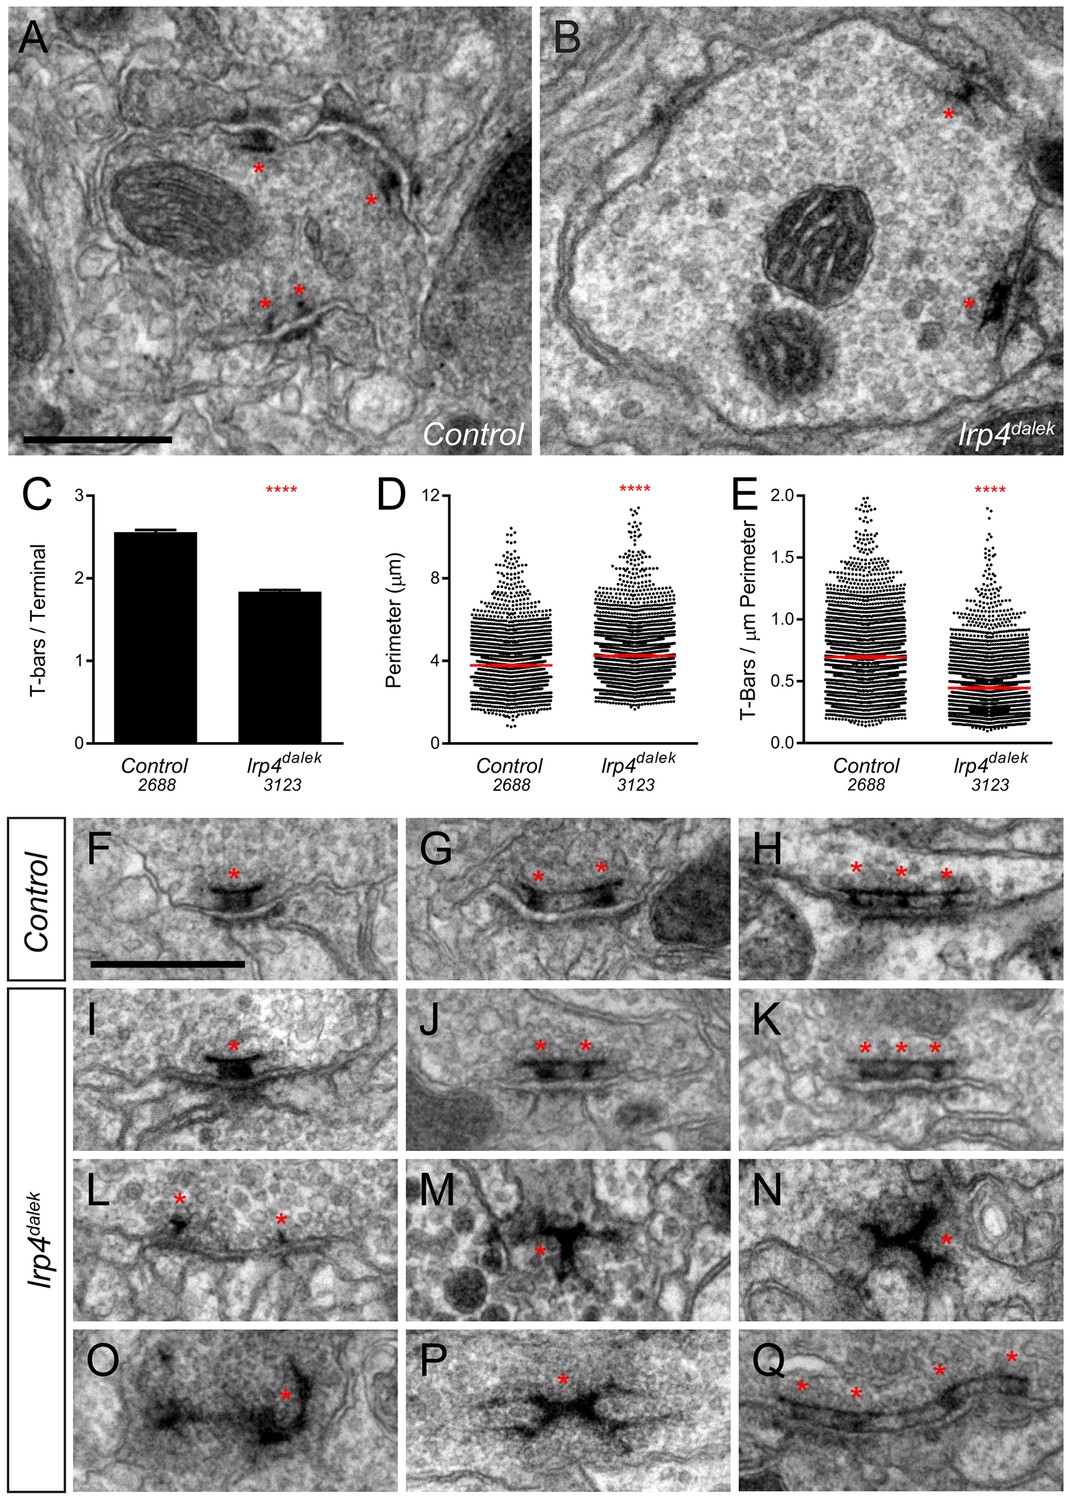
Loss of LRP4 causes defects in T-bar number and morphology.
(A–B) Representative transmission electron micrographs of putative ORN terminal in Control (A) and lrp4dalek (B) adult antennal lobes. Loss of lrp4 results in fewer observed T-bar profiles (asterisk) and a larger terminal perimeter. Scale bar = 1 µm. (C) Quantification of T-bar profiles per terminal in Control and lrp4dalek terminals. Loss of LRP4 results in a 31% reduction of T-bars. (D) Quantification of terminal perimeter in Control and lrp4dalek adults. Mutant terminals have a 13% greater perimeter than control terminals. (E) Quantification of the T-bar density per µm of terminal perimeter. Loss of LRP4 causes a 36% reduction in T-bar density when the increased terminal perimeter is accounted for. For (C–E), Control has n = 5 animals, 2688 terminals and lrp4dalek has n = 3 animals, 3123 terminals. The number of terminals measured is listed below the genotype. ****p<0.0001. Statistical comparisons (two-tailed Student’s t-test) are done between genotypes. Error bars represent mean ± s.e.m. (F–H) Representative transmission electron micrographs of individual T-bar profiles (asterisk) in control adults. Single (F), double (G), and triple (H) profiles are readily visible. (I–Q) Representative transmission electron micrographs of individual T-bar profiles in lrp4dalek adults. As in control flies, single (I), double (J) and triple (K) T-bar profiles were visible. The majority of T-bars, however, demonstrated morphology defects including those that lacked table tops (L), were detached from the membrane (M–N), were misshapen (N–P), and profiles containing four or more connected T-bars (Q). These all represent morphological defects that are not observed (or very rarely observed) in control adults. Scale bar = 200 nm.
Figure 4
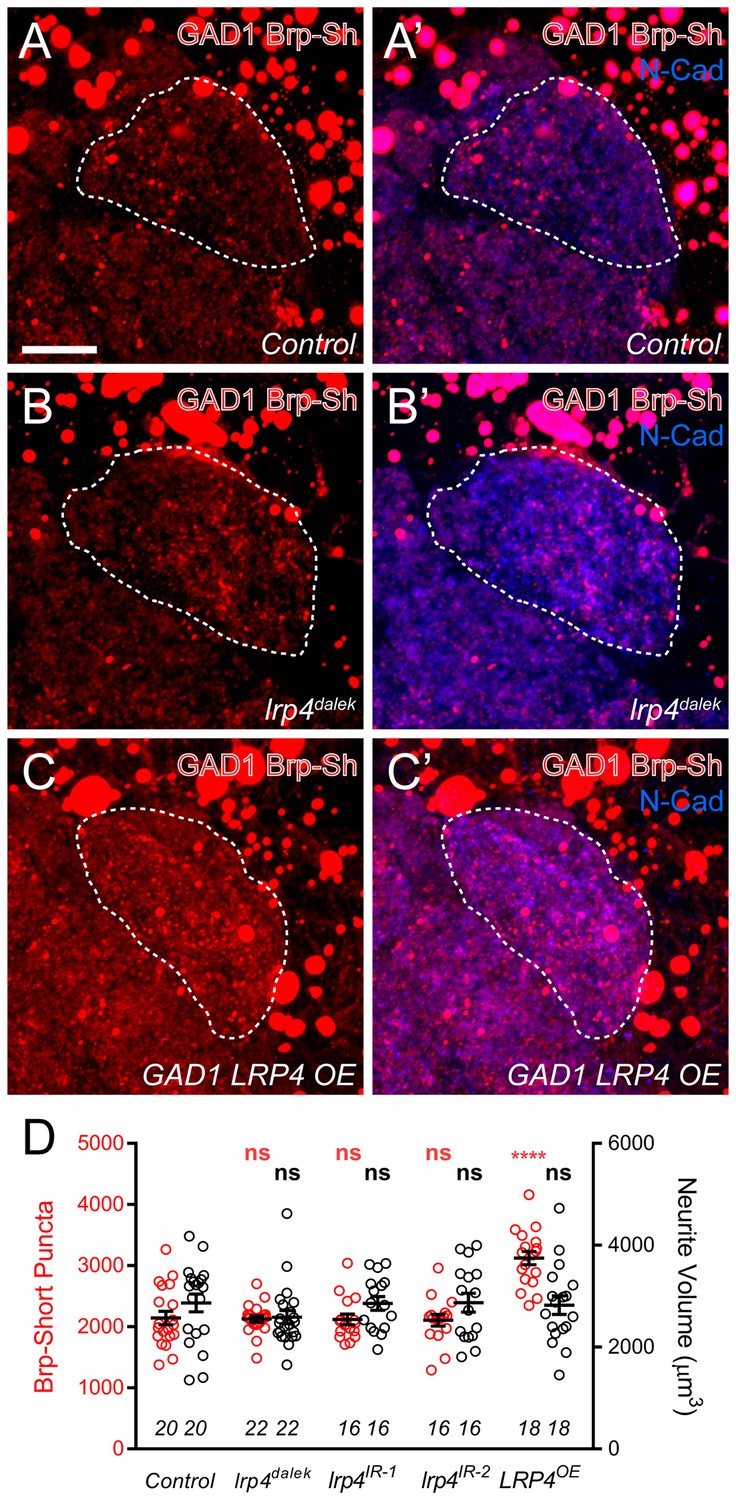
Effects of LRP4 perturbation on inhibitory neuron synapse formation.
(A–C) Representative high magnification confocal maximum intensity projections of GAD1-positive inhibitory neurons, which project to the DA1 glomerulus (dashed line), in males expressing Brp-Short-mStraw and stained with antibodies against mStraw (red) and N-Cadherin (blue). Due to the proximity of inhibitory neuron cell bodies to the antennal lobe, saturated somatic signal is observed. Loss of lrp4 (lrp4dalek) does not affect puncta number but overexpression of LRP4 (GAD1 LRP4 OE) increases Brp-Short puncta. (D) Quantification of Brp-Short-mStraw puncta (red, left axis) and neurite volume (black, right axis) in GAD1 neurons. Neither loss of lrp4 nor RNAi against lrp4 expressed in inhibitory neurons affects puncta number or neurite volume. ****p<0.0001; ***p<0.001; ns, not significant. Statistical comparisons (one-way ANOVA with correction for multiple comparisons) are with control. Error bars represent mean ± s.e.m. n (antennal lobes) is noted at the bottom of each column. Scale bars = 10 µm.
Figure 5 with 1 supplement
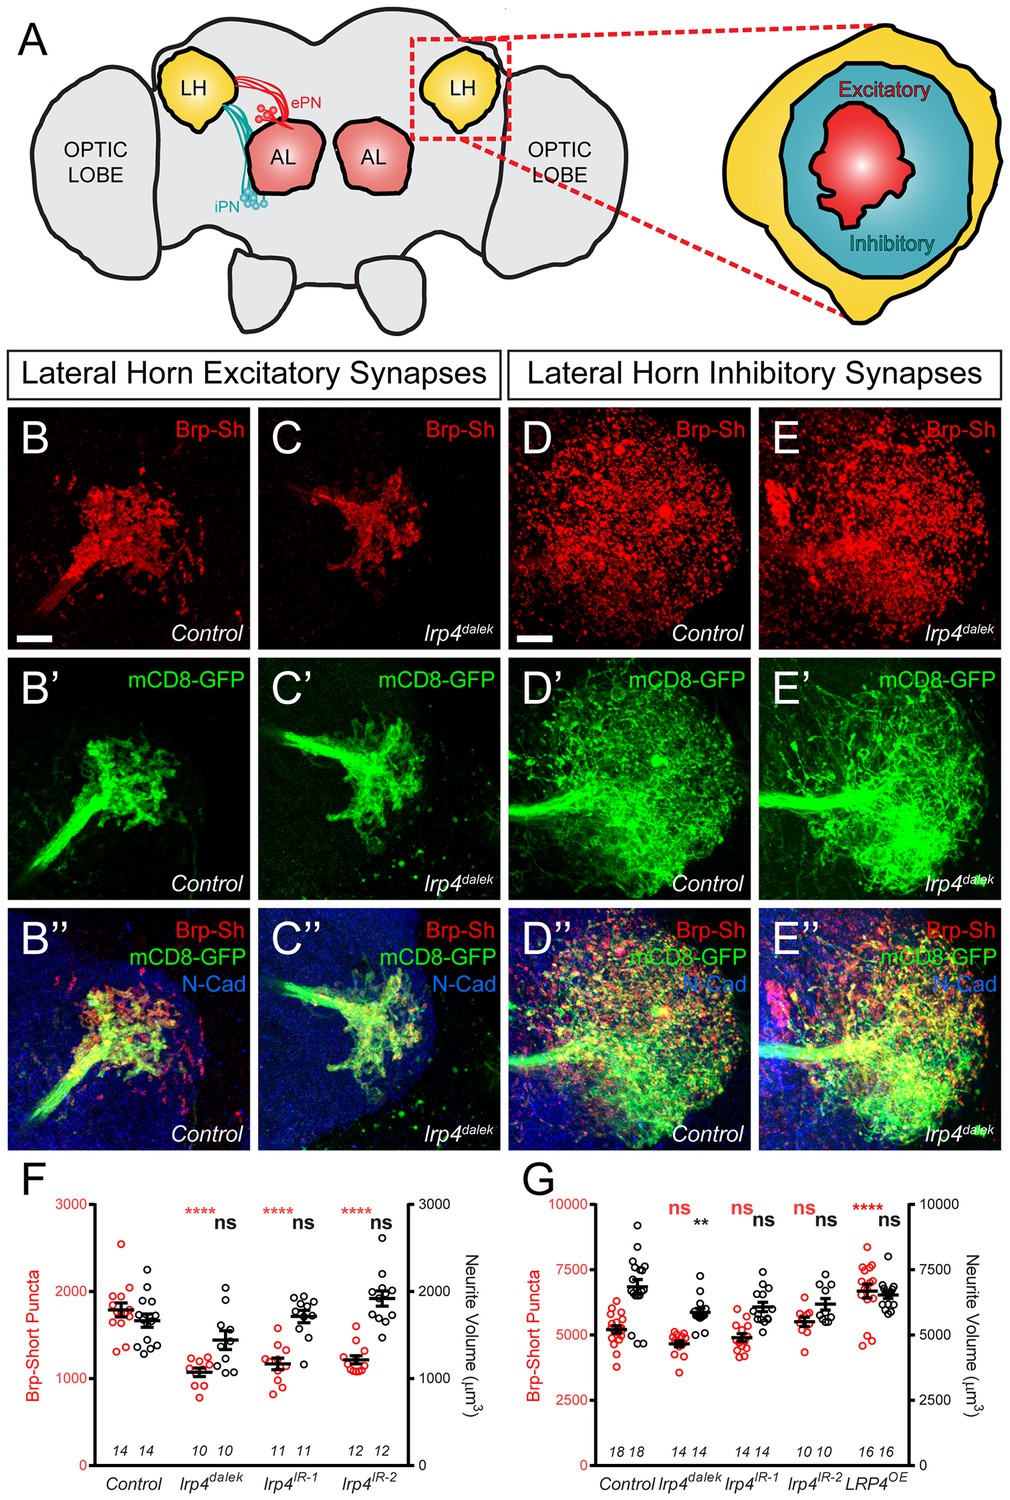
LRP4 perturbations similarly affect higher order olfactory centers.
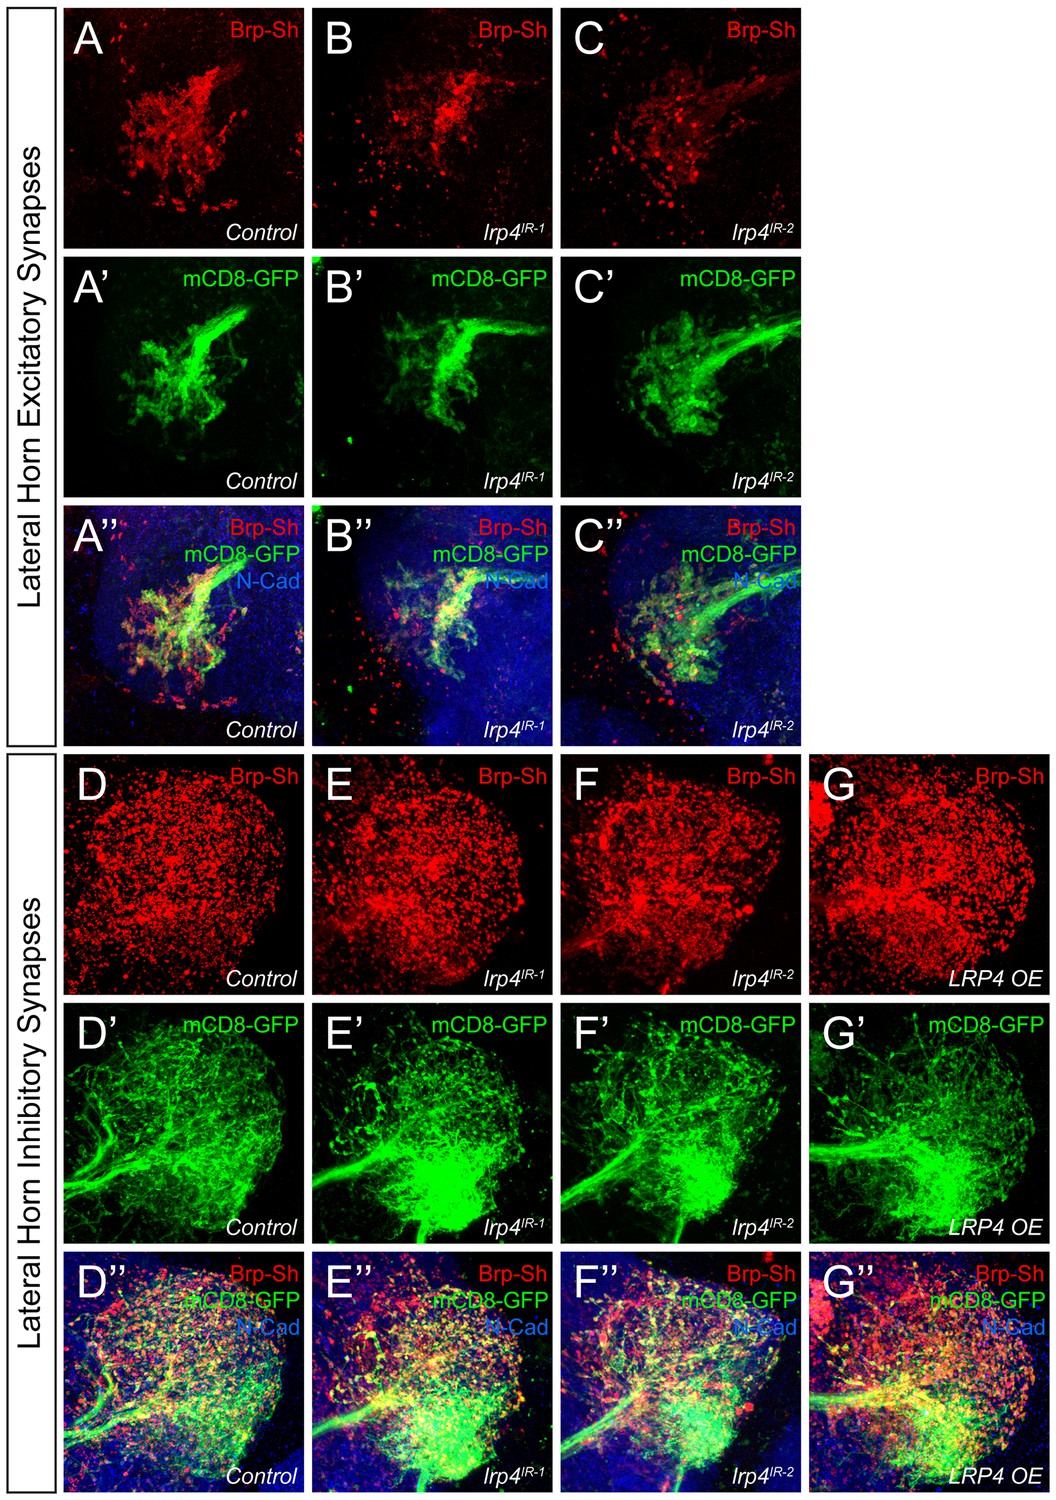
(A) Schematic diagram of the fly brain with major regions labeled and the olfactory regions examined in this study shaded in red (AL, antennal lobe) or yellow (LH, the lateral horn). Excitatory projection neuron (ePN, dark red) and inhibitory projection neuron (iPN, teal) axons are indicated. Magnification: the lateral horn region with the regions innervated by excitatory Mz19-positive projection neuron axons (ePNs, dark red) and inhibitory Mz699-positive projection neuron axons (iPNs, teal) examined here highlighted. (B–C) Representative high magnification confocal maximum intensity projections of Mz19-GAL4 positive PN axon terminals in the lateral horn in males expressing Brp-Short-mStraw and mCD8-GFP and stained for antibodies against mStraw (red), GFP (green), and N-Cadherin (blue). Loss of lrp4 (B, lrp4dalek) reduces synapse number compared to control (A). (D–E) Representative high magnification confocal maximum intensity projections of Mz699-GAL4 positive inhibitory projection neuron (iPN) axon terminals in the lateral horn in males expressing Brp-Short-mStraw and mCD8-GFP and stained for antibodies against mStraw (red), GFP (green), and N-Cadherin (blue). Loss of lrp4 (E, lrp4dalek) does not affect synapse number compared to control (D). (F) Quantification of Brp-Short-mStraw puncta (red, left axis) and neurite volume (black, right axis) in Mz19-positive excitatory projection neurons. Loss of lrp4 and RNAi against lrp4 expressed in those neurons reduces puncta number but leaves neurite volume unaffected. The similar reduction in puncta number between mutants and PN-specific RNAi reveals the cell autonomous nature of the lrp4 phenotype. (G) Quantification of Brp-Short-mStraw puncta (red, left axis) and neurite volume (black, right axis) in Mz699-positive inhibitory projection neurons. Neither loss of lrp4 nor lrp4 RNAi expressed in those neurons affects puncta number, similar to inhibitory neurons in the antennal lobe. Loss of lrp4 reduces neurite volume by 11% but RNAi does not. Overexpression of LRP4 in these neurons (LRP4 OE) results in a 28% increase in the number of Brp-Short puncta. ****p<0.0001; **p<0.01; ns, not significant. Statistical comparisons (one way ANOVA with correction for multiple comparisons) are with control. Error bars represent mean ± s.e.m. n (lateral horns) is noted at the bottom of each column. Scale bars = 10 μm.
Figure 5—figure supplement 1
Representative lateral horn images for LRP4 genetic manipulations.
(A–C) Representative high magnification confocal maximum intensity projections of Mz19-GAL4 positive PN axon terminals in the lateral horn in males expressing Brp-Short-mStraw and mCD8-GFP and stained for antibodies against mStraw (red), GFP (green), and N-Cadherin (blue). Presynaptic knockdown of lrp4 (B, lrp4IR-1; C, lrp4IR-2) results in fewer Brp-Short puncta compared to Control (A) but does not affect mCD8-GFP staining. (D–G) Representative high magnification confocal stack images of Mz699-GAL4 positive inhibitory projection neuron (iPN) axon terminals in the lateral horn in males expressing Brp-Short-mStraw and mCD8-GFP and stained for antibodies against mStraw (red), GFP (green), and N-Cadherin (blue). Presynaptic RNAi against lrp4 (E, lrp4IR-1; F, lrp4IR-2) has no effect on Brp-Short puncta or neurite volume. Overexpression of LRP4 in these neurons (G, LRP4 OE), however, increases synaptic puncta without changing neurite volume. Scale bars = 10 µm.
Figure 6
Loss of presynaptic LRP4 abolishes olfactory attraction behavior.
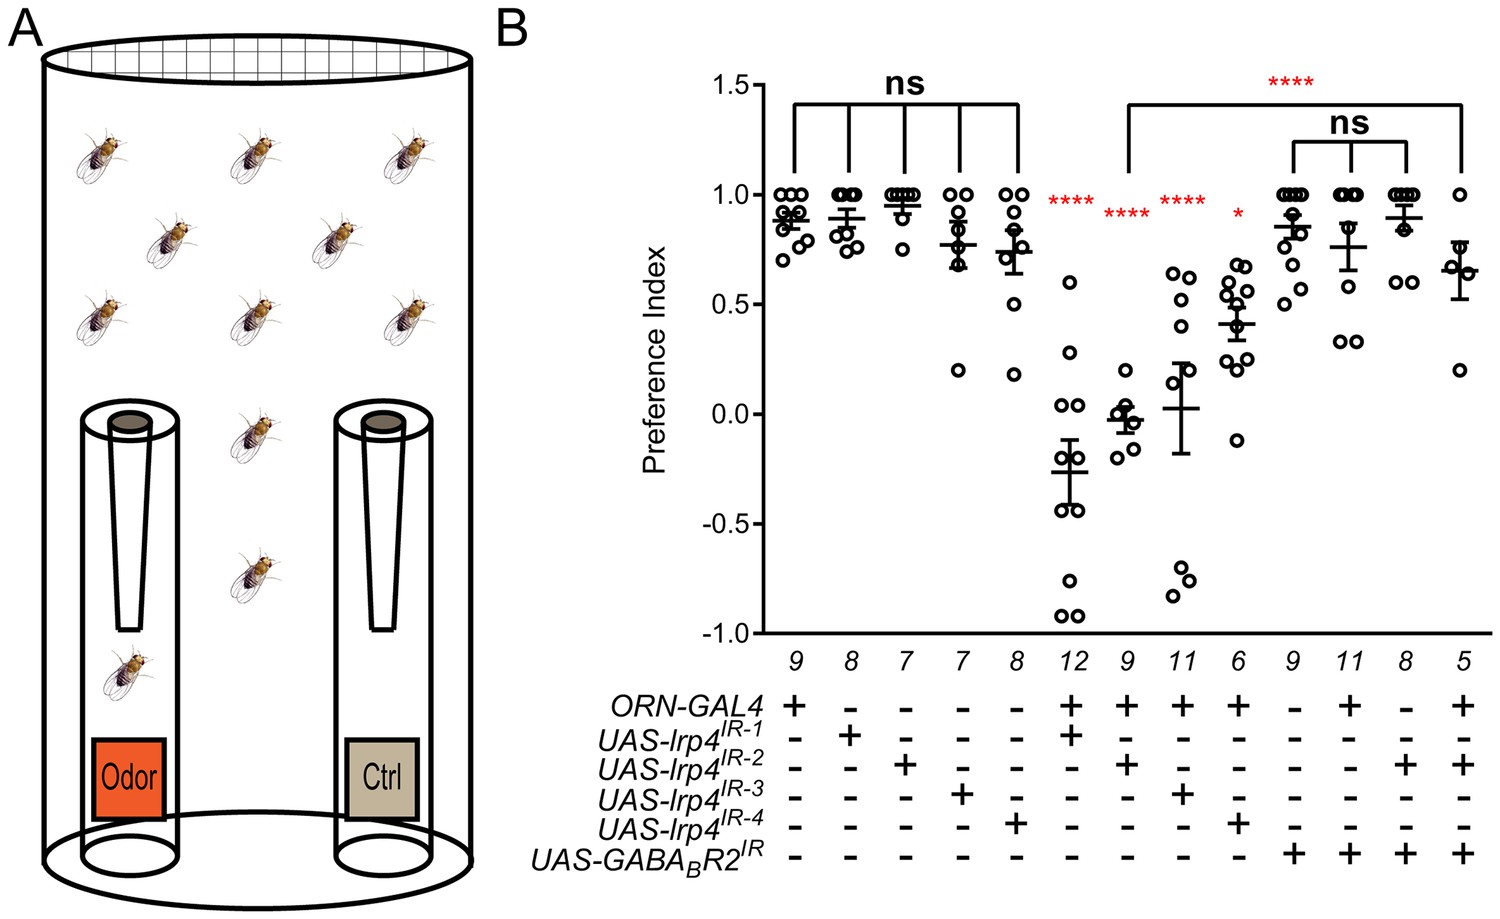
(A) Cartoon of the olfactory trap. (B) Quantification of preference index [(# of flies in odor vial – # of flies in control vial) / total # of flies] between apple cider vinegar (odor) and water (ctrl). Genotypes are indicated below. Control flies with only a GAL4 or UAS-RNAi transgene demonstrate high preference for the attractive odorant in apple cider vinegar. Flies expressing lrp4 RNAi in ORNs have this attraction abrogated. Flies expressing RNAi against GABABR2 in ORNs still display robust attractive behavior while concurrent expression with lrp4 knockdown largely suppresses the loss of attractive behavior. To ensure an equivalent number of transgenes in each genotype, UAS-mCD8-GFP was included (not listed) to control for potential transgenic dilution. ****p<0.0001; **p<0.01; *p<0.05; ns, not significant. Statistical comparisons (one-way ANOVA with correction for multiple comparisons) are with control unless otherwise noted. Error bars represent mean ± s.e.m. n (cohorts of 25 flies tested) is noted at the bottom of each column.
Figure 7 with 1 supplement

LRP4 is required for normal synaptic SRPK79D localization in the CNS.
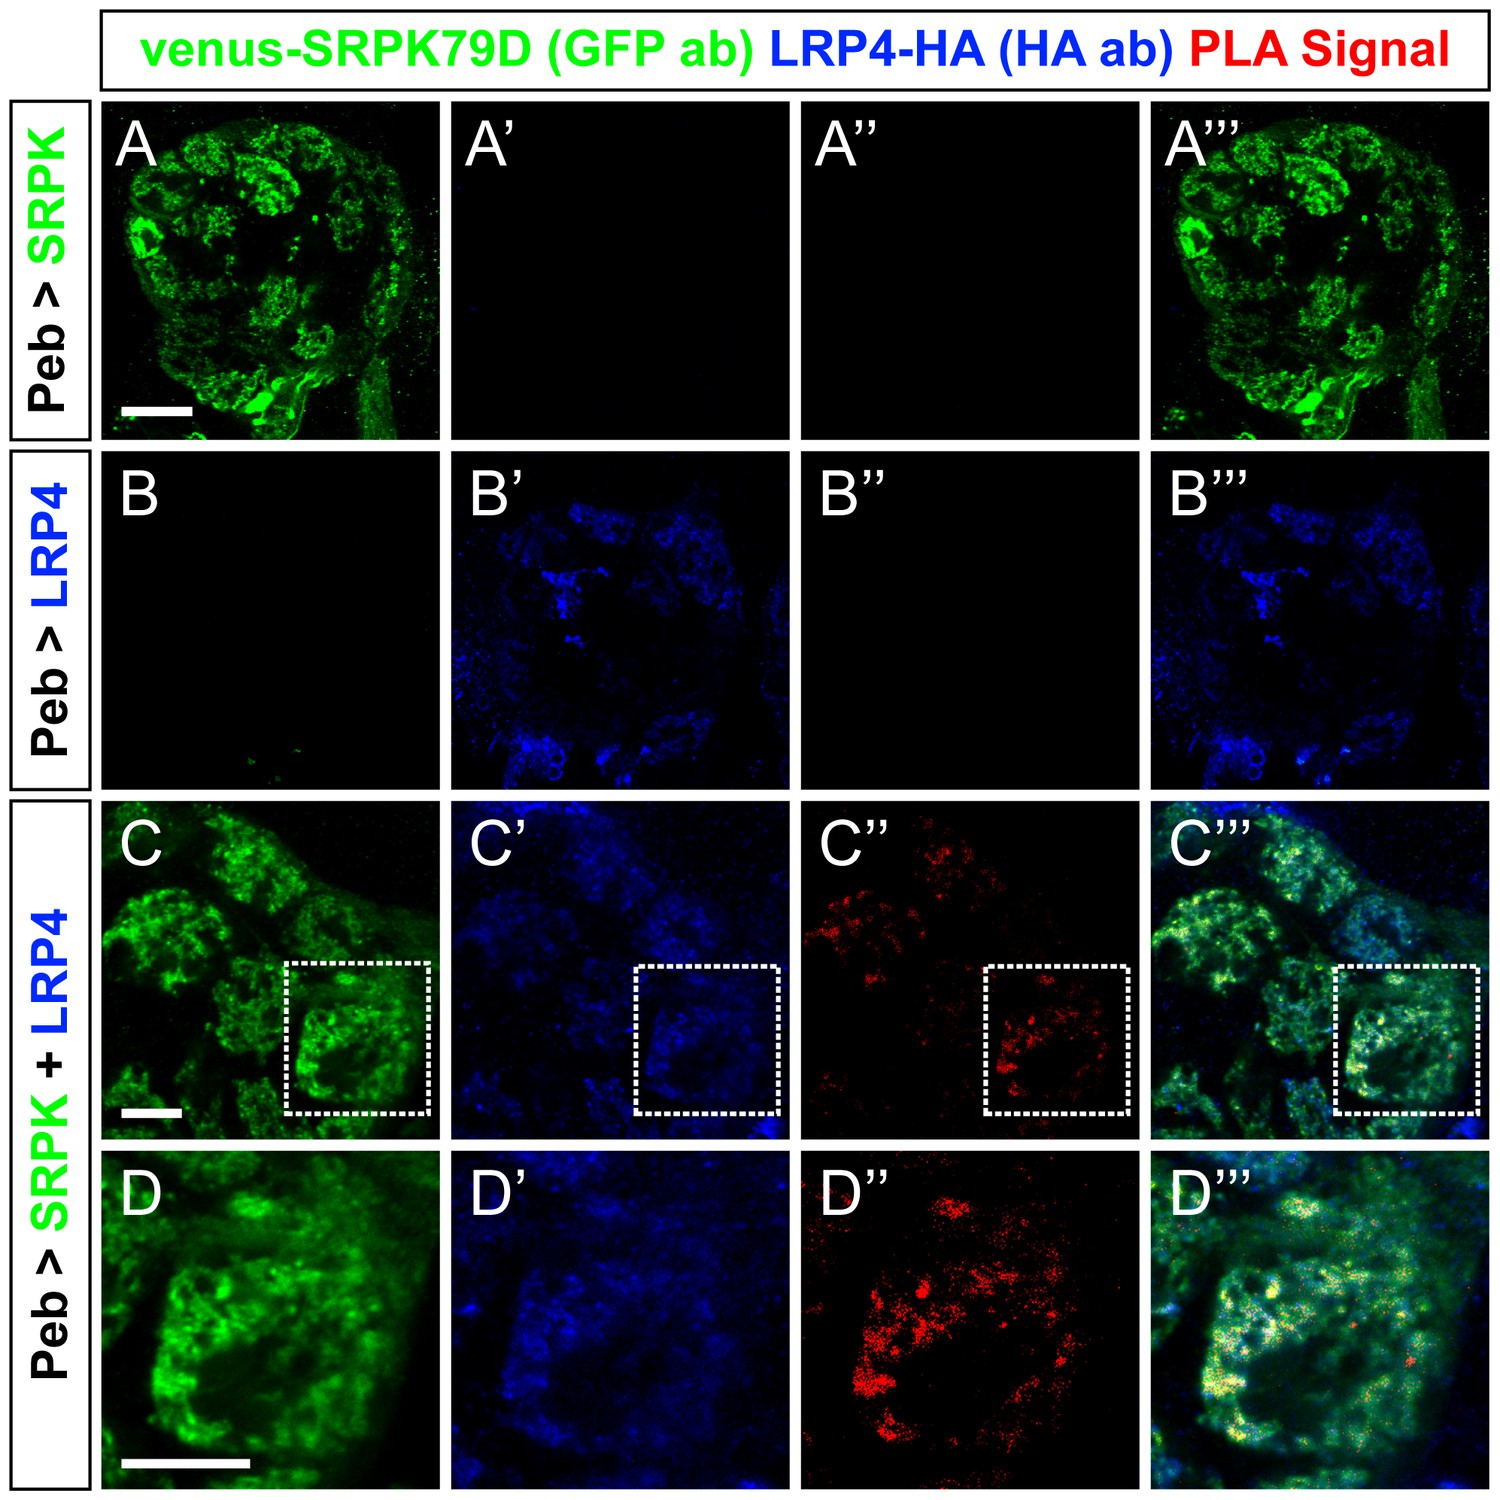
(A–C) Representative images of larval transverse nerves stained with antibodies to Bruchpilot (Brp, green), Synaptotagmin I (Syt I, red), and HRP (blue). Loss of lrp4 (B, lrp4dalek) and srpk79d (C, srpkatc) result in improper axonal accumulations of Brp. This is not a general trafficking defect, as Syt I is absent from focal accumulations. (D) Representative high magnification confocal slice of VA1v ORNs expressing Brp-Short-mStraw and venus-SRPK79D and stained with antibodies to mStraw (red), GFP (green), and N-Cadherin (blue). SRPK79D largely colocalized with Brp-Short-mStraw but Brp-Short-positive / SRPK79D-negative and Brp-Short-negative / SRPK79D-positive puncta were also observed (D’’). (E) Representative confocal slice within a single antennal lobe glomerulus of a brain expressing venus-SRPK79D and LRP4-HA in all ORNs, processed for proExM, and stained with antibodies to venus (green), HA (red), and N-Cadherin (blue). Distinct regions of overlap between venus-SRPK79D and LRP4-HA (E”) are observed, though this represents a subset of venus-SRPK79D localization. (F–G) Representative high magnification confocal maximum intensity projections of VA1v ORN axon terminals expressing venus-SRPK79D in control (F) and lrp4dalek (G) backgrounds and stained with antibodies to GFP (green) and N-Cadherin (blue, inset). Loss of lrp4 results in reduced synaptic SRPK79D. (H) Quantification of venus-SRPK79D (green, left axis) and N-Cadherin fluorescence (blue, right axis). SRPK79D fluorescence is markedly reduced in lrp4dalek animals, but N-Cadherin staining is unaffected, demonstrating specificity. (I–J) Representative high magnification single confocal slices of the antennal lobe where all ORNs are expressing venus-SRPK79D and LRP4-HA via the pebbled-GAL4 driver and the brains subsequently processed using proximity ligation assays to determine whether the two proteins were close enough to interact. The brains were stained with antibodies to venus (green) and HA (blue) and PLA-specific probes (red) to detect proximity ligation events. When PLA-specific probes are not added, no signal is observed (I”) but when present, positive PLA signal (J”) indicates close physical proximity between LRP4-HA and venus-SRPK79D. Positive PLA signal represents a subset of SRPK79D or LRP4 expression, as in (E). **p<0.01; ns, not significant. Statistical comparisons (one-way ANOVA with correction for multiple comparisons) are with control unless otherwise noted. Error bars represent mean ± s.e.m. n (antennal lobes) is noted at the bottom of each column. Scale bars = 10 µm (A–D,I–J), 25 µm (E), 20 µm (F–G), 33 µm (F-G insets).
Figure 7—figure supplement 1
Proximity ligation assays reveal LRP4 and SRPK79D interactions.
(A–D) Representative single confocal slices of antennal lobes expressing venus-SRPK79D alone (A), LRP4-HA alone (B) or venus-SRPK79D and LRP4-HA (C–D) in all ORNs using the pebbled-GAL4 driver and stained with antibodies against venus (green), HA (blue), and processed using proximity ligation assays (red). When either protein is expressed alone (a–b), no PLA signal is observed (A”,B”). When both are present, however, PLA signal can be observed (C”,D”) suggesting that the two are close enough physically to interact. High magnification of a single glomerulus (D”, the dashed boundary in C) indicates that the PLA-positive signal represents a subset of LRP4 or SRPK79D localization. Scale bars = 20 µm (A–B), 10 µm (C), 5 µm (D).
Figure 8 with 1 supplement
SRPK79D and LRP4 genetically interact to control synapse morphology and function.
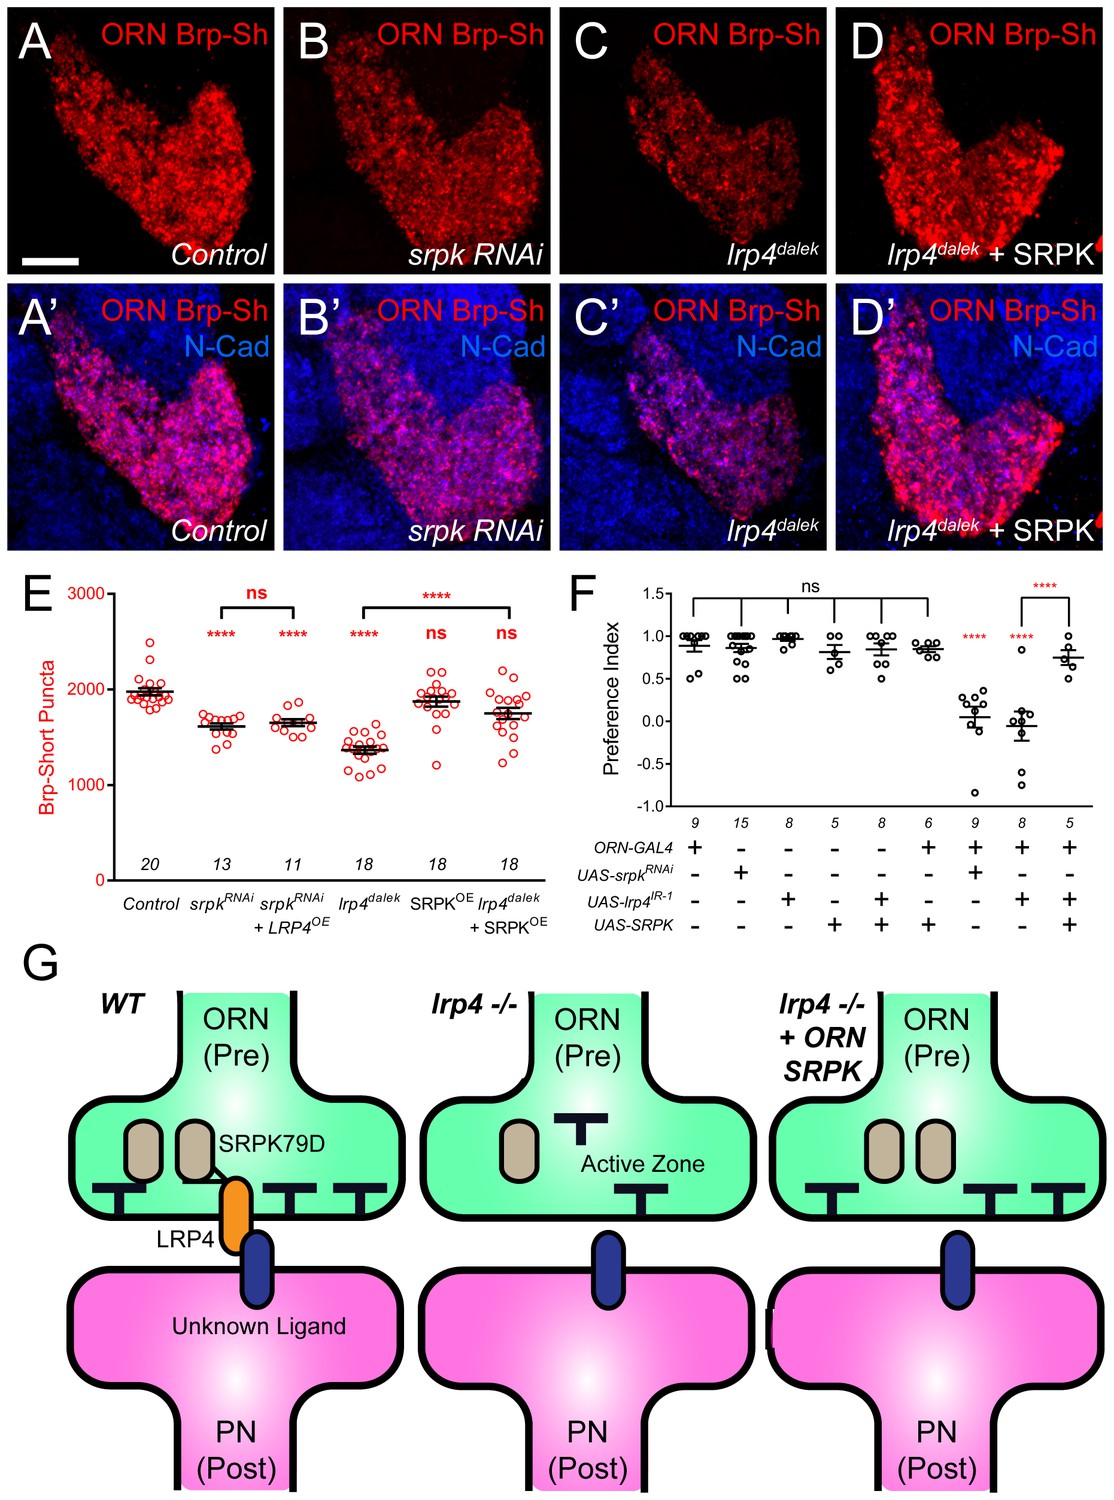
(A–D) Representative high magnification confocal maximum intensity projections of VA1v ORN axon terminals in males expressing Brp-Short-mStraw and stained with antibodies to mStraw (red) and N-Cadherin (blue). Presynaptic RNAi against srpk79D (srpk RNAi) reduces the number of puncta, but less so than loss of lrp4 (lrp4dalek). Presynaptic overexpression of SRPK79D in an lrp4dalek background (lrp4dalek + SRPK) restores puncta number to control levels. (E) Quantification of Brp-Short-mStraw puncta. Note that overexpression of SRPK79D in an otherwise wild-type background has no gain-of-function effects on puncta number. Further srpk79D function is needed to enable the LRP4 overexpression-induced increase in synaptic puncta number. n (antennal lobes) is noted at the bottom of each column. (F) Quantification of preference index in the olfactory trap assay. Flies overexpressing SRPK79D in ORNs show strong attractive behavior, while ORNs expressing RNAi against lrp4 or srpk79D abrogate attraction to apple cider vinegar. This phenotype can be suppressed by concurrent overexpression of SRPK79D. UAS-mCD8-GFP (not listed) was used to ensure equivalent numbers of transgenes in each genotype. n (cohorts of 25 flies tested) is noted at the bottom of each column. (G) A model for LRP4 function at olfactory synapses. At wild-type axon terminals, LRP4 in presynaptic ORNs (orange) interacts with a putative postsynaptic partner (blue), resulting in SRPK79D (beige) retention at the terminal and a full complement of active zones (black T). Here, the putative ligand is depicted as having a postsynaptic PN source, but alternate sources (such as glia or local interneurons) are also possible. In the absence of LRP4, less synaptic SRPK79D is present and active zone number is reduced. The size of the terminal itself does not change but the synapse number (i.e., number of active zones) within that terminal space is reduced. Further, T-bar defects like a floating T-bar can also be seen. SRPK79D overexpression in an lrp4 mutant restores synaptic SRPK79D and active zone number, despite the absence of LRP4. Thus, the LRP4 largely functions in synaptic organization through downstream SRPK79D. ****p<0.0001; ***p<0.001; ns, not significant. Statistical comparisons (one-way ANOVA with correction for multiple comparisons) are with control unless otherwise noted. Error bars represent mean ± s.e.m. n (antennal lobes for E, cohorts of 25 flies tested for F) is noted at the bottom of each column. Scale bars = 10 µm.
Figure 8—figure supplement 1
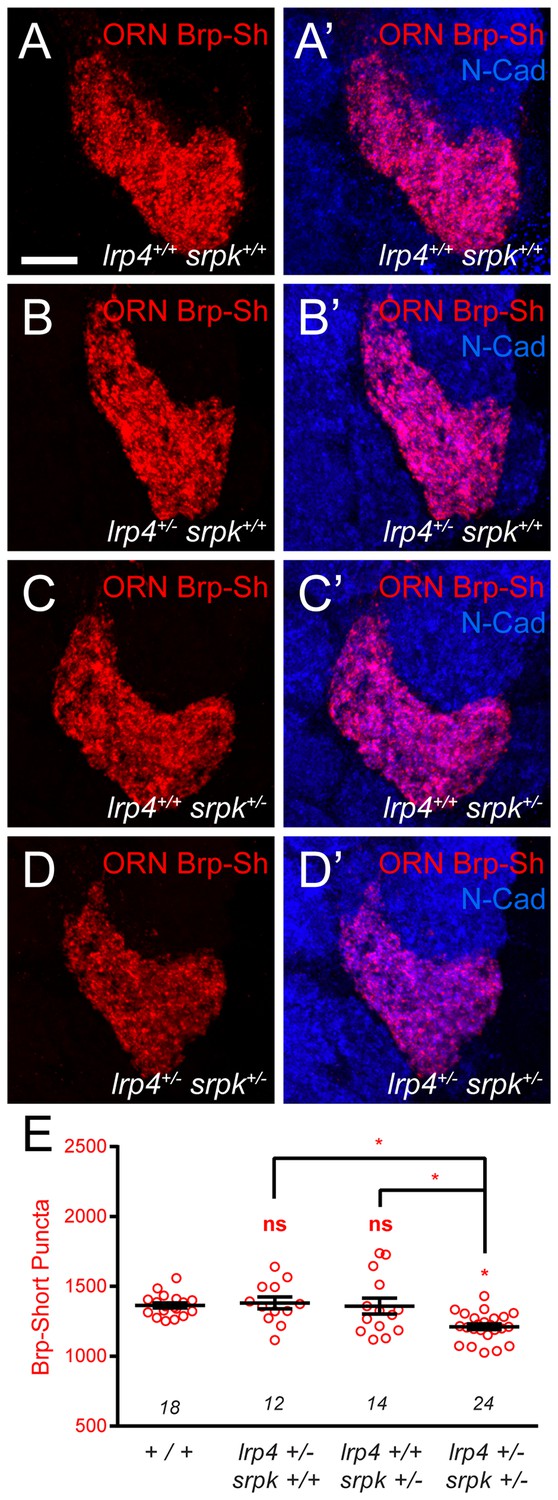
lrp4 and srpk79D interact genetically to control Brp-Short puncta number.
(A–D) Representative high magnification confocal maximum intensity projections of VA1v ORN axon terminals in the VA1v glomerulus of males expressing Brp-Short-mStraw and stained with antibodies against mStraw (red) and N-Cadherin (blue). (E) Quantification of Brp-Short-mStraw puncta. Loss of one copy of either lrp4 (B) or srpk79D (C) does not affect puncta number, but concurrent loss of one copy of each gene (D) results in fewer puncta. *p<0.05. Statistical comparisons (one-way ANOVA corrected for multiple comparisons) are with control unless noted. Error bars represent mean ± s.e.m. n (antennal lobes) is noted at the bottom of each column. Scale bar = 10 µm.
Additional files
-
Supplementary file 1
Table of genotypes for all experimental conditions.
Full genotype information for each image or analyzed condition. Notation (+; +; +; +) follows standard Drosophila genetics, corresponding to the X, 2nd, 3rd, and 4th chromosomes. Corresponding figure panels are listed as well for each genotype.
- https://doi.org/10.7554/eLife.27347.021
Download links
A two-part list of links to download the article, or parts of the article, in various formats.
Downloads (link to download the article as PDF)
Open citations (links to open the citations from this article in various online reference manager services)
Cite this article (links to download the citations from this article in formats compatible with various reference manager tools)
Presynaptic LRP4 promotes synapse number and function of excitatory CNS neurons
eLife 6:e27347.
https://doi.org/10.7554/eLife.27347


