Epithelial-Myeloid cell crosstalk regulates acinar cell plasticity and pancreatic remodeling in mice
- University of Michigan, United States
- Fourth Military Medical University, China
Figures
Figure 1 with 1 supplement
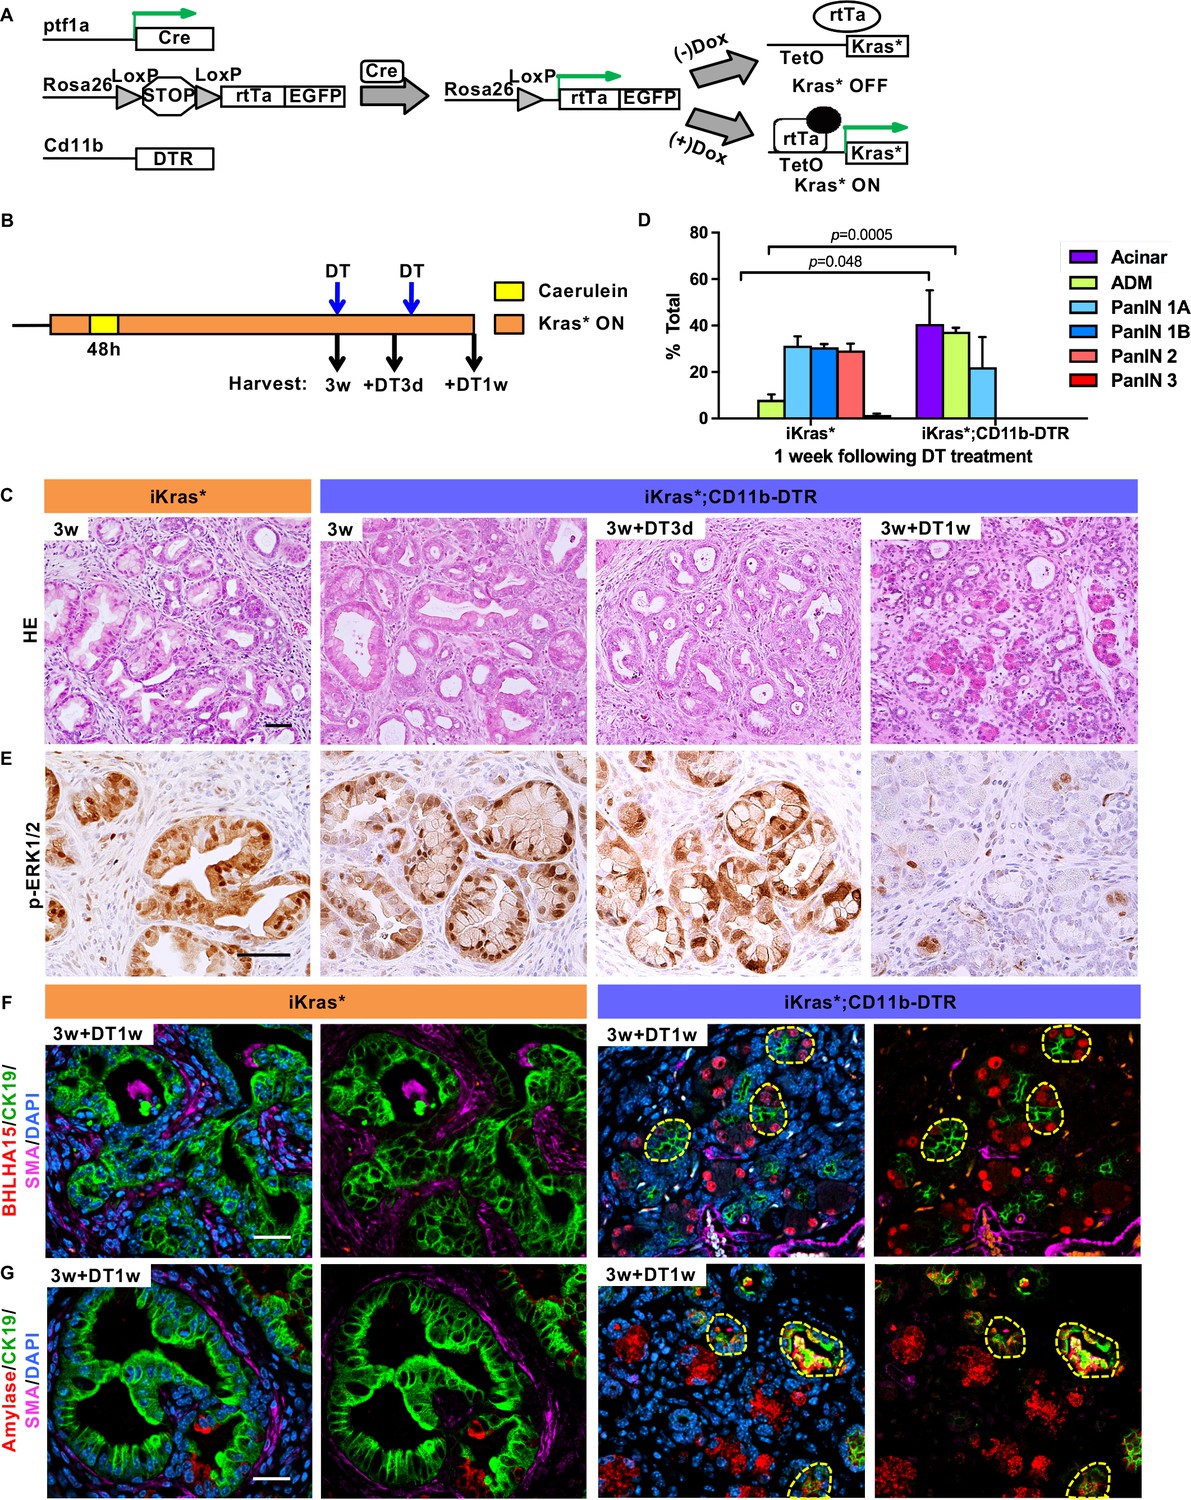
Myeloid cells are required for PanIN maintenance.
(A) Genetic makeup of the iKras*;CD11b-DTR mouse model. (B) Experimental design, n = 7 mice/cohort. (C) H&E staining of iKras* and iKras*;CD11b-DTR pancreata 3 weeks post pancreatitis induction and iKras*;CD11b-DTR pancreata followed by DT treatment for 3 days and 1 week. Scale bar 50 µm. (D) Pathological analysis for iKras* and iKras*;CD11b-DTR pancreata 1 week following DT treatment. Data represent mean ± SEM, n = 3 mice/cohort. The statistical difference between iKras* and iKras*;CD11b-DTR mice per lesion type was determined by Two-tailed unpaired t-tests. (E) Immunohistochemistry for p-ERK1/2 of iKras* and iKras*;CD11b-DTR pancreata. Scale bar 50 µm. (F) Co-immunofluorescent staining for BHLHA15 (red), CK19 (green), SMA (magenta) and DAPI (blue); (G) Co-immunofluorescent staining for Amylase (red), CK19 (green), SMA (magenta) and DAPI (blue) in iKras* and iKras*;CD11b-DTR pancreata 3 weeks post pancreatitis and followed by DT treatment for 1 week. Scale bar 25 µm. Yellow dashed lines indicate epithelial cell clusters co-expressing BHLHA15 and CK19 (F) or co-expressing Amylase and CK19 (G).
-
Figure 1—source data 1
Histopathological analysis (related to Figure 1D).
- https://doi.org/10.7554/eLife.27388.005
Figure 1—figure supplement 1
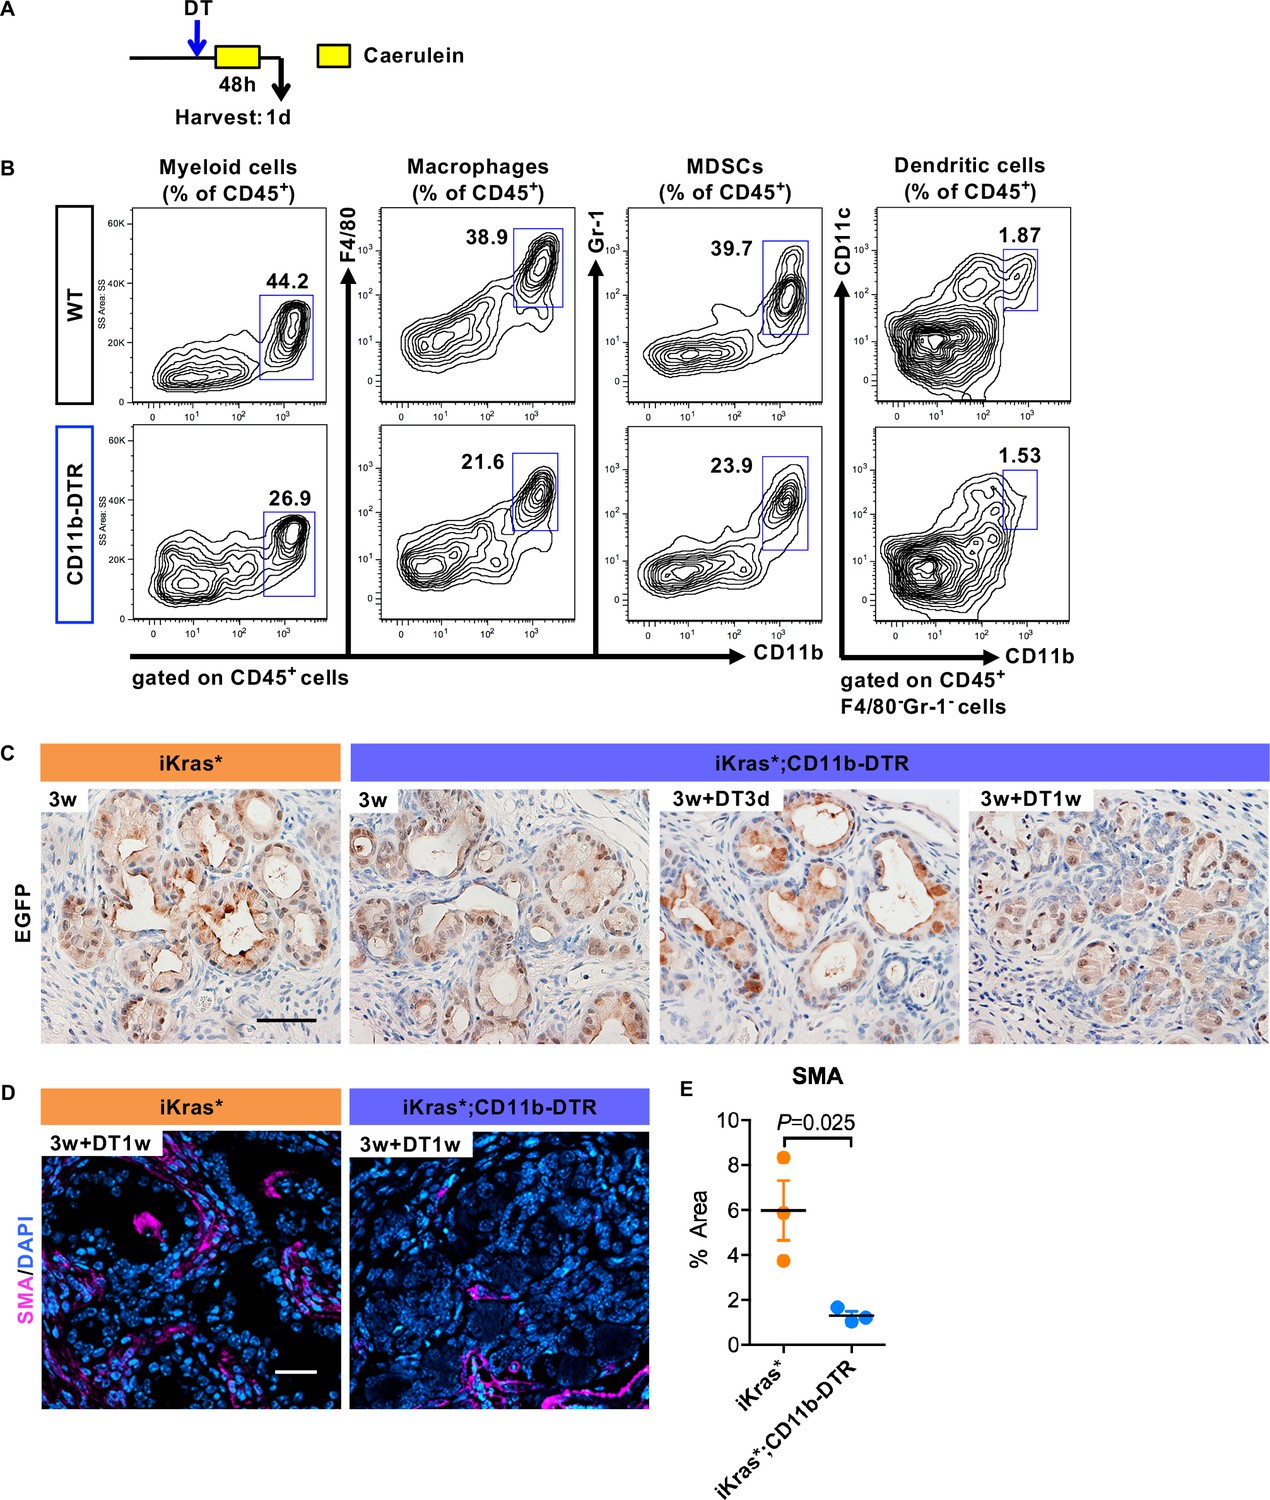
Depletion of multiple myeloid subsets results in redifferentiation of epithelial cells and remodeling of the stroma.
(A) Experimental design. (B) Flow Cytometry analysis of myeloid cells in wild type (WT) and CD11b-DTR pancreata one day following acute pancreatitis induction. (C) Immunohistochemistry for EGFP of iKras* and iKras*;CD11b-DTR pancreata. Scale bar 50 µm. (D) SMA immunofluorescent staining and (E) quantification of SMA positive areas per slide (%) in iKras* and iKras*;CD11b-DTR pancreata 3 weeks post pancreatitis and followed by DT treatment for 1 week. Data represent mean ± SEM, n = 3. The statistical difference was determined by Two-tailed unpaired t-tests. SMA immunofluorescent staining was quantified by Image-Pro Plus 4.5.
Figure 2 with 1 supplement
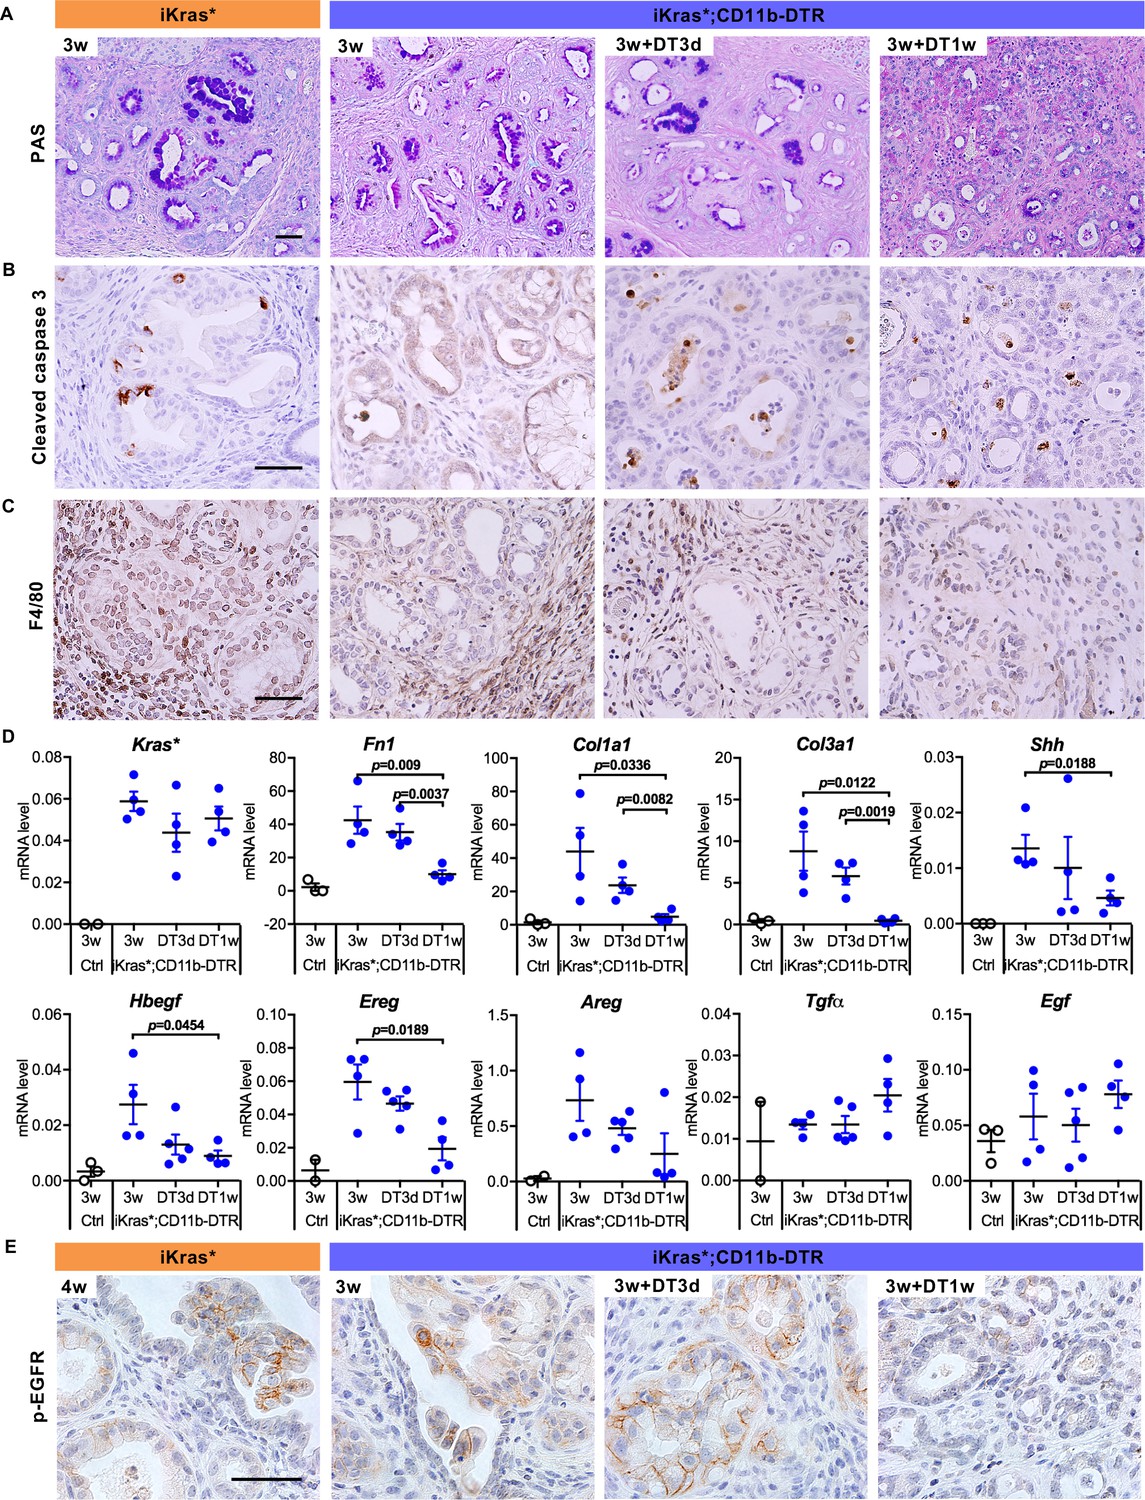
Myeloid cell depletion induces PanIN regression and stroma inactivation.
(A) Periodic acid–Schiff (PAS) staining; (B) immunohistochemistry staining for Cleaved caspase three and (C) F4/80 in iKras* and iKras*;CD11b-DTR pancreata 3 week post pancreatitis induction and in iKras*;CD11b-DTR pancreata following DT treatment for 3 days and 1 week. Scale bar 50 µm. (D) qRT-PCR for transgenic Kras*, Fn1, Col1a1, Col3a1, Shh, Hbegf, Ereg, Areg, Tgfα and Egf in littermate control and iKras*;CD11b-DTR pancreata 3 weeks post pancreatitis and in iKras*;CD11b-DTR pancreata following DT treatment for 3 days and 1 week. Data represent mean ± SEM, each point indicates one animal. The statistical difference was determined by Two-tailed unpaired t-tests. (E) Immunohistochemistry staining for p-EGFR in iKras* and iKras*;CD11b-DTR pancreata post pancreatitis induction and iKras*;CD11b-DTR pancreata following DT treatment for 3 days and 1 week. Scale bar 50 µm.
Figure 2—figure supplement 1
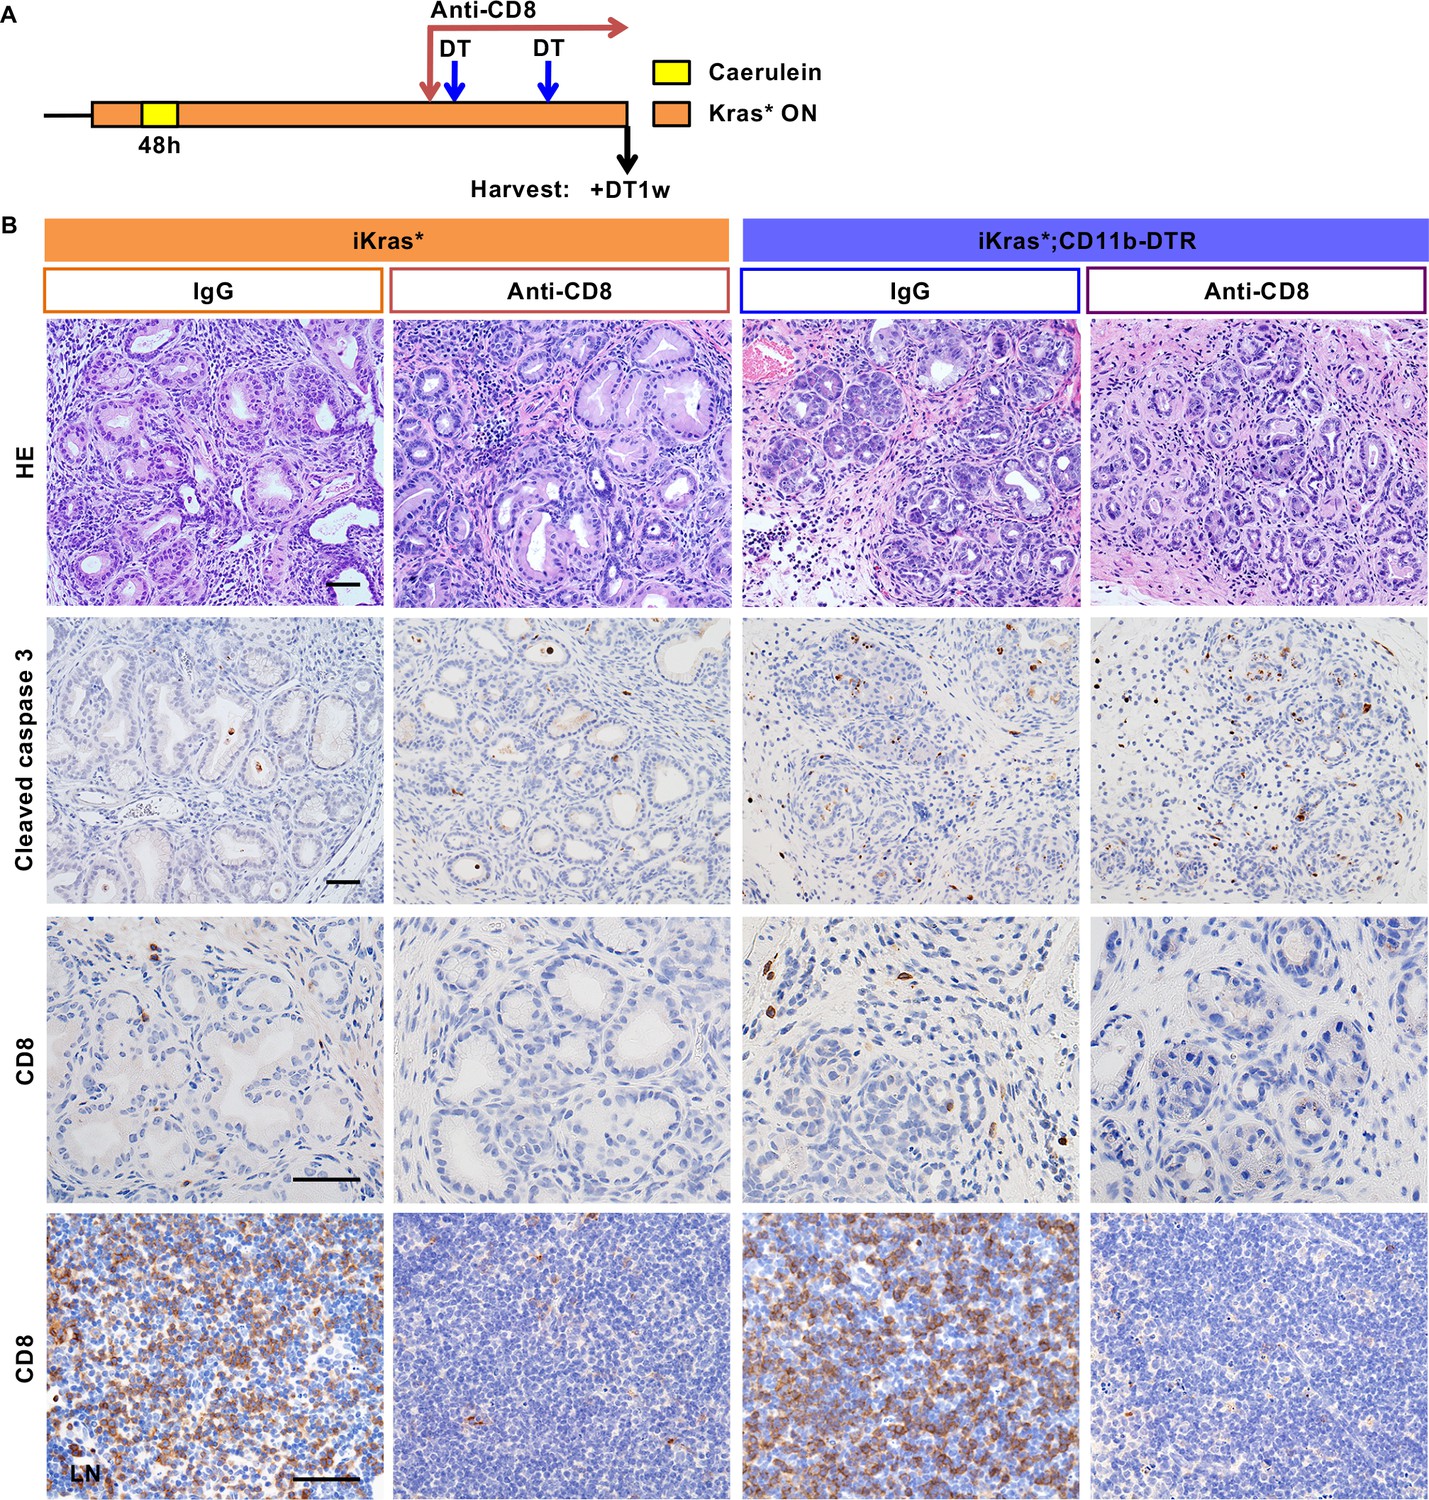
CD8 T cell depletion does not affect progression of low-grade PanIN lesions, nor PanIN regression upon myeloid cell depletion.
(A) Experimental design, n = 3 ~ 4 mice/cohort. Oncogenic Kras was activated via Dox adminitration in iKras* and iKras*-CD11b-DTR mice; acute pancreatitis was then induced. Three weeks following the induction of pancreatitis, the mice were randomized to DT + IgG or DT + anti-CD8. All the animals were harvested 1 week later. (B) H&E staining and immunohistochemistry staining for Cleaved caspase three shows no change in apoptosis across the experimental groups. Immunostaining for CD8 in iKras* or iKras*;CD11b-DTR pancreata shows limited, but detectable, infiltration of CD8+ T cells, which is lost upon anti-CD8 treatment. Immunostaining for CD8 in lymph nodes (LN) verifies effective depletion of CD8+ T cells. Scale bar 50 µm.
Figure 3 with 1 supplement
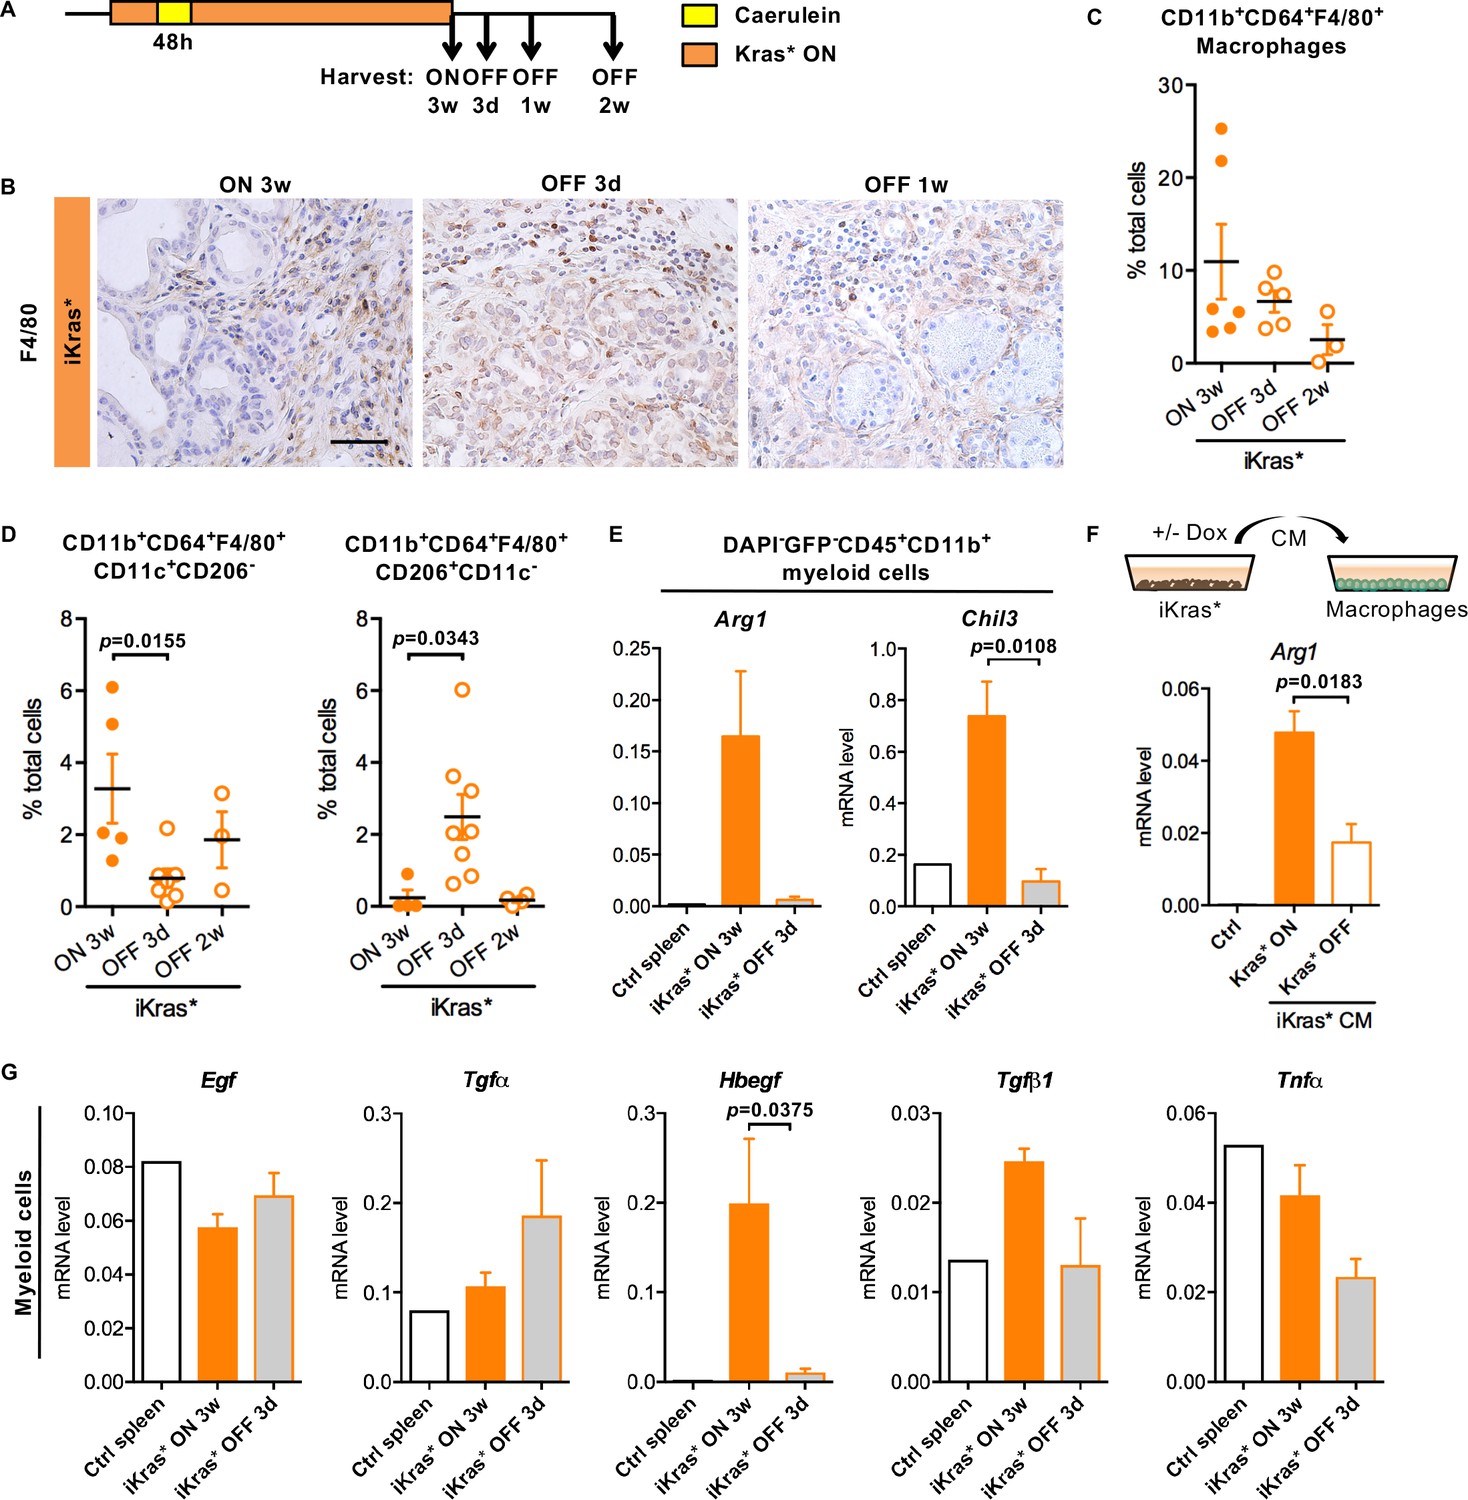
Oncogenic Kras in epithelial cells regulates macrophages polarization and function.
(A) Experimental design, n = 4 ~ 8 mice/cohort. (B) Immunohistochemistry staining for F4/80 in iKras* pancreata 3 weeks post pancreatitis and 3 days, 1 week upon Kras* inactivation. Scale bar 50 µm. (C) Pancreatic macrophage (CD11b+CD64+F4/80+) infiltration in iKras* pancreata 3 week post pancreatitis induction and 3 days, 2 weeks followed by Kras* inactivation were measured by flow cytometry. (D) Percentage of classically activated (CD11b+CD64+F4/80+CD11c+CD206-) macrophages and alternatively activated (CD11b+CD64+F4/80+CD206+CD11c-) macrophages in iKras* pancreata 3 weeks post pancreatitis and 3 days, 2 week upon Kras* inactivation were analyzed by flow cytometry. Data represent mean ± SEM, each point indicates one animal. The statistical difference was determined by Two-tailed unpaired t-tests. p<0.05. (E) qRT-PCR for Arg1 and Chil3 expression in myeloid cells flow-sorted from control spleen, iKras* pancreata 3 weeks post pancreatitis and 3 days post Kras* inactivation. Data represent mean ± SEM. The statistical difference was determined by Two-tailed unpaired t-tests. (F) qRT-PCR for Arg1 expression in macrophages cultured with control IMDM media or iKras* cancer cell conditioned media (CM) in presence or absence of DOX. Data represent mean ± SEM. The statistical difference was determined by Two-tailed unpaired t-tests. (G) qRT-PCR for Egf, Tgfα, Hbegf, Tgfβ1 and Tnfα expression in myeloid cells sorted from control spleen, iKras* pancreata 3 weeks post pancreatitis and 3 days post Kras* inactivation. Data represent mean ± SEM. The statistical difference was determined by Two-tailed unpaired t-tests.
Figure 3—figure supplement 1
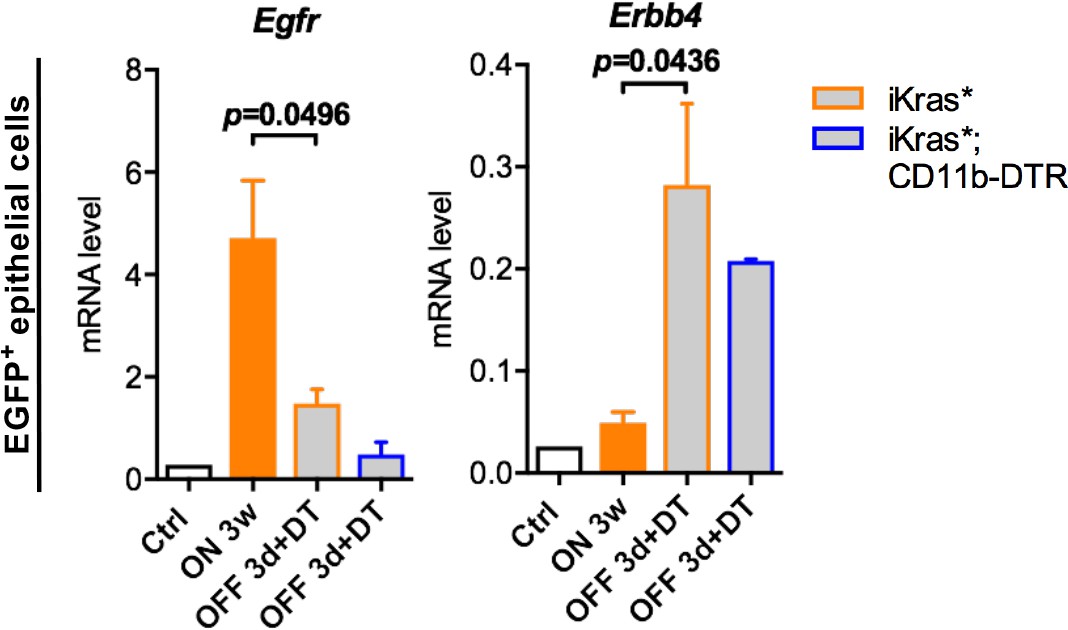
Changes in expression of EGFR family receptors in epithelial cells following Kras inactivation.
qRT-PCR for Egfr and Erbb4 expression in epithelial cells (EGFP+CD45-) freshly sorted from control normal pancreata, iKras* pancreata 3 weeks post pancreatitis, iKras* and iKras*;CD11b-DTR pancreata 3 days post Kras* inactivation and DT treatment. Data represent mean ± SEM. The statistical difference was determined by Two-tailed unpaired t-tests.
Figure 4 with 1 supplement
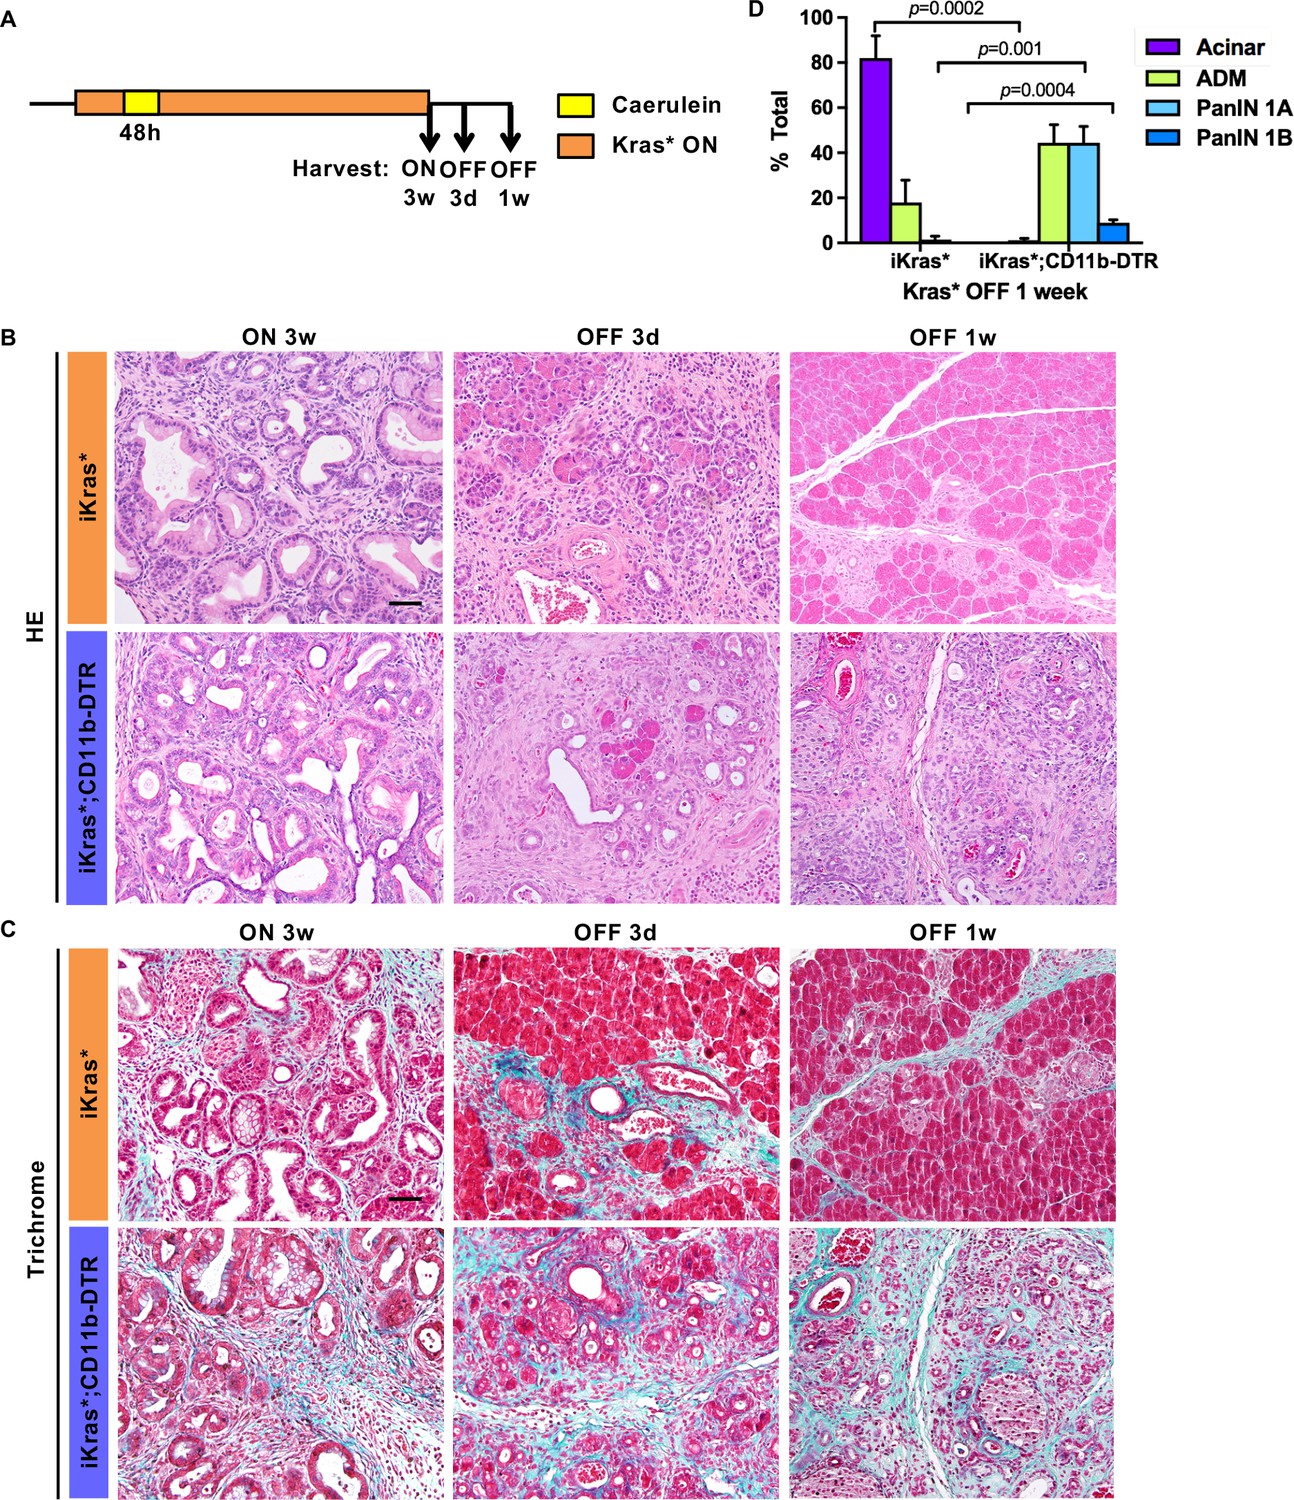
Myeloid cells are required for tissue remodeling upon Kras* inactivation.
(A) Experimental design (n = 4 ~ 8 mice/cohort). (B) H&E staining; (C) Gomori Trichrome staining in iKras* and iKras*;CD11b-DTR pancreata 3 weeks post pancreatitis induction and 3 days, 1 week following Kras* inactivation and DT treatment. Scale bar 50μm. (D) Pathological analysis for iKras* and iKras*;CD11b-DTR pancreata 1 week following Kras* inactivation and DT treatment. Data represent mean ± SEM, n = 4 mice/cohort. The statistical difference between iKras* and iKras*;CD11b-DTR mice per lesion type was determined by Two-tailed unpaired t-tests.
Figure 4—figure supplement 1

Myeloid cells are required for pancreatic acinar cell re-differentiation upon Kras* inactivation.
(A) Periodic acid–Schiff (PAS) staining; (B) EGFP immunohistochemistry staining in iKras* and iKras*;CD11b-DTR pancreata 3 weeks post pancreatitis induction and 3 days, 1 week upon Kras* inactivation and DT treatment. Scale bar 50 µm.
Figure 5 with 2 supplements

Myeloid cells regulate acinar re-differentiation, cell survival and stromal activation of EGFR/MAPK signaling.
(A) Co-immunofluorescent staining for CK19 (green), Amylase (red), SMA (magenta) and DAPI (blue); (B) co-immunofluorescent staining for Cleaved caspase 3 (green), E-cadherin (magenta) and DAPI (blue); (C) co-immunofluorescent staining for p-ERK1/2 (green), CK19 (red), SMA (magenta) and DAPI (blue) in iKras* and iKras*;CD11b-DTR pancreata 3 weeks post pancreatitis and 3 days, 1 week upon Kras* inactivation and DT treatment. Scale bar 25 µm. Arrows indicate cells co-expressing p-ERK1/2 and SMA.
Figure 5—figure supplement 1
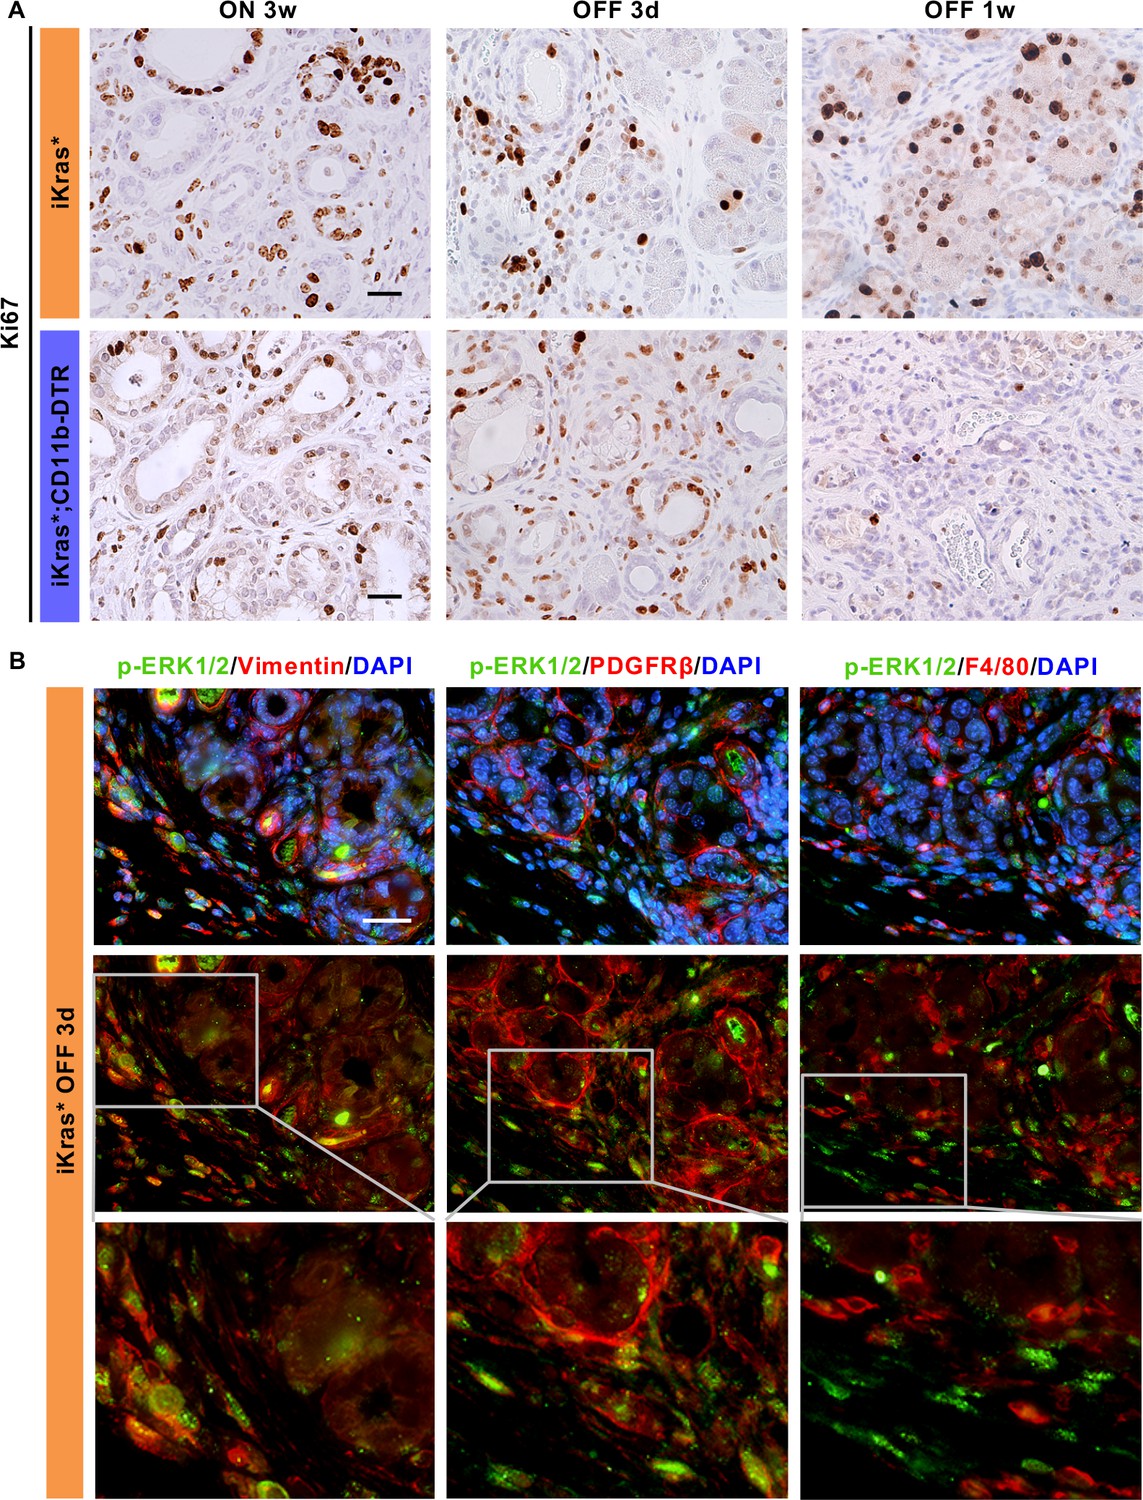
Acinar cell regeneration upon Kras* inactivation requires stromal activation of MAPK signaling.
(A) Immunohistochemistry for Ki67 in iKras* and iKras*;CD11b-DTR pancreata 3 weeks post pancreatitis induction and 3 days, 1 week upon Kras* inactivation and DT treatment. Scale bar 25 µm. (B) co-immunofluorescent staining for p-ERK1/2 (green), stromal cell marker Vimentin, PDGFRβ or macrophage marker F4/80 (red) and DAPI (blue) in iKras* pancreata 3 weeks post pancreatitis and 3 days upon Kras* inactivation. Scale bar 25 µm.
Figure 5—figure supplement 2
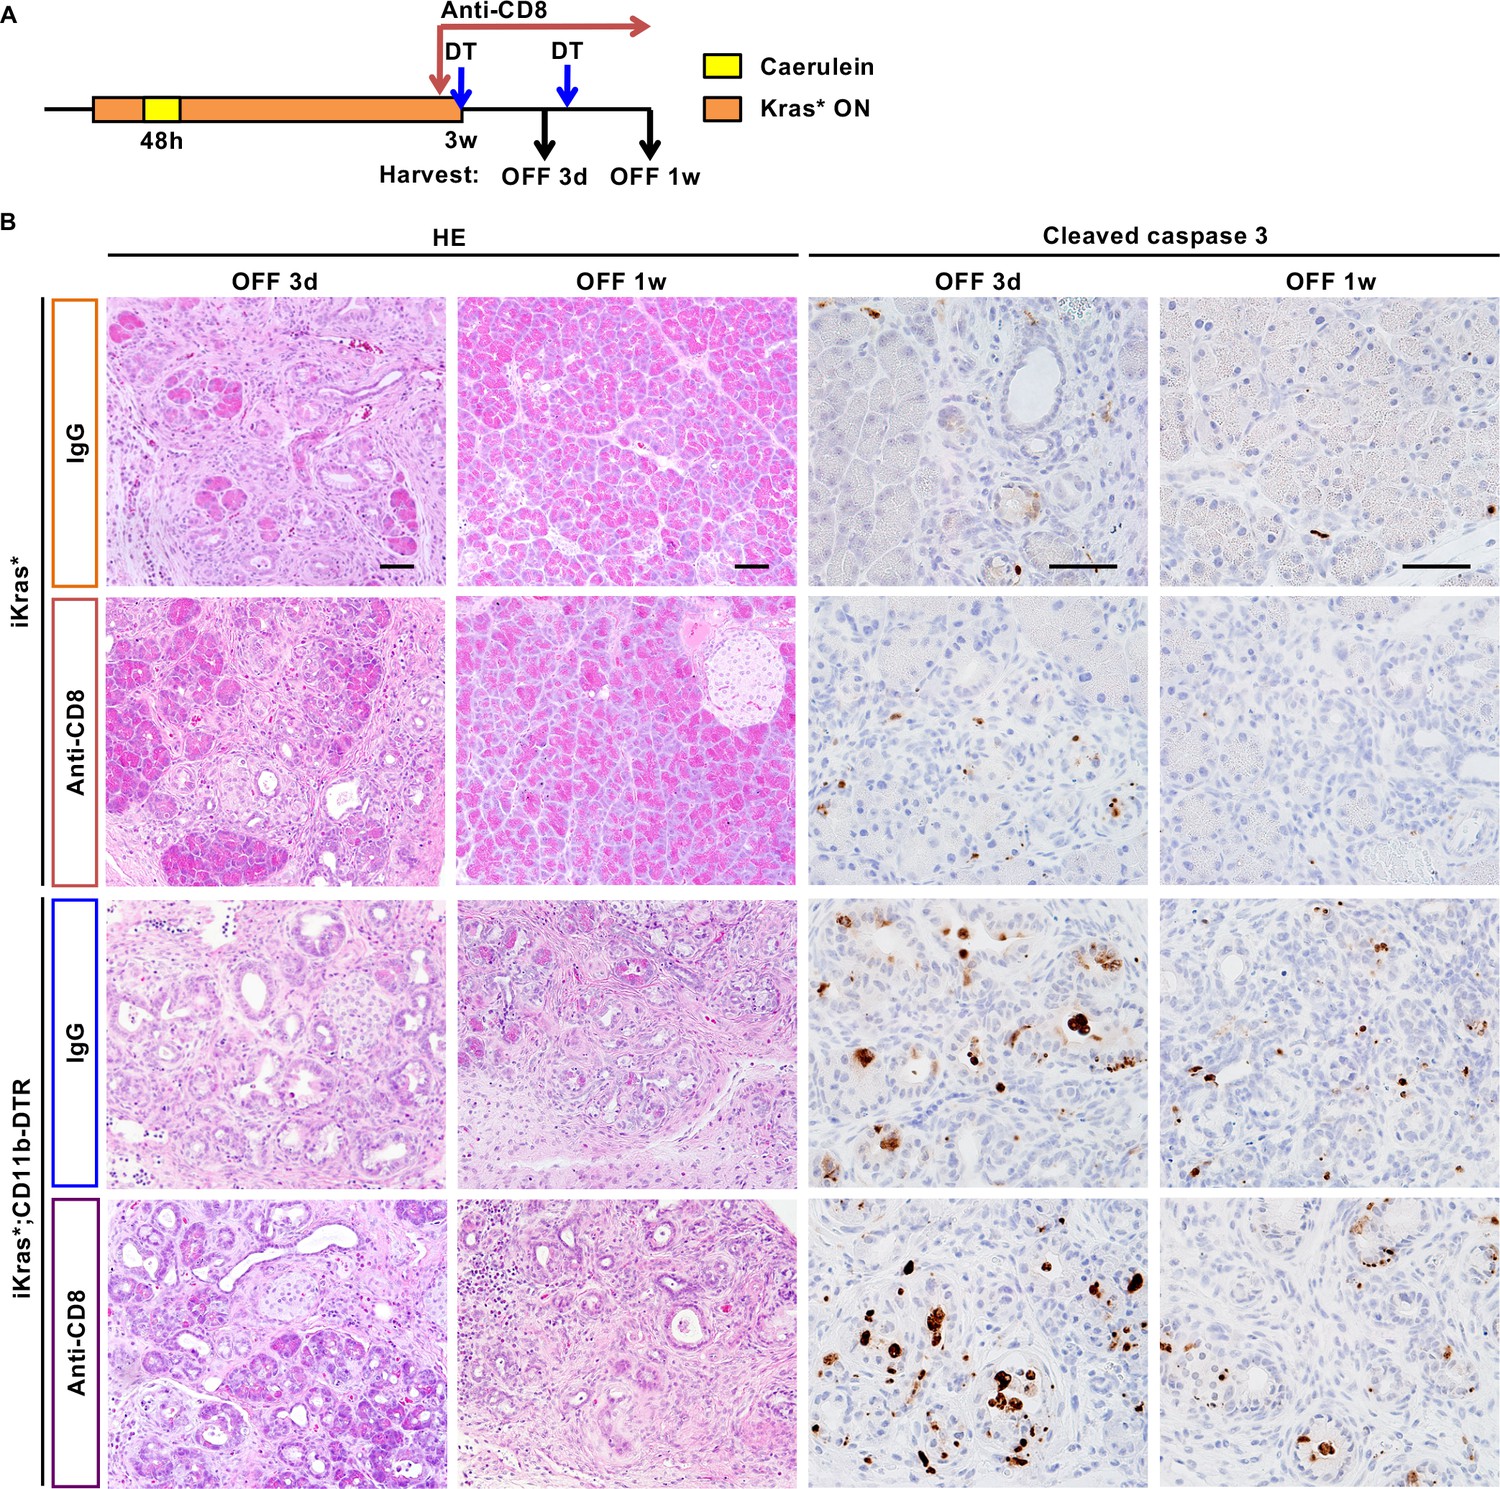
Cell death induced by myeloid cell depletion upon Kras* inactivation is not mediated by CD8+T cells.
(A) Experimental design, n = 2 ~ 7 mice/cohort. (B) H&E staining and immunohistochemistry staining for Cleaved caspase three in iKras* or iKras*;CD11b-DTR pancreata 3 weeks post pancreatitis induction followed by Kras* inactivation, DT treatment, as well as either control IgG or anti-CD8 treatment for 3 days and 1 week. Scale bar 50 µm.
Figure 6 with 1 supplement
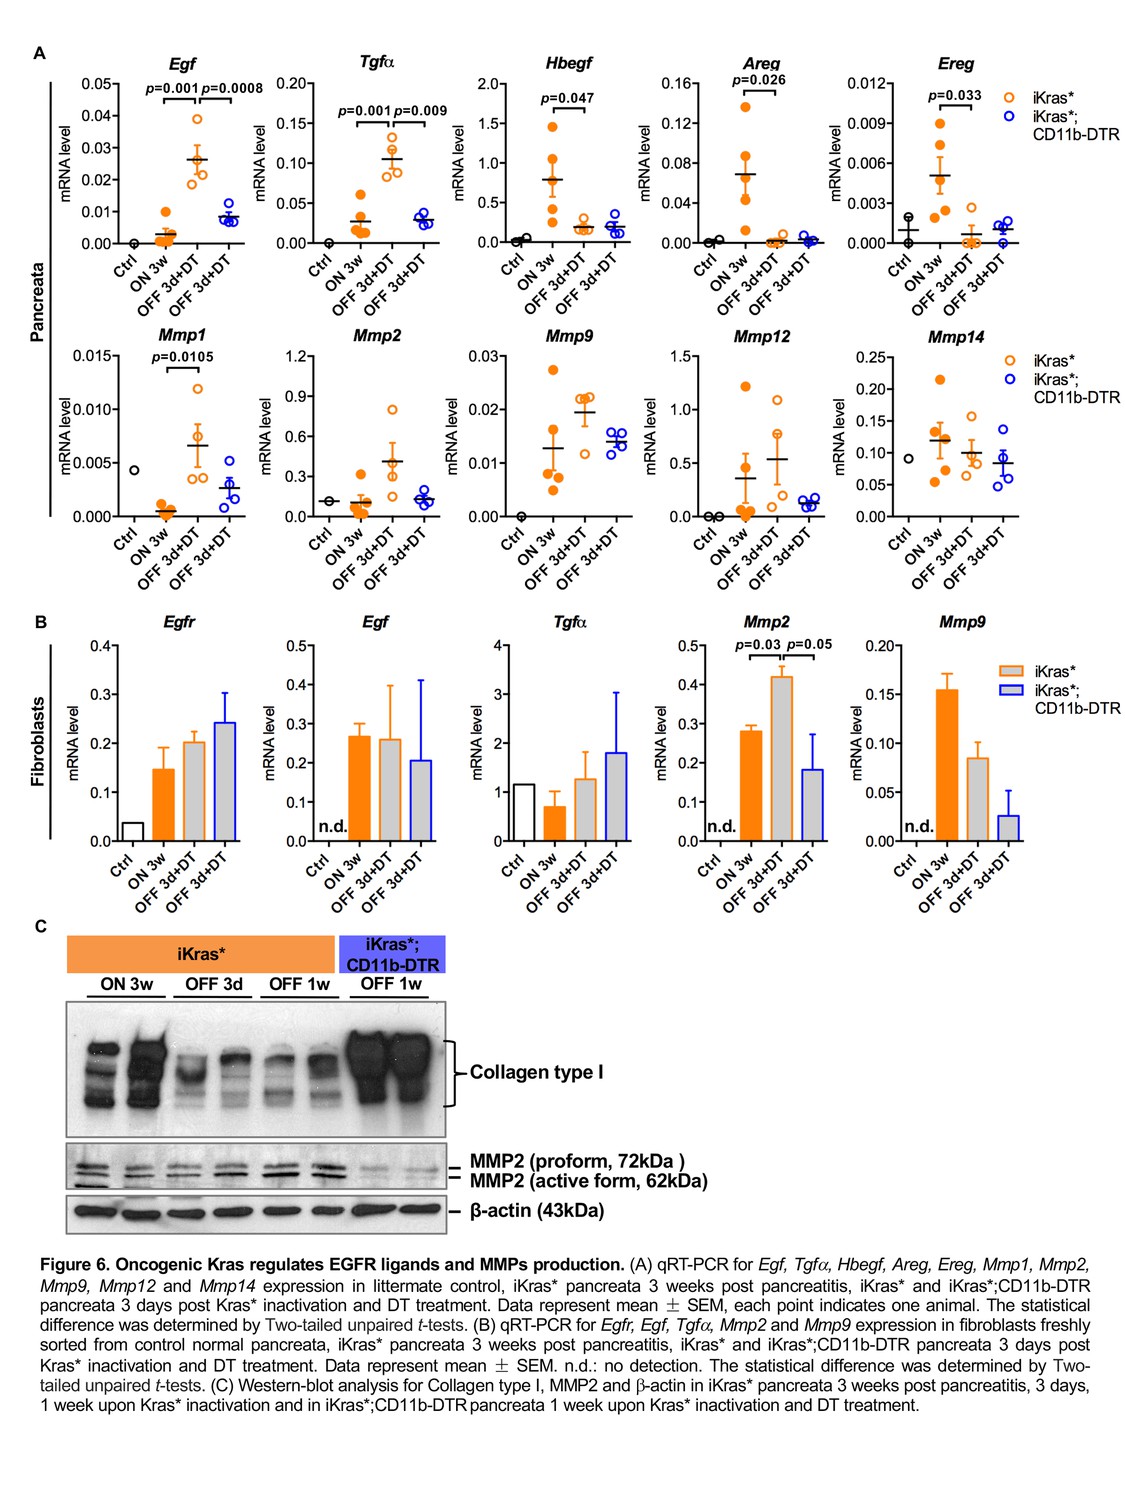
Oncogenic Kras regulates EGFR ligands and MMPs production.
(A) qRT-PCR for Egf, Tgfα, Hbegf, Areg, Ereg, Mmp1, Mmp2, Mmp9, Mmp12 and Mmp14 expression in littermate control, iKras* pancreata 3 weeks post pancreatitis, iKras* and iKras*;CD11b-DTR pancreata 3 days post Kras* inactivation and DT treatment. Data represent mean ± SEM, each point indicates one animal. The statistical difference was determined by Two-tailed unpaired t-tests. (B) qRT-PCR for Egfr, Egf, Tgfα, Mmp2 and Mmp9 expression in fibroblasts freshly sorted from control normal pancreata, iKras* pancreata 3 weeks post pancreatitis, iKras* and iKras*;CD11b-DTR pancreata 3 days post Kras* inactivation and DT treatment. Data represent mean ±SEM. n.d.: no detection. The statistical difference was determined by Two-tailed unpaired t-tests. (C) Western-blot analysis for Collagen type I, MMP2 and β-actin in iKras* pancreata 3 weeks post pancreatitis, 3 days, 1 week upon Kras* inactivation and in iKras*;CD11b-DTR pancreata 1 week upon Kras* inactivation and DT treatment.
Figure 6—figure supplement 1
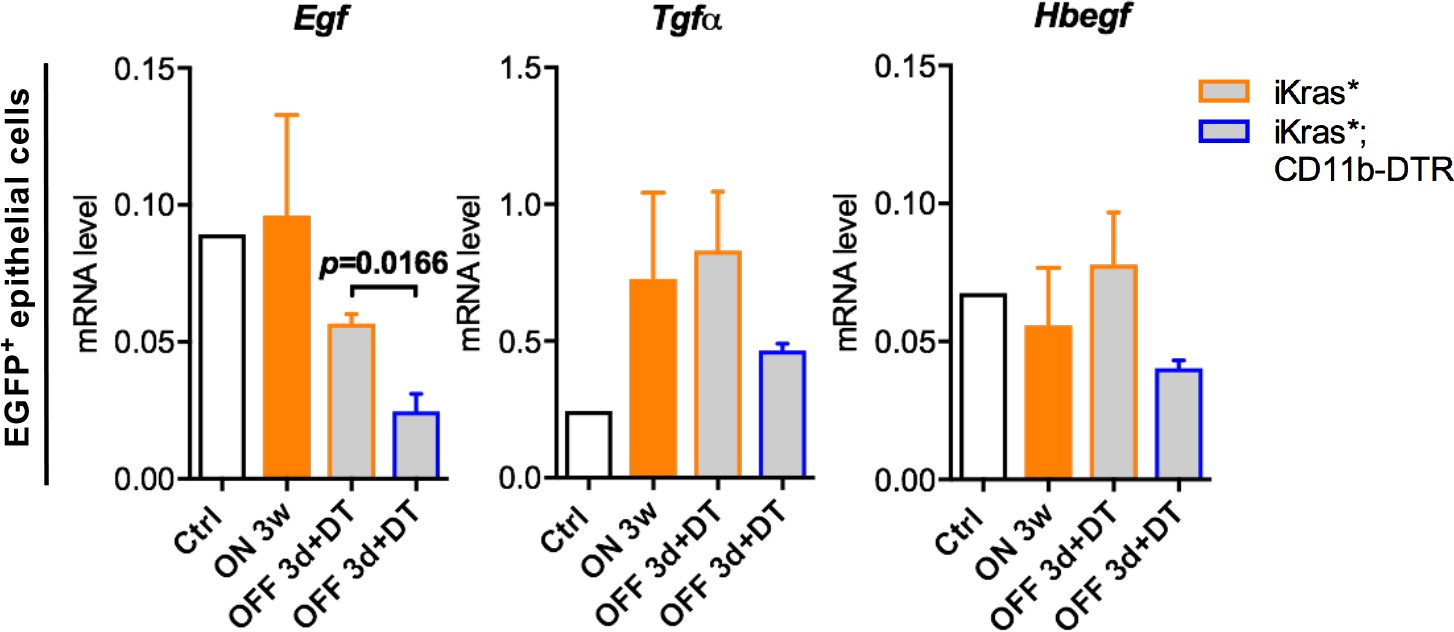
Changes in expression of EGFR ligands in epithelial cells following Kras inactivation.
qRT-PCR for Egf, Tgfα and Hbegf expression in epithelial cells (EGFP+CD45-) freshly sorted from control normal pancreata, iKras* pancreata 3 weeks post pancreatitis, iKras* and iKras*;CD11b-DTR pancreata 3 days post Kras* inactivation and DT treatment. Data represent mean ± SEM. The statistical difference was determined by Two-tailed unpaired t-tests.
Figure 7
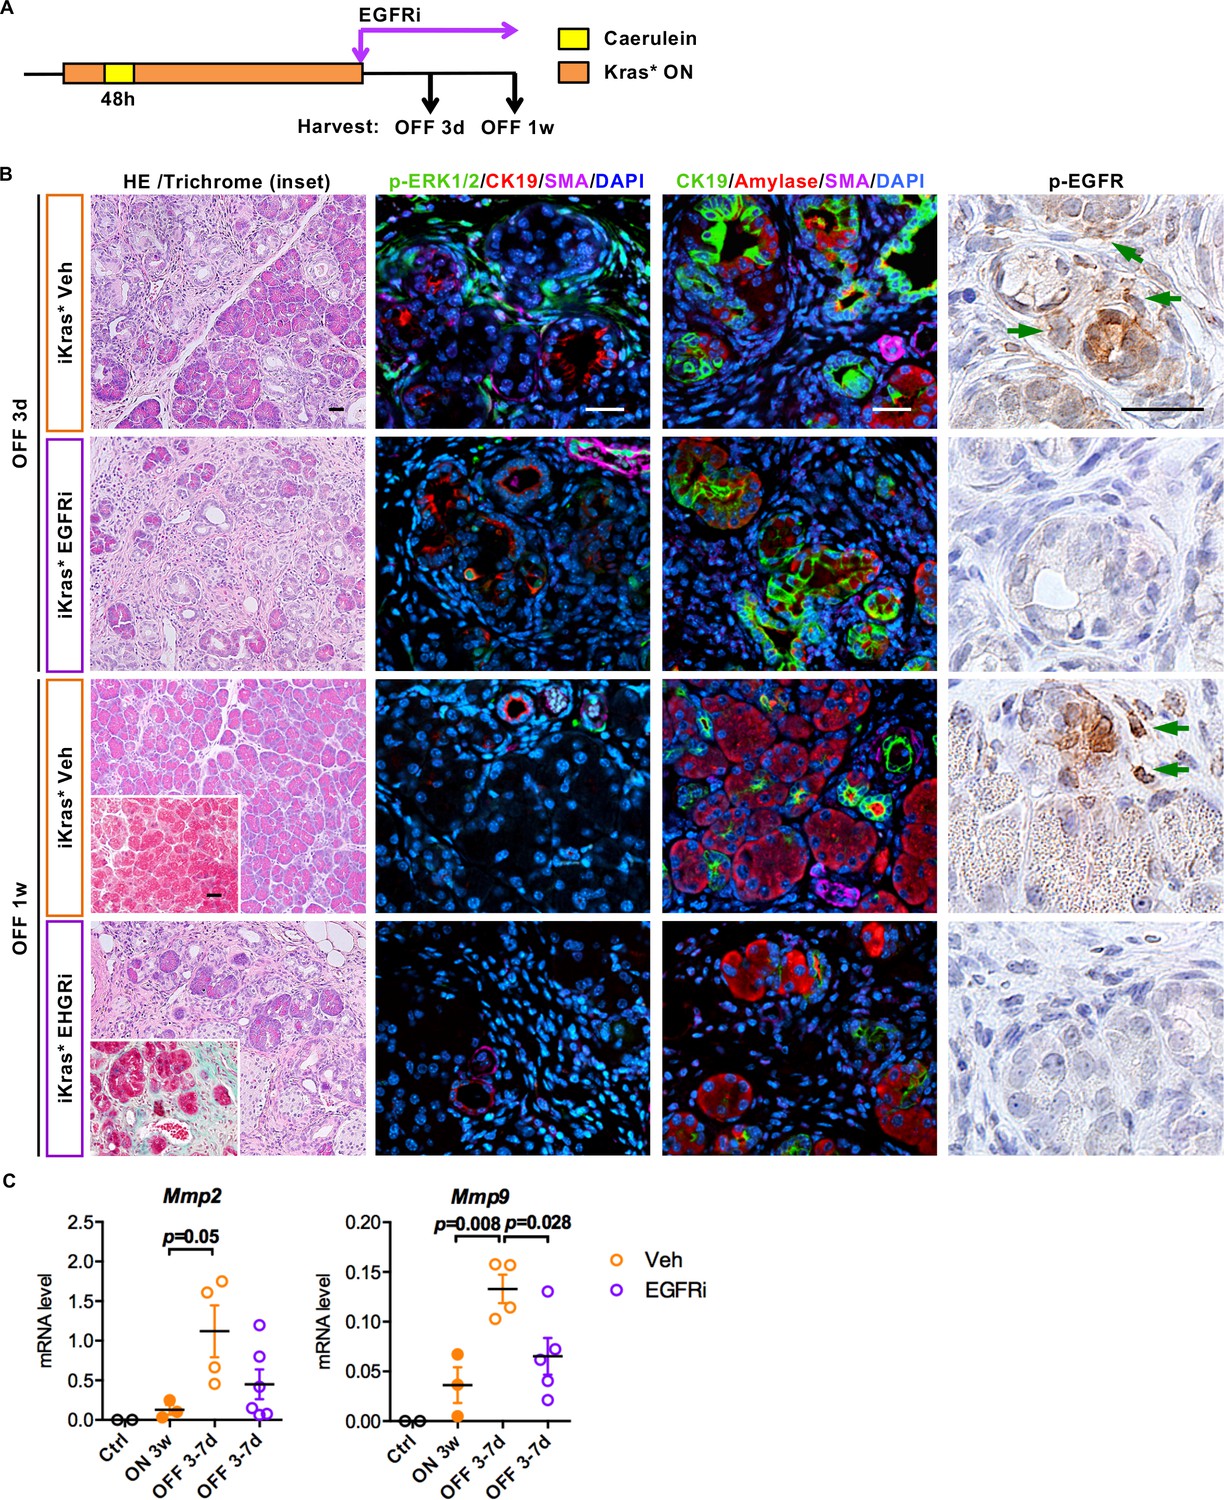
EGFR inhibition impairs ECM remodeling and tissue repair upon Kras* inactivation.
(A) Experimental design, n = 4 ~ 6 mice/cohort. (B) H&E staining, Gomori Trichrome staining (inset), co-immunofluorescent staining for p-ERK1/2 (green), CK19 (red), SMA (magenta) and DAPI (blue), co-immunofluorescent staining for CK19 (green), Amylase (red), SMA (magenta) and DAPI (blue) and immunohistochemistry staining for p-EGFR in iKras* pancreata 3 weeks post pancreatitis induction followed by Kras* inactivation and EGFR inhibitor (EGFRi) treatment for 3 days and 1 week. Scale bar 25 µm. (C) qRT-PCR for Mmp2 and Mmp9 expression in littermate control pancreata, iKras* 3 weeks post pancreatitis, iKras* 3–7 days followed by Kras* inactivation and treated with either vehicle or EGFRi. Data represent mean ± SEM, each point indicates one animal. The statistical difference was determined by Two-tailed unpaired t-tests.
Figure 8
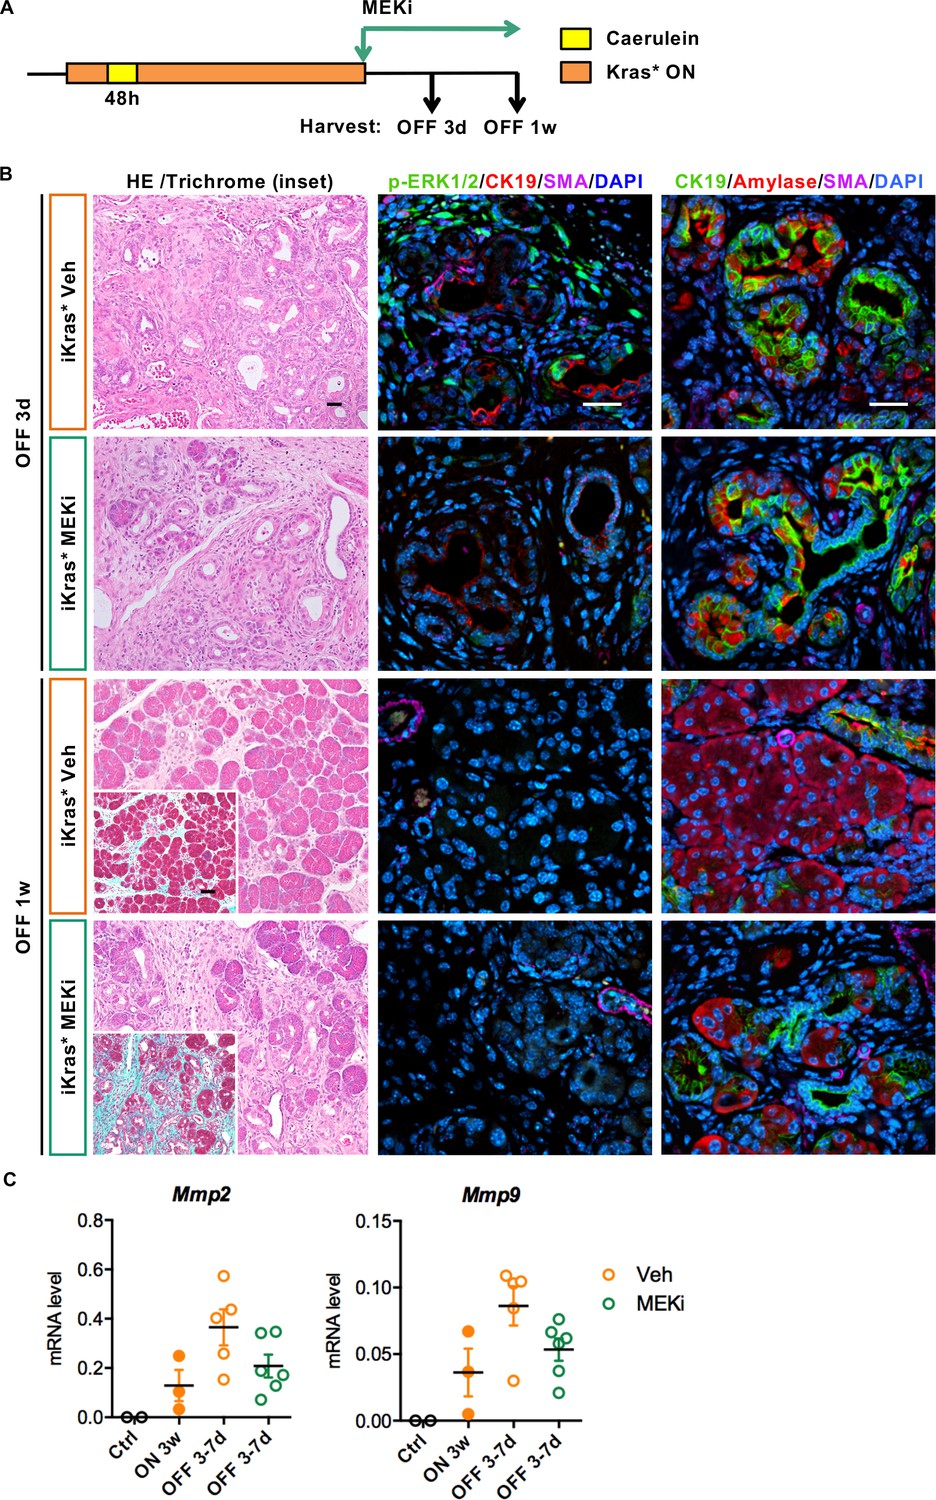
Stroma remodeling upon Kras* inactivation depends on MEK/ERK activity in stroma.
(A) Experimental design, n = 4 ~ 5 mice/cohort. (B) H&E staining, Gomori Trichrome staining (inset), co-immunofluorescent staining for p-ERK1/2 (green), CK19 (red), SMA (magenta) and DAPI (blue) and co-immunofluorescent staining for CK19 (green), Amylase (red), SMA (magenta) and DAPI (blue) in iKras* pancreata 3 weeks post pancreatitis induction followed by Kras* inactivation and MEK inhibitor (MEKi) treatment for 3 days and 1 week. Scale bar 25 µm. (C) qRT-PCR for Mmp2 and Mmp9 expression in littermate control pancreata, iKras* 3 weeks post pancreatitis, iKras* 3–7 days followed by Kras* inactivation and treated with either vehicle or MEKi. Data represent mean ± SEM, each point indicates one animal.
Figure 9
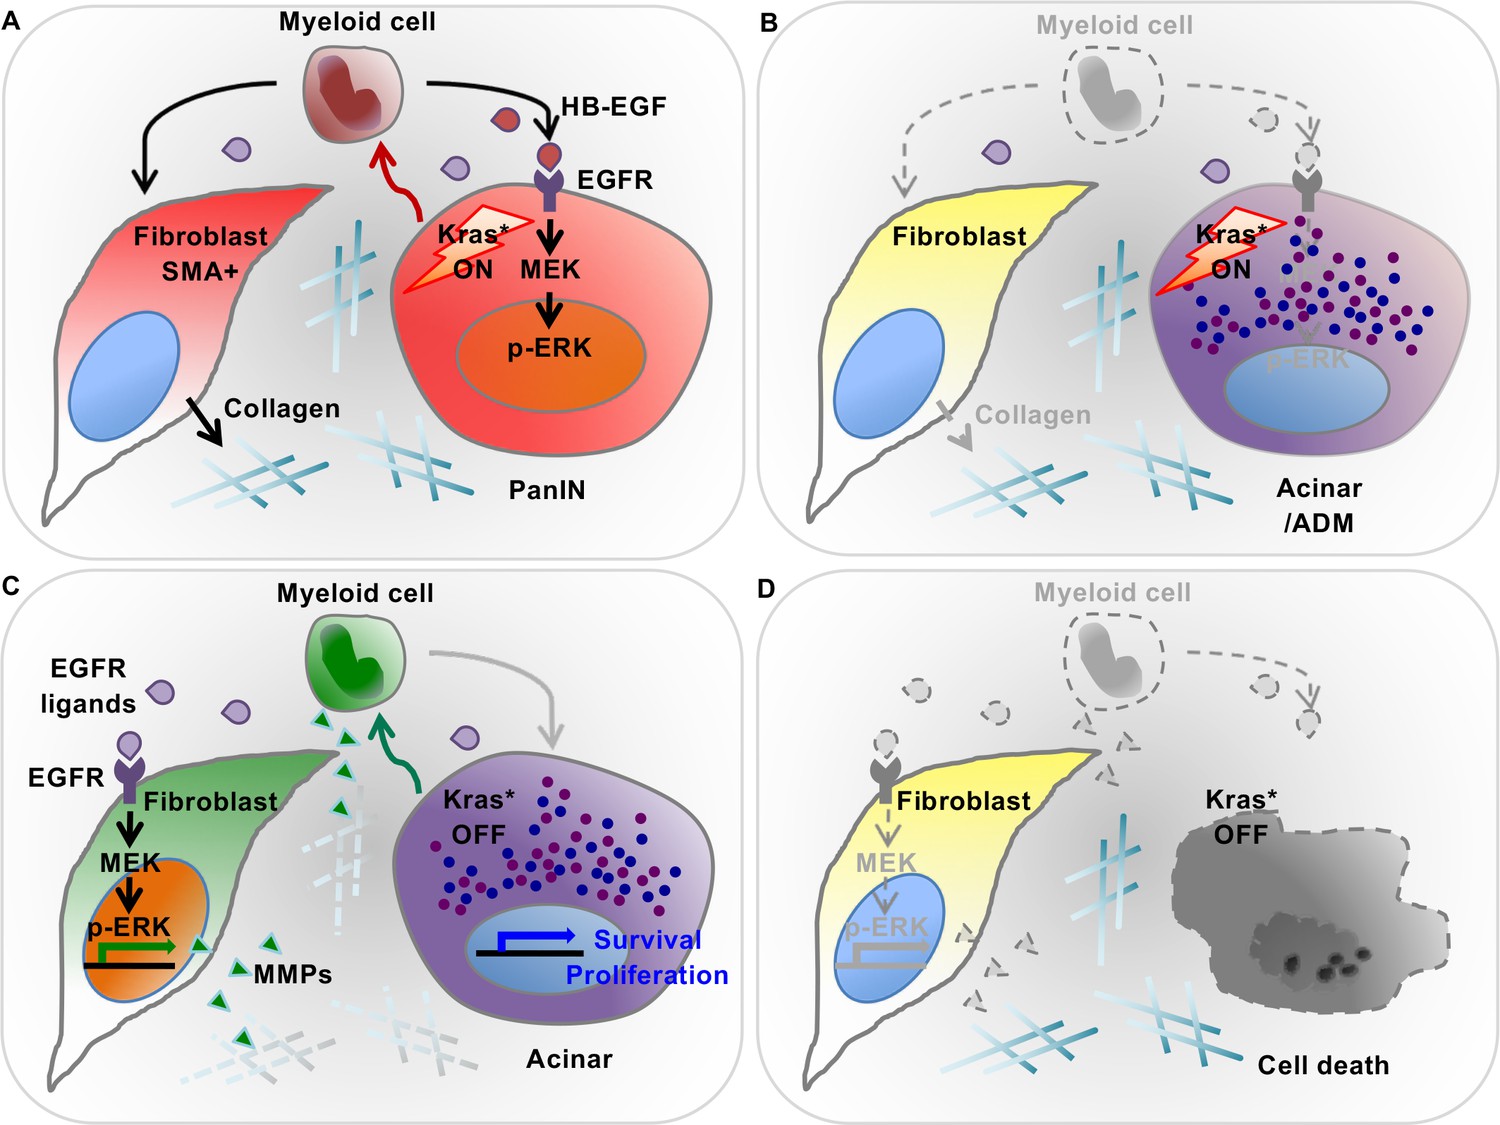
Diagram depicting our working model.
(A) In the presence of epithelial oncogenic Kras expression, myeloid cells are required to maintain high MAPK activity in the epithelial cells themselves, and thus maintain de-differentiation and promote PanIN formation. At the same time, myeloid cells are required for the activation status of stromal fibroblasts. These effects are, at least in part, mediated by secretion of EGFR ligands. Myeloid cells are a source of HB-EGF (maroon drops), which is possibly also secreted by epithelial cells. Further, other EGFR ligands (purple drops) are secreted by cells within the microenvironment. (B) Myeloid cell depletion leads to re-differentiation of PanIN cells and loss of fibroblast activation, notwithstanding continuous expression of oncogenic Kras. (C) Oncogenic Kras inactivation in epithelium redirects myeloid cell polarization and function; thus inducing MAPK activation in fibroblasts to promote extracellular matrix remodeling. (D) Myeloid cell depletion following Kras* inactivation results in impaired pancreatic tissue repair.
Additional files
-
Supplementary file 1
Primary antibodies used in this study
- https://doi.org/10.7554/eLife.27388.020
-
Supplementary file 2
Primer sequences for quantitative RT-PCR
- https://doi.org/10.7554/eLife.27388.021
-
Transparent reporting form
- https://doi.org/10.7554/eLife.27388.022
Download links
A two-part list of links to download the article, or parts of the article, in various formats.
Downloads (link to download the article as PDF)
Open citations (links to open the citations from this article in various online reference manager services)
Cite this article (links to download the citations from this article in formats compatible with various reference manager tools)
Epithelial-Myeloid cell crosstalk regulates acinar cell plasticity and pancreatic remodeling in mice
eLife 6:e27388.
https://doi.org/10.7554/eLife.27388


