Histone H3G34R mutation causes replication stress, homologous recombination defects and genomic instability in S. pombe
- St. Jude Children’s Research Hospital, United States
- Fox Chase Cancer Center, United States
- Icahn School of Medicine at Mount Sinai, United States
- University of Edinburgh, Scotland
Figures
Figure 1 with 2 supplements
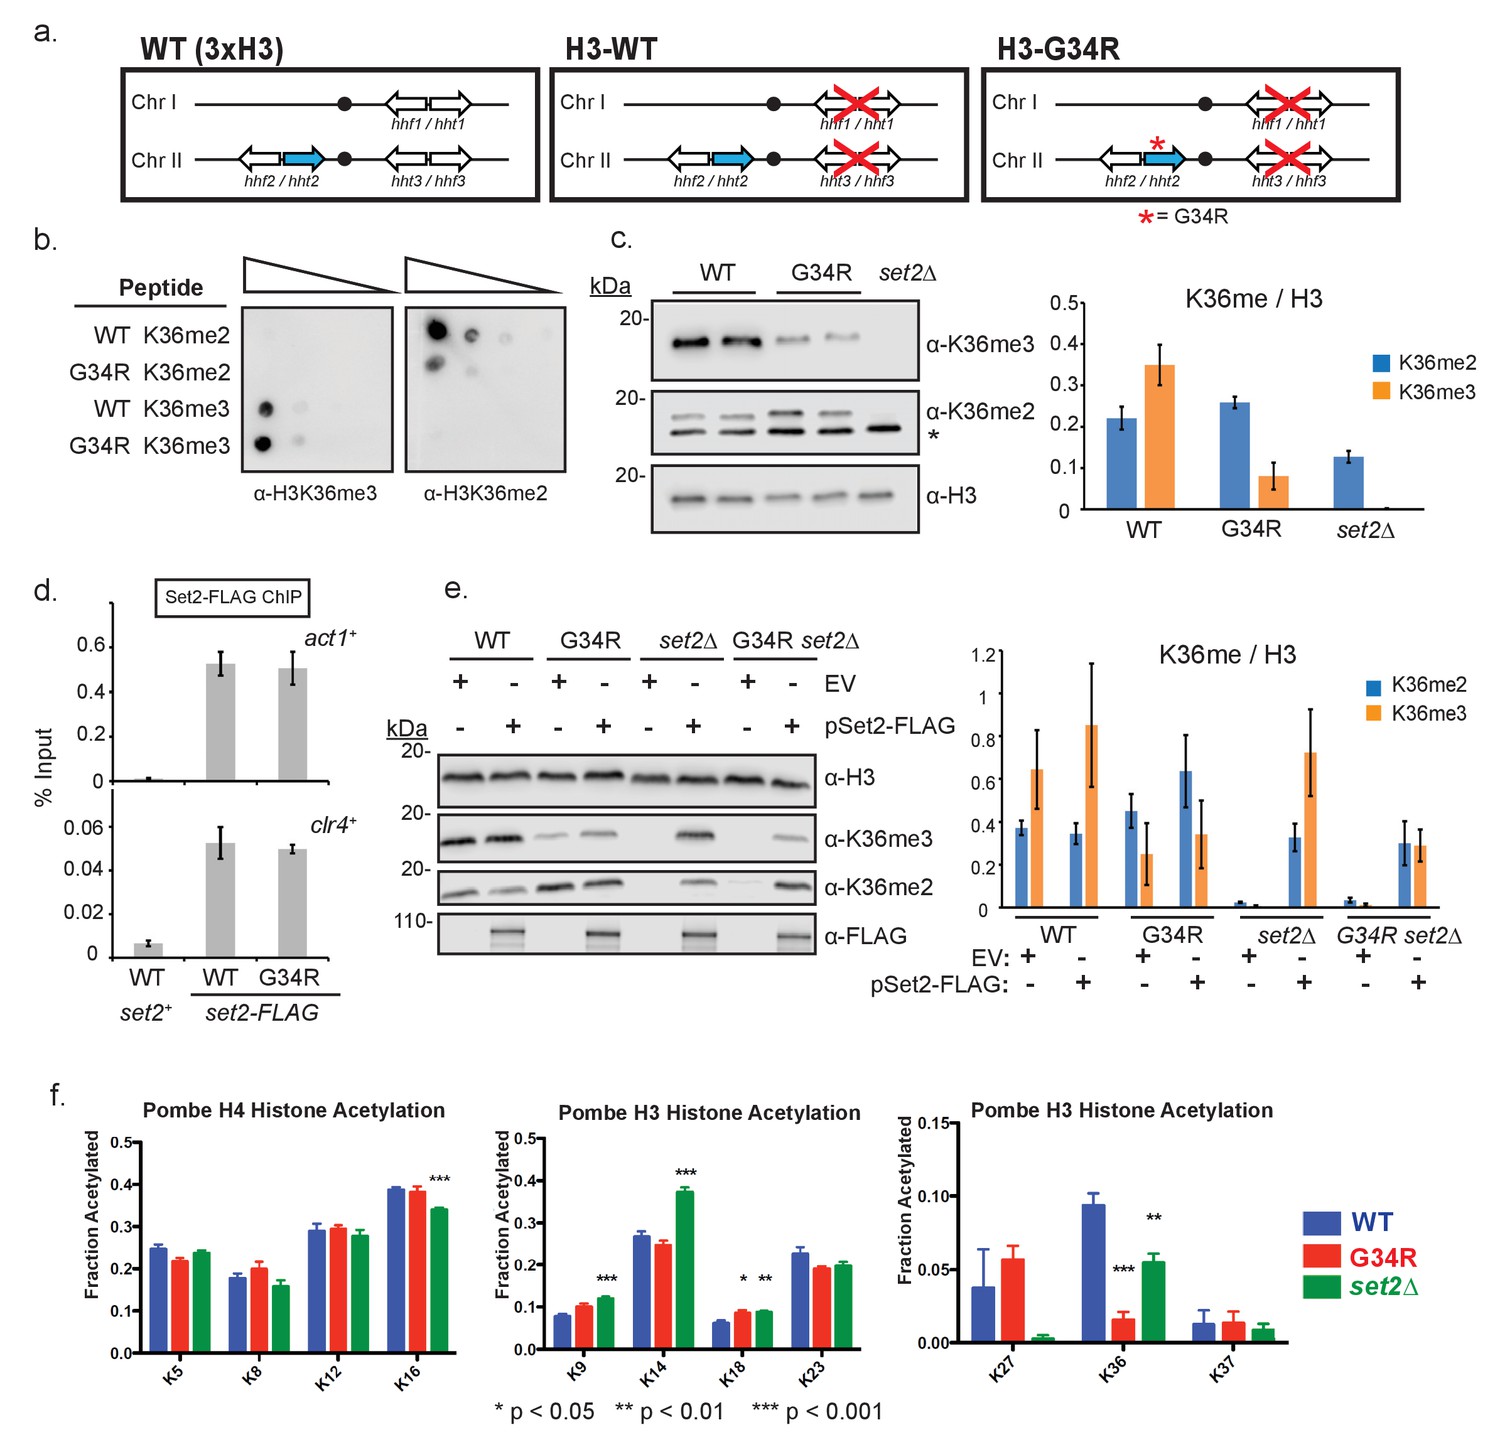
Post translational modification of H3K36 is altered in H3-G34R mutants.
(a) Scheme of the histone H3 (hht) and histone H4 (hhf) genes in S. pombe highlighting the H3 gene (hht2) in which mutations were engineered (blue), and representation of the H3-WT and H3-G34R strains used in this study. (b) Dot blot analysis to quantitatively assess whether Anti-K36 methyl antibodies equivalently recognize WT and G34R peptides with different K36 methyl modifications. (c) Western blot analysis of K36me2, K36me3, and total H3 in H3-WT, H3-G34R and set2Δ cell extracts. Star marks nonspecific band. Replicate westerns were run for K36me2 and K36me3 including 2 biological replicates for H3-WT and H3-G34R strains for quantitation. The mean results for K36me2 or 3 relative to total H3 are displayed on the right. (d) ChIP analysis of Set2-FLAG association with act1+ and clr4+ loci in H3-G34R and H3-WT cells, represented as % of input DNA. Data represent mean ± SEM from 4 experiments. (e) Western blot of K36me2 and K36me3 on overexpression of Set2-3xFLAG or empty vector (EV) in the indicated strains. Total H3 serves as a loading control. Quantitation of 3 sets of western blots from duplicate biological repetitions is shown on the right, with levels of methylated H3K36 normalized to total H3 protein. (f) Mass spectrometry of acetylated lysines in histone H4 and H3 tails in H3-WT, H3-G34R, and set2Δ cells. Data are averaged from triplicate analyses of 3 biological replicates. Please refer to Figure 1—figure supplement 1, and Supplementary files 1 and 2 for additional information in support of Figure 1.
Figure 1—figure supplement 1

Characterization of the H3-G34R mutants.
(a) Clustal W alignment of histone H3 protein sequences for fission yeast (H3pom), human histone H3.3 (product of H3F3A) and histone H3.1 (product of HIST1H3A). The G34 residue mutated in this analysis is depicted in bold. Note that the 1 st methionine is clipped from the final protein product, so numbering starts at the 2nd amino acid. (b) Western blot analysis to compare histone H3 and H4 levels in wildtype (3xH3) and single copy H3/H4 wildtype (H3-WT, labeled as ‘WT’ on figure) cells. Tubulin serves as a loading control, and * indicates a non-specific cross reacting band. Quantification of 2 westerns using 4 biological replicates is on right, showing relative levels of ‘sole copy’ H3 or H4 relative to 3xH3/H4, normalized to tubulin. (c) Western analysis to compare protein expression levels of histone H3 in H3-WT and H3-G34R strains in total extract (WCE) and in cytosolic and chromatin enriched fractions, with tubulin as a loading control. One example is shown of 3 independent replicate experiments (d) Comparative growth assay for 5-fold serially diluted strains grown on plates at different temperatures. mis6-302 is a thermosensitive strain and nda3-KM311 is a cold sensitive strain. Experiment was repeated twice with independent strain isolates (e) Pulse-field gel electrophoresis (PFGE) analysis of fission yeast chromosomes in H3-WT and H3-G34R cells. (f) Dot blot analysis to quantitatively assess whether an independent Anti-H3K36me3 antibody equivalently recognizes WT and G34R peptides with different K36 methyl modifications. (g) Western blot analysis of H3K36me3 in H3-WT, H3-G34R, and set2Δ cells using Ab characterized in (f). Blot was reprobed for total H3 as a loading control. (h) Western analysis of Set2-FLAG expressed from its endogenous locus in H3-WT and H3-G34R cells. Anti-tubulin western serves as a loading control. (i) Western blot analysis monitoring pSet2-FLAG overexpression in untagged and endogenous set2-FLAG tagged H3-WT cells that are transformed with empty vector (EV) or pSET2-FLAG overexpression vector. Ponceau staining serves as a loading control.
Figure 1—figure supplement 2
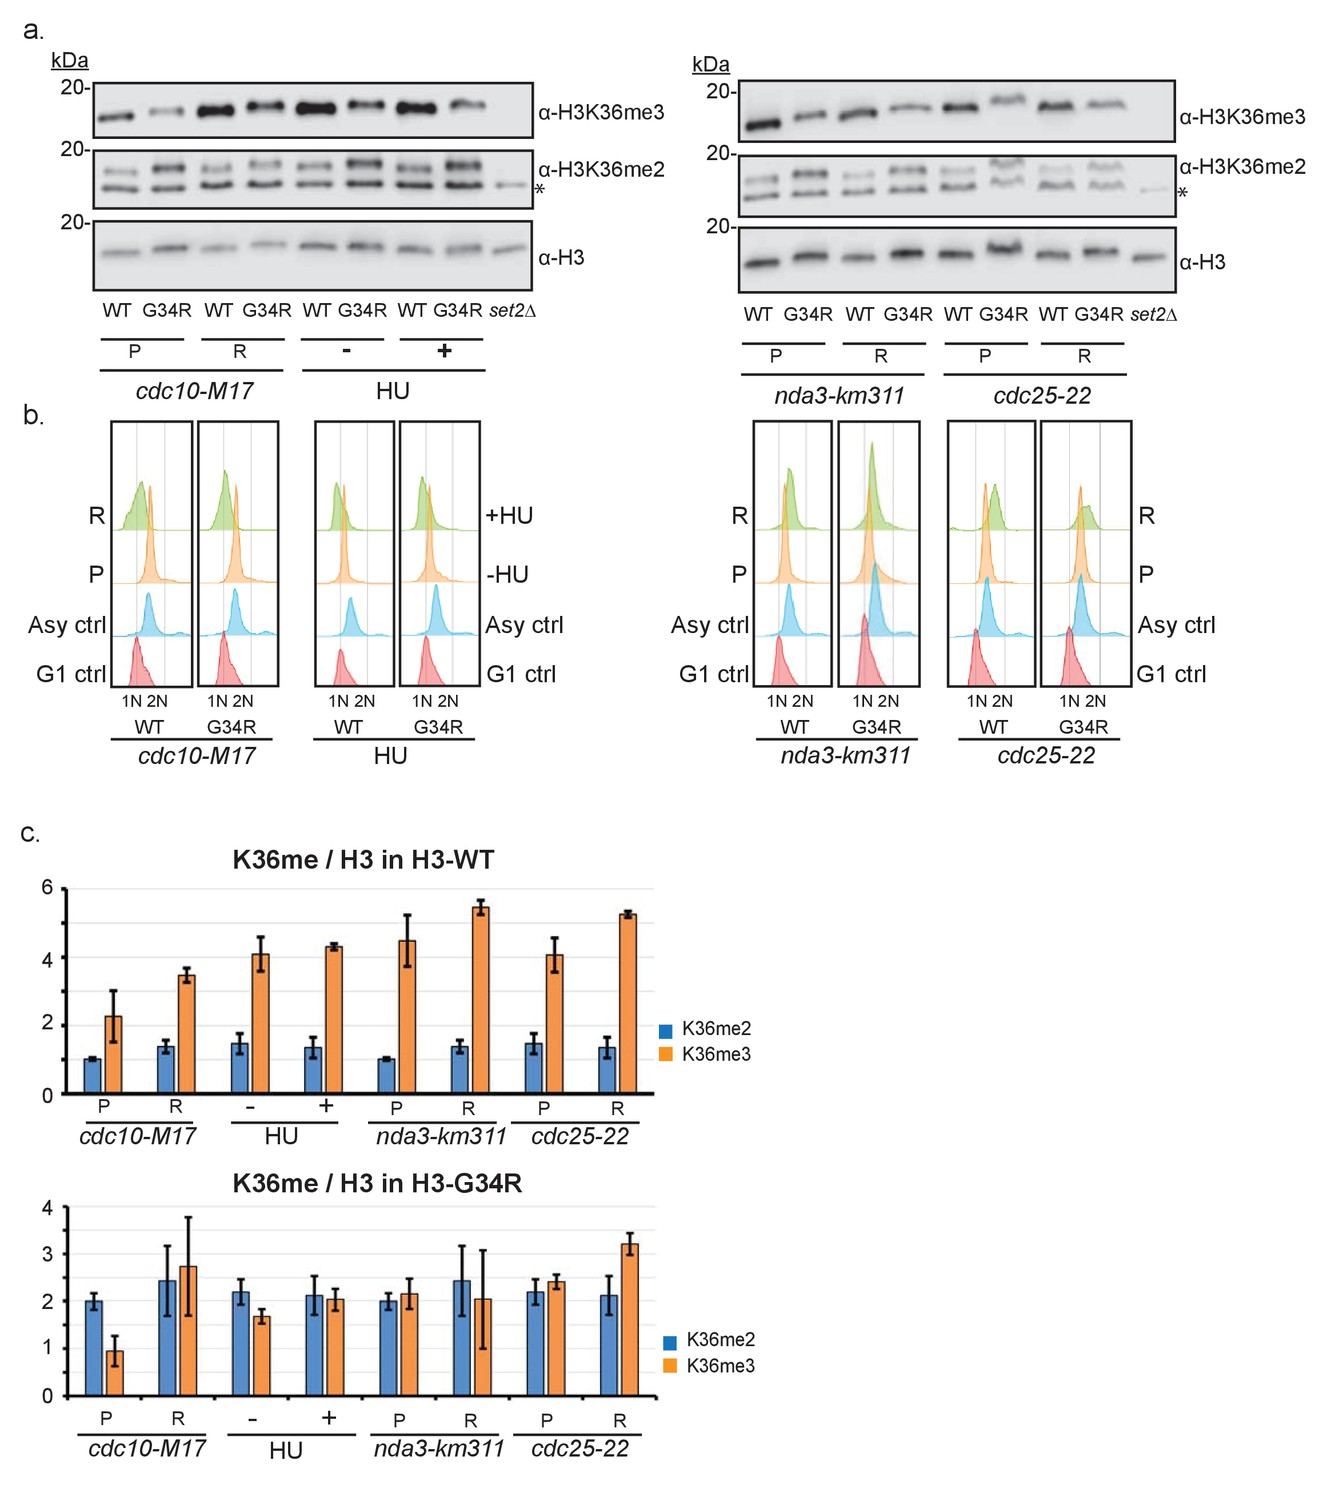
Characterization of cell cycle regulation of H3K36 methylation during the cell cycle.
(a) Thermosensitive cell cycle mutations were incorporated into H3-WT and H3-G34R strains and cells were maintained at permissive temperature (P) or shifted to restrictive temperature (R) before samples were taken for FACS analysis (b) and for protein extraction and western blotting to monitor H3K36me2, H3K36me3 and total H3 levels. Left panel shows analysis of G1 arrested cells (cdc10-M17 mutants arrested at 36°C for 4 hr), S phase arrest mediated by addition (+) of 12 mM HU for 4 hr. * on the K36me2 blot represents a non-specific band that is retained in set2Δ. Right panel shows the results for mitotic arrested cells (nda3-km311) grown at 30°C (P), or arrested (R) at 20°C for 8 hr, and for G2 cells (cdc25-22) arrested (R) at 36°C for 4 hr. (b) FACS analysis of asynchronous (P) or arrested cells (R) stained with sytox green and compared with controls. A single experiment is shown but data was reproduced in 2 biological replicate experiments. (c) Quantitative analysis of duplicate western blots from 2 biological replicates of the experiment outlined in (a). For simplicity, data is split to show results for H3-WT cells in upper panel and H3-G34R cells in lower panel, although data was obtained from westerns such as shown in (a), so direct comparison can be made between the 2 panels.
Figure 2 with 1 supplement
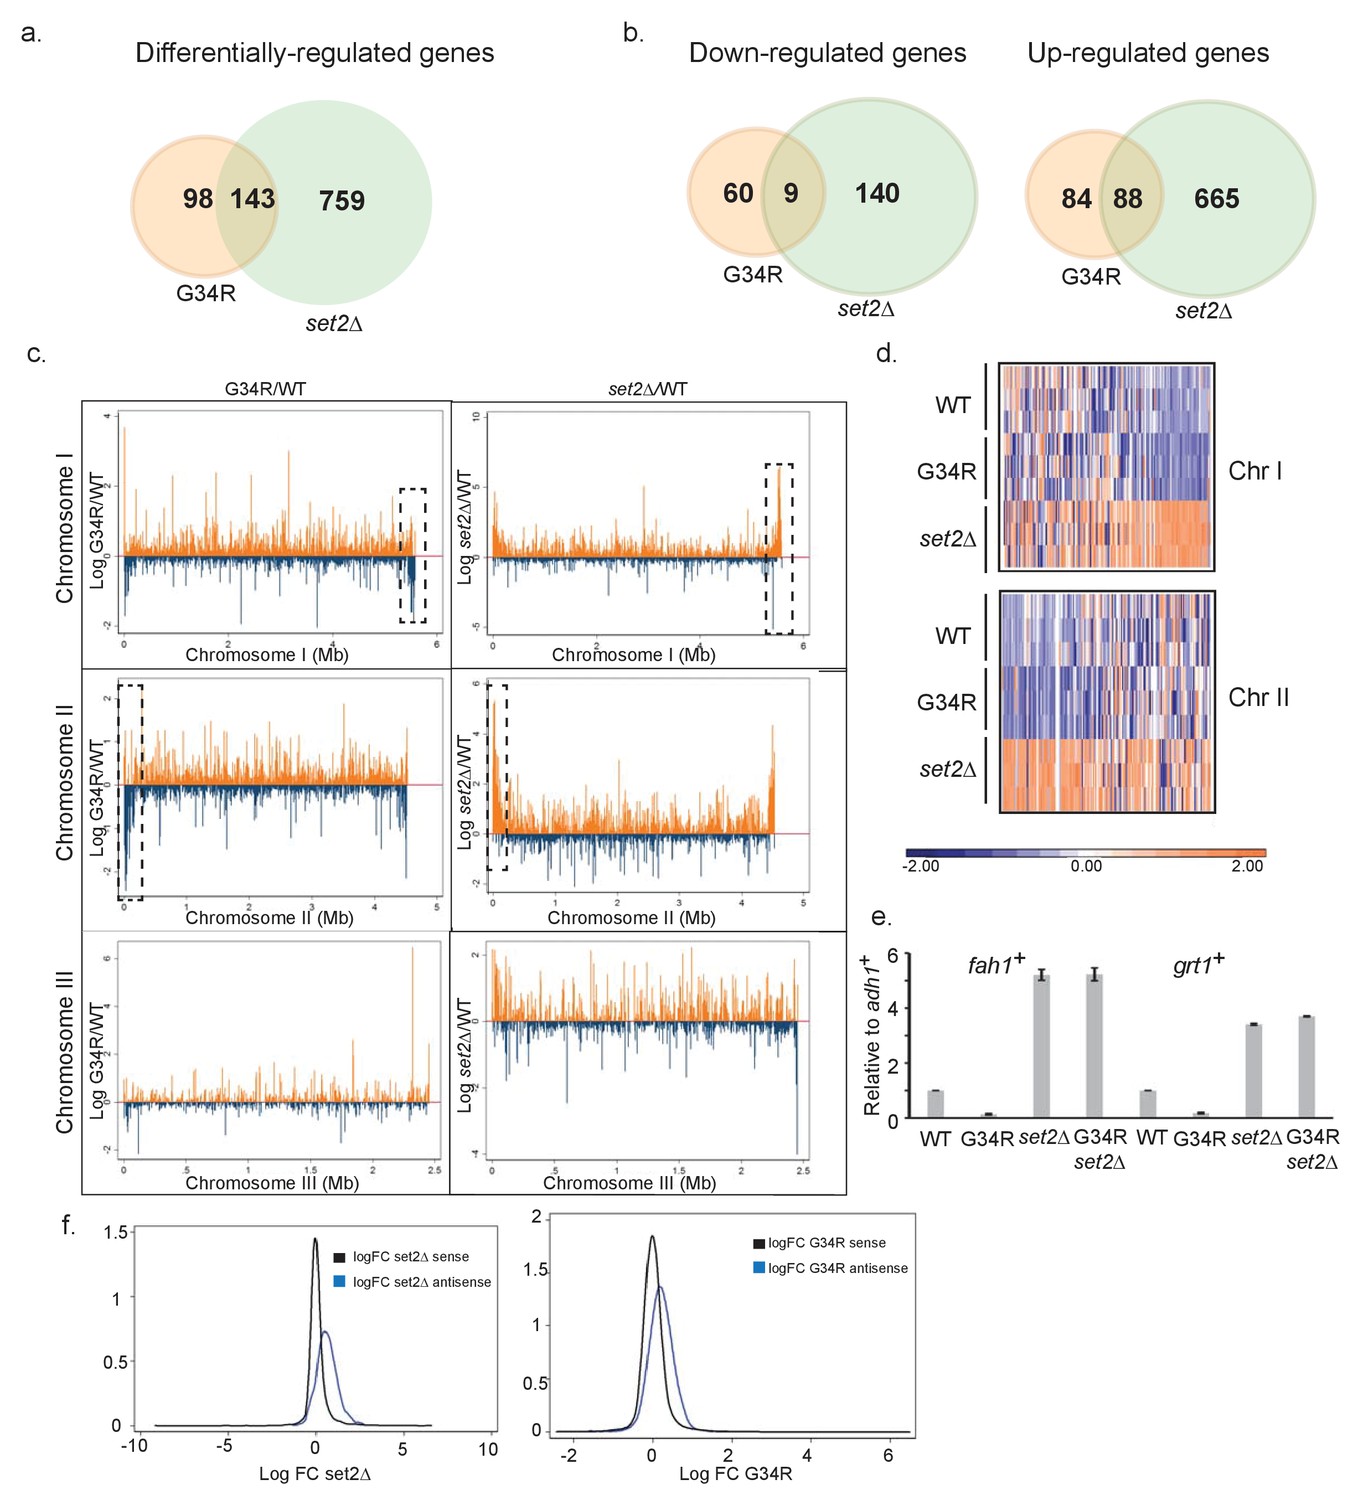
H3-G34R mutants show a distinct transcriptional profile to set2Δ cells.
Schematic of genes that are (a) differentially-regulated, or (b) similarly down-regulated or up-regulated comparing either H3-G34R or set2Δ cells with H3-WT cells in RNA-seq analyses. Triplicate biological replicates were analyzed with cut-offs of 1.5 fold differences in expression, and false discovery rates of 5%. (c) RNA-seq profiles for chromosomes I, II, and III comparing Log fold change ratios for H3-G34R/H3-WT or set2Δ/H3 WT plotted against chromosome coordinates. (d) Zoomed-in regions of RHS Chr I (5.3 Mb-end, top) and LHS Chr II (first 300 Kb, bottom) as depicted in the boxed regions in (c) showing log FC data for individual biological replicates. (e) RT-PCR validation of fah1+ and grt1+ expression relative to adh1+ expression. (f) Density plots of RNA seq reads for sense (black) and antisense transcripts (blue) against log fold change ratios for set2Δ/H3 WT (left) and H3-G34R/H3 WT (right). Please see Figure 2—figure supplement 1 for analysis of heterochromatic loci, and Supplementary file 3 for full RNA-seq analysis results.
Figure 2—figure supplement 1
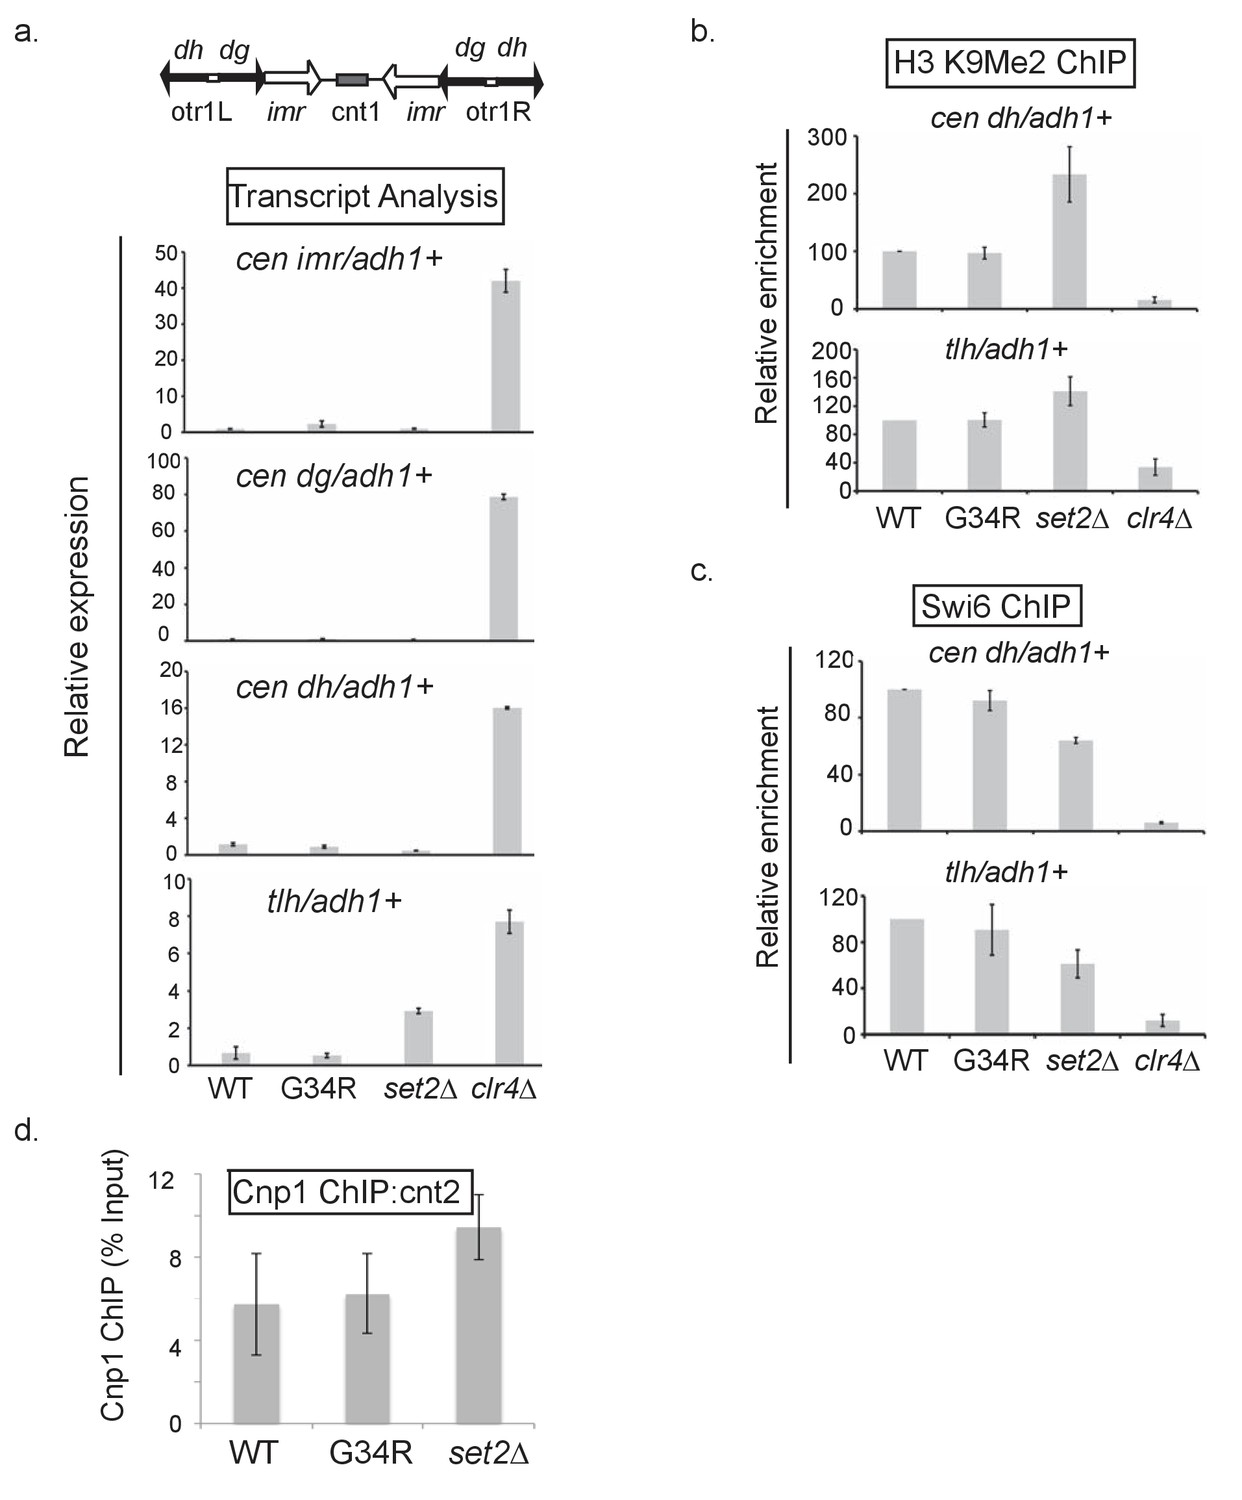
Heterochromatin integrity is maintained in H3-G34R cells.
(a) Real-time (RT) PCR analysis of pericentromeric imr, dg, and dh expression as well as the subtelomeric tlh expression in the indicated strains. Transcripts were compared relative to adh1+ expression. These domains are silenced in WT cells, so clr4Δ cells that lack heterochromatin represent a positive control. Error bars represent SEM from 2 independent experiments. (b) Chromatin immunoprecipitation (ChIP) of H3K9me2 and (c) Swi6 in the indicated cells at either the dh or tlh loci relative to adh1+. Error bars represent SEM from 5 biological replicates. (d) ChIP analysis of the Cnp1 protein to central core sequence cnt2, with ChIP enrichment depicted relative to input material. Data represents 6 biological replicates with error bars representing standard deviation.
Figure 3
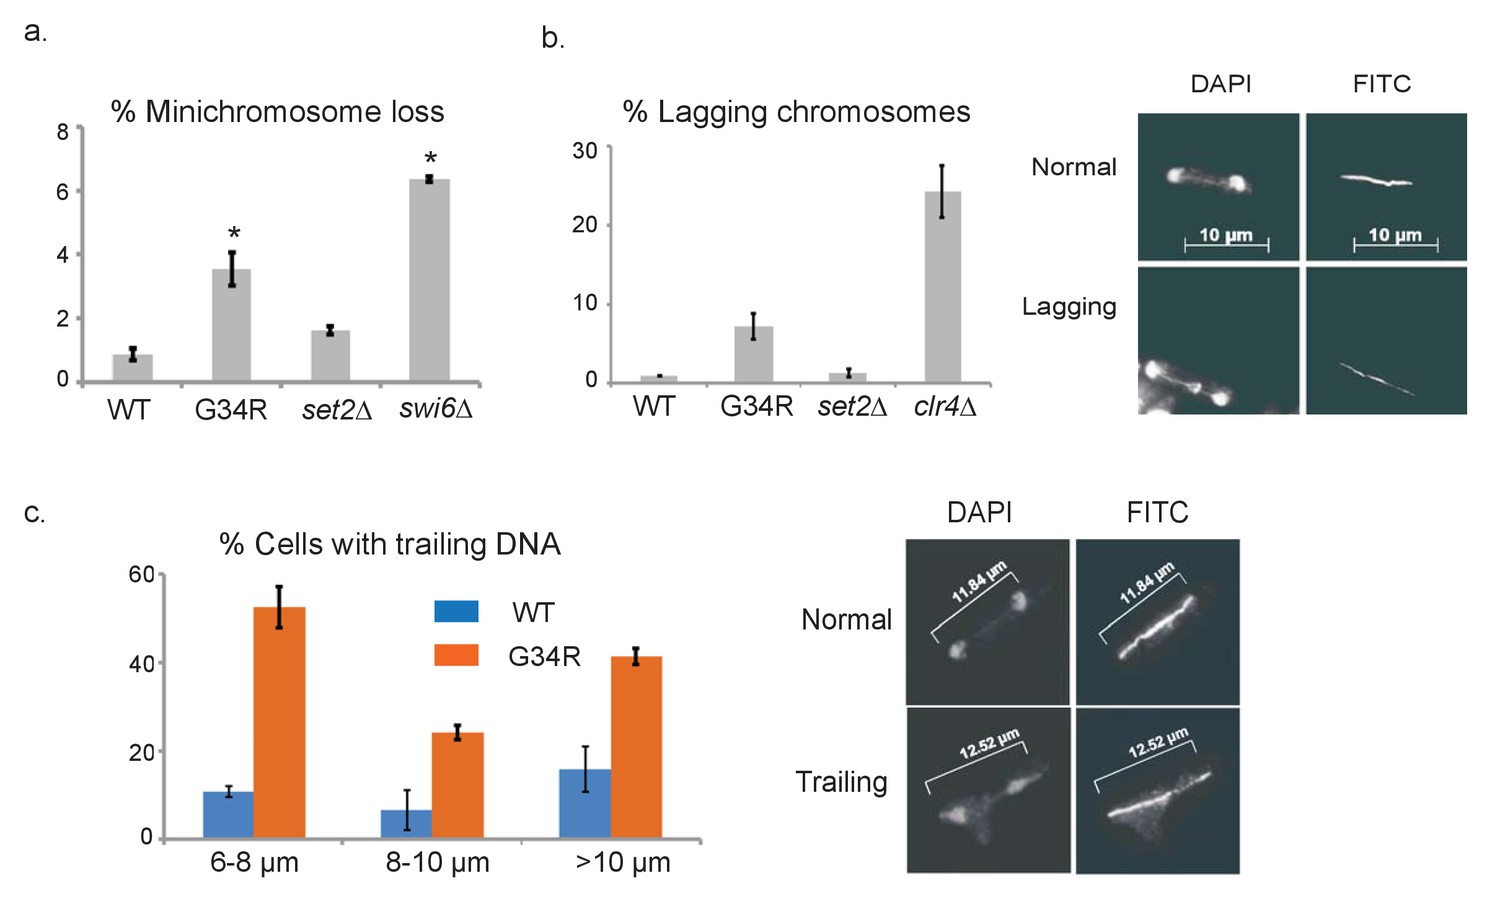
H3-G34R cells exhibit genomic instability.
(a) Frequency of cells that lose the non-essential minichromosome Ch16 in H3-WT, H3-G34R, set2Δ and swi6Δ cells. Asterisk indicates significant difference from H3-WT (p<0.05). Mean ± SEM from 4 experiments shown. (b) Frequency of late anaphase cells that show a lagging chromosome in H3-WT, G34R, set2Δ, and clr4Δ. Mean ± SEM from 2 experiments shown. G34R and clr4Δ have small p values (0.1) although not significantly different from WT (c) Frequency of cells with chromosome segregation defects in H3-WT and H3-G34R cells. Cells were synchronized using nda3-KM311 and chromosome segregation phenotypes were scored in cells with different spindle lengths. Data are represented as mean ± SD from 2 biological replicates. Right panels depict representative images of (b) normal and lagging or (c) ‘trailing’ chromosomes (DAPI = DNA; FITC = tubulin).
Figure 4

H3-G34R mutants show DNA damage sensitivity upon replication stress.
(a) 5-fold serial dilutions showing the effect of methyl methanesulfonate (MMS), camptothecin (CPT), and hydroxyurea (HU) on the indicated strains. (b) Effect of γ−irradiation (IR) exposure on viability of H3-WT, H3-G34R, set2Δ, and rad51Δ cells. Data represent mean ± SEM from 2 biological replicate experiments. (c) Serial dilution assay showing the effect of bleomycin on the indicated strains. (d) Serial dilution assay showing the genotoxin sensitivity of H3-WT, H3-G34R, H3-WT set2Δ, and H3-G34R set2Δ cells upon MMS, CPT, or HU treatment. (e) Genotoxin sensitivity of indicated strains containing either an empty vector (EV) or a vector overexpressing Set2-3xFLAG (pSet2).
Figure 5

H3-G34R cells have intact DNA replication checkpoints.
(a) Scheme depicting major kinases involved in checkpoint control and in brackets, their mammalian homologs. (b) Western blot analysis of γ-H2A phosphorylation in WT, G34R, and set2Δ cells. Cells were collected ±4 hr treatment with 15 mM HU or 0.05% MMS. Total H2A serves as a loading control. (c) Western blot showing Chk1-HA activation. Chk1-HA shows phosphorylation-dependent mobility shift in 0.05% MMS treated H3-WT and H3-G34R cells. Cells with all three H3/H4 genes (3xH3) serve as control. Tubulin is used as a loading control. (d) RPA (Rad11-GFP) immunofluorescence of indicated strains in either untreated conditions or after 6 hr release following 4 hr of 11 mM HU treatment. (e) Immunofluorescence imaging of DAPI stained cells for analysis of checkpoint-dependent cell elongation after treatment with 11 mM HU for 4 hr. Combinations of checkpoint mutants (cds1Δ, chk1Δ, or cds1Δ chk1Δ) with either H3-WT or H3-G34R mutations were assessed.
Figure 6 with 3 supplements
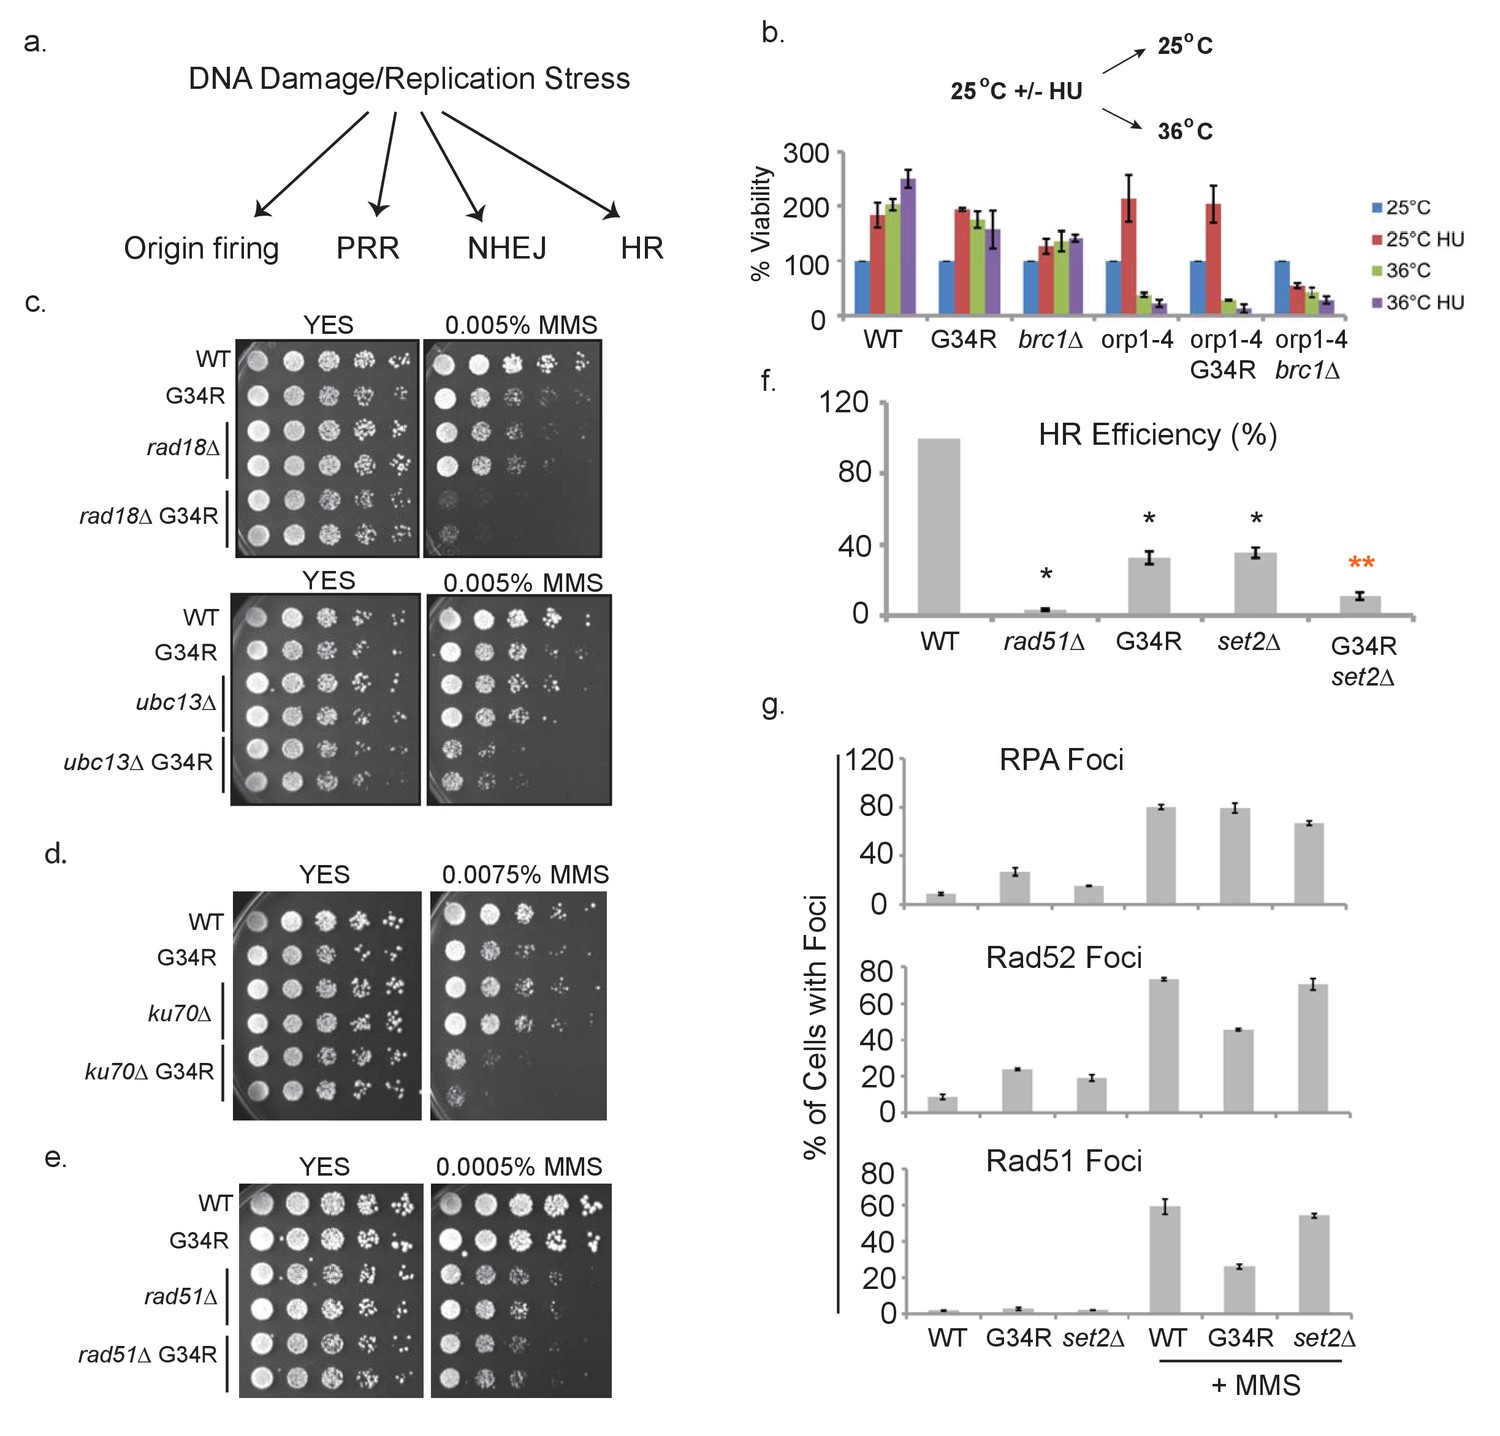
H3-G34R cells show defects in homologous recombination pathways.
(a) Scheme depicting DNA damage repair pathways. (b) Cells of indicated genotypes were cultured at 25°C in the presence or absence of 11 mM HU for 6.5 hr and then washed and either kept at 25°C (permissive) or shifted to 36°C (restrictive) for 4 hr. Cells were then plated at 25°C to determine cell viability. Numbers were normalized to untreated 25°C control values for each genotype, and results were averaged from 2 independent biological replicates. (c–e) Serial 5-fold dilution assays of H3-WT or H3-G34R cells and double mutants with (c) PRR pathway mutants rad18Δ or ubc13Δ, (d) NHEJ mutant ku70Δ or (e) HR mutant rad51Δ plated on media ± MMS treatment. (f) Homologous recombination assay based on correction of leu1-32 mutation by HR. Cells of indicated genotypes were transformed with a leu1 gene fragment to measure HR, or plasmid to measure transformation efficiency. Relative HR efficiency is shown as 100% for H3-WT, and results are averaged from 6 independent experiments with error bars representing SEM. Black asterisks reflect significant differences with H3-WT cells (p<0.05), and red asterisks, significant differences from both H3-G34R and set2Δ (p<0.01). See also Figure 6—figure supplement 1. (g) Percentage of cells that form foci of either RPA (Rad11-GFP), Rad52-GFP, or Rad51 before or after treatment with 0.05% MMS for 4 hr. Immunostaining with GFP antibodies was used for monitoring RPA and Rad52 while anti-Rad51 antibodies were used to detect Rad51. Cells were counted from 2 independent experiments with errors representing SEM. See also images in Figure 6—figure supplements 1 and 2.
Figure 6—figure supplement 1

Characterization of H3-G34R and set2Δ cells in homologous recombination-directed repair.
(a) Schematic illustrating the experimental set up for the HR efficiency assay (see Figure 6f). All cells contained a point mutant in leu1 gene (leu1-32) and were transformed with either plasmid DNA to assess transformation efficiency, or a PCR-generated fragment of the leu1+ gene. Following transformation, colonies that grew on PMG-leu plates were counted since they had undergone HR-directed repair to correct the leu1 gene. HR efficiency was calculated relative to the plasmid transformation efficiency. (b) Efficiency of HR in WT and set2Δ cells with either normal histone complement (3xH3) or sole copy histone complement. Error bars represent SEM using 2 biological replicates. (c) Efficiency of HR in WT or set2Δ or ku70Δ cells with normal histone complement (3xH3). set2Δ cells tested were from (1) Partridge lab or (2) set2ΔKAN or (3) set2Δura4+ from Humphrey lab (Pai et al., 2014). Error bars represent SEM using 2–4 biological replicates.
Figure 6—figure supplement 2
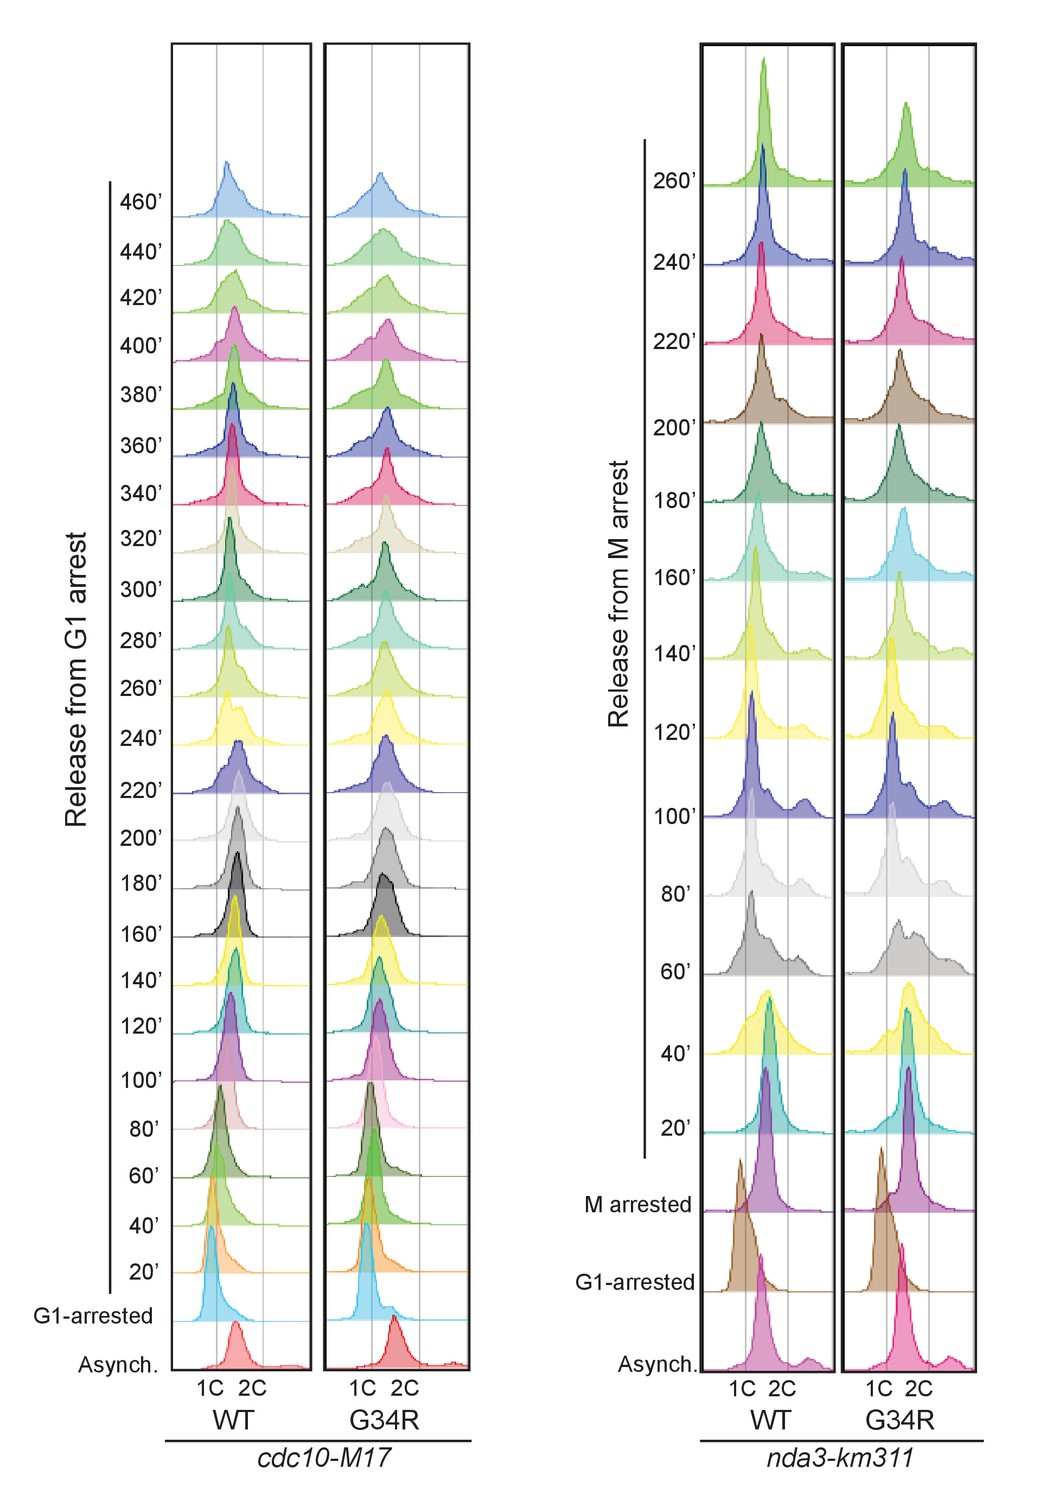
FACS analysis of cdc10-M17 arrested and released cells (G1) on the left, or mitotically arrested and released cells (nda3-km311) on right.
https://doi.org/10.7554/eLife.27406.013
Figure 6—figure supplement 3

Localization of homologous recombination-directed repair proteins in H3-G34R cells.
(a) Representative images showing foci formation of RPA (Rad11-GFP) or Rad52-YFP in either H3-WT or H3-G34R backgrounds. Cells were either treated in the presence (right) or absence (left) of 0.05% MMS for 4 hr prior to imaging. Experiment was repeated twice. (b) Western blot analysis depicting the total levels of Rad51 and Rad52 in either H3-WT or H3-G34R cells before and after treatment with 0.05% MMS for 4 hr. Cells lacking rad51 or containing the rad52-YFP allele serve as antibody-specificity controls. Blots were reprobed for total H2A which serves as a loading control. One example is shown of duplicate experiments. (c) Representative images depicting foci formation and co-localization of RPA (Rad11-GFP) and Rad52-YFP in either H3-WT or H3-G34R backgrounds before (left) or after treatment with 0.05% MMS for 4 hr (right). Errors represent the SEM from two independent experiments. (d) RPA localization during mitosis. cdc10-m17 cells carrying Rad11-GFP (RPA-GFP) in H3-G34R background were arrested in G1 and released at 25°C before fixation. Representative cells from 150 min after release with ultrafine anaphase bridges labeled by RPA-GFP are shown.
Figure 7

H3-G34R mutants exhibit delayed recovery from replicative stress.
(a) Cell proliferation of H3-WT, H3-G34R, and cds1Δ cells was analyzed after synchronization in 11 mM HU for 4 hr. Cells were counted at 30 min intervals following release. Results represent average of 2 independent experiments, with error bars reflecting SEM (H3-WT and H3-G34R) and a single cds1Δ experiment. (b) Measure of EdU labeling of newly synthesized DNA. Cells were modified to incorporate nucleotide analogs. WT and G34R cells were synchronized in 11 mM HU for 4 hr and released into fresh media containing EdU and collected and ethanol fixed over a time course. EdU was labeled by ClickIT with Alexa Fluor 488 and samples were analyzed by FACS, gating on cells that fully incorporated EdU. Assay was performed twice, and each sample was read three times. Data from one experiment is shown, with values representing means of triplicate reads with background from control samples subtracted. Error bars represent SD. (c–d) Time course to analyze (c) γH2A by western blotting or (d) Rad52 (Rad52-GFP) foci formation in H3-WT and H3-G34R cells during treatment with 0.05% MMS and recovery. For (d), error bars represent SEM for 2 independent experiments, and the time course for γH2A westerns was repeated twice.
Figure 8
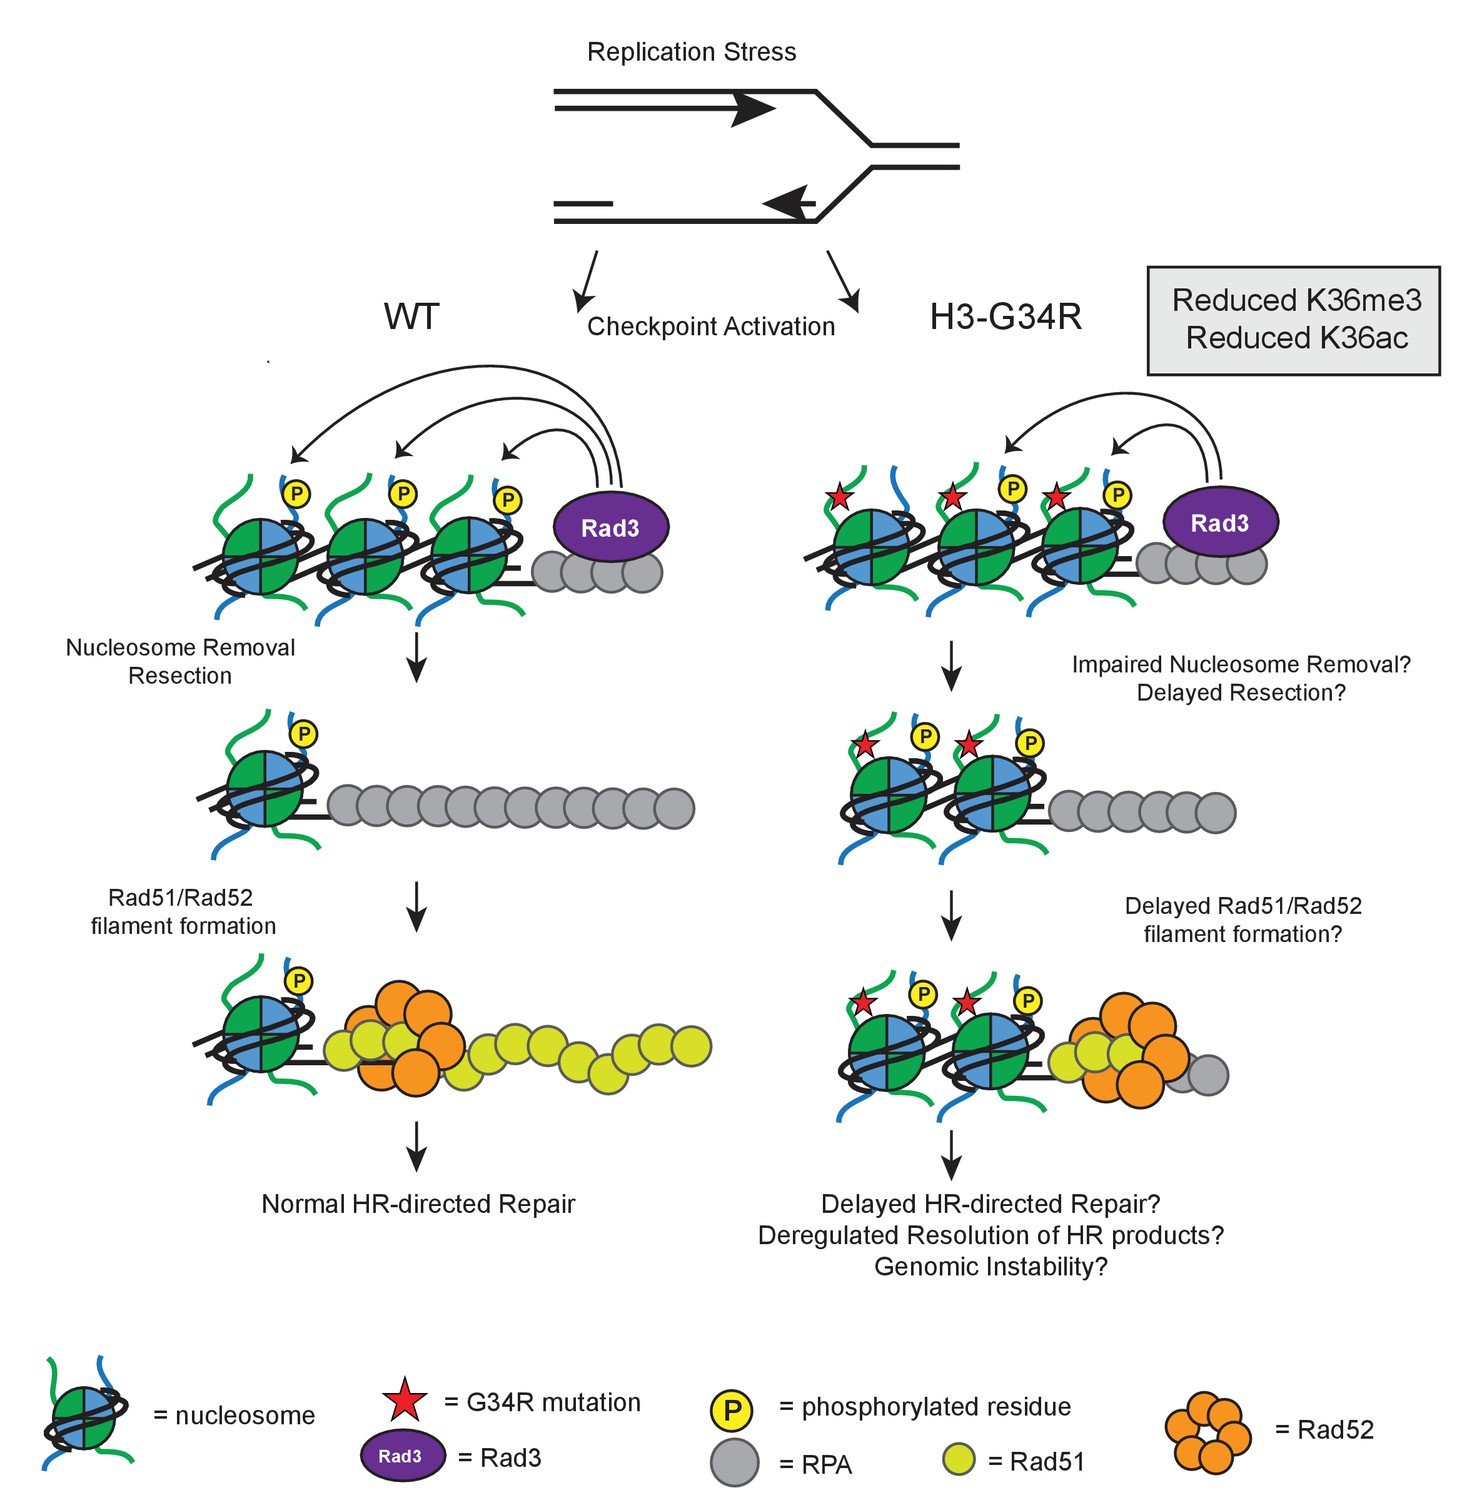
Model illustrating how HR defects in H3-G34R mutants may compromise genomic integrity.
Model illustrates the key defects in H3-G34R cells and how these may contribute to genomic instability. Replication forks provide an endogenous source of DNA damage, as they are fragile structures that are prone to stalling and collapsing. (left) To cope with replication stress, cells activate the checkpoint signaling pathway by sensing ssDNA via Rad3. Rad3 interacts with ssDNA through RPA and phosphorylates H2A, which helps to transduce the checkpoint response to downstream kinases. For lesions that require HR-directed repair, nucleosome removal and subsequent 5’ to 3’ DNA resection exposes ssDNA which is initially coated with RPA, and then replaced by Rad51, facilitated by the Rad52 protein. The search for a homologous template can begin once sufficient Rad51-ssDNA filament has been formed and strand invasion of the Rad51-ssDNA filament generates Holiday junctions which need to be resolved prior to cell division. (right) In H3-G34R cells, HR is defective. Checkpoint signaling is functional, but appears delayed with slower accumulation of γH2A possibly due to impaired nucleosome removal and delayed resection, which would limit the amount of Rad3 on RPA/DNA. Retention of γH2A indicates a defect in nucleosome removal and resection which in turn, could account for the delayed Rad52 foci formation in H3-G34R cells and likely delayed Holiday junction resolution following repair. H3-G34R cells show elevated chromosome segregation defects without defects in heterochromatin or kinetochore chromatin, suggestive that a delayed resolution of HR products contributes to genomic instability.
Additional files
-
Supplementary file 1
Peptides used for antibody characterization and mass spectrometry calibration.
- https://doi.org/10.7554/eLife.27406.017
-
Supplementary file 2
Detection parameters of unique tryptic peptides from S. pombe H3.
- https://doi.org/10.7554/eLife.27406.018
-
Supplementary file 3
Gene expression changes in H3-G34R and set2Δ relative to H3-WT.
- https://doi.org/10.7554/eLife.27406.019
-
Supplementary file 4
S. pombe strains.
- https://doi.org/10.7554/eLife.27406.020
-
Supplementary file 5
Primers used for real time PCR analyses
- https://doi.org/10.7554/eLife.27406.021
Download links
A two-part list of links to download the article, or parts of the article, in various formats.
Downloads (link to download the article as PDF)
Open citations (links to open the citations from this article in various online reference manager services)
Cite this article (links to download the citations from this article in formats compatible with various reference manager tools)
Histone H3G34R mutation causes replication stress, homologous recombination defects and genomic instability in S. pombe
eLife 6:e27406.
https://doi.org/10.7554/eLife.27406


