Transcription of a 5’ extended mRNA isoform directs dynamic chromatin changes and interference of a downstream promoter
- The Francis Crick Institute, United Kingdom
- University of California, Berkeley, United States
Figures
Figure 1 with 1 supplement
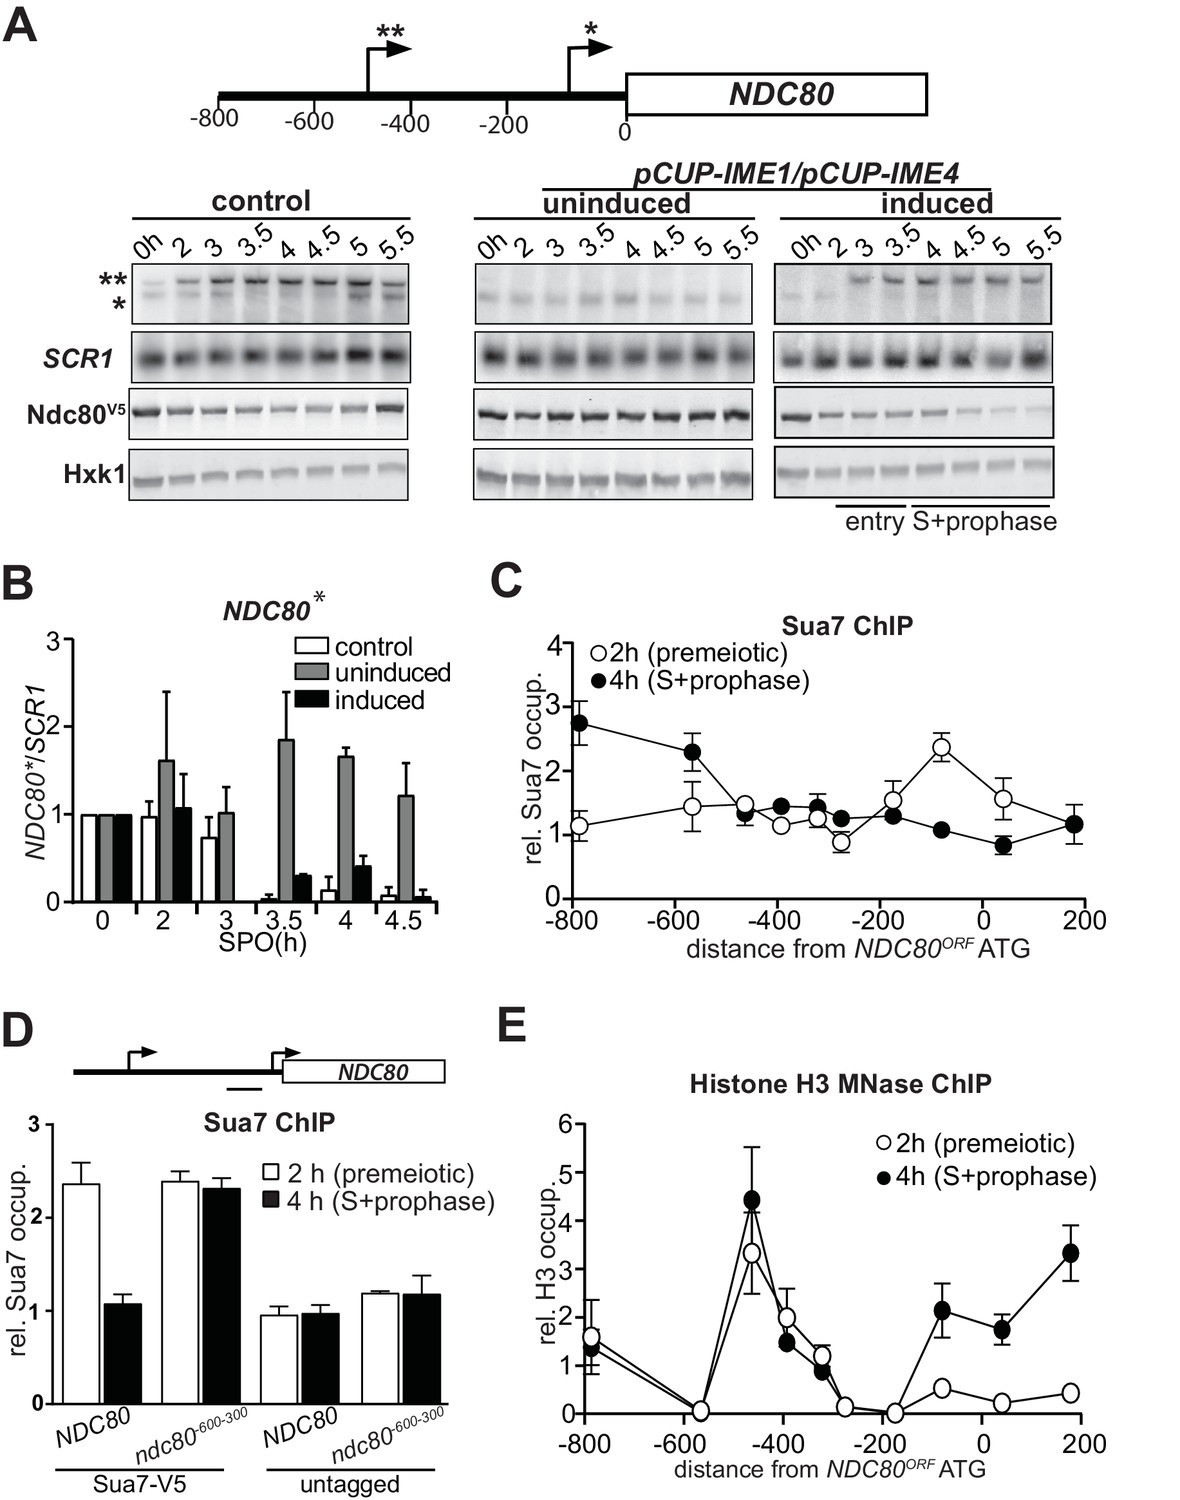
NDC80luti transcription represses the NDC80ORF promoter.
(A) Expression pattern of two NDC80 mRNA isoforms during starvation and early meiosis. Diploid control cells (FW4644) or cells harboring the CUP1 promoter fused with IME1 and IME4 (pCUP-IME1/pCUP-IME4) (FW1902) were grown overnight in rich medium, shifted to pre-sporulation medium, and subsequently transferred to sporulation medium (SPO). These cells also harbored NDC80 tagged at the carboxy-terminus with three copies of the V5 epitope. After two hours in SPO, IME1 and IME4 were induced with CuSO4 (50 μM) to set in motion synchronous meiosis in pCUP-IME1/pCUP-IME4 cells. Samples were taken at the indicated time points for northern and western blot analyses. To detect the two different NDC80 mRNA isoforms, RNA was extracted, separated by gel electrophoresis, blotted, and hybridized with a probe that spans the NDC80 promoter and the 5’ end of the coding region. As a loading control, we also hybridized the blot with a probe specific for SCR1. Ndc80 protein levels were determined by western blot using anti V5 antibodies. As a loading control, we also detected Hxk1 levels with anti-Hxk1 antibodies. A schematic of the NDC80 locus is shown over the northern blot. The single asterisk denotes the transcription start site of the short mitotic NDC80 mRNA isoform. The double asterisk denotes the transcription start site of the distal 5’ extended long NDC80 mRNA isoform. The distance in base pairs from the NDC80 start codon is also displayed. (B) Quantification of expression of the short mitotic NDC80 mRNA isoform from the proximal transcription start-site (labelled with one asterisk) up till the 4.5 hr time point. The mean of two independent repeats plus the standard error of the mean are displayed. The signal was normalized over SCR1. To control for technical variation between experiments and blots, the 0 hr time point was set to one. (C) NDC80luti transcription correlates with reduced TFIIB (Sua7) binding at the NDC80ORF promoter. The two NDC80 isoforms described in A were defined as long undecoded transcript isoform (NDC80luti) and Ndc80 coding mRNA isoform (NDC80ORF), respectively. Cells harboring Sua7 tagged with three copies of V5 (Sua7-V5) and the pCUP-IME1/pCUP-IME4 alleles (FW2957) were induced to undergo meiosis synchronously as described in A. Samples for chromatin immunoprecipitation were taken at two hours (2 hr (premeiotic), no NDC80luti transcription) and four hours after transfer to sporulation medium (SPO) (4 hr (S + prophase), NDC80luti transcription). Cells were fixed with formaldehyde, chromatin extracts were prepared and Sua7-V5 bound DNA fragments were immunoprecipitated using agarose beads coupled with anti-V5 antibodies. The recovered DNA fragments were quantified by qPCR using ten different primer pairs scanning the NDC80 locus, and were normalized over a primer pair directed against the HMR locus. The midpoint position of each primer pair is indicated in the x-axis. The mean normalized signal from three independent experiments plus the standard error of the mean for each primer pair is displayed. ‘rel.’ means relative; ‘occup.”, occupancy. (D) NDC80luti transcription is required for inhibiting Sua7 binding in the NDC80ORF promoter during meiotic prophase. Similar analysis as C except that a mutant strain harboring a deletion upstream in the NDC80 promoter region (ndc80-600-300, FW5530) and untagged strains (FW1902 and FW1868) were included in the analysis. A primer pair directed against a NDC80ORF core promoter was used for the quantification of Sua7 binding at the NDC80ORF promoter. (E) NDC80luti transcription correlates with the establishment of repressive chromatin in the promoter of NDC80ORF. Chromatin structure at the NDC80 locus was determined by ChIP of histone H3 on micrococcal nuclease (MNase) treated extracts in cells that also harbored pCUP-IME1/pCUP-IME4 (FW1902). Samples were taken at two hours (2 hr (premeiotic), no NDC80luti transcription) and four hours after transfer to SPO (4 hr (S + prophase), NDC80luti transcription), fixed with formaldehyde, and chromatin extracts were treated with micrococcal nuclease. Extracts that predominantly contained mononucleosomes were used for ChIP assays with histone H3 antibodies (see Materials and methods for details). The recovered DNA fragments were quantified by qPCR using ten different primer pairs directed against the NDC80 locus relative to a no MNase input. The signals from each primer pair were then normalized over a primer pair directed against the PHO5 core promoter. The midpoint position of each primer pair is indicated in the x-axis. The mean signal from three independent experiments plus the standard error of the mean for each primer pair is displayed.
Figure 1—figure supplement 1
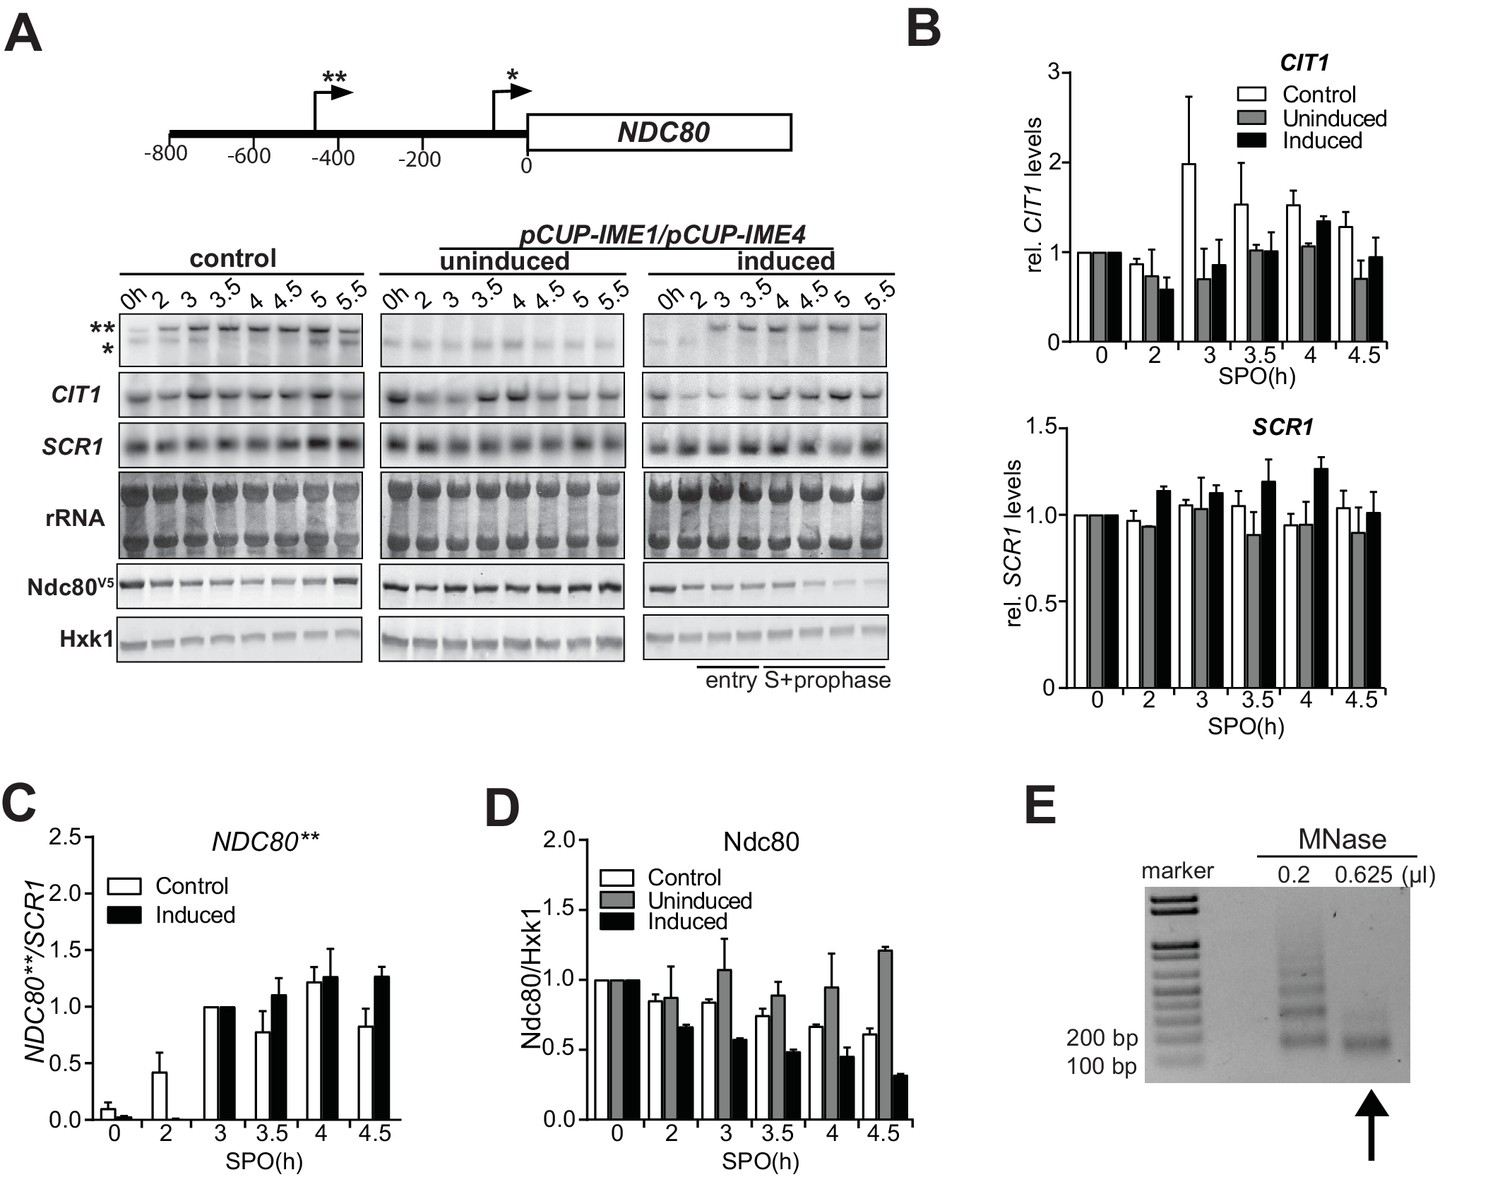
NDC80luti transcription represses the NDC80ORF promoter.
(A) The same northern blot and western blot of NDC80 expression during a meiotic time course as described in Figure 1A, except that CIT1 and ribosomal RNA expression levels are also displayed. (B) Quantification of CIT1 and SCR1 northern blot signals from A up till the 4.5 hr time point. The mean of two independent repeats plus the standard error of the mean are displayed. (C) Quantification of expression of the long mRNA NDC80 isoform described in Figure 1A (labelled with two asterisks). The mean of two independent repeats plus the standard error of the mean are displayed. The signal was normalized over SCR1. Since the long isoform is not expressed in premeiotic conditions, the 3 hr time point (as opposed to 0 hr) was set to one to control for technical variation between experiments and blots. (D) Quantification of Ndc80 protein levels as described in Figure 1A. The mean of two independent repeats plus the standard error of the mean are displayed. The signal was normalized over Hxk1. To control for technical variation between experiments and blots, the 0 hr time point was set to one. (E) Example of extract with mononucleosomes prepared from cells (FW1902, 2 hr [premeiotic]). In short, cells were fixed with formaldehyde, treated with zymolase, and subsequently treated with different concentrations of micrococcal nuclease (MNase). To check for the extent of MNase digestion, part of the sample from each extract was reverse crosslinked, purified, and separated by gel electrophoresis. The arrow indicates the extract that was used for subsequent ChIP analysis.
Figure 2
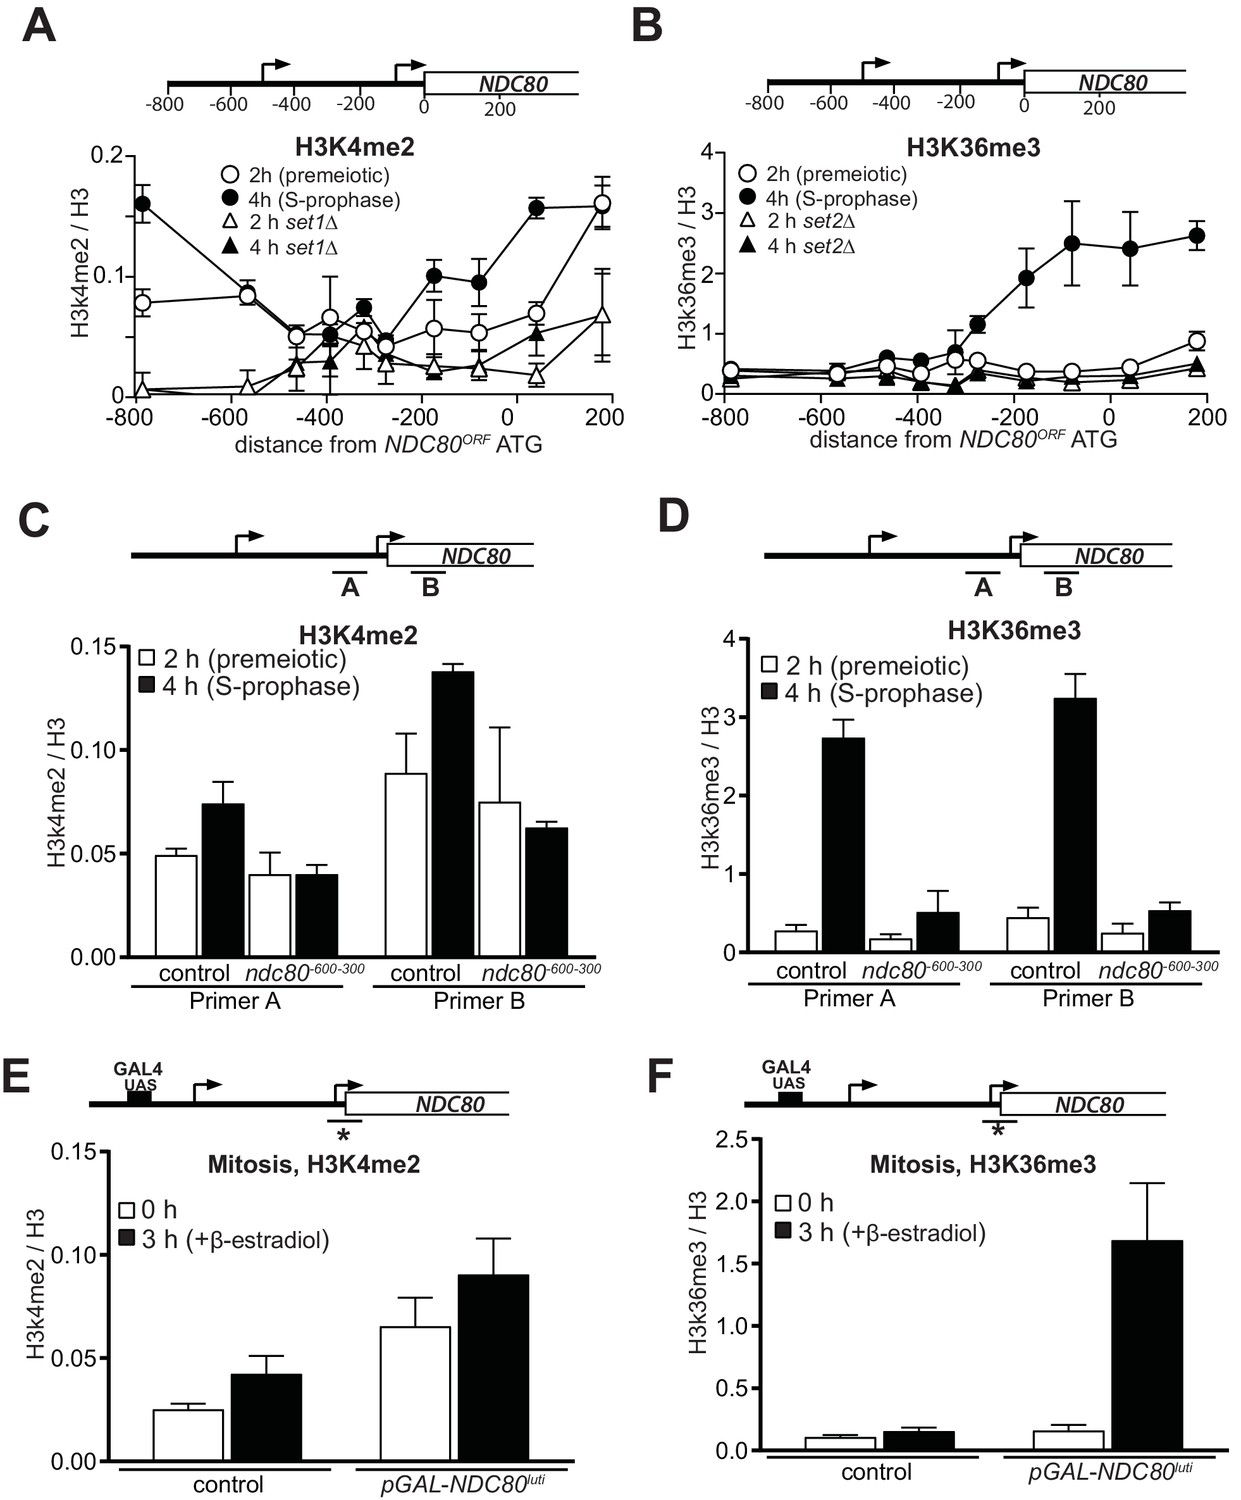
Transcription of NDC80luti promotes H3K4me2 and H3K36me3 in the promoter and 5’ region of NDC80ORF.
(A) NDC80luti transcription promotes histone H3 lysine 4 dimethylation (H3K4me2) in the NDC80ORF promoter. Wild-type (FW1902) and set1Δ (FW3033) cells harboring the pCUP-IME1/pCUP-IME4 were induced to undergo meiosis synchronously (see Materials and methods for details). Samples for chromatin immunoprecipitation were taken at two hours (2 hr (premeiotic), no NDC80luti transcription) and four hours in sporulation medium (SPO) (4 hr (S + prophase), NDC80luti transcription). Cells were fixed with formaldehyde, chromatin extracts were prepared and H3K4me2 or H3 enriched fragments were immunoprecipitated using magnetic Prot A beads coupled with anti-H3K4me2 or anti-H3 antibodies, respectively. The recovered DNA fragments were quantified by qPCR using ten different primer pairs scanning the NDC80 locus. The midpoint position of each primer pair is indicated in the x-axis. The mean enrichment from three independent experiments plus the standard error of the mean for each primer pair is displayed. The H3K4me2 signal was normalized over histone H3. (B) Similar to A, except that histone H3 lysine 36 trimethylation (H3K36me3) abundance was determined by ChIP. Wild-type (FW1902) and set2Δ (FW1472) cells harboring the pCUP-IME1/pCUP-IME4 alleles were used for the analysis. (C) Similar to A except that the ChIP for H3K4me2 was performed in control cells (FW1902) and cells harboring a deletion upstream in the NDC80 promoter region (ndc80600-300, FW1868). For the analyses we used primer pairs directed against the NDC80ORF promoter (A), and the 5’ region of the NDC80 gene (B). The mean fold enrichment from three independent experiments plus the standard error of the mean for each primer pair are displayed. The signals were normalized to the levels of H3. (D) Similar to C except that H3K36me3 levels were determined by ChIP. (E) Transcription of NDC80luti during mitotic growth leads to increased H3K4me2 levels in the NDC80ORF promoter. Control cells (UB91) and cells harboring NDC80luti driven by the GAL1-10 promoter (pGAL-NDC80luti) (UB3338) were grown to exponential phase in rich medium with raffinose and galactose (YP-RG). Subsequently, cells were treated with β-estradiol, which induces translocation of the Gal4-ER chimeric transcription factor to the nucleus to activate the GAL1-10 promoter. Samples were taken at 0 and 3 hr after induction of NDC80luti for ChIP. H3K4me2 and histone H3 levels were determined as described in C, except using a primer pair directed against the NDC80ORF core promoter. The mean enrichment from three independent experiments plus the standard error of the mean are displayed. (F) Similar to E except that H3K36me3 levels were determined by ChIP.
Figure 3 with 1 supplement
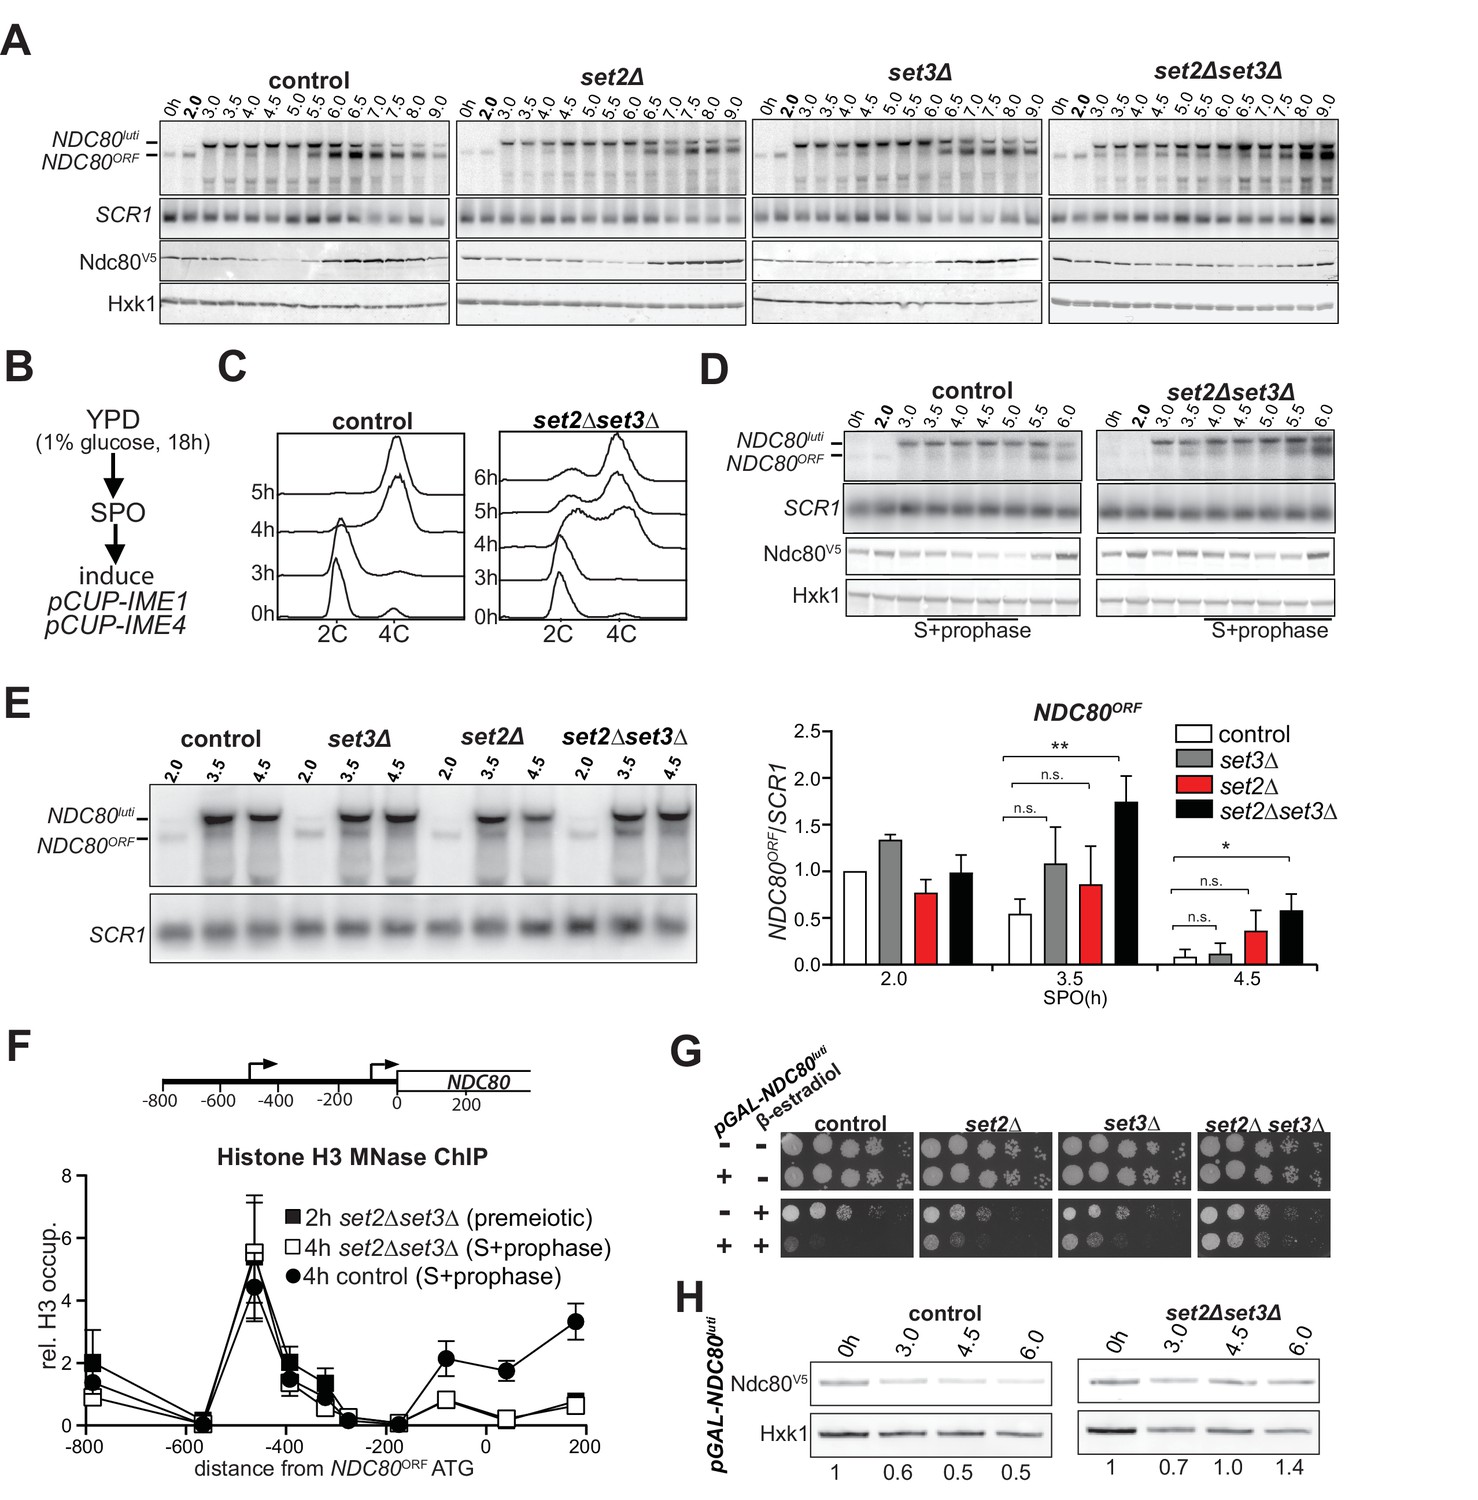
Set2 and Set3 mediate NDC80luti induced gene repression of NDC80ORF.
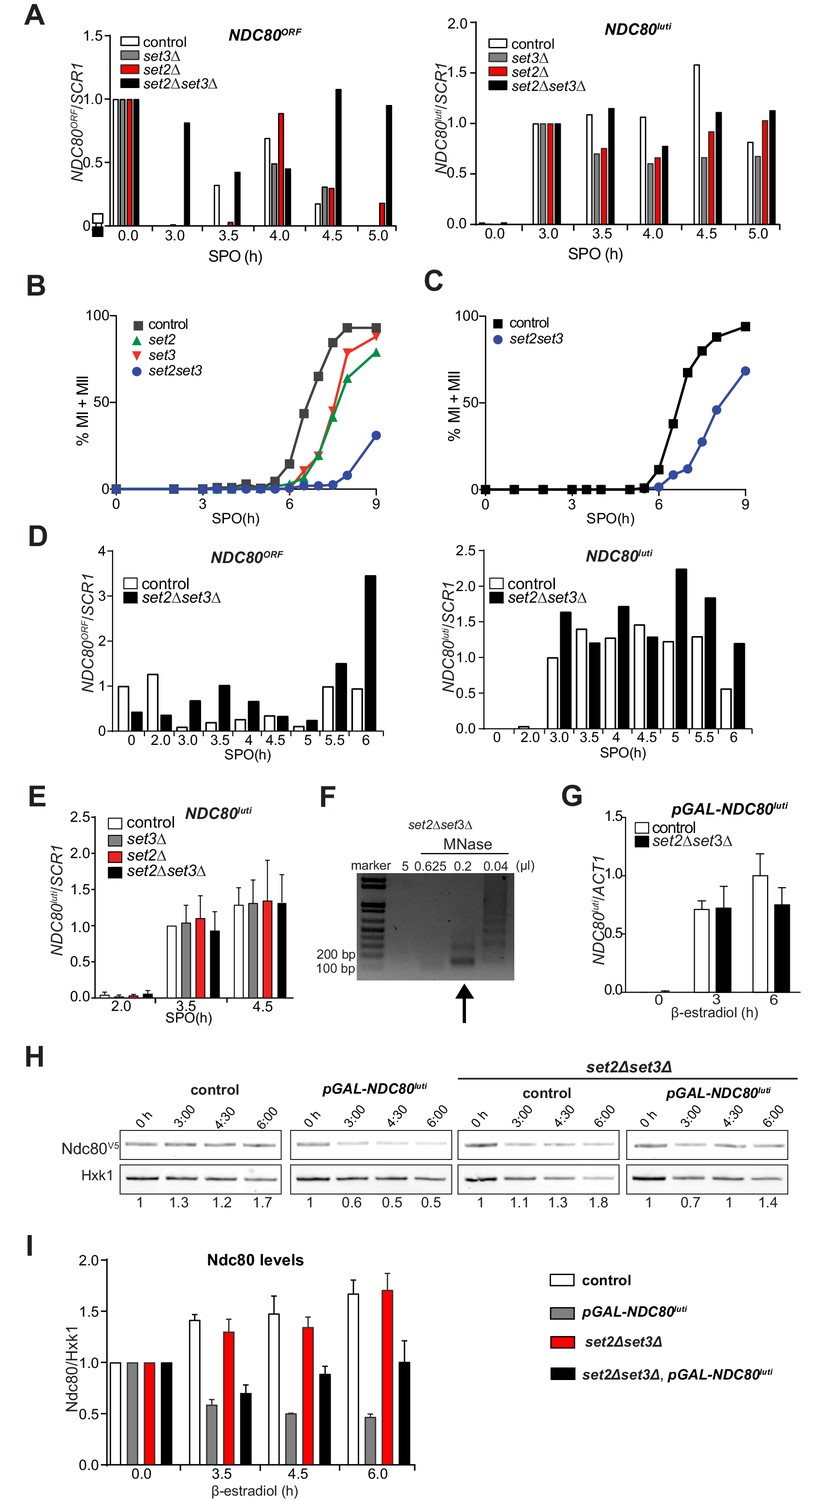
(A) Set2 and Set3 are required for repression of NDC80ORF expression during early meiosis. Control (FW1902), set2Δ (FW2929), set3Δ (FW2928) and set2Δset3Δ (FW1922) cells harboring pCUP-IME1/pCUP-IME4 and NDC80-V5 were grown in rich medium, transferred to pre-sporulation medium, and then shifted to SPO medium. After 2 hr, IME1 and IME4 expression were induced, and samples for northern and western blot analyses were taken at the indicated time points. Northern blot membranes were prepared and hybridized with a probe that detects both NDC80luti and NDC80ORF transcripts. As a loading control, membranes were also hybridized with SCR1. Ndc80 protein was detected with anti-V5 antibodies and Hxk1 levels were determined with anti-hexokinase antibodies. (B) Scheme of the synchronous meiosis protocol in which cells were shifted directly from rich medium to SPO medium. Cells were grown in rich medium (YPD) to OD600 of 1–2, shifted to reduced glucose medium (YPD, 1% glucose) grown overnight to saturation, and then transferred to SPO. After 2 hr, IME1 and IME4 were induced. (C) Flow cytometry analysis of DNA content in control (FW1902) and set2Δset3Δ (FW1922) strains. Synchronous meiosis was induced as described in B. Samples were taken at the indicated time points after transfer to SPO and were stained with propidium iodide. (D) Similar to A except that meiosis was induced as described in B. (E) Strains described in A were grown to undergo a synchronous meiosis as described in B, and selective time points were taken for northern blot analysis of NDC80luti and NDC80ORF transcripts on the same membrane. As a loading control, the northern membranes were hybridized with SCR1. The NDC80ORF levels were quantified (right panel) and data from three independent experiments plus the standard error of the mean (SEM) is displayed. One-tailed, unpaired t-tests were conducted to test if the differences in NDC80ORF levels were statistically significant. A single asterisk * denotes p-value<0.05. A double asterisk ** denotes p-value<0.01. ‘n.s.’ means ‘not significant’. To control for technical variation between different northern blots, the NDC80ORF signal from the two hour time point from the control strain of each blot was set to one. (F) NDC80luti transcription requires Set2 and Set3 to establish a repressive chromatin state at the promoter of NDC80ORF. Chromatin structure at the NDC80 locus was determined by ChIP of histone H3 on micrococcal nuclease (MNase) treated extracts in control (FW1902) and set2Δ set3Δ (FW1922) cells as described in A. Samples were taken prior to IME1/IME4 induction at 2 hr in SPO (2 hr, premeiotic) and after induction at 4 hr in SPO (4 hr, S + prophase), fixed with formaldehyde, and mononucleosome fragments were isolated. The recovered DNA fragments were quantified by qPCR using ten different primer pairs directed against the NDC80 locus relative to a no MNase input. The signals from each primer pair were then normalized over a primer pair directed against the PHO5 core promoter. The midpoint position of each primer pair is indicated in the x-axis. The mean signal from three independent experiments plus the standard error of the mean for each primer pair is displayed. (G) Ectopic expression of NDC80luti is lethal in mitosis, but is rescued in a set2Δ set3Δ mutant. Spot assays of control cells, which harbor a wild-type NDC80 locus, with SET2 SET3 (UB1252), set2Δ (UB3545), set3Δ (UB3547), and set2Δ set3Δ (UB3549); as well as cells expressing NDC80luti from the heterologous GAL promoter (pGAL-NDC80luti) with SET2 SET3 (UB1218), set2Δ (UB1236), set3Δ (UB1237), and set2Δ set3Δ (UB1235). These cells also expressed the Gal4 fused to estrogen receptor (Gal4-ER), which translocates to the nucleus in the presence of β-estradiol to activate the GAL1-10 promoter. Cells were grown overnight on YP-glycerol plates, diluted in sterile water, and spotted on YP +raffinose + galactose (YP-RG) plates in the absence or presence of β-estradiol. (H) Ectopic expression of NDC80luti fails to downregulate Ndc80 in the set2Δ set3Δ mutant. Cells expressing NDC80luti from the GAL promoter with SET2 SET3 (UB1217) or set2Δ set3Δ (UB8114) were grown to exponential phase in YP-RG, and they were induced to express NDC80luti with β-estradiol. Samples were taken at the indicated time points. Ndc80 protein levels were determined by western blot using anti-V5 antibodies. Hxk1 levels were detected with anti-hexokinase antibodies. Ndc80 and Hxk1 were quantified and the relative expression (Ndc80/Hxk1) with respect to the 0 hr time point is displayed.
Figure 3—figure supplement 1
The Set2 and the Set3 mediate NDC80luti induced gene repression of NDC80ORF.
(A) Quantification of NDC80ORF and NDC80luti levels in the experiment described in Figure 3A. Signals are normalized to SCR1. To control for variation in overall signal between different northern blots, the NDC80ORF signal at the 0 hr time point was set to one, and the NDC80luti signal at the 3 hr time point was set to one. (B) set2Δ set3Δ mutants undergo meiosis with delayed kinetics. Kinetics of meiotic divisions (MI + MII) in control (FW1902), set2Δ (FW2929), set3Δ (FW2928) and set2Δset3Δ (FW1922) cells harboring pCUP-IME1/pCUP-IME4 and NDC80-V5. Cells were grown in rich medium, transferred to pre-sporulation medium, and then shifted to sporulation medium. After 2 hr, IME1 and IME4 expression were induced, and samples were taken at the indicated time points, fixed, and stained with DAPI. The percentage of cells with one, two or more DAPI masses was determined for at least 200 cells per time point. (C) Similar to B, except that cells were directly shifted from rich medium to SPO. (D) Quantification of NDC80ORF and NDC80luti levels in the experiment described in Figure 3D. Signals are normalized to SCR1. The relative expression (NDC80ORF/SCR1) with respect to the 0 hr time point is displayed (left panel). The relative expression (NDC80luti/SCR1) with respect to the 3 hr time point is displayed (right panel). (E) Same experiment as Figure 3E, except that the NDC80luti levels on northern blots were quantified, first normalized to SCR1 and then normalized to the intensity of NDC80luti at 3.5 hr in control cells. The mean from three independent experiments plus the standard error of the mean are displayed. (F) Example of extract with mononucleosomes from set2Δset3Δ cells (FW1922, 2 hr [premeiotic]) prepared as described in Materials and methods. In short, cells were fixed with formaldehyde, treated with zymolase, and subsequently treated with different concentrations of micrococcal nuclease (MNase). Part of the sample from each extract was reverse crosslinked, purified, and separated by gel electrophoresis. The arrow indicates the extract that was used for subsequent ChIP analysis. (G) Levels of NDC80luti are not affected in the set2Δ set3Δ double mutant. Control (UB1217) and set2Δ set3Δ (UB8114) cells harboring NDC80luti driven by the GAL1-10 promoter were grown in YP-RG medium overnight, diluted and treated with β-estradiol during exponential growth. Samples were taken at the indicated time points. RNA was extracted, reverse transcribed, and the NDC80luti mRNA levels were determined by qPCR. Signals were normalized to ACT1. The mean from three independent experiments plus the standard error of the mean are displayed. (H) Ectopic expression of NDC80luti fails to downregulate Ndc80 in the set2Δ set3Δ mutant. Western blot of Ndc80 for SET2 SET3 cells harboring an NDC80-V5 allele (UB1240) or harboring a pGAL-NDC80luti-V5 allele (UB1217), as well as set2Δset3Δ cells with NDC80-V5 (UB8110) or pGAL-NDC80luti-V5 (UB8114). Cells were grown as described in Figure 3H, treated with β-estradiol, and samples were taken at the indicated time points. Ndc80 protein levels were determined with anti-V5 antibodies. Hxk1 levels were detected with anti-hexokinase antibodies. Ndc80 and Hxk1 were quantified, and the relative expression (Ndc80/Hxk1) with respect to the 0 hr time point is indicated. The western blot is from the same experiment described in Figure 3H, except that the data for the strains harboring the NDC80-V5 allele are included. (I) Quantification of Figure 3—figure supplement 1H. Ndc80 signals were first normalized to Hxk1 and were then normalized with respect to the 0 hr time point. The mean from three independent experiments plus the standard error of the mean are displayed.
Figure 4 with 1 supplement
NDC80luti mediated repression is reversible.
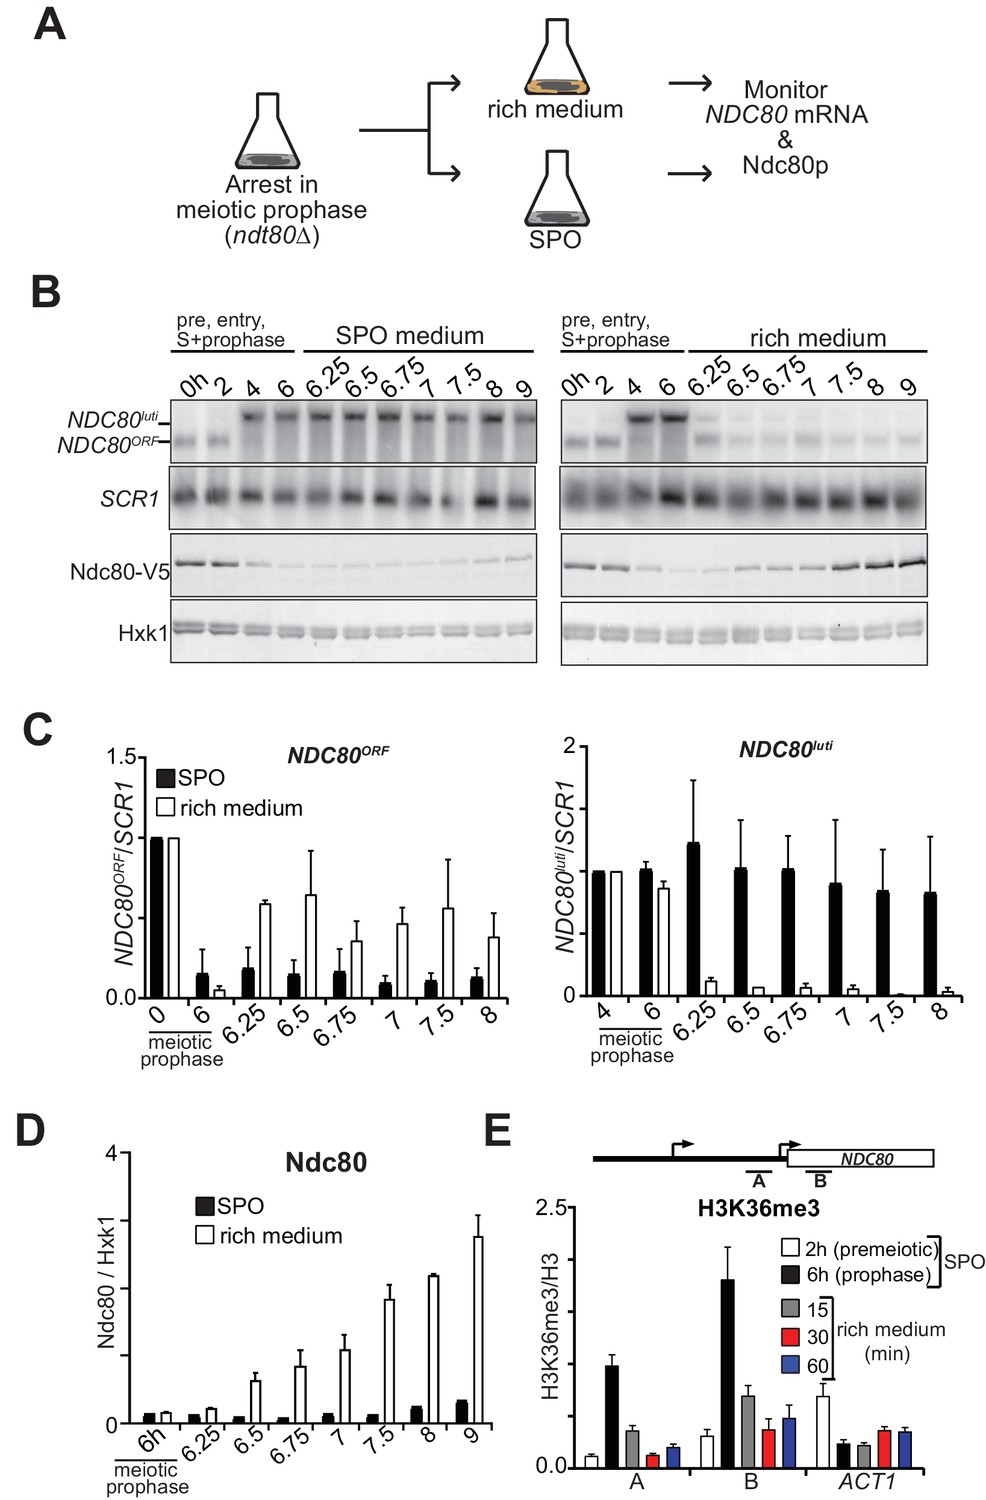
(A) Schematic overview of the experimental set-up. (B) Cells repress NDC80luti and induce NDC80ORF when returned to a nutrient rich environment (YPD). Cells harboring ndt80Δ and pCUP-IME1/pCUP-IME4 (FW3856) were grown in rich medium, shifted and grown in pre-sporulation medium, and subsequently transferred to SPO. Samples were taken prior to induction of IME1 and IME4 at 0 hr and 2 hr (premeiotic [pre]), and after induction at 4 hr (S-phase) and 6 hr (prophase) in SPO. After 6 hr, cells were either transferred to rich medium or kept in SPO medium. Samples for RNA and protein were taken at the indicated time points. To detect NDC80luti and NDC80ORF expression, RNA was extracted, separated by gel electrophoresis, blotted, and hybridized with a probe that spans the NDC80 promoter and coding region. As a loading control for northern blots, we also probed membranes for SCR1. Ndc80 protein levels were determined by western blot using anti-V5 antibodies. As a loading control we also detected Hxk1 levels with anti-Hxk1 antibodies. (C) Quantification of NDC80ORF and NDC80luti levels as described in B. The signals were normalized over SCR1. The error bars represent the standard error of the mean from two independent experiments. To control for technical variation between experiments the 0 hr and 4 hr time points were set to one for NDC80ORF and NDC80luti, respectively. (D) Quantification of Ndc80 protein levels during return to rich medium as described in B. The Ndc80 protein levels were normalized to Hxk1 protein abundance. The relative levels with respect to the 6 hr time point are displayed. The mean from two independent experiments plus the standard error of the mean is displayed. (E) H3K36me3 is rapidly lost from the NDC80ORF promoter and 5’ region after return to growth. Growth conditions were similar to B, except that histone H3 lysine 36 trimethylation (H3K36me3) levels were quantified at the NDC80ORF promoter during return to growth in a nutrient rich environment. Samples for chromatin immunoprecipitation were taken at the indicated time points. Cells were fixed with formaldehyde, chromatin extracts were prepared and H3K36me3 and histone H3 enriched fragments were immunoprecipitated with anti-H3K36me3 or anti-H3 antibodies, respectively. The recovered DNA fragments were quantified by qPCR using a primer directed against the NDC80ORF promoter (primer A) and a primer directed against the 5’ region of the NDC80 gene (primer B). The mean enrichment from three independent experiments plus the standard error of the mean for each primer pair is displayed. We also analyzed the signal at the 3’ end of the ACT1 open reading frame. The H3K36me3 signals were normalized to the histone H3 signal.
Figure 4—figure supplement 1

NDC80luti mediated repression is reversible.
(A) Quantification of NDC80luti during return to rich medium as described in Figure 4B. RNA was extracted, reverse transcribed, and NDC80luti mRNA levels were determined by quantitative PCR. Signals were normalized to ACT1. The mean from two independent experiments plus the standard error of the mean is displayed. (B) Ime1 protein is unstable. Cells harboring Hemagglutinin-tagged IME1 under the control of the CUP1 promoter were grown in rich medium (UB1026), shifted to pre-sporulation medium, and subsequently transferred to SPO. After 2 hr, Ime1 was induced. After 4 hr in SPO, cells were split, and either treated with ethanol (EtOH) or cycloheximide (CHX, 0.2 mg/ml). Samples were taken at the indicated time points. Ime1 protein levels were determined by western blot using anti-HA antibodies. As a loading control, we also detected Hxk1 levels. (C) Bulk histone H3K36me3 levels remain constant during return to a nutrient rich environment. Cells harboring ndt80Δ (FW3856) were grown in rich medium, shifted and grown in pre-sporulation medium, and subsequently transferred to SPO. After 6 hr, cells were either transferred to rich medium or continued in SPO medium. Samples were taken at the indicated time point. H3K36me3 and histone H3 levels were determined by western blot using anti-H3K36me3 and anti-histone H3 antibodies, respectively. The relative abundance of H3K36me3 normalized to histone H3 is indicated.
Figure 5 with 1 supplement
Gene repression by NDC80luti is tunable.
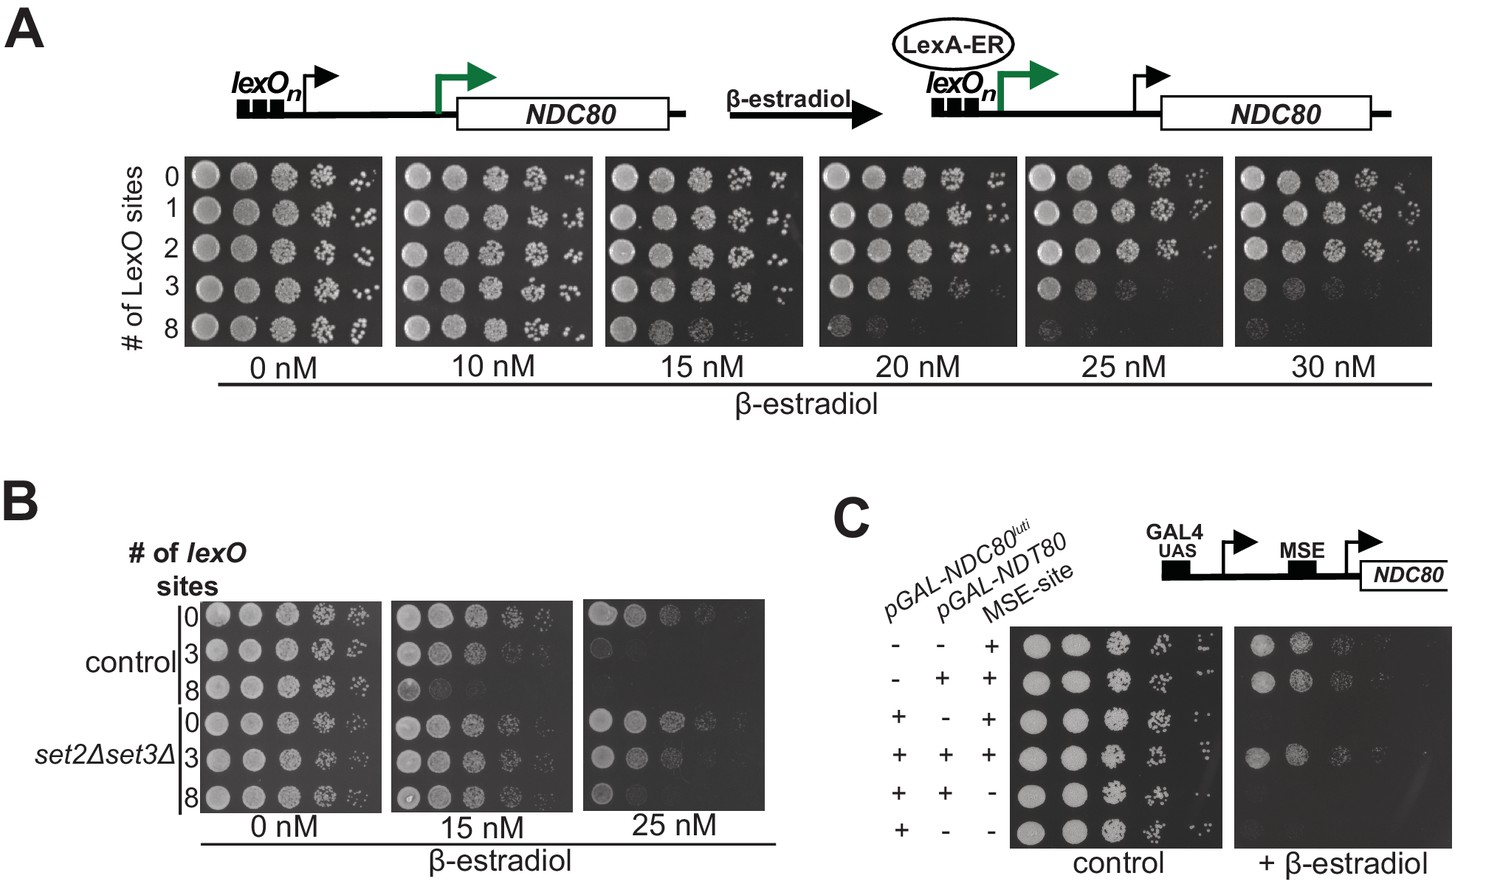
(A) Adjustable expression of NDC80luti using the LexA-lexO system. Spot assay of cells harboring 0, 1, 2, 3, or 8 lexO binding sites in the NDC80luti promoter (UB8374, UB8358, UB8362, UB8366, UB8370) in the presence of different concentrations of β-estradiol. These cells also expressed LexA fused to an activation domain (AD) and the human estrogen receptor (ER) (LexA-ER-AD). Cells were grown overnight, diluted in sterile water, and spotted on YPD plates in the absence or presence of different concentrations of β-estradiol. (B) Similar to A, except that set2Δset3Δ mutant cells (UB8691, UB8686 and UB8693) were included for the analysis. (C) Increased NDC80ORF promoter activity bypasses NDC80luti mediated repression. Cells were grown overnight, diluted in sterile water, and spotted on YP +raffinose + galactose plates in the absence or presence of β-estradiol (1 μM). For the analyses, we used three sets of strains: (1) Cells with a wild-type NDC80 and with a functional MSE site (+MSE), but with either a wild-type NDT80 (UB3351) or a pGAL1-10 driven NDT80 (pGAL-NDT80, UB3370); (2) cells with pGAL-NDC80luti and with a functional MSE site, along with either a wild-type NDT80 (UB5154) or pGAL-NDT80 (UB9181); (3) cells with pGAL-NDC80luti and a non-functional MSE site, along with either pGAL-NDT80 (UB9921) or wild-type NDT80 (UB9923). These cells also expressed Gal4-ER to activate pGAL driven expression.
Figure 5—figure supplement 1
Gene repression by NDC80luti is tunable.
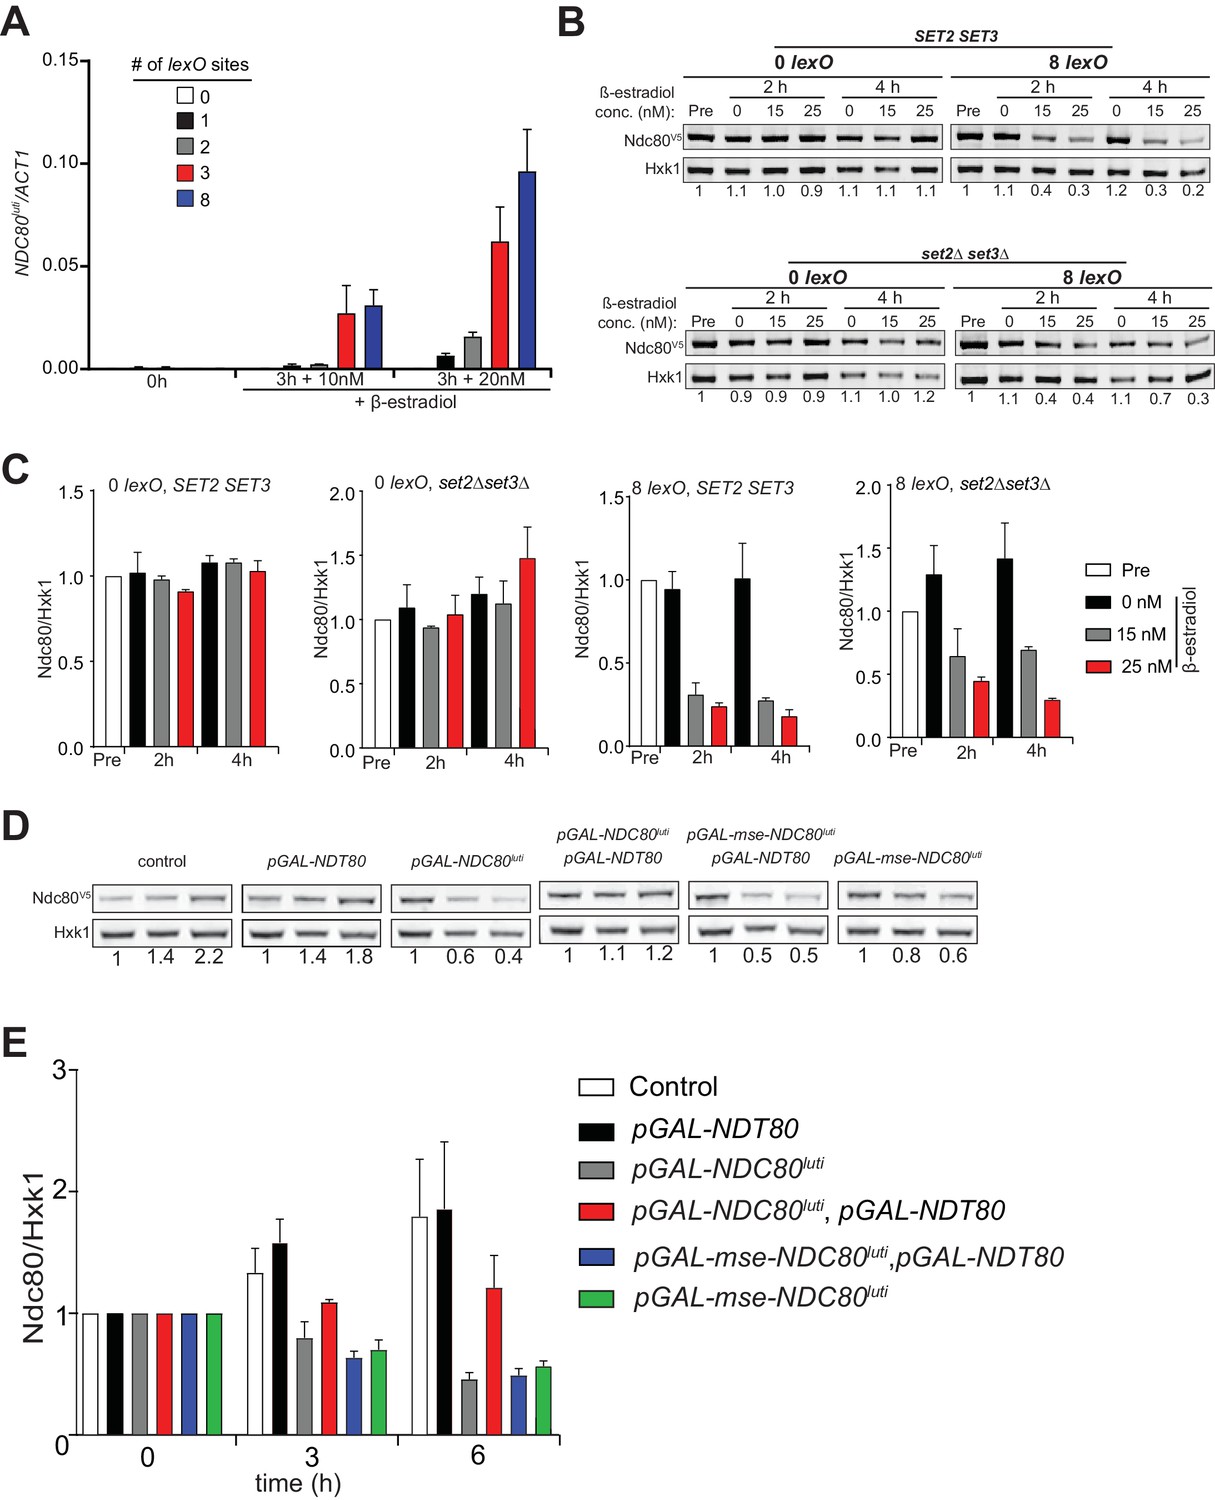
(A) NDC80luti levels in the presence of variable number of lexO sites in the NDC80luti promoter. Cells harboring 0, 1, 2, 3, or 8 lexO and LexA-ER-AD (UB8374, UB8358, UB8362, UB8366, and UB8370) were grown in YPD overnight. Subsequently, cells were diluted and exponentially growing cells were treated with 10 or 20 nM β-estradiol for 3 hr. RNA was extracted, reverse transcribed, and NDC80luti mRNA levels were determined by quantitative PCR. Signals were normalized to ACT1. The mean from three independent experiments plus the standard error of the mean are displayed. (B) Ndc80 protein level in SET2 SET3 cells harboring none (UB12945) or 8 lexO sites (UB12949), or set2∆ set3∆ cells with none (UB12947) or 8 lexO sites (UB12951). All four strains carry LexA-ER-AD. Ndc80 protein was detected by anti-V5 immunoblot. Hxk1 levels were used as a loading control. ‘Pre’ denotes pre-induction. Exponentially growing cells were treated with ethanol (0 nM), 15 nM, or 20 nM β-estradiol. Samples were taken at 2 hr or 4 hr after β-estradiol induction. Ndc80 level was normalized to Hxk1 level, and the number under each lane shows the Ndc80/Hxk1 ratio normalized to that in the pre-induction condition. (C) Same as Figure 5—figure supplement 1B, except that the mean of two independent experiments plus standard error of the mean are displayed. (D) Increased promoter NDC80ORF activity bypasses NDC80luti mediated repression. Exponentially growing cells were treated with ethanol or 1 μM β-estradiol. Samples were taken at 3 hr or 6 hr after β-estradiol induction. The amount of samples loaded corresponded to the same OD across all the cultures. Ndc80 level was normalized to Hxk1 level, and the number under each lane shows the Ndc80/Hxk1 ratio normalized to that in the pre-induction condition. For the analyses, we used the strains described in Figure 5C. (E) Quantification of Ndc80 protein levels from Figure 5—figure supplement 1D. The Ndc80 protein levels were normalized to Hxk1 protein abundance. The relative levels with respect to the 0 hr time point are displayed. The mean from three independent experiments plus the standard error of the mean are displayed.
Figure 6

Model for NDC80luti mediated repression of NDC80ORF.
During mitosis the NDC80ORF promoter has an open chromatin structure and NDC80ORF is transcribed. During meiotic S-phase and meiotic prophase, transcription of NDC80luti deposits Set1-dependent H3K4me2 and Set2-dependent H3K36me3 in the same area of the NDC80ORF promoter. Co-transcriptional deposition of these marks facilitates the recruitment of the histone deacetylase complexes Set3C and Rpd3S. This leads to increased nucleosome occupancy in the NDC80ORF promoter and NDC80ORF transcription is repressed. The set of reversing arrows indicates that NDC80luti mediated repression of NDC80ORF is reversible.
Additional files
-
Supplementary file 1
Table of yeast strains used in this study.
Table describing genotypes of the strains.
- https://doi.org/10.7554/eLife.27420.012
-
Supplementary file 2
Table of oligo nucleotide sequences used in this study.
Table describing oligo nucleotide sequences used for quantitative PCR and for preparing the northern blot probes.
- https://doi.org/10.7554/eLife.27420.013
-
Transparent reporting form
- https://doi.org/10.7554/eLife.27420.014
Download links
A two-part list of links to download the article, or parts of the article, in various formats.
Downloads (link to download the article as PDF)
Open citations (links to open the citations from this article in various online reference manager services)
Cite this article (links to download the citations from this article in formats compatible with various reference manager tools)
Transcription of a 5’ extended mRNA isoform directs dynamic chromatin changes and interference of a downstream promoter
eLife 6:e27420.
https://doi.org/10.7554/eLife.27420


