Transcription factor clusters regulate genes in eukaryotic cells
- University of York, United Kingdom
- University of Gothenburg, Sweden
- Chalmers University of Technology, Sweden
Figures
Figure 1 with 3 supplements
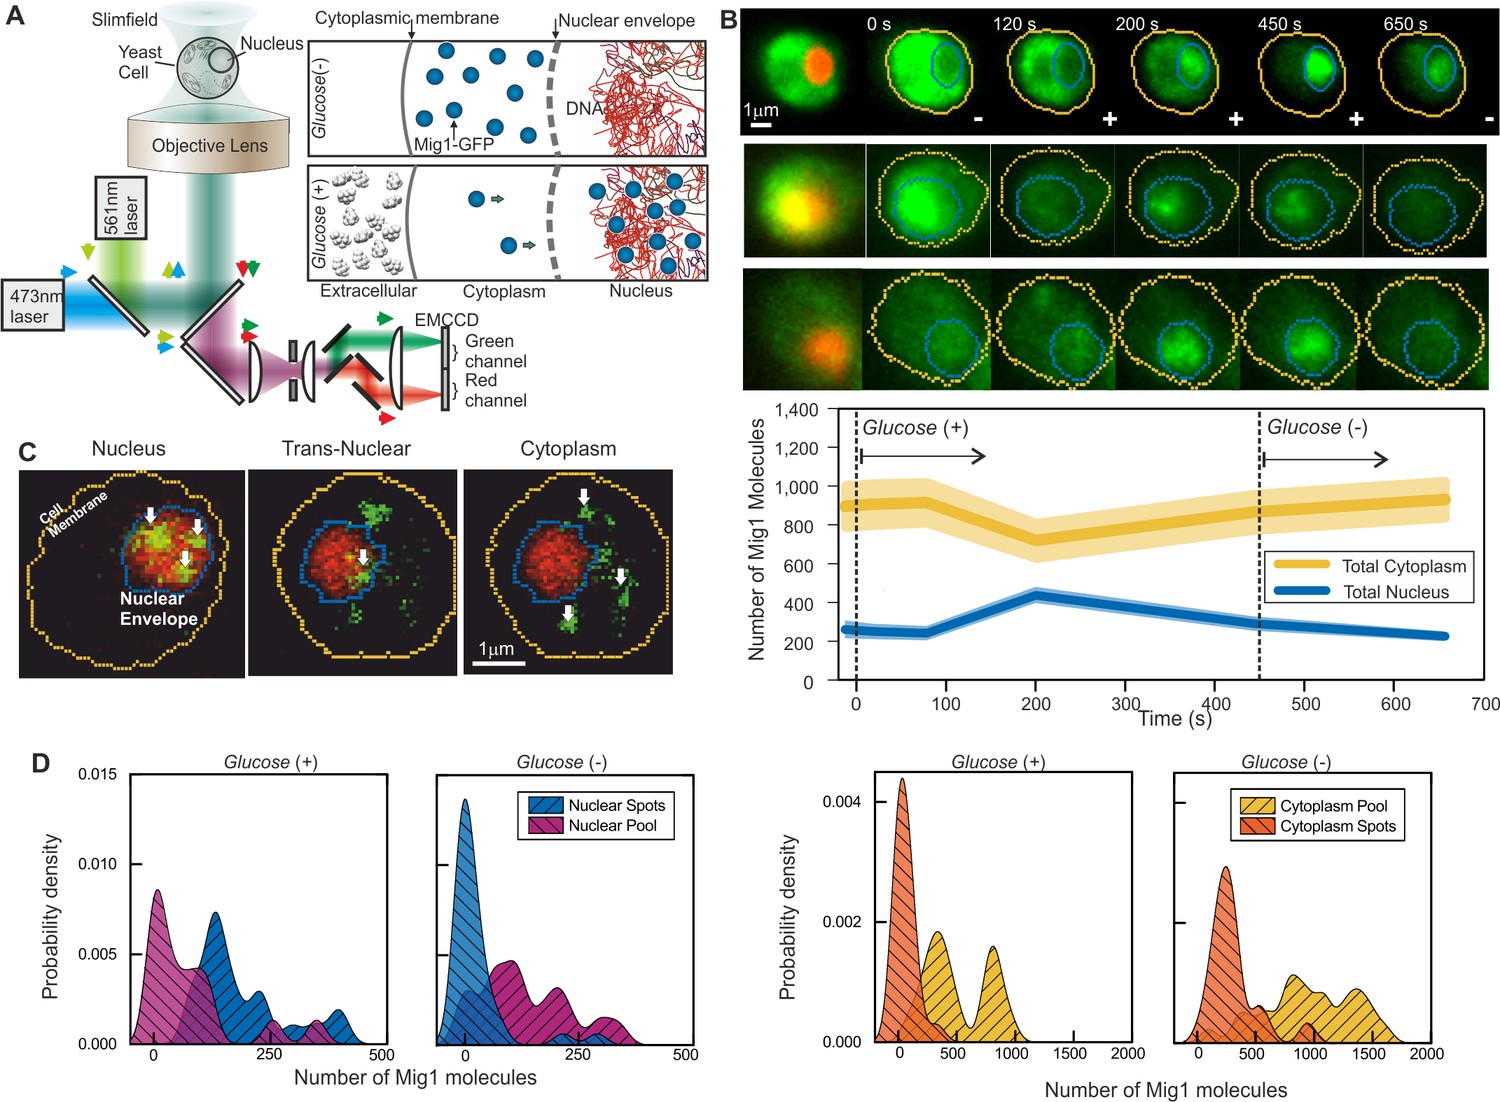
Single-molecule Slimfield microscopy of live cells reveals Mig1 clusters.
(A) Dual-color fluorescence microscopy assay. Mig1-GFP localization change (cyan, right panels) depending on glucose availability. (B) Example Slimfield micrographs of change of Mig1-GFP localization (green) with glucose for three cells, nuclear Nrd1-mCherry indicated (red, left), mean and SEM errorbounds of total cytoplasmic (yellow) and nuclear (blue) contributions shown (lower panel), n = 15 cells. Display scale fixed throughout each time course to show pool and foci fluorescence. (C) Example Slimfield micrographs of cells showing nuclear (left), trans-nuclear (center) and cytoplasmic (right) Mig1-GFP localization (green, distinct foci white arrows), Nrd1-mCherry (red) and segmented cell body (yellow) and nuclear envelope (blue) indicated. Display scales adjusted to only show foci. (D) Kernel density estimations (KDE) for Mig1-GFP content in pool and foci for cytoplasm and nucleus at glucose (+/-), n = 30 cells.
Figure 1—figure supplement 1
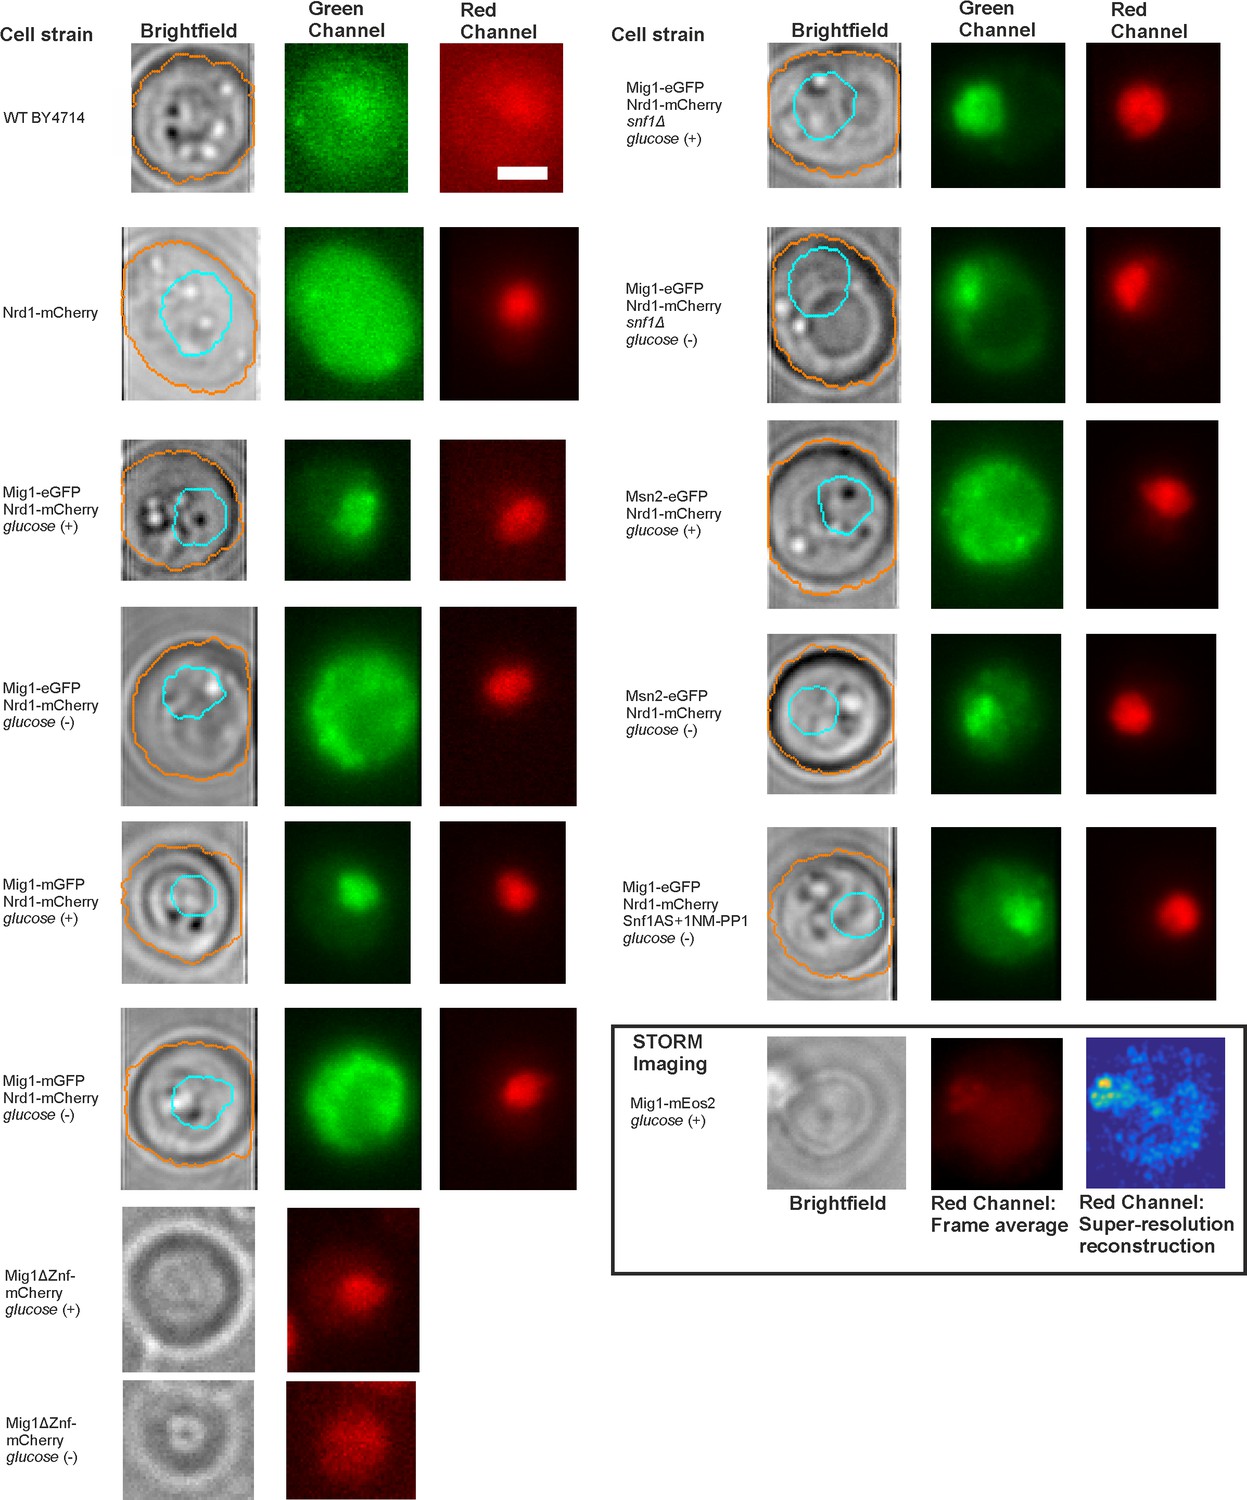
Brightfield and fluorescence micrographs of key strains and glucose conditions.
Representative Slimfield fluorescence images obtained from the strains and different extracellular glucose conditions used in this study. Brightfield non-fluorescence images, segmentation perimeter indicated for cell body (orange) and nucleus (cyan), and fluorescence images are indicated, the latter showing both green and red channels obtained as the frame average from the first five consecutive Slimfield images. Fluorescence images are of the first illuminated frame and are all normalized by total pixel intensity. Snf1AS represents an ATP analog sensitive version of Snf1, Snf1-I132G. For the Mig1-mEos2 strain (inset, bottom right) this shows the brightfield image (left panel), a 300 consecutive frame average from the red channel after photoconversion (middle panel) and super-resolution false color heat map reconstruction, 40 nm lateral resolution,>2000 localizations (right panel).
Figure 1—figure supplement 2
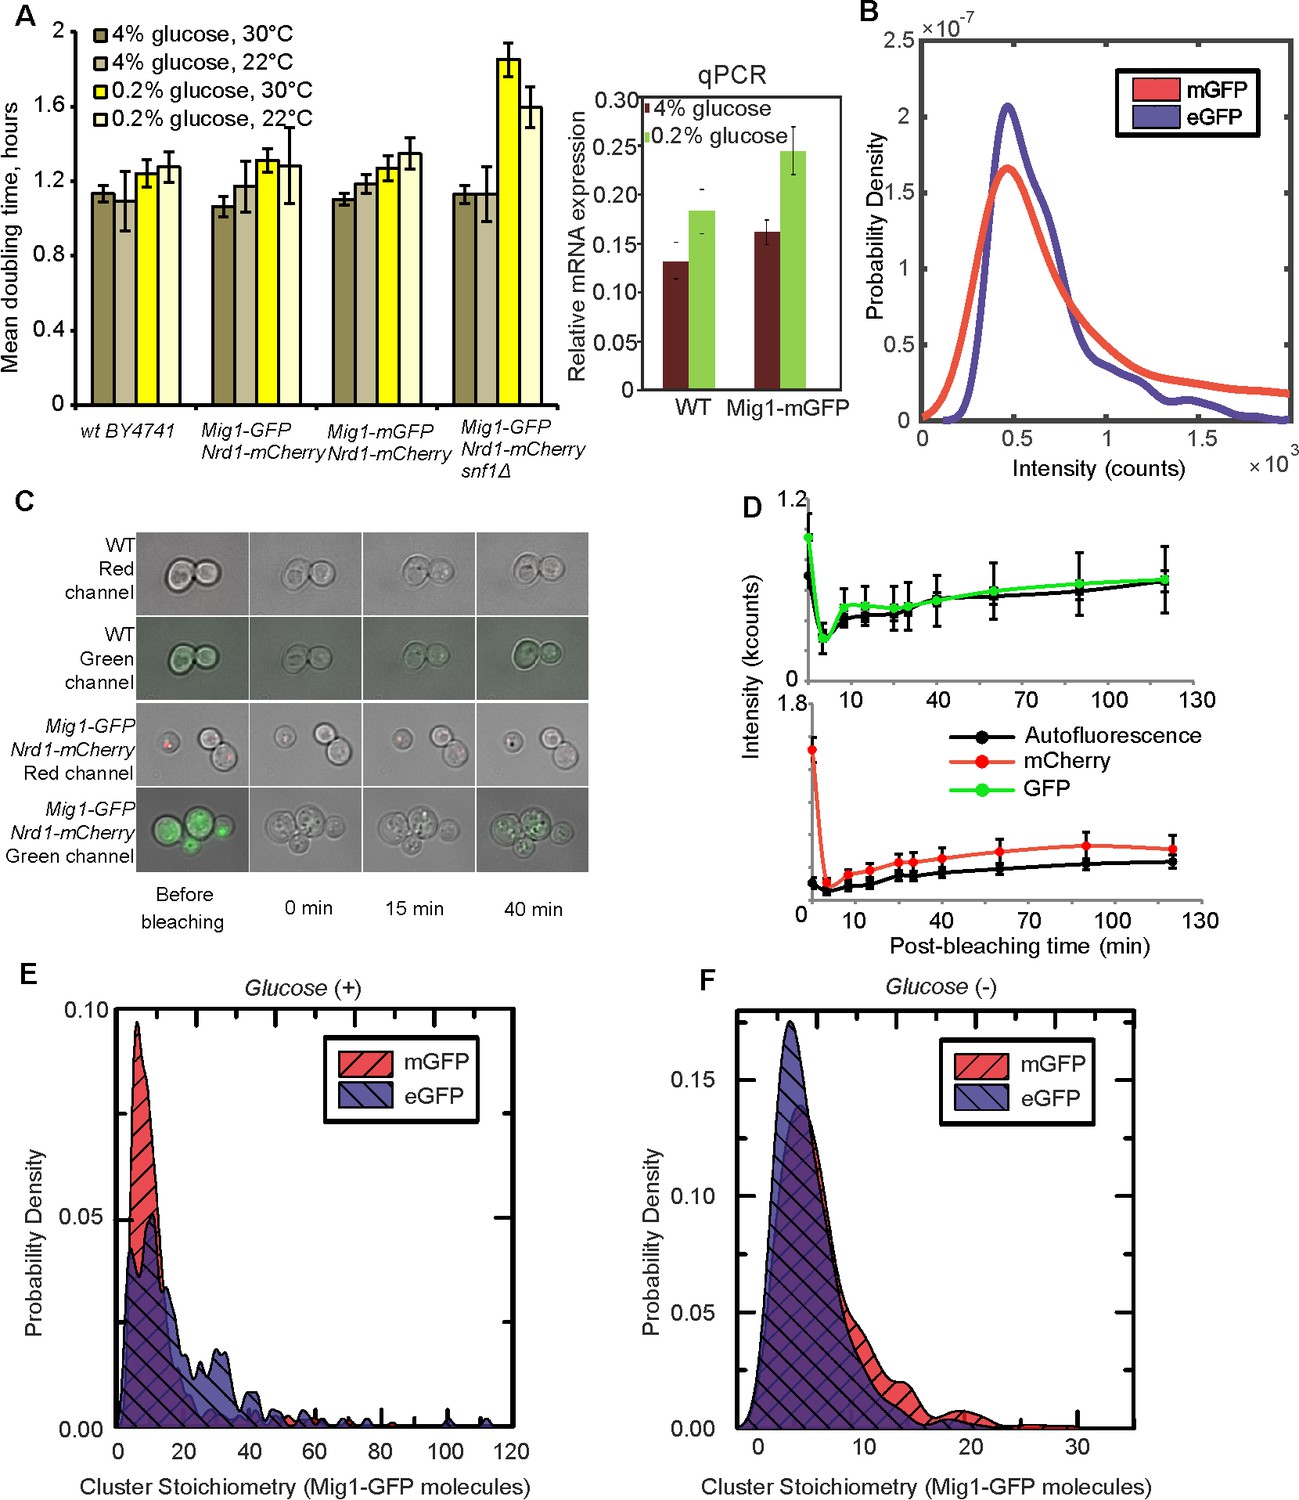
Fluorescent reporter strains have similar viability to wild type, with relatively fast maturation of fluorescent protein, and no evidence for GFP-mediated oligomerization.
(A) (left panel) Mean doubling time ±SEM, number of cultures n = 6; (right panel) relative expression of MIG1 to constitutive ACT1 using qPCR in the wild type and Mig1-mGFP in cells pre-grown in elevated (4%) and depleted (0.2%) glucose, SD error bars, n = 3 repeats for each. (B) ‘Monomeric’ mGFP (red) vs Standard enhanced eGFP (blue) in vitro intensity KDE distributions. GFP/mCherry maturation. n = 1000 foci (C) After continuous illumination images were taken at subsequent time intervals. To prevent appearance of newly synthesized fluorescent proteins, 100 µg/ml cycloheximide was added 1 hr prior to photobleaching. Upper panels represent autofluorescence appearance in green and red channels in BY4741 wild type cells. Standard epifluorescence images (green/red) overlaid on brightfield (gray). (D) GFP and mCherry maturation in minimal YNB media with complete amino acid supplement and 4% glucose. The background-corrected total cellular fluorescence intensity for the wild type (autofluorescence) and Mig1-GFP:Nrd1-mCherry strain was quantified at each time point for each cell in ImageJ. Error bars indicate SEM. (E) and (F) In vivo Mig1-GFP vs Mig1-mGFP stoichiometry KDE distributions compared in glucose (+) and glucose (−) respectively (χ2=0.28, p=1×10−132 and χ2 = 0.011, p=3×10−216). n = 30 cells.
Figure 1—figure supplement 3
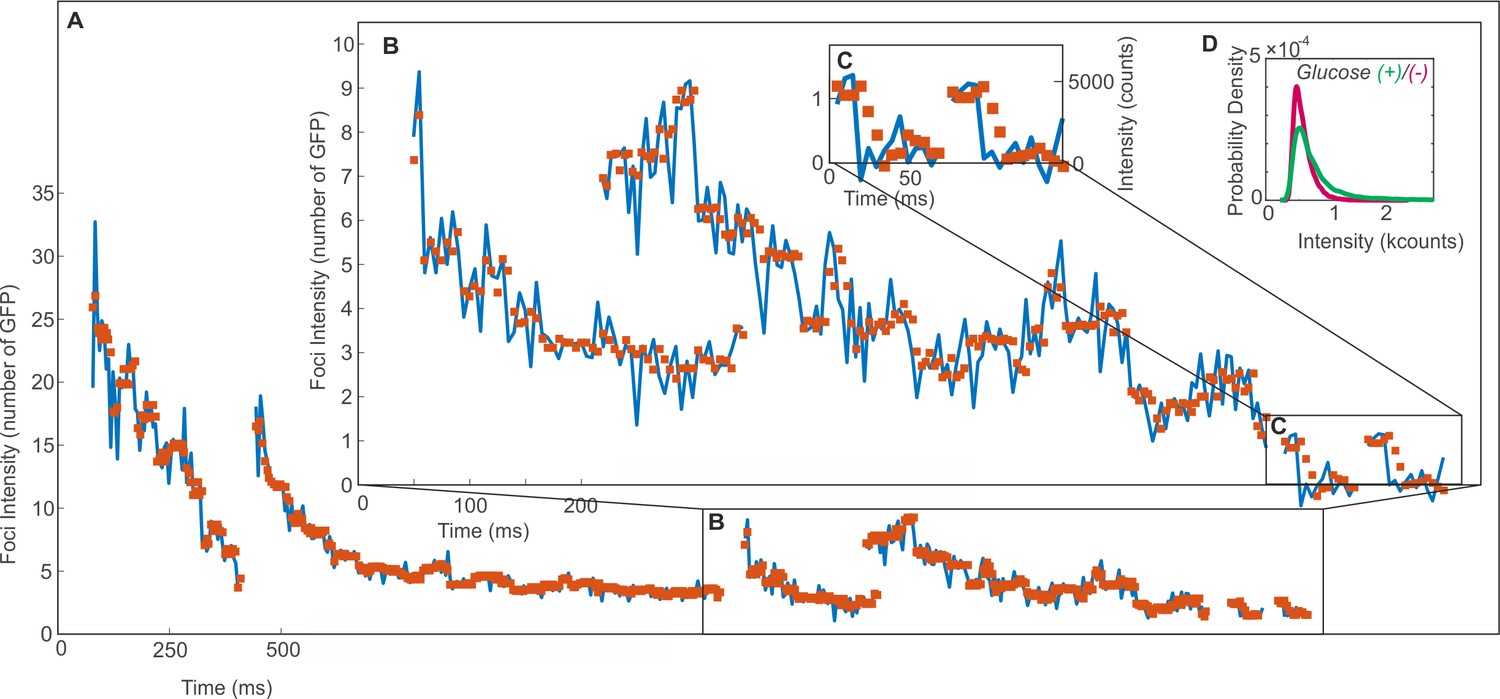
In vivo Mig1-GFP foci intensity traces as a function of time.
Showing the raw tracked intensity (blue line) and filtered (red squares) using an edge preserving Chung-Kennedy filter (Leake et al., 2004; Leake et al., 2003) (15 ms window) for (A) nuclear foci (B) cytoplasmic foci and (C) overtracked foci from > 0.5 s into the photobleach with steps at single GFP intensity. (D) The intensity distribution of Mig1-GFP in vivo at glucose (+/-) using kernel density estimate. Mode values are identical within error: 5200 ± 1500, 4600 ± 700 respectively.
Figure 2 with 3 supplements
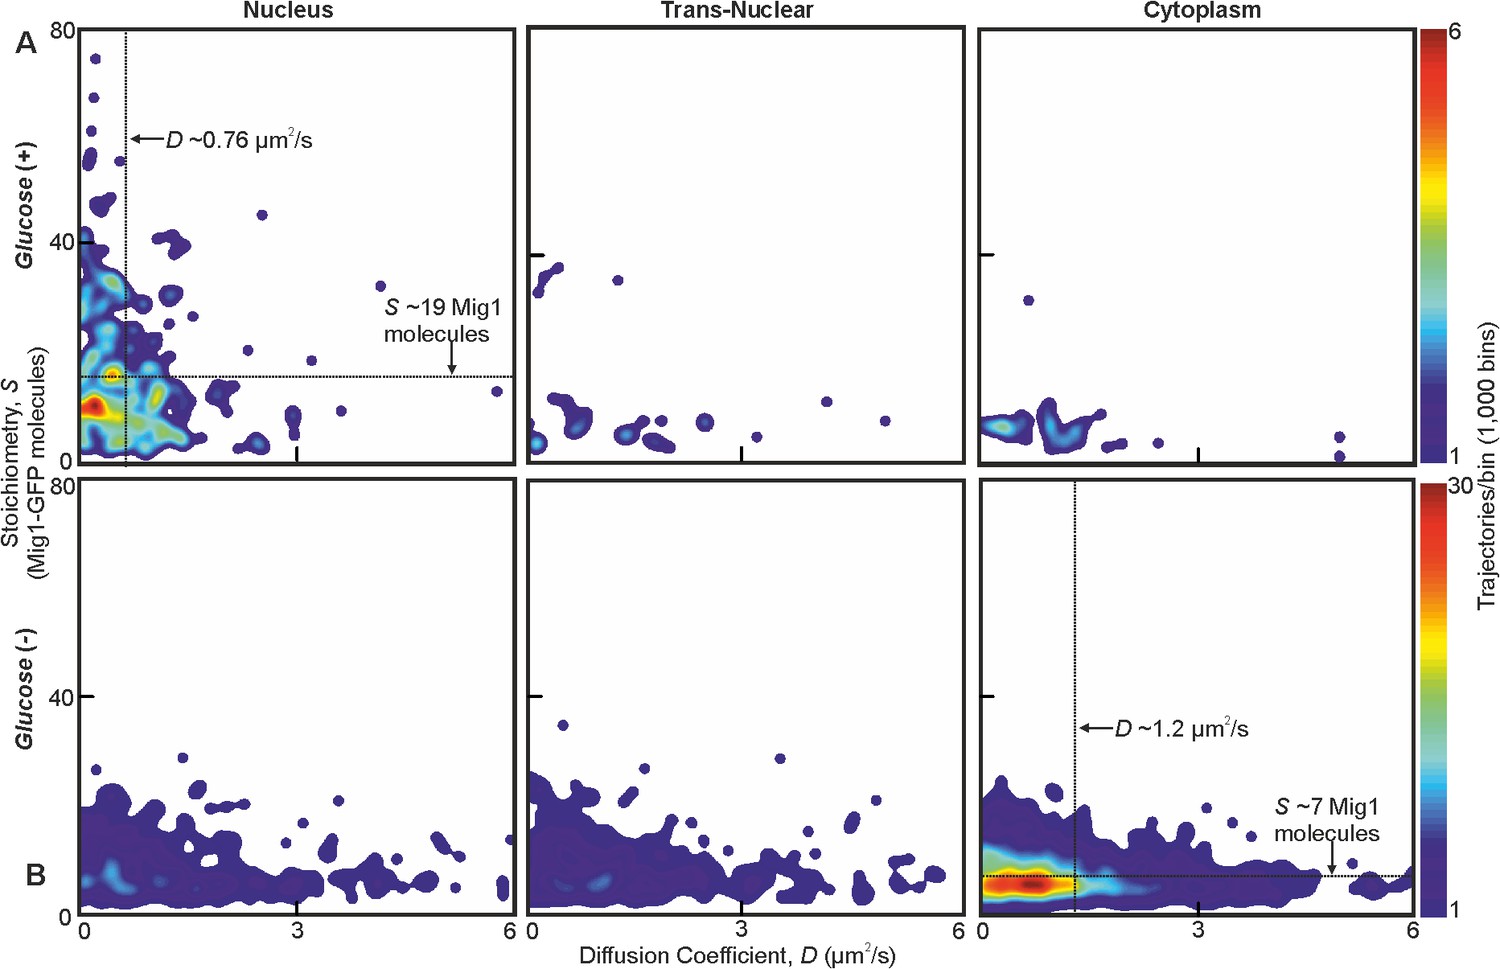
Mig1 foci stoichiometry, mobility and localization depend on glucose.
Heat map showing dependence of stoichiometry of detected GFP-labeled Mig1 foci with D under (A) glucose (+) and (B) glucose (−) extracellular conditions. Mean values for glucose (+) nuclear and glucose (−) cytoplasmic foci indicated (arrows). n = 30 cells. Heat maps generated using 1000 square pixel grid and 15 pixel width Gaussians at each foci, using variable color scales specified by colorbar on the right.
Figure 2—figure supplement 1
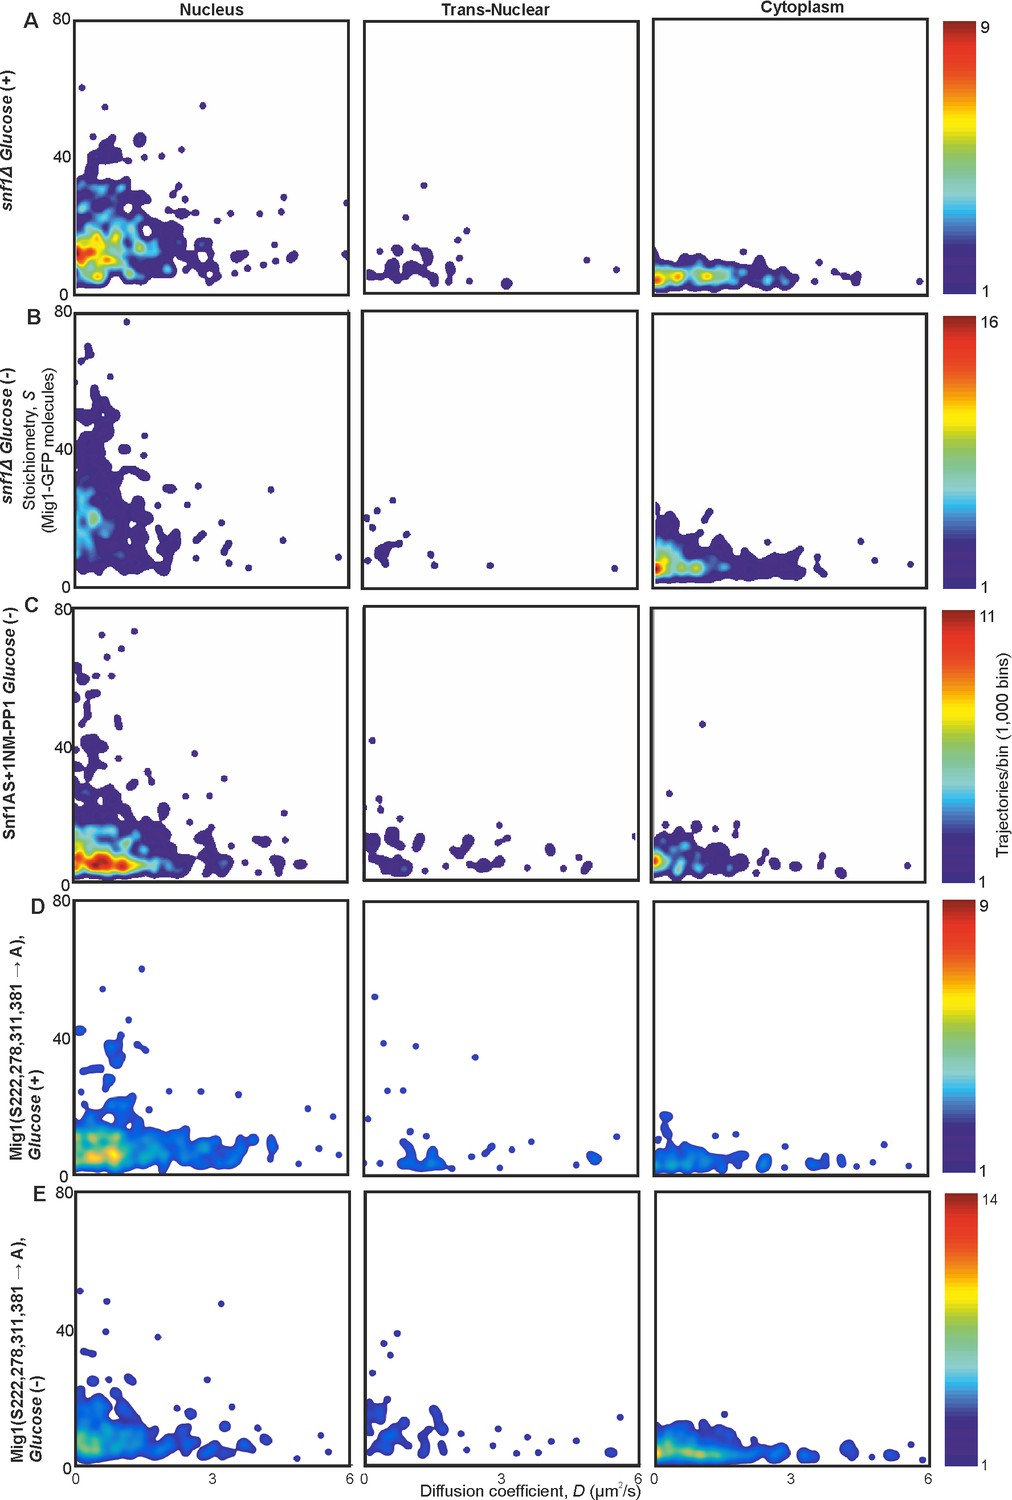
Mig1 phosphorylation does not affect clustering but regulates localization.
Heat maps showing dependence of stoichiometry of detected GFP-labeled Mig1 foci with D in (A,B) SNF1 deletion strain, (C) strain with ATP analog sensitive variant of Snf1, Snf1-I132G, in presence of 1NM-PP1, and (D, E) strain with four serine phosphorylation sites of Mig1 mutated to alanine.
Figure 2—figure supplement 2
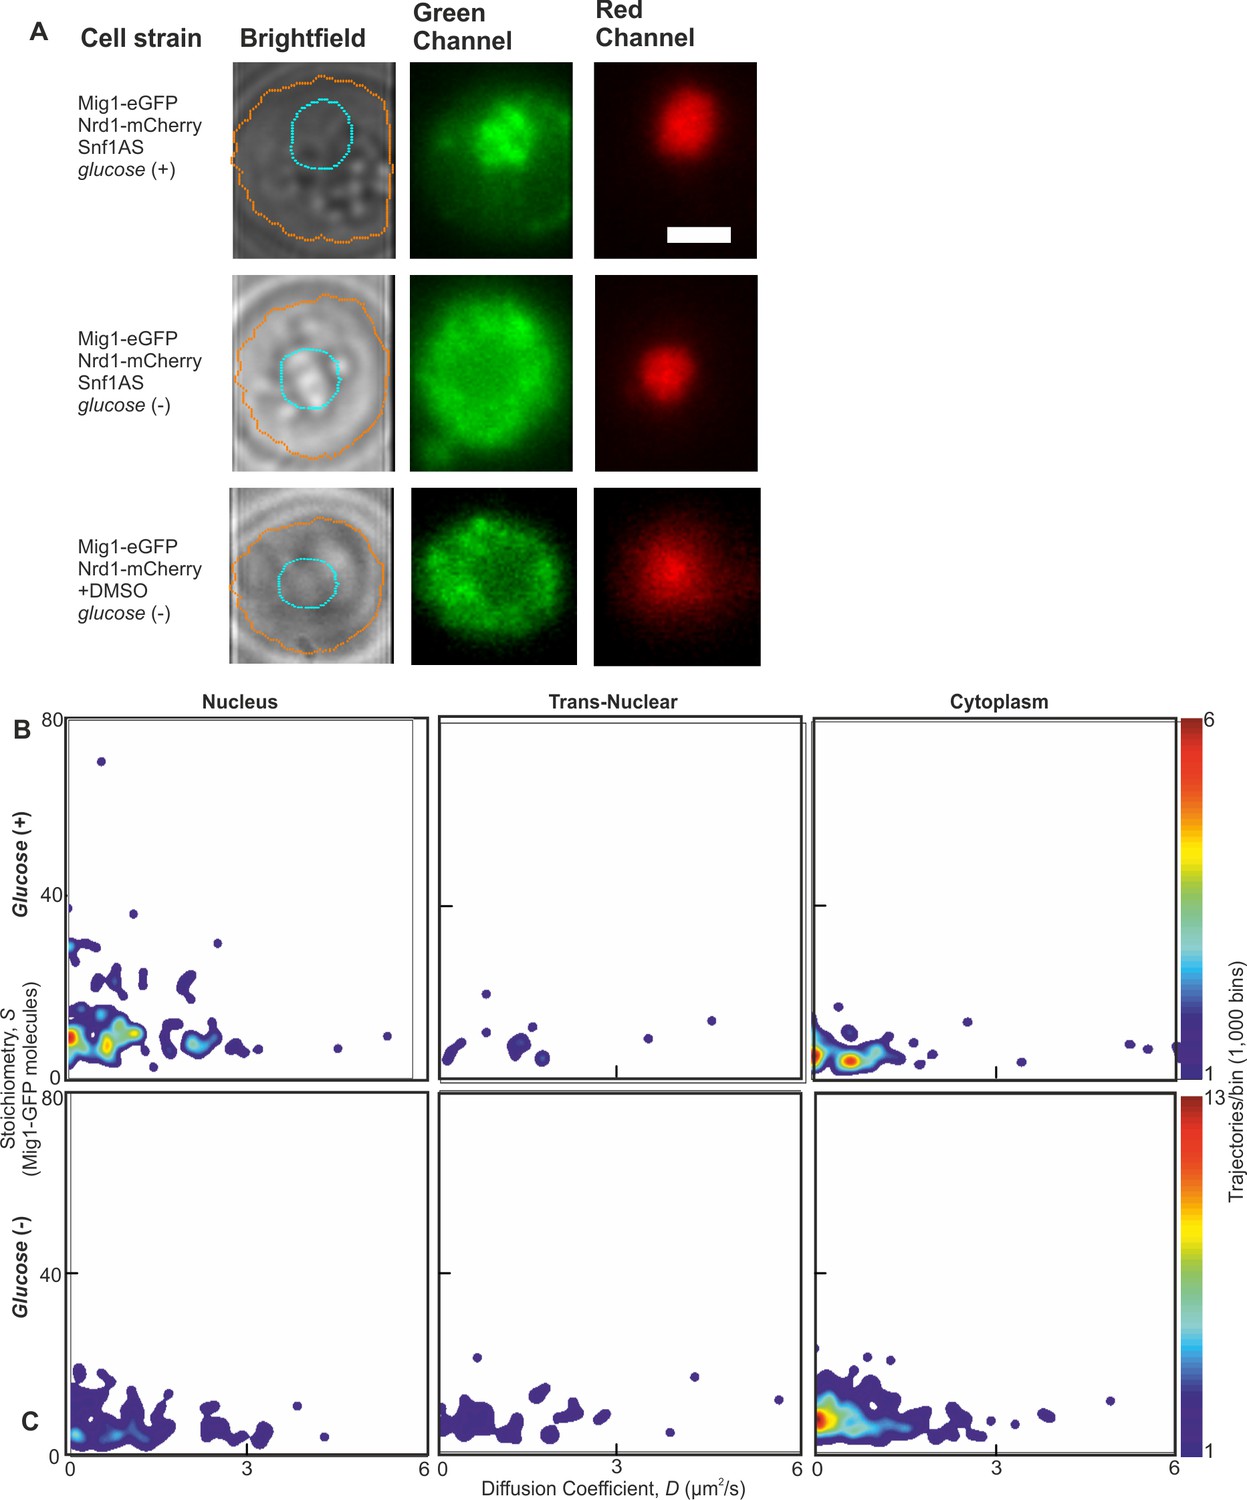
Wild type Snf1 and analog sensitive have similar effect on Mig1.
(A) Representative Slimfield fluorescence images showing expected Mig1 localization for a strain carrying an analog sensitive Snf1 and upon treatment with DMSO. (B,C) Heat maps showing dependence of stoichiometry of detected GFP-labeled Mig1 foci with microscopic diffusion coefficient D in analog sensitive Snf1.
Figure 2—figure supplement 3
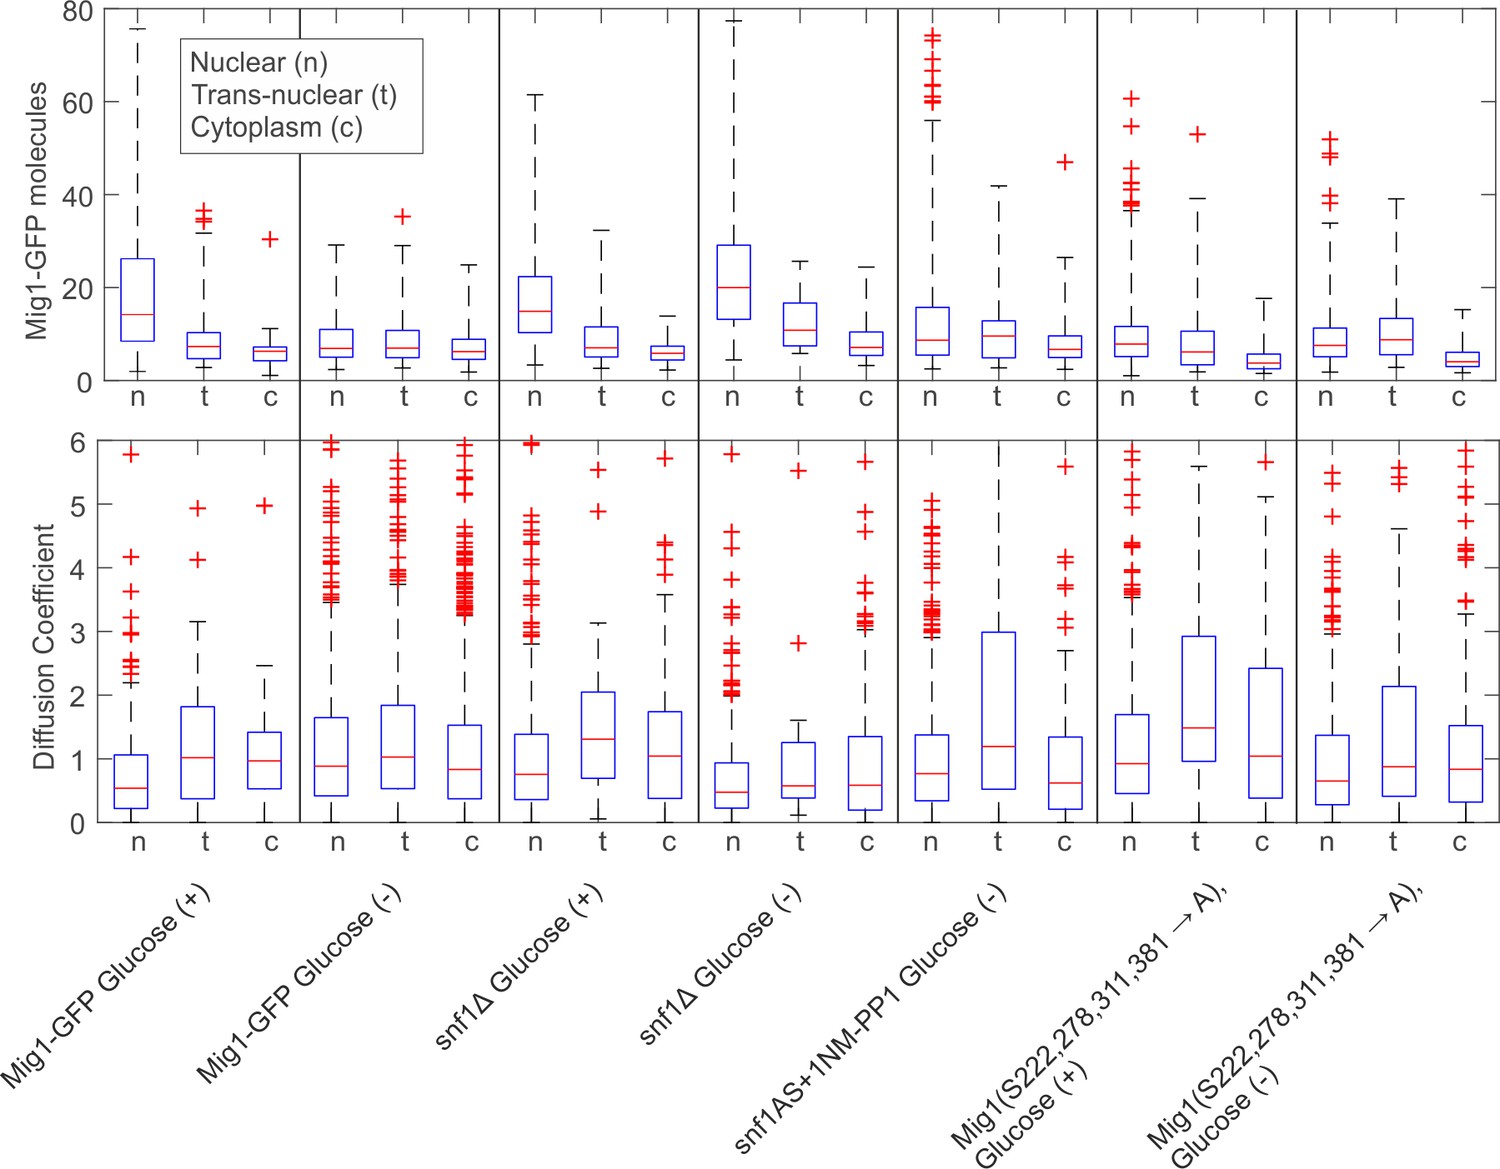
Boxplot summary of wild type and mutant Mig1 stoichiometry and microscopic diffusion coefficient.
Boxplots for stoichiometry (top) and diffusion coefficient (bottom). Median in red, quartiles in blue. Black dotted lines mark the extrema, limited to 4x and 2x upper quartile value for stoichiometry and microscopic diffusion coefficient D respectively with outliers marked with red crosses.
Figure 3 with 1 supplement
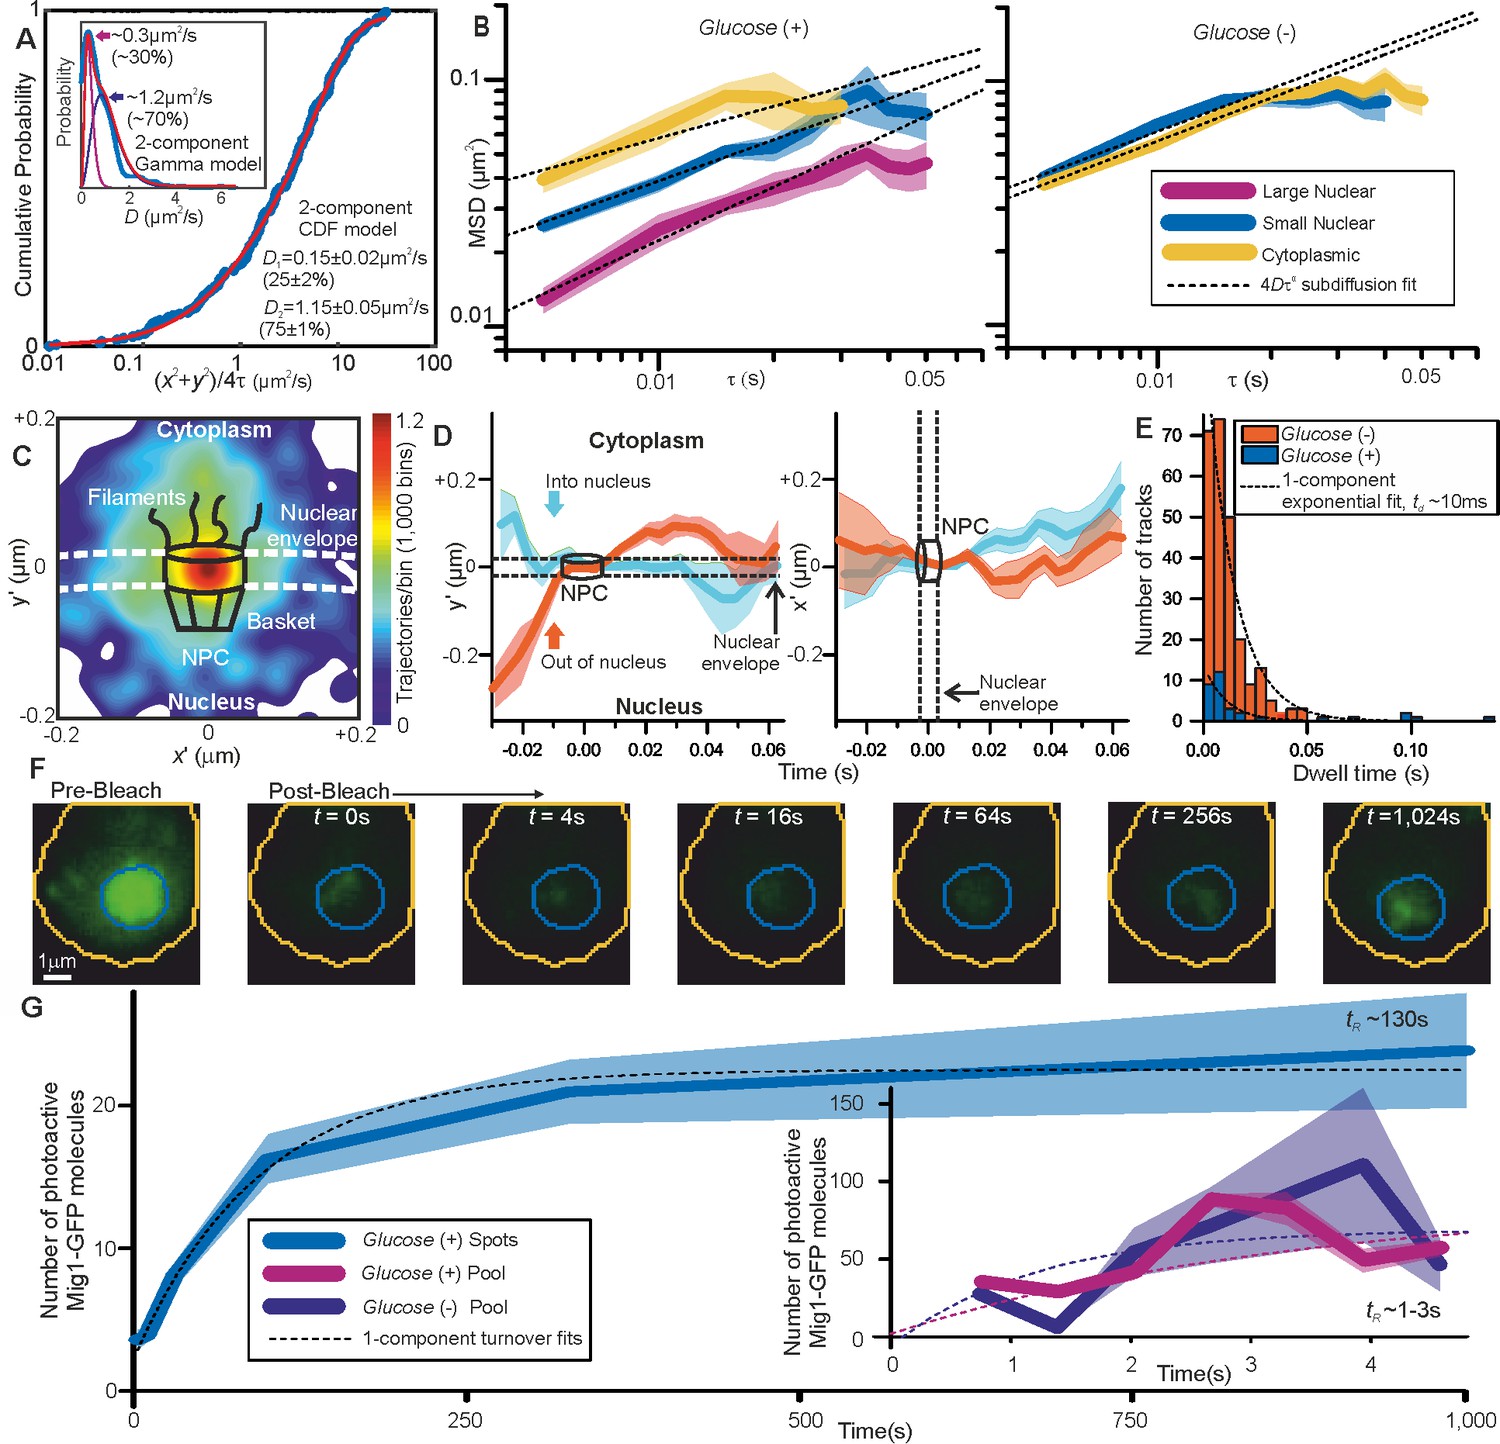
Repressor clusters have heterogeneous mobility depending on localization.
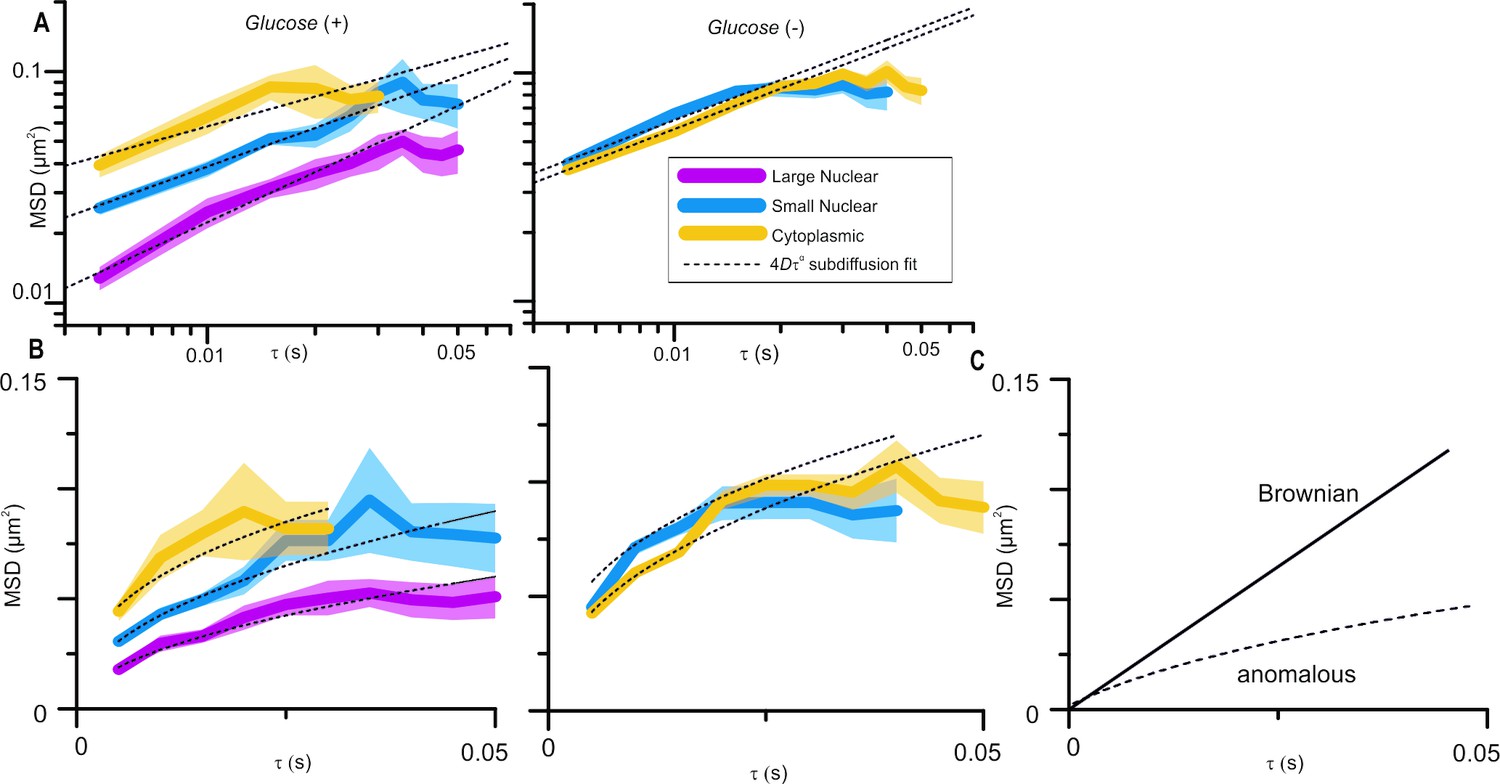
(A) Cumulative probability, glucose (+) nuclear tracks (blue) and two component exponential fit (red), with dual Gamma fit to D (inset) with similar parameters. (B) Mean MSD vs τ (i.e. time interval tau) from cytoplasmic (yellow), small (blue, stoichiometry ≤ 20 Mig1-GFP molecules) and large nuclear (purple, stoichiometry > 20 Mig1-GFP molecules) foci, SEM indicated, on log-log axes, n = 30 cells for glucose (+) and (−). Anomalous diffusion model fits to time intervals ≤ 30 ms (dashed black line), anomalous coefficient α = 0.4–0.8. (C) Heat map of trans-nuclear track localizations normalized to crossover point, generated using 1000 square pixel grid and 10 pixel width Gaussians at each localization (D) distance parallel (left) and perpendicular (right) to nuclear envelope with time, normalized to crossover point for Mig1-GFP foci entering (blue) and leaving the nucleus (red), (E) dwell times at nuclear envelope and single exponential fits (dotted). (F) Example glucose (+) single cell FRAP Slimfield images, fixed display scale (G) mean and SEM nuclear intensity after bleaching, n = 5 and 7 cells for glucose (-/+), respectively.
Figure 3—figure supplement 1
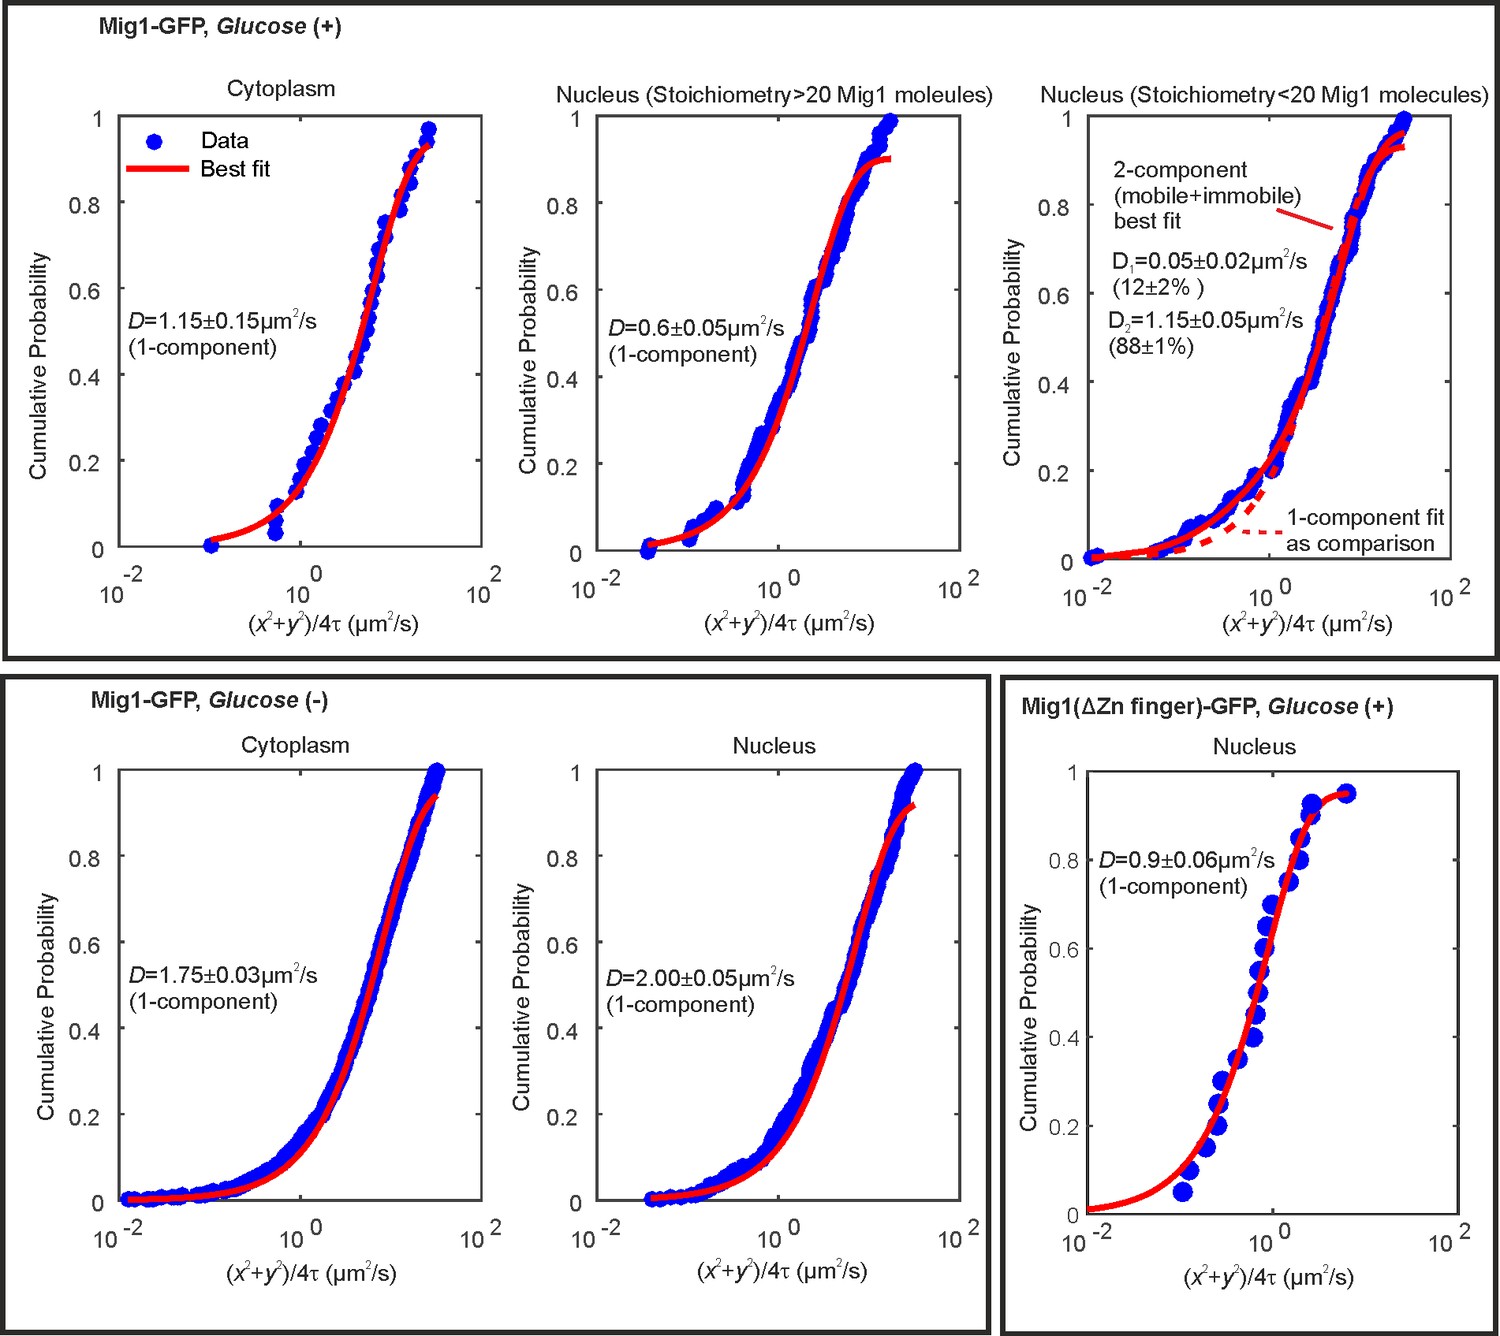
Cumulative probability distance analysis reveals a single mobile population in the cytoplasm at glucose (+/-) and in the nucleus and glucose (−).
Cumulative density functions of first displacement in trajectories (blue) with appropriate fits (red). Bottom right panel indicates Mig1 mutant for which the Zn finger domain has been deleted.
Figure 4 with 3 supplements
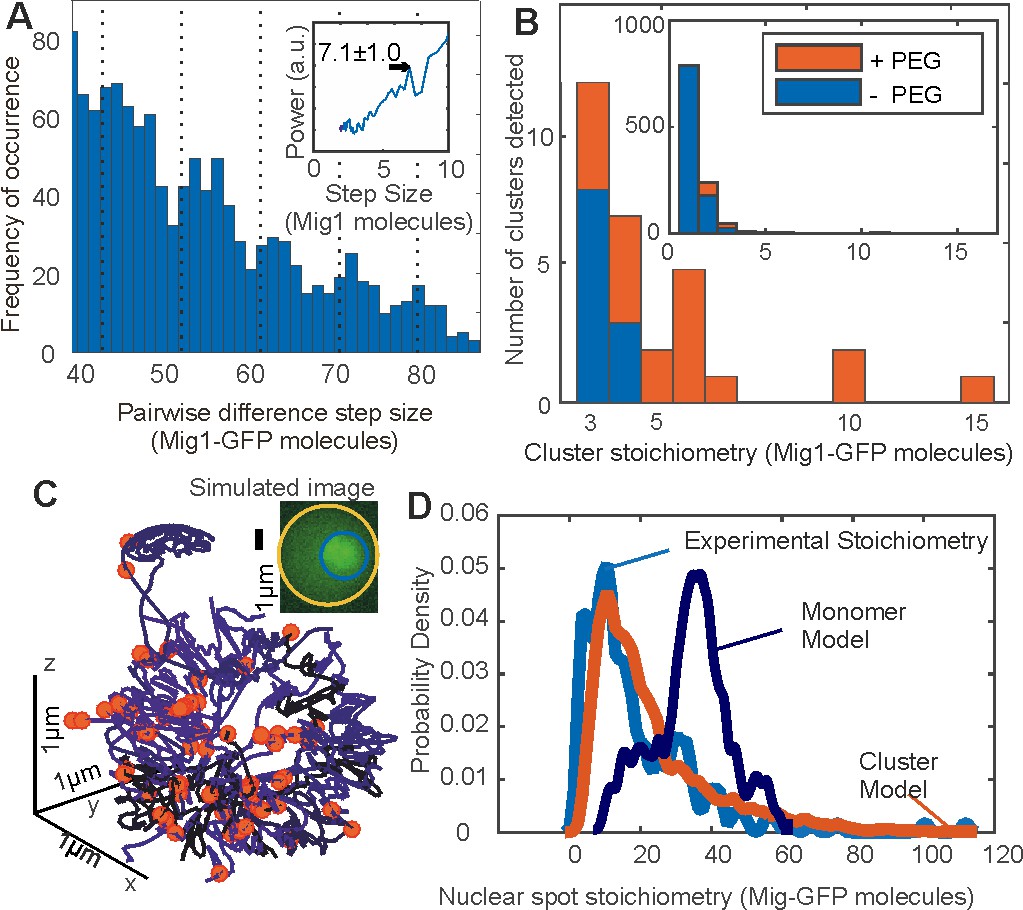
Mig1 clusters are stabilized by depletion forces and bind to promoter targets.
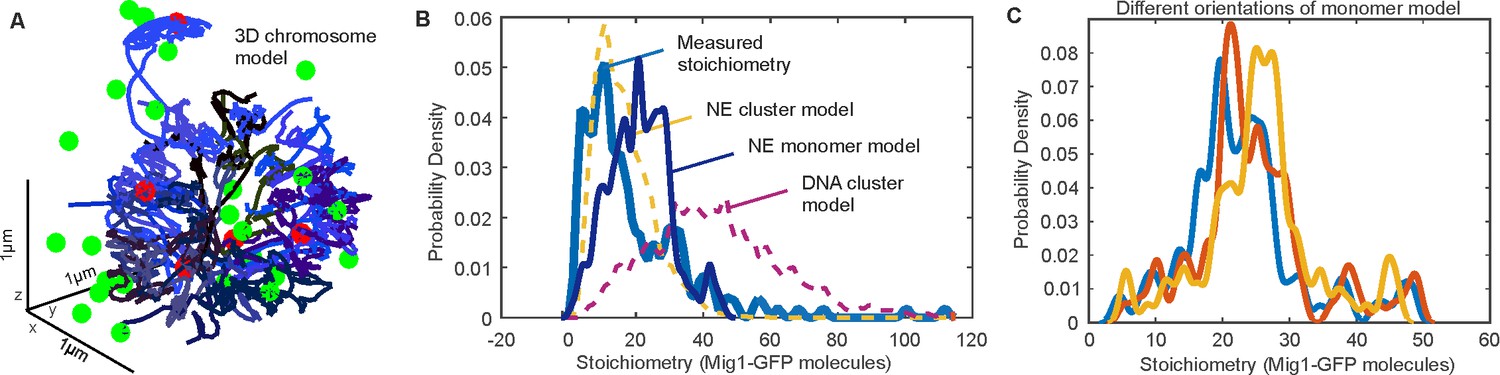
(A) Zoom-in on pairwise difference distribution for stoichiometry of Mig1-GFP foci, 7-mer intervals (dashed) and power spectrum (inset), mean and Gaussian sigma error (arrow). (B) Stoichiometry for Mig1-GFP clusters in vitro in PEG absence (blue)/presence (red). n = 1000 foci. Inset shows the full range while outer zooms in on cluster stoichiometry. (C) 3C model of chromosomal DNA (blue shaded differently for each chromosome) with overlaid Mig1 promoter binding sites from bioinformatics (red), simulated image based on model with realistic signal and noise added (inset). (D) Cluster (red) and monomer (dark blue) model (goodness-of-fit R2 < 0) for Mig1-GFP stoichiometry (10 replicates) compared against experimental data (cyan, R2 = 0.75).
Figure 4—figure supplement 1
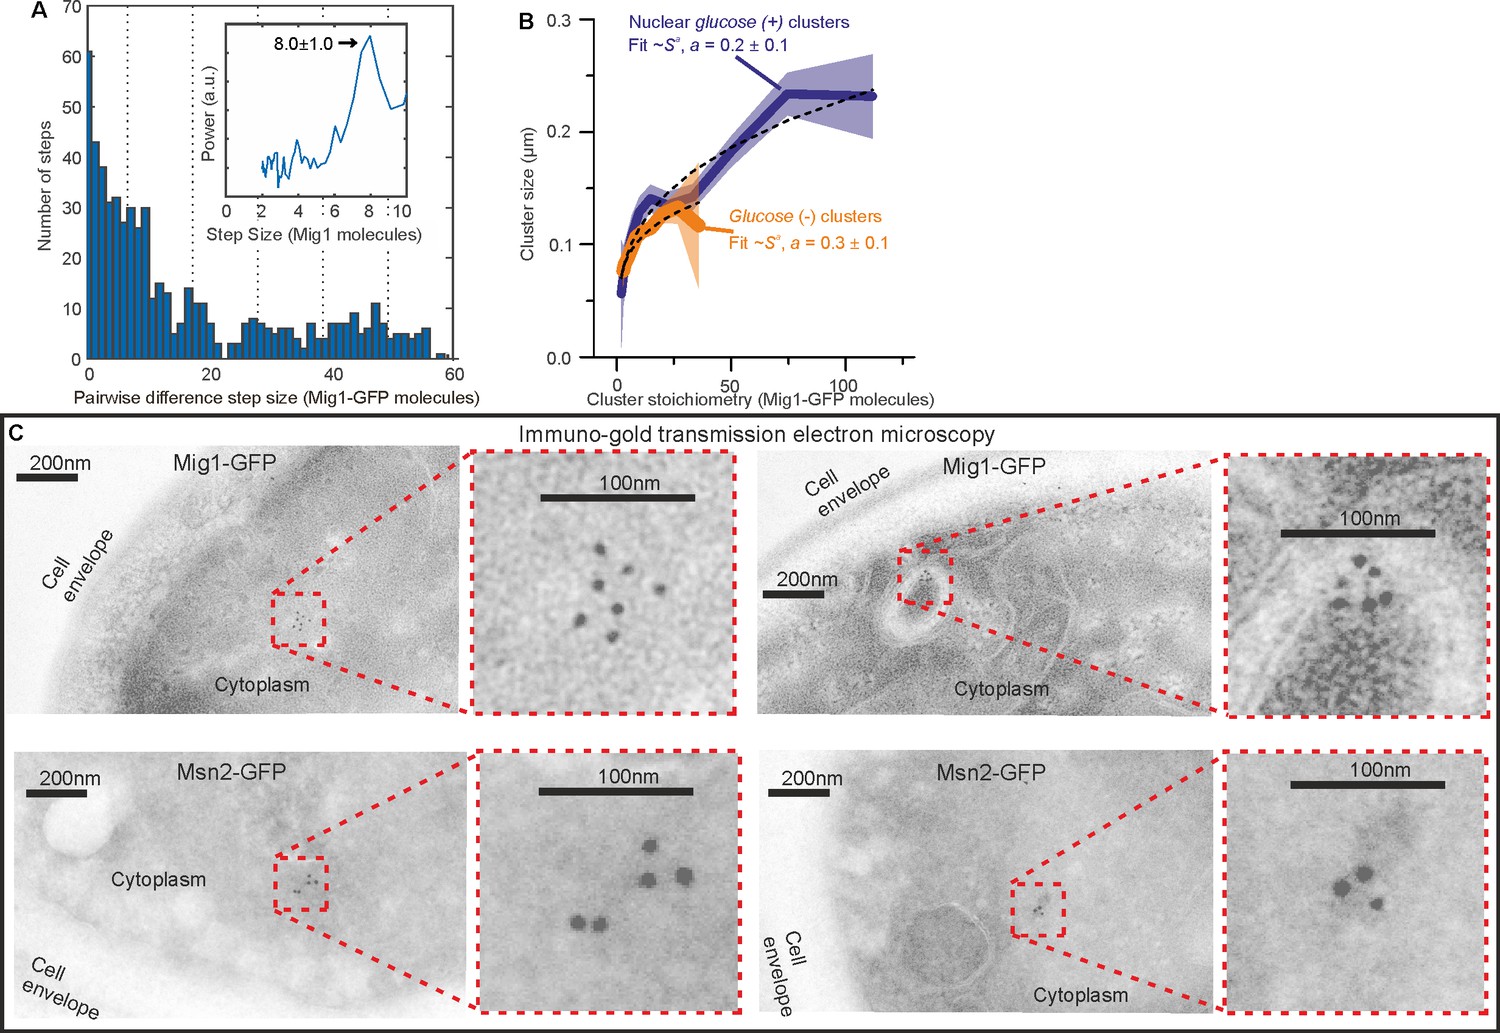
Additional Mig1 cluster investigations.
(A) Zoom-in on pairwise difference distribution for stoichiometry of GFP-labeled Mig1 foci detected during FRAP, ~8 mer intervals (dashed lines) and power spectrum (inset) shown, mean and Gaussian sigma error (arrow). (B) GFP-labeled Mig1 cluster size as a function of stoichiometry with power law fit indicated. (C) Immuno-gold transmission electron microscopy for negatively stained 90 nm cryosections of (upper panel) two different Mig1-GFP cells and (lower panel) two different Msn2-GFP cells, with zoom in (inset).
Figure 4—figure supplement 2
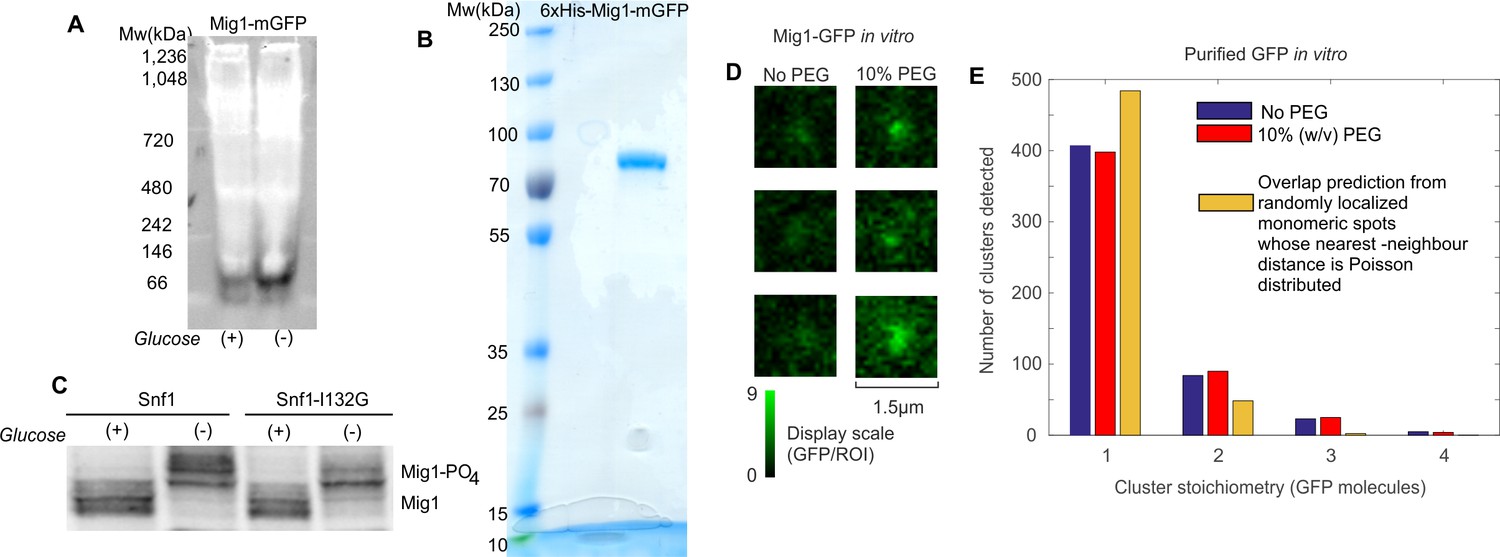
In vitro cluster characterization.
(A) Native PAGE of total cell protein extracts obtained from cells grown in 4% glucose (+) and 0.05% glucose (−) conditions followed by western blotting and probing with anti-GFP antibodies. (B) Coomassie staining of purified Mig1-mGFP fraction indicates a single band that corresponds to the size of a Mig1-GFP monomer (molecular weight 83.4 kDa). (C) Mig1 phosphorylation status is detected by SDS-PAGE on total cell protein extracts obtained from cells grown in different glucose conditions followed by western blotting. De/phosphorylation of Mig1 in glucose (+/-) respectively is not affected by the SNF1- I132G mutation. (D) Slimfield images of Mig1-GFP clusters in vitro in the absence (left) and presence of PEG (right), display intensity scaled in units of GFP per 5 pixel circular region of interest (ROI). (E) Distribution of stoichiometry for mGFP clusters in vitro in absence (blue)/presence (red) of PEG and the expected distribution of overlapping mGFP monomers (yellow).
Figure 4—figure supplement 3
Additional 3C modelling.
(A) 3C model (blue) with overlaid bound Mig1 clusters to promoter binding sites from bioinformatics (red), and Mig1 clusters near the NE (green); (B) predicted stoichiometry distributions for GFP-labeled Mig1 foci in the nucleus at elevated extracellular glucose for a range of different binding models, including: a model which simulates both nuclear envelope (NE) translocating clusters and cluster binding to promoter targets (yellow), a model which simulates both nuclear envelope (NE) translocating monomers and monomer binding to promoter targets and DNA (blue), and a model which simulates just cluster binding to promoter targets but excludes any effects from translocating clusters (purple). These models are optimized to the experimentally determined stoichiometry distribution (cyan); (C) predicted Mig1 monomer stoichiometry distributions for Mig1 bound to promoter sites in three different orientations ~10° apart.
Figure 5
Msn2 and Mig1 forms functional clusters colocalized to transcribed mRNA from their target genes.
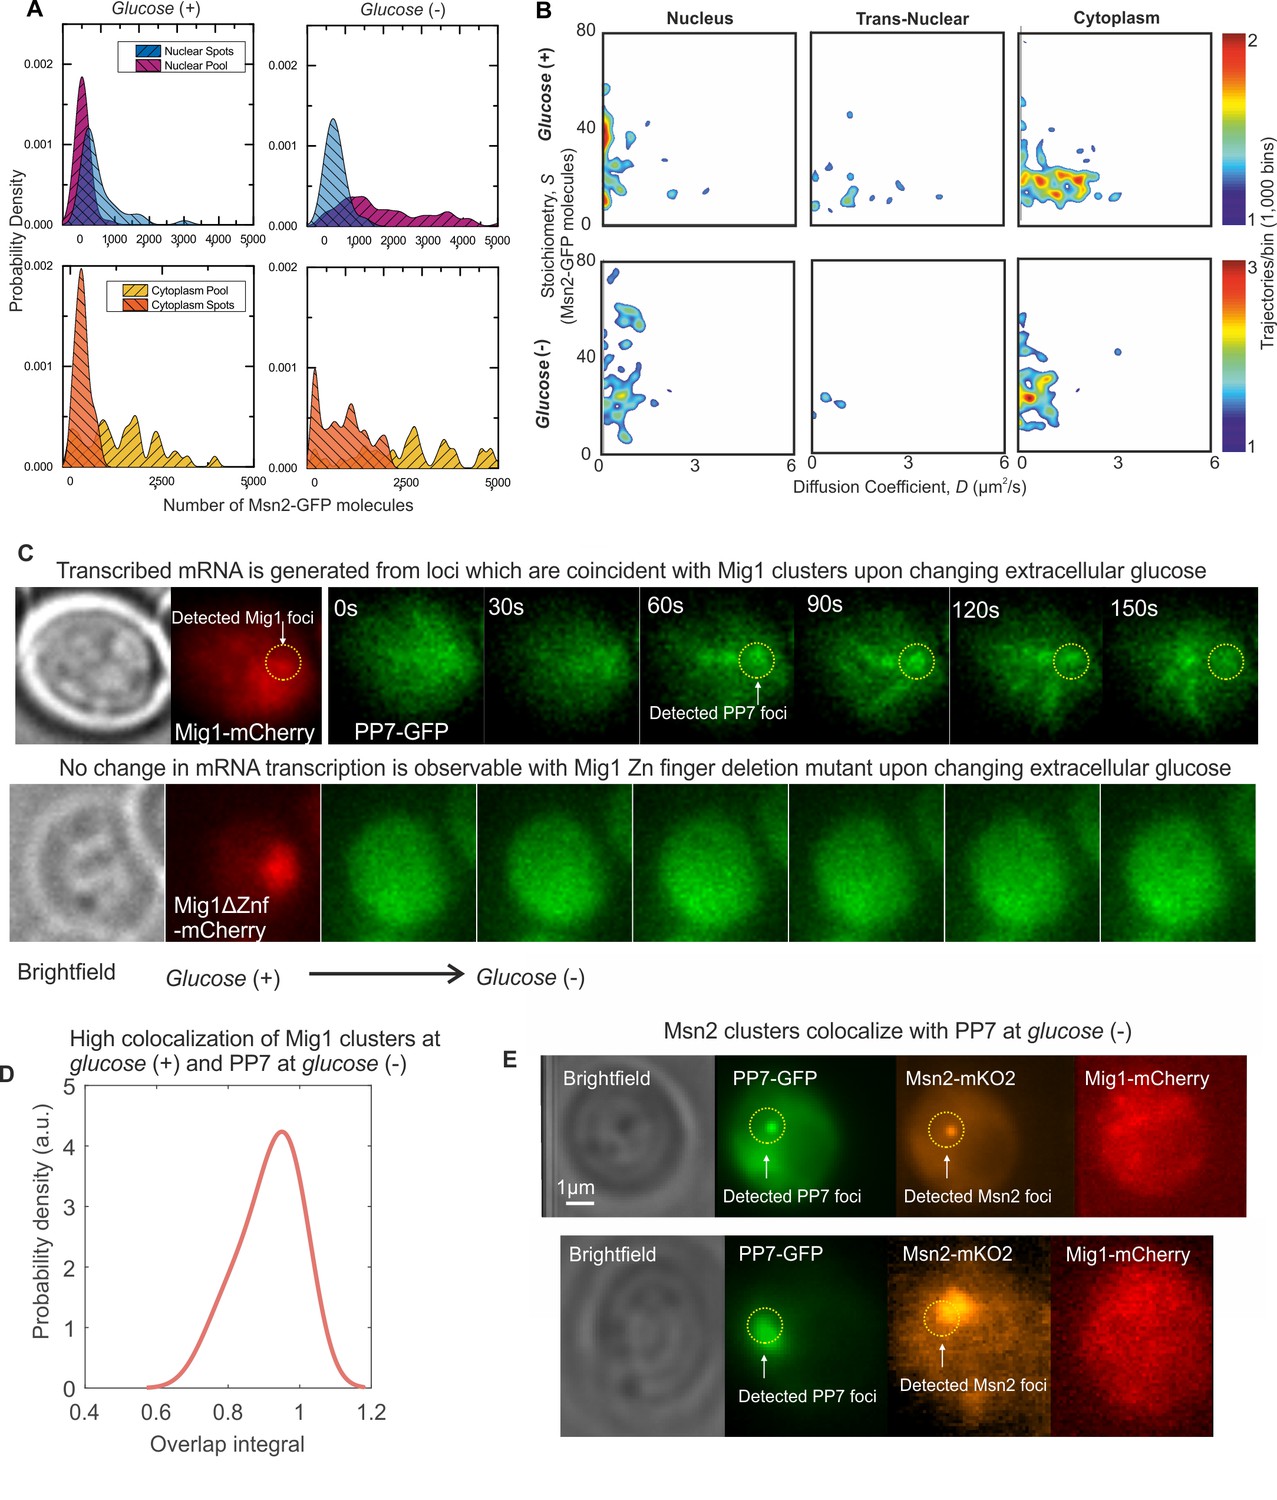
(A) Kernel density estimations for Msn2-GFP in pool and foci for cytoplasm and nucleus at glucose (+/-). (B) Heat maps showing dependence of stoichiometry and D of detected Msn2-GFP foci, n = 30 cells. (C) Slimfield imaging on the same cell in which microfluidics is used to switch from glucose (+) to glucose (−) indicating the emergence of PP7-GFP foci at glucose (−) which are coincident with Mig1-mCherry foci at glucose (+), dependent on the Mig1 Zn finger (same intensity display scales throughout). These Mig1 and PP7 foci have a high level of colocalization as seen from (D) the distribution of the numerical overlap integral between foci in red and green channels at glucose (+) and glucose (−) respectively, peaking at ~0.95. n = 21 cells. (E) Two example cells showing at glucose (−) Msn2-mKO2 foci colocalize with PP7-GFP foci. PP7-2xGFP and Msn2-mKO2 images are frame averages of ~1000 frames, Mig1-mCherry is a Slimfield image.
Figure 6

Mig1 and Msn2 contain disordered sequences which may mediate cluster formation.
(A) Structural prediction for Mig1; Zn finger motif (cyan), disordered sections (red) from PyMOL, beta sheet (gray), phosphorylation sites (yellow); zoom-in indicates structure of conserved Zn finger from PSI-BLAST to PDB ID: 4R2E (Wilms tumor protein, WT1). (B) DISOPRED prediction for Mig1 and Msn2; disordered regions (red), Zn finger regions (cyan). (C) Circular dichroism of Mig1-GFP in vitro in PEG absence (blue)/presence (orange) (D) Distribution of nearest neighbor distances for Mig1 sites within promoters on same (blue) or different (red) chromosome. (E) Schematic of depletion-stabilized Mig1 cluster bound to multiple promoter targets (Zn finger PDB ID: 4R2E). (F) Amino acid residue electrostatic charge plots for Mig1 and Msn2 from EMBOSS (Rice et al., 2000) Residues 'D' and 'E' are assigned a charge of −1, 'K' and 'R' a charge of + 1, and the residue 'H' is assigned a charge of + 0.5, then a rolling 75 amino acid residue window is used. Figures and Tables.
Author response image 1
Videos
Video 1
Dual-color fluorescence microscopy assay at glucose (+).
Example cell showing glucose (+) nuclear Mig1-GFP localization (green, distinct foci black arrows), Nrd1-mCherry (red) and segmented cell body (orange) and nuclear envelope (cyan) indicated, slowed 15x.
Dual-color fluorescence microscopy assay at glucose (−).
Example cell showing glucose (−) Mig1-GFP localization (green, distinct foci black arrows), Nrd1-mCherry (red) and segmented cell body (orange) and nuclear envelope (cyan) indicated, slowed 200x.
Tables
Table 1
S. cerevisiae cell strains and plasmids.
List of all strains and plasmids used in this study.
| Strain name | Background | Genotype | Source/Reference |
|---|---|---|---|
| YSH1351 | S288C | MATa HIS3D0 LEU2D1 MET15D0 URA3D0 | S. Hohmann collection |
| YSH1703 | W303-1A | MATa mig1Δ::LEU2 snf1Δ::KanMX | S. Hohmann collection |
| YSH2267 | BY4741 | MATa his3D1 leu2D0 met15D0 ura3D0 mig1Δ::KanMX NRD1-mCherry-hphNT1 | S. Hohmann collection |
| YSH2350 | BY4741 | MATa MSN2-GFP-HIS3 NRD1-mCherry-hphNT1 MET LYS | (Babazadeh et al., 2013) |
| YSH2856 | BY4741 | MATa MIG1-eGFP-KanMX NRD1-mCherry-HphNT1 snf1Δ::LEU2 MET LYS | This study |
| YSH2348 | BY4741 | MATa MIG1-GFP-HIS3 NRD1-mCherry-hphNT1 MET LYS | (Bendrioua et al., 2014) |
| YSH2862 | BY4741 | MATa MIG1-GFPmut3-HIS3 | This study |
| YSH2863 | BY4741 | MATa MIG1-GFPmut3-HIS3 NRD1-mCherry-HphMX4 | This study |
| YSH2896 | BY4741 | MATa MIG1-mEOs2-HIS3 | This study |
| ME404 | BY4741 | ‘BY4741 MSN2-mKO2::LEU2 MIG1- mCherry::spHIS5 GSY1-24xPP7::KANMX msn4Δ mig2Δ nrg1::HPHMX nrg2::Met15 SUC2::NatMX’ | (Lin et al., 2015) |
| ME412 | BY4741 | BY4741 MSN2-mKO2::LEU2 MIG1(Δaa36-91)- mCherry::spHIS5 GSY1-24xPP7::KANMX msn4Δ mig2Δnrg1::HPHMX nrg2::Met15 | (Lin et al., 2015) |
| ME411 | BY4741 | MIG1(Δaa36-91)-mCherry::spHIS5 GSY1-24xPP7::KANMX msn4Δ mig2Δnrg1::HPHMX nrg2::Met15 | (Lin et al., 2015) |
| Plasmid name | Description | Source/Reference |
|---|---|---|
| pMIG1-HA | HIS3 | (Schmidt and McCartney, 2000) |
| pSNF1-TAP | URA3, in pRS316 | S. Hohmann collection |
| pSNF1-I132G-TAP | URA3, in pRS316 | S. Hohmann collection |
| pmGFPS | HIS3, GFPmut3 S65G, S72A, A206K | This study |
| pMig1-mGFP | 6xHIS-Mig1-GFPmut3 in pRSET A | This study |
| pmEOs2 | mEOs2-HIS3 in pMK-RQ | This study |
| YDp-L | LEU2 | (Berben et al., 1991) |
| YDp-H | HIS3 | (Berben et al., 1991) |
| BM3726 | Mig1 (Ser222,278,311,381 → Ala), URA3, in pRS316 | M. Johnston collection (DeVit and Johnston, 1999) |
| pDZ276 | PP7-2xGFP::URA3 | (Lin et al., 2015) |
Table 2
Copy number data.
Mean average and SD of copy number in pool and foci in each compartment.
| Mig1-GFP | Msn2-GFP | |||||||
|---|---|---|---|---|---|---|---|---|
| Glucose (+) | Glucose (−) | Glucose (+) | Glucose (−) | |||||
| Mean | SD | Mean | SD | Mean | SD | Mean | SD | |
| Cytoplasmic Pool | 509 | 274 | 949 | 394 | 1422 | 977 | 2487 | 1360 |
| Nuclear Pool | 77 | 101 | 140 | 97 | 551 | 608 | 1692 | 1221 |
| Total Pool | 586 | 336 | 1088 | 392 | 1973 | 1585 | 4179 | 2581 |
| Cytoplasmic Spots | 57 | 79 | 311 | 212 | 333 | 196 | 776 | 635 |
| Nuclear Spots | 190 | 99 | 35 | 63 | 81 | 138 | 320 | 269 |
| Total Spots | 246 | 100 | 345 | 203 | 414 | 334 | 1096 | 904 |
| Total Cytoplasm | 580 | 276 | 1156 | 399 | 1755 | 1173 | 3263 | 1995 |
| Total Nuclear | 226 | 155 | 176 | 124 | 632 | 746 | 2012 | 1490 |
| Total Cell | 806 | 353 | 1331 | 352 | 2387 | 1919 | 5274 | 3485 |
Table 3
Foci tracking data.
Mean average, SD and mean number detected per cell (N) of stoichiometry values (molecules), and microscopic diffusion coefficients D in each compartment detected within the depth of field.
| Mig1-GFP | Msn2-GFP | |||||||||||
|---|---|---|---|---|---|---|---|---|---|---|---|---|
| Glucose (+) | Glucose (−) | Glucose (+) | Glucose (−) | |||||||||
| Mean | SD | N | Mean | SD | N | Mean | SD | N | Mean | SD | N | |
| Stoichiometry of Nuclear Spots | 19.0 | 16.2 | 7.2 | 8.5 | 4.8 | 5.8 | 34.5 | 26.6 | 3.5 | 46.5 | 31.6 | 4.7 |
| Diffusion Constant of Nuclear Spots (µm2/s) | 0.8 | 0.8 | 7.2 | 1.3 | 1.5 | 5.8 | 0.7 | 0.9 | 3.5 | 0.9 | 0.9 | 4.7 |
| Stoichiometry of Trans-Nuclear Spots | 10.6 | 10.2 | 1.0 | 8.7 | 5.3 | 5.1 | 21.8 | 16.7 | 1.9 | 43.9 | 35.0 | 0.9 |
| Diffusion Constant of Trans-Nuclear Spots (µm2/s) | 1.3 | 1.2 | 1.0 | 1.5 | 1.6 | 5.1 | 1.5 | 1.2 | 1.9 | 1.1 | 1.1 | 0.9 |
| Stoichiometry of Cytoplasmic Spots | 6.6 | 4.9 | 1.1 | 7.2 | 3.7 | 17.8 | 25.7 | 19.5 | 4.8 | 30.1 | 17.5 | 4.0 |
| Diffusion Constant of Cytoplasmic Spots (µm2/s) | 1.4 | 1.4 | 1.1 | 1.2 | 1.2 | 17.8 | 1.2 | 1.1 | 4.8 | 1.0 | 1.4 | 4.0 |
Table 4
snf1Δ foci tracking and copy number data.
Upper panel: Mean average, SD and mean number detected per cell (N) of stoichiometry values (molecules), and microscopic diffusion coefficients D in each compartment detected within the depth of field. Lower panel: Mean average and SD of copy number in pool and foci in each compartment.
| Mig1-GFP snf1Δ | ||||||
|---|---|---|---|---|---|---|
| Glucose (+) | Glucose (−) | |||||
| Mean | SD | N | Mean | SD | N | |
| Stoichiometry of Nuclear Spots | 17.5 | 10.9 | 13.2 | 23.5 | 15.4 | 10.9 |
| Diffusion Constant of Nuclear Spots (µm2/s) | 1.1 | 1.1 | 13.2 | 0.7 | 0.8 | 10.9 |
| Stoichiometry of Trans-Nuclear Spots | 8.9 | 6.0 | 1.2 | 12.7 | 6.1 | 0.5 |
| Diffusion Constant of Trans-Nuclear Spots (µm2/s) | 1.9 | 2.0 | 1.2 | 1.1 | 1.4 | 0.5 |
| Stoichiometry of Cytoplasmic Spots | 6.2 | 2.2 | 5.0 | 8.3 | 4.1 | 9.1 |
| Diffusion Constant of Cytoplasmic Spots (µm2/s) | 1.3 | 1.2 | 5.0 | 1.0 | 1.2 | 9.1 |
| Copy Numbers | ||||||
| Cytoplasmic Pool | 947 | 728 | 30 | 608 | 450 | 30 |
| Nuclear Pool | 807 | 398 | 30 | 611 | 325 | 30 |
| Total Pool | 1754 | 1127 | 30 | 1219 | 775 | 30 |
| Cytoplasmic Spots | 118 | 169 | 30 | 334 | 374 | 30 |
| Nuclear Spots | 162 | 69 | 30 | 164 | 71 | 30 |
| Total Spots | 280 | 238 | 30 | 498 | 445 | 30 |
| Total Cytoplasm | 1065 | 897 | 30 | 941 | 824 | 30 |
| Total Nuclear | 969 | 467 | 30 | 775 | 396 | 30 |
| Total Cell | 2034 | 1364 | 30 | 1717 | 1220 | 30 |
Table 5
Number of potential Mig1 target promoter sites per chromosome.
List of S.cerevisiae chromosomes indicating the length of a chromosome, total number of potential Mig1 target sites identified and then the number of sites on promoters assuming a promoter region up to 500 bp upstream of a gene.
| Chromosome | Length (bp) | N sites identified | N promoter sites |
|---|---|---|---|
| I | 230218 | 41 | 1 |
| II | 813184 | 134 | 10 |
| III | 316620 | 52 | 2 |
| IV | 1531933 | 240 | 14 |
| V | 576874 | 109 | 8 |
| VI | 270161 | 58 | 4 |
| VII | 1090940 | 168 | 13 |
| VIII | 562643 | 92 | 2 |
| IX | 439888 | 94 | 8 |
| X | 745751 | 125 | 6 |
| XI | 666816 | 117 | 6 |
| XII | 1078177 | 194 | 12 |
| XIII | 924431 | 157 | 6 |
| XIV | 784333 | 135 | 3 |
| XV | 1091291 | 185 | 11 |
| XVI | 948066 | 163 | 6 |
Table 6
Bioinformatics analysis for intrinsically disordered sequences.
Predictions for the presence of intrinsically disordered sequences in Mig1, Msn2 and LacI, and of the positions of phosphorylation sites in Mig1 and Msn2.
| Msn2: | |
|---|---|
| Predicted residues: 704 | Number Disordered Regions: 12 |
| Number residues disordered: 394 | Longest Disordered Region:145 |
| Overall percent disordered: 55.97 | Average Prediction Score: 0.5577 |
| Predicted disorder segment [1 - 2] | Average Strength = 0.8759 |
| Predicted disorder segment [16 - 33] | Average Strength = 0.6958 |
| Predicted disorder segment [55 - 199] | Average Strength = 0.8311 |
| Predicted disorder segment [222 - 249] | Average Strength = 0.8237 |
| Predicted disorder segment [322 - 365] | Average Strength = 0.8820 |
| Predicted disorder segment [410 - 428] | Average Strength = 0.7475 |
| Predicted disorder segment [469 - 480] | Average Strength = 0.6545 |
| Predicted disorder segment [510 - 549] | Average Strength = 0.8040 |
| Predicted disorder segment [572 - 641] | Average Strength = 0.9319 |
| Predicted disorder segment [660 - 667] | Average Strength = 0.6829 |
| Predicted disorder segment [694 - 695] | Average Strength = 0.5325 |
| Predicted disorder segment [699 - 704] | Average Strength = 0.6783 |
| Mig1: | |
|---|---|
| Predicted residues: 504 | Number Disordered Regions: 9 |
| Number residues disordered: 372 | Longest Disordered Region: 95 |
| Overall percent disordered: 73.81 | Average Prediction Score: 0.7008 |
| Predicted disorder segment [1 - 12] | Average Strength = 0.8252 |
| Predicted disorder segment [25 - 33] | Average Strength = 0.6502 |
| Predicted disorder segment [77 - 171] | Average Strength = 0.8758 |
| Predicted disorder segment [173 - 240] | Average Strength = 0.9051 |
| Predicted disorder segment [242 - 249] | Average Strength = 0.5554 |
| Predicted disorder segment [254 - 272] | Average Strength = 0.7890 |
| Predicted disorder segment [292 - 310] | Average Strength = 0.8225 |
| Predicted disorder segment [327 - 386] | Average Strength = 0.8355 |
| Predicted disorder segment [423 - 504] | Average Strength = 0.9136 |
| Lacl: | |
|---|---|
| Predicted residues: 360 | Number Disordered Regions: 8 |
| Number residues disordered: 149 | Longest Disordered Region: 48 |
| Overall percent disordered: 41.39 | Average Prediction Score: 0.4418 |
| Predicted disorder segment [1 - 4] | Average Strength = 0.6245 |
| Predicted disorder segment [18 - 52] | Average Strength = 0.6710 |
| Predicted disorder segment [55 - 81] | Average Strength = 0.7443 |
| Predicted disorder segment [88 - 100] | Average Strength = 0.5841 |
| Predicted disorder segment [186 - 187] | Average Strength = 0.5429 |
| Predicted disorder segment [238 - 256] | Average Strength = 0.6208 |
| Predicted disorder segment [258 - 258] | Average Strength = 0.5028 |
| Predicted disorder segment [313 - 360] | Average Strength = 0.8331 |
| Phosphorylation sites of Mig1 and Msn2 (uniprot.org, accessed February, 2016): | |||
|---|---|---|---|
| Mig1 phosphorylation site | Disorder segment | Msn2 phosphorylation site | Disorder segment |
| S264 | [254 - 272] | S194 | [55 - 199] |
| S278 | - | S201 | - |
| T280 | - | S288 | - |
| S302 | [292 - 310] | S304 | - |
| S311 | [292 - 310] | S306 | - |
| S314 | - | S308 | - |
| S80 | [77 - 171] | S432 | - |
| S108 | [77 - 171] | S451 | - |
| S214 | [173 - 240] | S582 | [572 - 641] |
| S218 | [173 - 240] | S620 | [572 - 641] |
| S222 | [173 - 240] | S625 | [572 - 641]] |
| S303 | [292 - 310] | T627 | [572 - 641] |
| S310 | [292 - 310] | S629 | [572 - 641] |
| S350 | [327 - 386] | S633 | [572 - 641] |
| S367 | [327 - 386] | ||
| S370 | [327 - 386] | ||
| T371 | [327 - 386] | ||
| S377 | [327 - 386] | ||
| S379 | [327 - 386] | ||
| S381 | [327 - 386] | ||
| S400 | - | ||
| S402 | - | ||
| T455 | [423 - 504] | ||
Additional files
-
Transparent reporting form
- https://doi.org/10.7554/eLife.27451.026
Download links
A two-part list of links to download the article, or parts of the article, in various formats.
Downloads (link to download the article as PDF)
Open citations (links to open the citations from this article in various online reference manager services)
Cite this article (links to download the citations from this article in formats compatible with various reference manager tools)
Transcription factor clusters regulate genes in eukaryotic cells
eLife 6:e27451.
https://doi.org/10.7554/eLife.27451


