Quiescence unveils a novel mutational force in fission yeast
- Institut Pasteur, France
- CNRS-Institut Pasteur, France
- UPMC, France
Figures
Figure 1
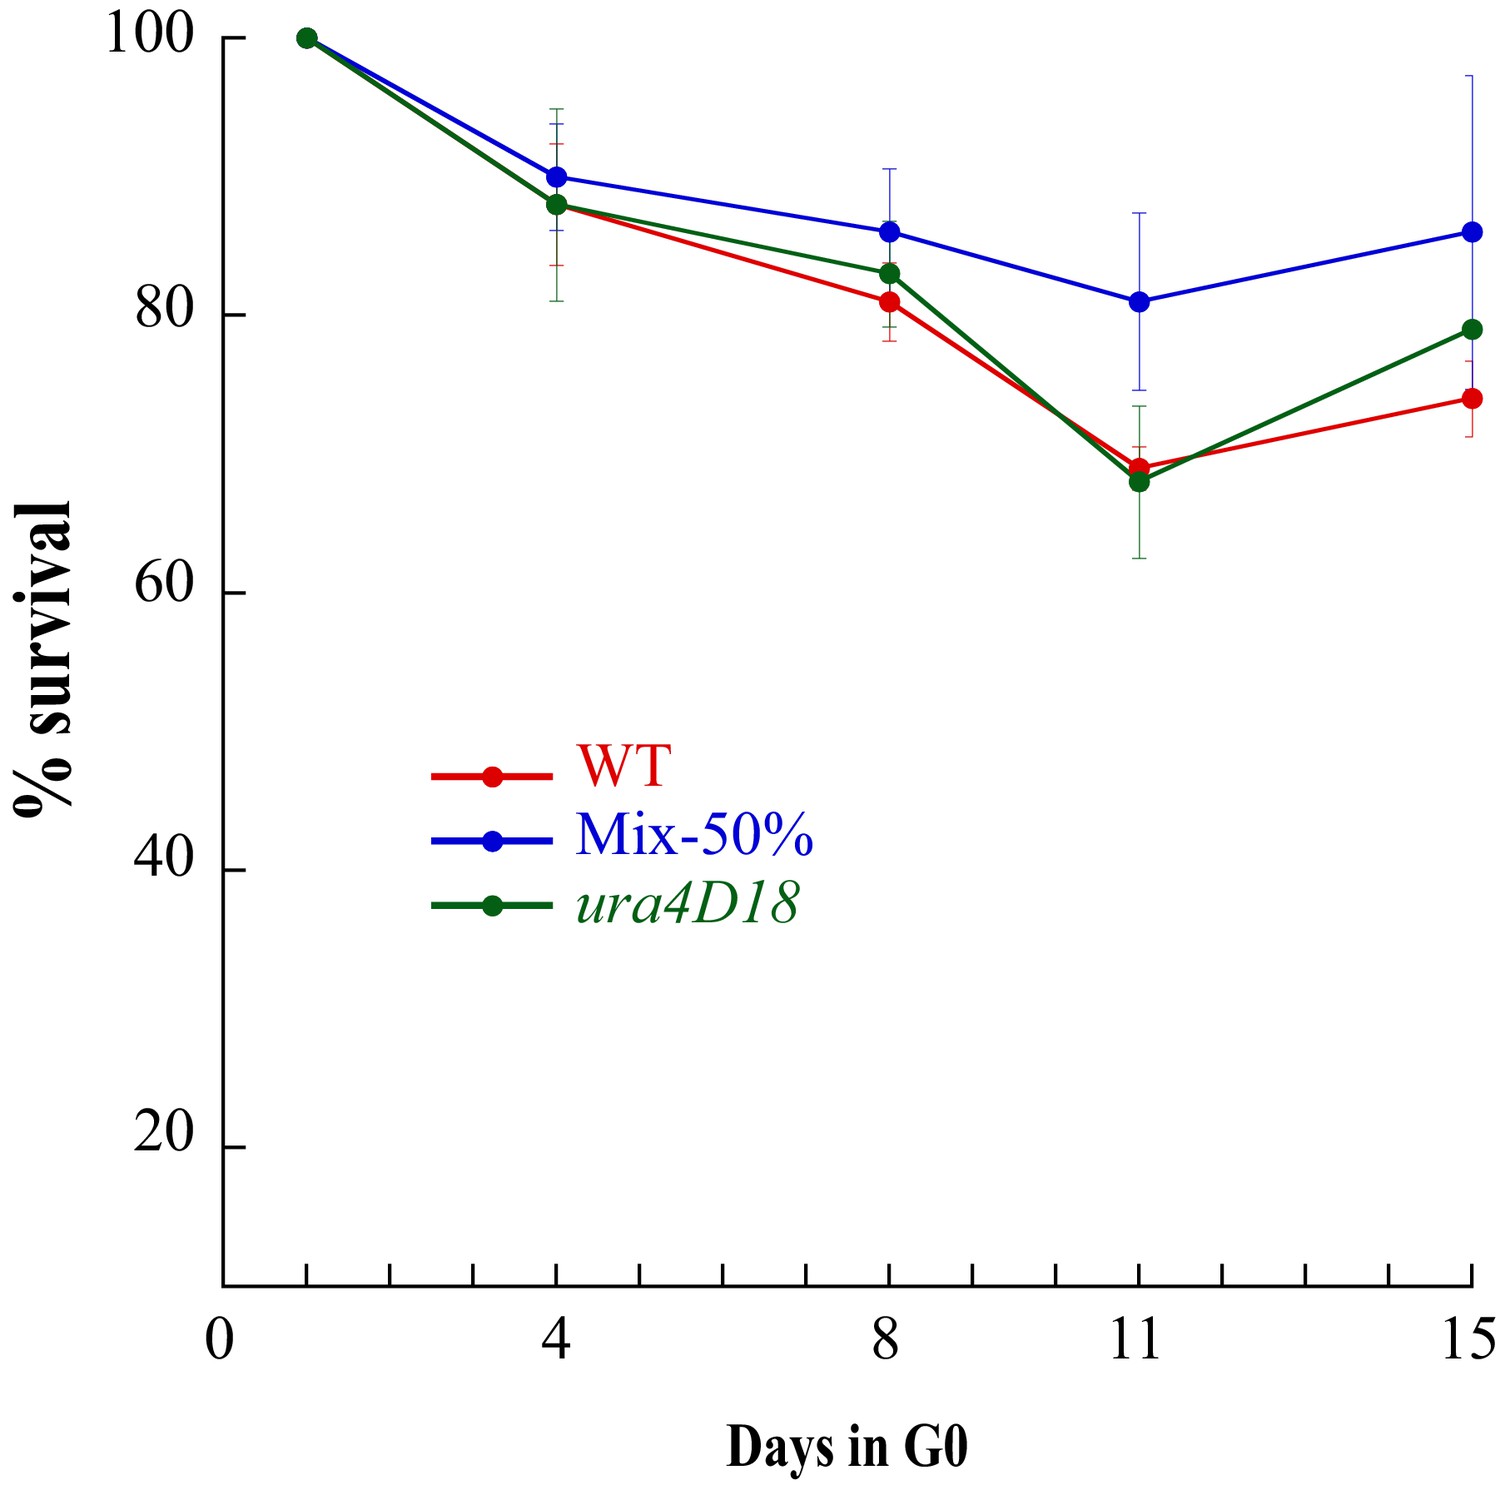
Survival of ura- cells during two weeks of quiescence.
Wild-Type, ura4D18 cells and a 50% mixture of both cultures were put into quiescence and their survival was followed for two weeks. ura4D18 has no advantage compared to wild-type strain or mixed populations and the proportion of uracil auxotrophs is maintained constant for the two weeks.
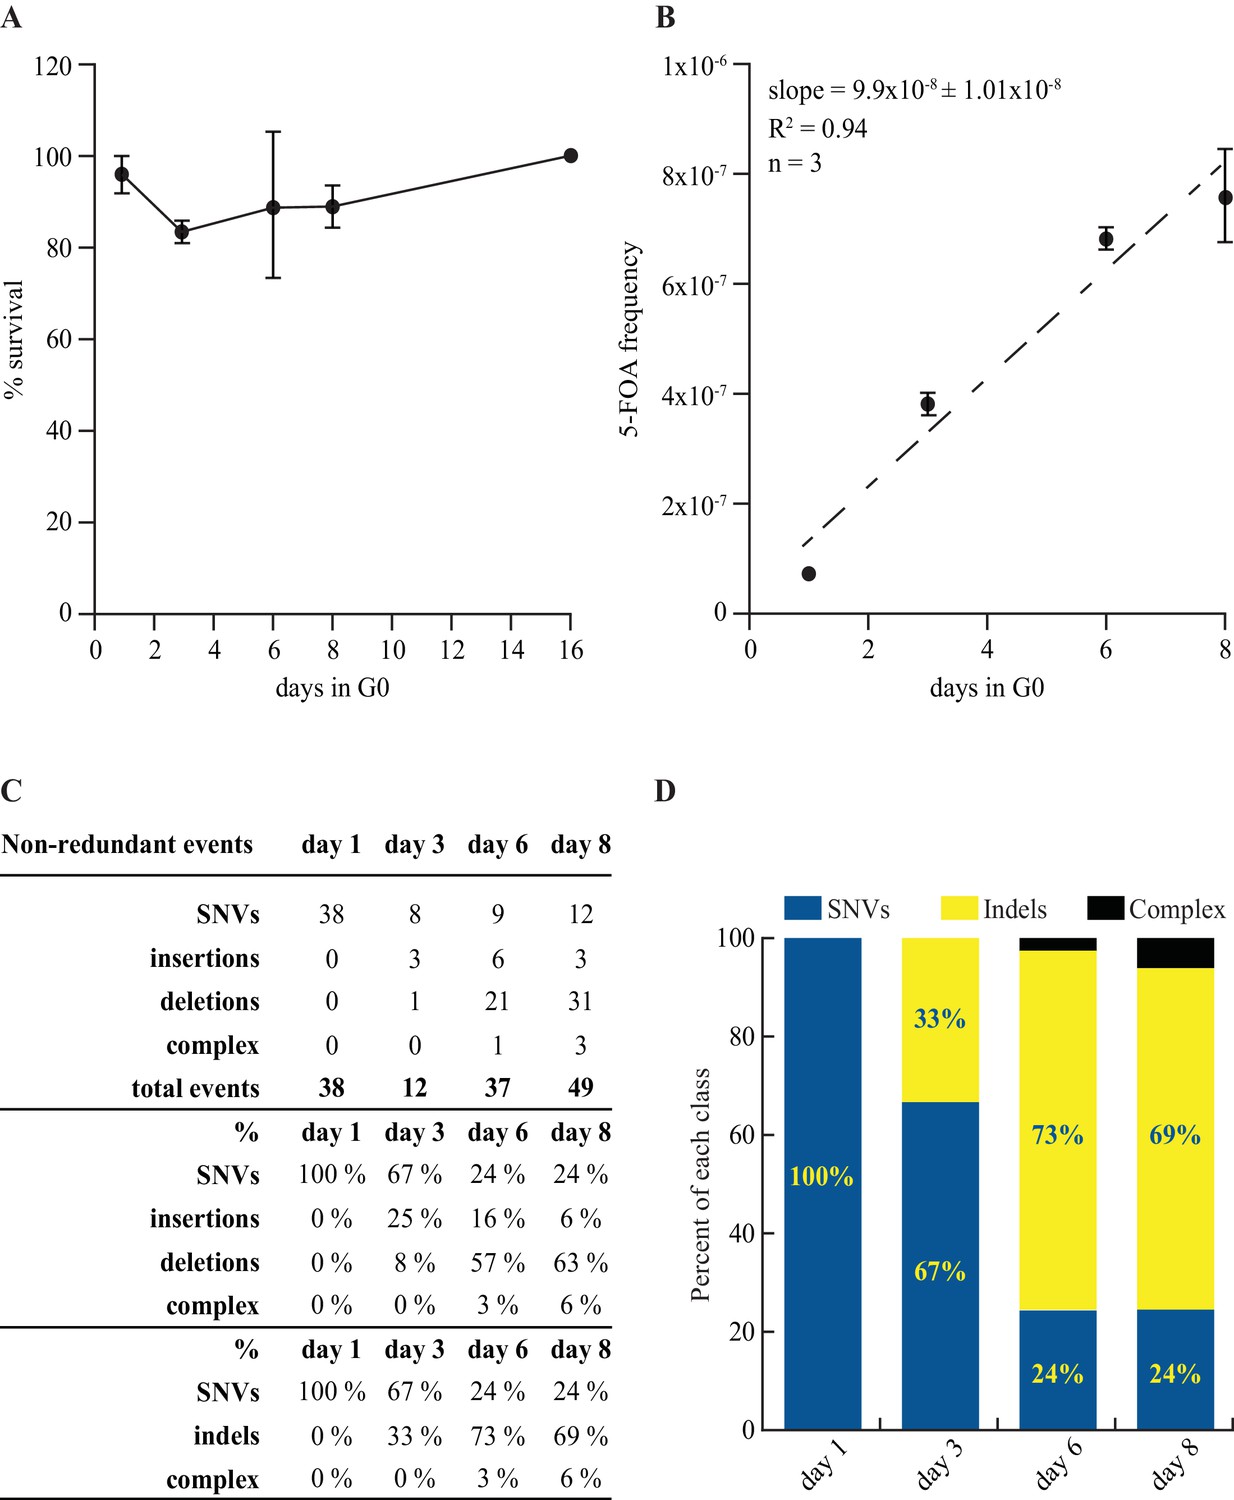
Figure 2 with 2 supplements

Mutations accumulate as a function of time in quiescence.
(A) slopes of FOAR accumulation as a function of time in quiescence from two independent experiments, determined by the least squares regression (R2 = 0.99 for all mutations, R2 = 0.96 for SNVs and R2 = 0.80 for indels). (B) mutation spectrum established on 105 SNVs found in the ura4+ and ura5+ genes at day 1 and 146 at days 8 + 15. (C) distribution among indels and SNVs of the mutations that result in FOAR for ura4+ and ura5+ genes over time. (D) distribution of the various sizes of indels over time in quiescence. The numbers directly above the histograms indicate the number of events, while those on the top of the figure are the sum of all the events for each class. The numbers at the bottom indicate the size range of the indels.
Figure 2—figure supplement 1

SNVs distribution.
(A) Mutation spectrum established on 105 SNVs found in the ura4+ and ura5+ genes at day 1 and 146 at days 8 + 15 (from Fig. Figure 2B). (B) Same as in A, but normalized to the total number of relevant scorable base pairs. (C) Counts of all possible STOP and nonsense mutations for each substitution in ura4 and ura5..
Figure 2—figure supplement 2
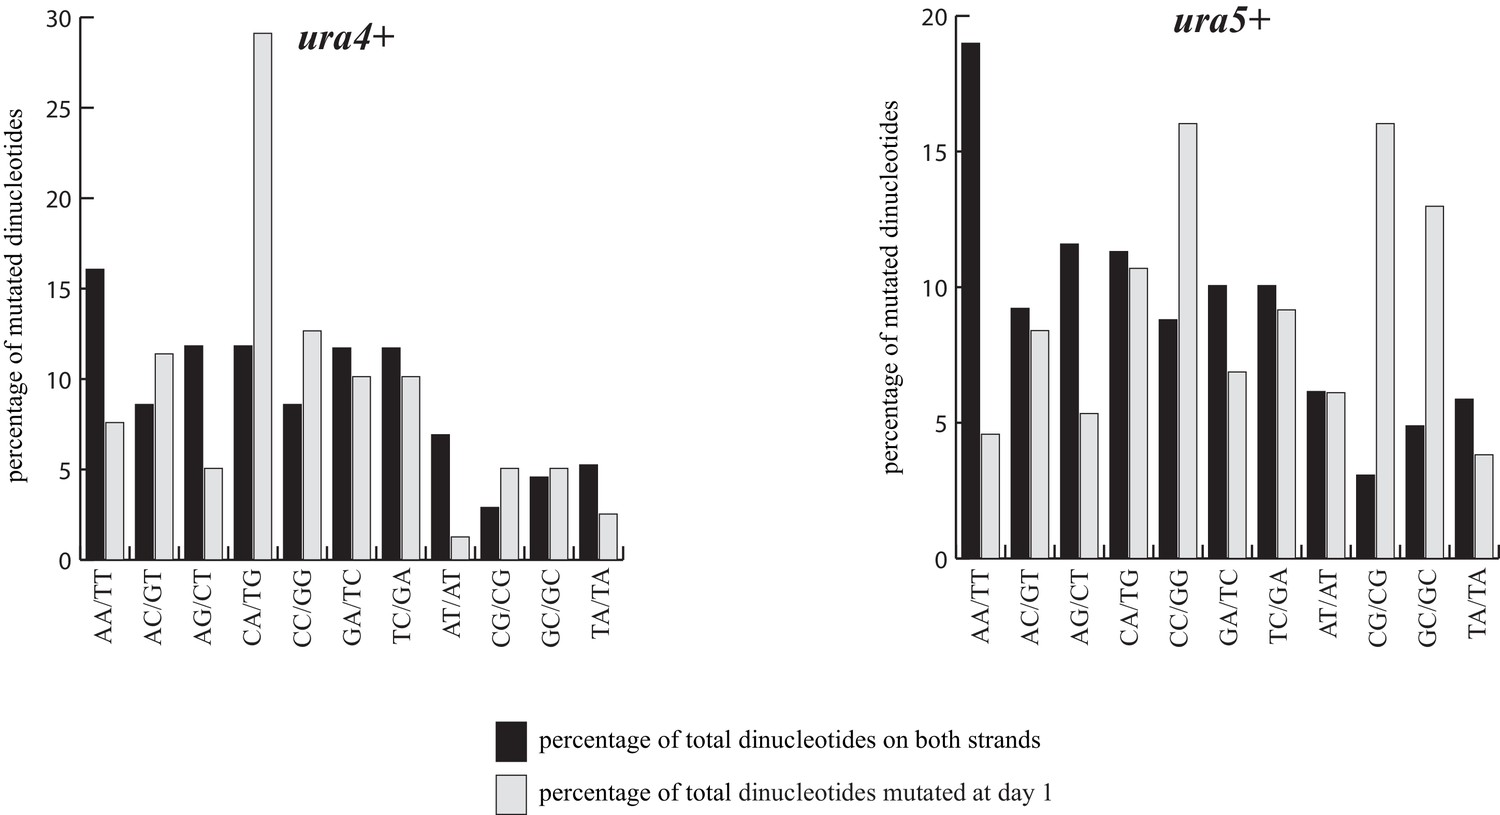
Normalized percentage of each dinucleotide in the open reading frames of ura4+ and ura5+after one day in quiescence.
The percentage of every dinucleotide mutated at day one is compared to the frequency of occurrence of the same dinucleotide in the respective open reading frame.
Figure 3
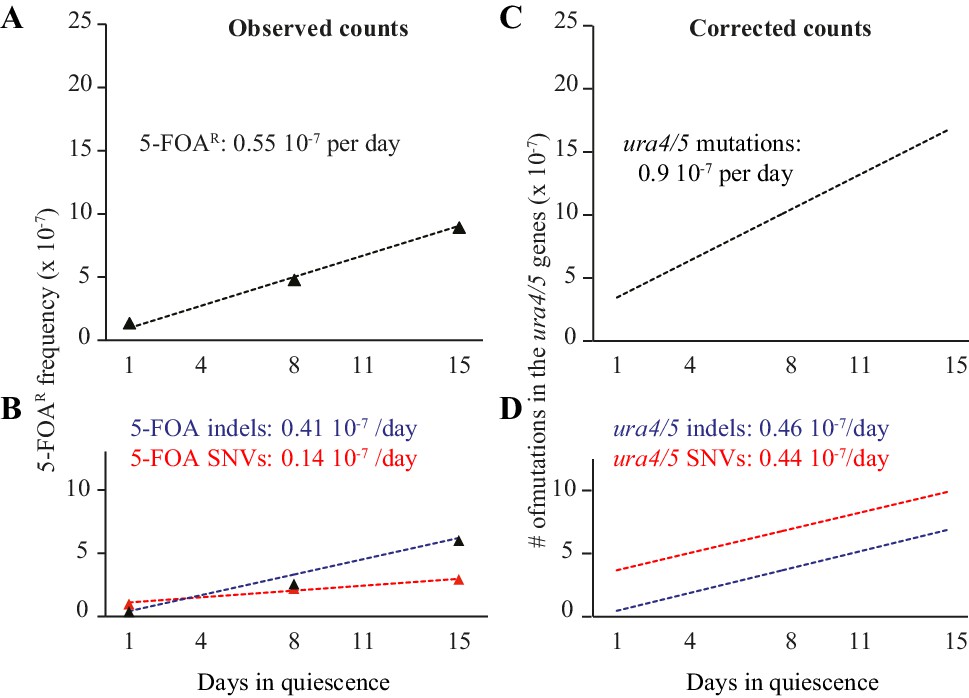
FOAR accumulation and corrected counts.
(A) slope of FOAR (as determined in Figure 2A). (B) slopes of FOAR SNVs and indels accumulation. (C) corrected counts determined on all experimental points using least squares regression (D) corrected slopes for SNVs and indels formation in the ura4+ and ura5+ genes.
Figure 4
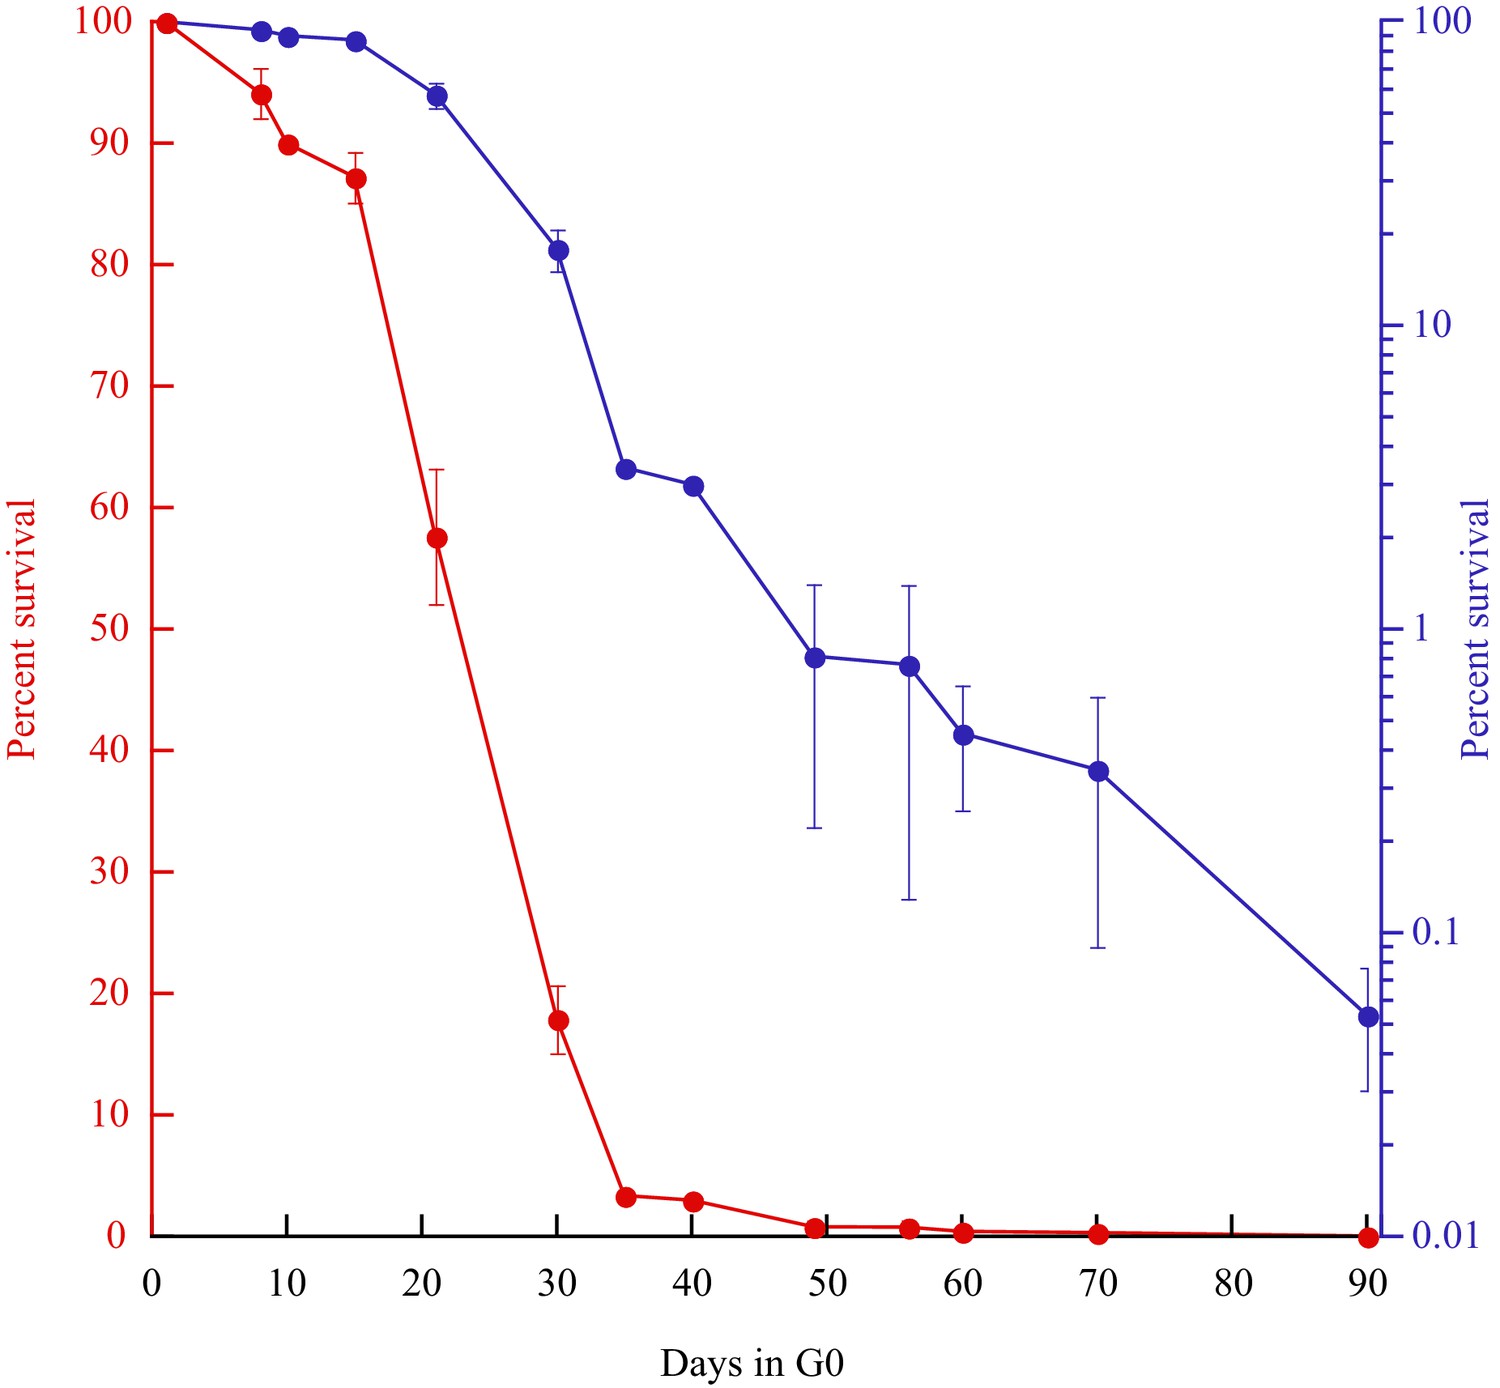
Survival curves (red: linear; blue: log) of prototrophic cells in G0 as a function of time.
The medium is being replaced every other week starting at day 15, while an aliquot is plated out to monitor the viability. The standard error of the experiments is indicated.
Figure 5
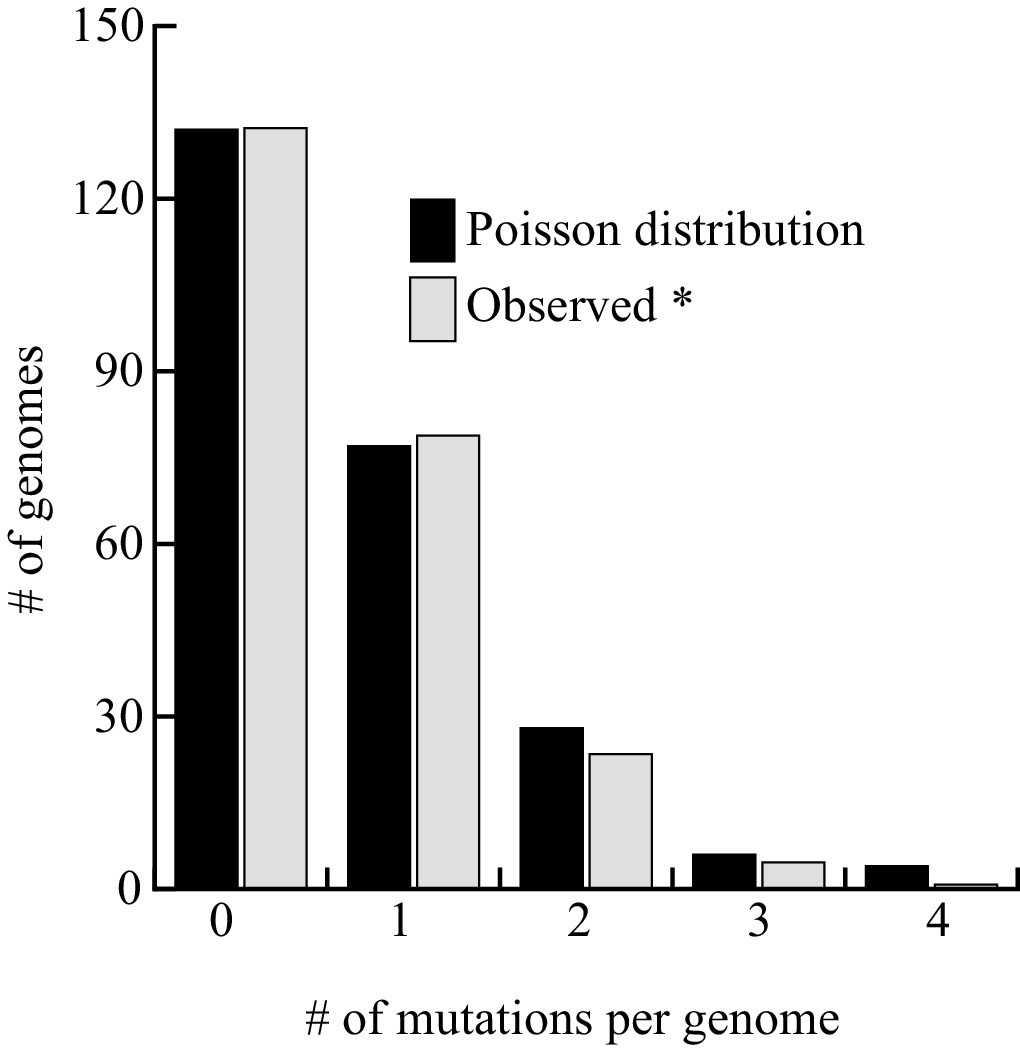
Distribution of mutations among the 237 genomes sequenced.
The six strains exhibiting a phenotype were excluded from the analysis. The fit between the observed and theoretical Poisson distribution indicates that Chronos acts homogeneously on genomes over time. The goodness of fit is excellent (Pchi2 = 0.56).
Figure 6
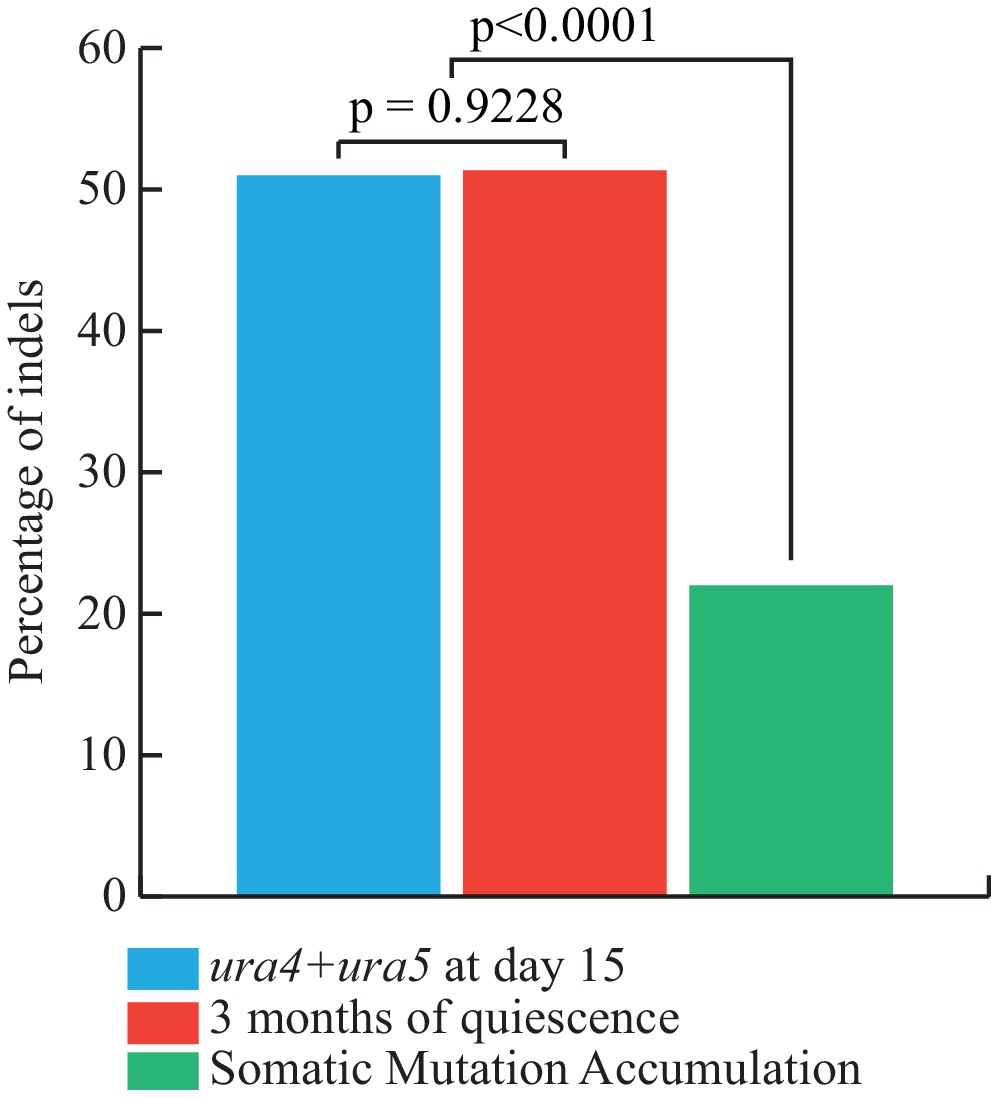
Corrected versus observed proportions of Indels.
In blue, we report the percentage of Indels expected from the FOA experiments, that is the ratio of the estimated slopes of accumulation of INDELS and SNVs (using method 1). In red, the observed fraction of INDELS after 3 months of quiescence. In green, the observed fraction of INDELs in the MA lines from (Farlow et al., 2015) P-values are computed using homogeneity chi2 tests.
Figure 7
Mutation rate and spectrum in pcn1-K164R mutant strain.
(A) Survival curves in G0 of 3 independent prototrophic pcn1-K164R clones as a function of time. The standard error is indicated. (B) Frequency with standard error and slope of FOAR accumulation in G0 of 3 independent pcn1-K164R clones. The R square value is indicated. (C) Table and (D) graphical representation of the distribution among SNVs and indels of the ura4 and ura5 mutations accumulating over time in pcn1-K164R quiescent cells. The total number of the non-redundant events analyzed is indicated in the table.
Figure 8
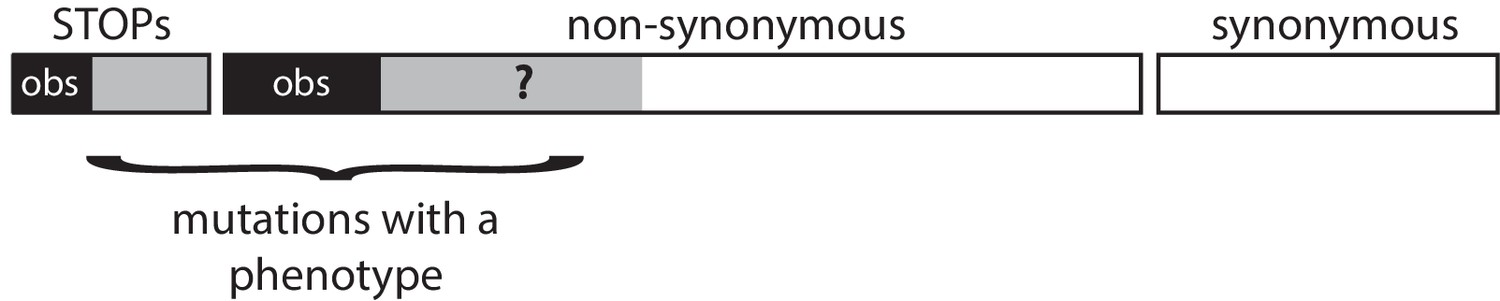
Schematic representation of a gene.
In all three methods, the gene model is the same. We observe only a subset of all possible SNVs (the back areas) among all SNVs that lead to a phenotype (the black and grey areas). All synonymous SNVs do not exhibit a phenotype. The methods aim at estimating the unknown proportion f of the non-synonymous SNVs that leads to a phenotype.
Tables
Table 1
Proportion of septa observed among cycling and quiescent cells.
https://doi.org/10.7554/eLife.27469.006| Days | Number of cells | Number of Septa | Percentage |
|---|---|---|---|
| 0 | 1 400 | 136 | 9.71% |
| 1 | 3 500 | 5 | 0.14% |
| 4 | 10 500 | 0 | 0.00% |
| 6 | 16 000 | 2 | 0.01% |
| 8 | 14 000 | 0 | 0.00% |
| 12 | 26 000 | 0 | 0.00% |
| 15 | 26 250 | 0 | 0.00% |
Table 2
Type of mutation and AT bias found in ura4 and ura5 mutants at various time points of quiescence.
https://doi.org/10.7554/eLife.27469.007| day 1 | day 8 | day 15 | day 8+15 | |
|---|---|---|---|---|
| # of SNVs | 105 | 107 | 37 | 144 |
| Ts | 33 | 26 | 5 | 30 |
| Tv | 72 | 81 | 34 | 116 |
| Ts:Tv | 1:2.18 | 1:3.12 | 1:6.67 | 1:3.70 |
| To A or to T | 63 | 45 | 15 | 60 |
| To C or to G | 17 | 30 | 8 | 38 |
| AT bias | 3.71 | 1.50 | 1.88 | 1.58 |
| # of indels | 40 | 139 | 86 | 220 |
| # of deletions | 16 | 99 | 71 | 170 |
| lost bases | 334 | 864 | 907 | 1771 |
| # of insertions | 24 | 35 | 15 | 50 |
| gained bases | 269 | 401 | 99 | 500 |
| net loss | 65 | 463 | 808 | 1271 |
| # of deletions / # of insertions | 0.7 | 2.8 | 4.7 | 3.4 |
| average loss per event | 21 | 9 | 13 | 10 |
| average gain per event | 11 | 11 | 7 | 10 |
-
Ts: transitions; Tv: transversions
AT bias: (GC→AT + GC→TA) to (AT→GC + AT→CG) mutations
Table 3
Sequencing analysis of all the FOAR colonies recovered after 6 days of quiescence.
https://doi.org/10.7554/eLife.27469.009| SNVs | Indels | Insertions | Deletions | ||
|---|---|---|---|---|---|
| No division | Singles | 8 | 19 | 2 | 17 |
| Pairs | NA | NA | NA | NA | |
| One division | Singles | 7 | 9 | 3 | 6 |
| Pairs | 9 | 11 | 2 | 9 |
-
NA: Not Applicable. All the FOAR isolated from the culture have been sequenced.
For the first half of the cultures, the mutations found more than once in the clonal population were discarded.
-
Similarly, identical mutations found in ‘no division’ and in ‘with one division’ were discarded.
Table 4
Estimation of the fraction of non-synonymous SNVs that lead to a phenotype.
https://doi.org/10.7554/eLife.27469.010| ura4 | ura5 | Total | ||
| (265 Aa) | (216 Aa) | (481 Aa) | ||
| Potential SNVs | Synonymous | 530 (0.22) | 443 (0.23) | 973 (0.22) |
| Non-synonymous | 1739 (0.73) | 1405 (0.72) | 3144 (0.73) | |
| STOPs | 116 (0.05) | 96 (0.05) | 212 (0.05) | |
| Observed SNVs | Synonymous | 3 (0.03) | 2 (0.03) | 5 (0.03) |
| Non-synonymous | 74 (0.69) | 58 (0.73) | 132 (0.71) | |
| STOPs | 29 (0.27) | 19 (0.24) | 48 (0.26) | |
| Non-coding | 1 (0.01) | 0 (0.00) | 1 (0.00) | |
| Different mutations per Aa | (41,13,3) | (23,7,5,0,0,1) | (64,20,8,0,0,1) | |
| Independent identical mutations per non-syn SNV | (64,9,1) | (41,11,2,1,1,0,1, 0,1) | (105,20,3,1,1,0,1, 0,1) | |
| Method 1 | Essential Aa (ML) | 124 | 54 | 170 |
| (Essential Aa) | [CI 95%] | [93,202] | [43,81] | [140,228] |
| f | 0.47 | 0.25 | 0.35 | |
| [CI 95%] | [0.35,0.76] | [0.20,0.38] | [0.29,0.47] | |
| Method 2 | Essential NS (ML) | 296 | 88 | 276 |
| (Non-Syn) | [CI 95%] | [195,394] | [73,118] | [228,362] |
| f | 0.17 | 0.06 | 0.09 | |
| [CI 95%] | [0.11,0.23] | [0.05,0.08] | [0.07,0.12] | |
| Method 3 | # STOPs among all potentials STOPs | 0.25 | 0.20 | 0.23 |
| (LM08) | f | 0.17 | 0.21 | 0.19 |
-
Table 4—source data 1
Estimation of the fraction of SNVs and Indels that leads to a phenotype.
- https://doi.org/10.7554/eLife.27469.011
-
Table 4—source data 2
Estimated mutation rates.
- https://doi.org/10.7554/eLife.27469.012
Table 5
Type of mutation in whole genomes after 3 months in quiescence.
https://doi.org/10.7554/eLife.27469.016| Variants | # |
|---|---|
| # of SNVs | 72 |
| Ts | 26 |
| Tv | 46 |
| Ts:Tv | 1:21.77 |
| to A or T | 33 |
| to C or G | 26 |
| AT bias | 1.27 |
| # of indels | 77 |
| # of deletions | 27 |
| lost bases | 511 |
| # of insertions | 50 |
| gained of bases | 296 |
| net loss | 215 |
| # of deletions / # of insertions | 0.54 |
| average loss per event | 19.6 |
| average gain per event | 5.92 |
Table 6
Phenotypic alterations as a function of time spent in quiescence
https://doi.org/10.7554/eLife.27469.017| Time | # of colonies w/phenotype | 18°C | 37°C | KCl 1M | Ca(NO3)2 0.15M | CaCl20.3M | TBZ 15 μg/ml | HU 4 mM | SDS 0.01% |
|---|---|---|---|---|---|---|---|---|---|
| in G0 | |||||||||
| 1 day | 0/384 | - | - | - | - | - | - | - | - |
| 1 month | 0/384 | - | - | - | - | - | - | - | - |
| 2 months | 4/376 | - | - | 1 | 1 | 4 | - | - | - |
| 3 months | 6/334 | 1 | 1 | 1 | 1 | 3 | 3 | 2 | 1 |
-
(-) indicates the absence of a selected phenotype (all the cells form colonies) The numbers in the columns indicate the number of colonies exhibiting a sensitivity to a given treatment (some mutants display a sensitivity to multiple treatments).
Serial dilutions were spotted on rich medium plates containing (or not) the drugs at the indicated concentrations. (TBZ): Thiabendazole; (HU): Hydroxyurea; (SDS): Sodium Dodecyl Sulfate
Additional files
-
Supplementary file 1
Position and nature of the alterations yielding 5-FOA resistant colonies in ura4+ and ura5+ genes.
- https://doi.org/10.7554/eLife.27469.020
-
Supplementary file 2
Mutations detected in the 243 colonies sequenced after 3 months in G0.
- https://doi.org/10.7554/eLife.27469.021
-
Transparent reporting form
- https://doi.org/10.7554/eLife.27469.022
Download links
A two-part list of links to download the article, or parts of the article, in various formats.
Downloads (link to download the article as PDF)
Open citations (links to open the citations from this article in various online reference manager services)
Cite this article (links to download the citations from this article in formats compatible with various reference manager tools)
Quiescence unveils a novel mutational force in fission yeast
eLife 6:e27469.
https://doi.org/10.7554/eLife.27469


