Fish larval recruitment to reefs is a thyroid hormone-mediated metamorphosis sensitive to the pesticide chlorpyrifos
- Université de Lyon, Université Claude Bernard Lyon 1, UMR CNRS 5242, Ecole Normale Supérieure de Lyon, France
- PSL Research University, French Polynesia
- UMR CNRS 7232, Université Pierre et Marie Curie Paris, France
- Laboratoire d'Excellence CORAIL, French Polynesia
Figures
Figure 1 with 1 supplement
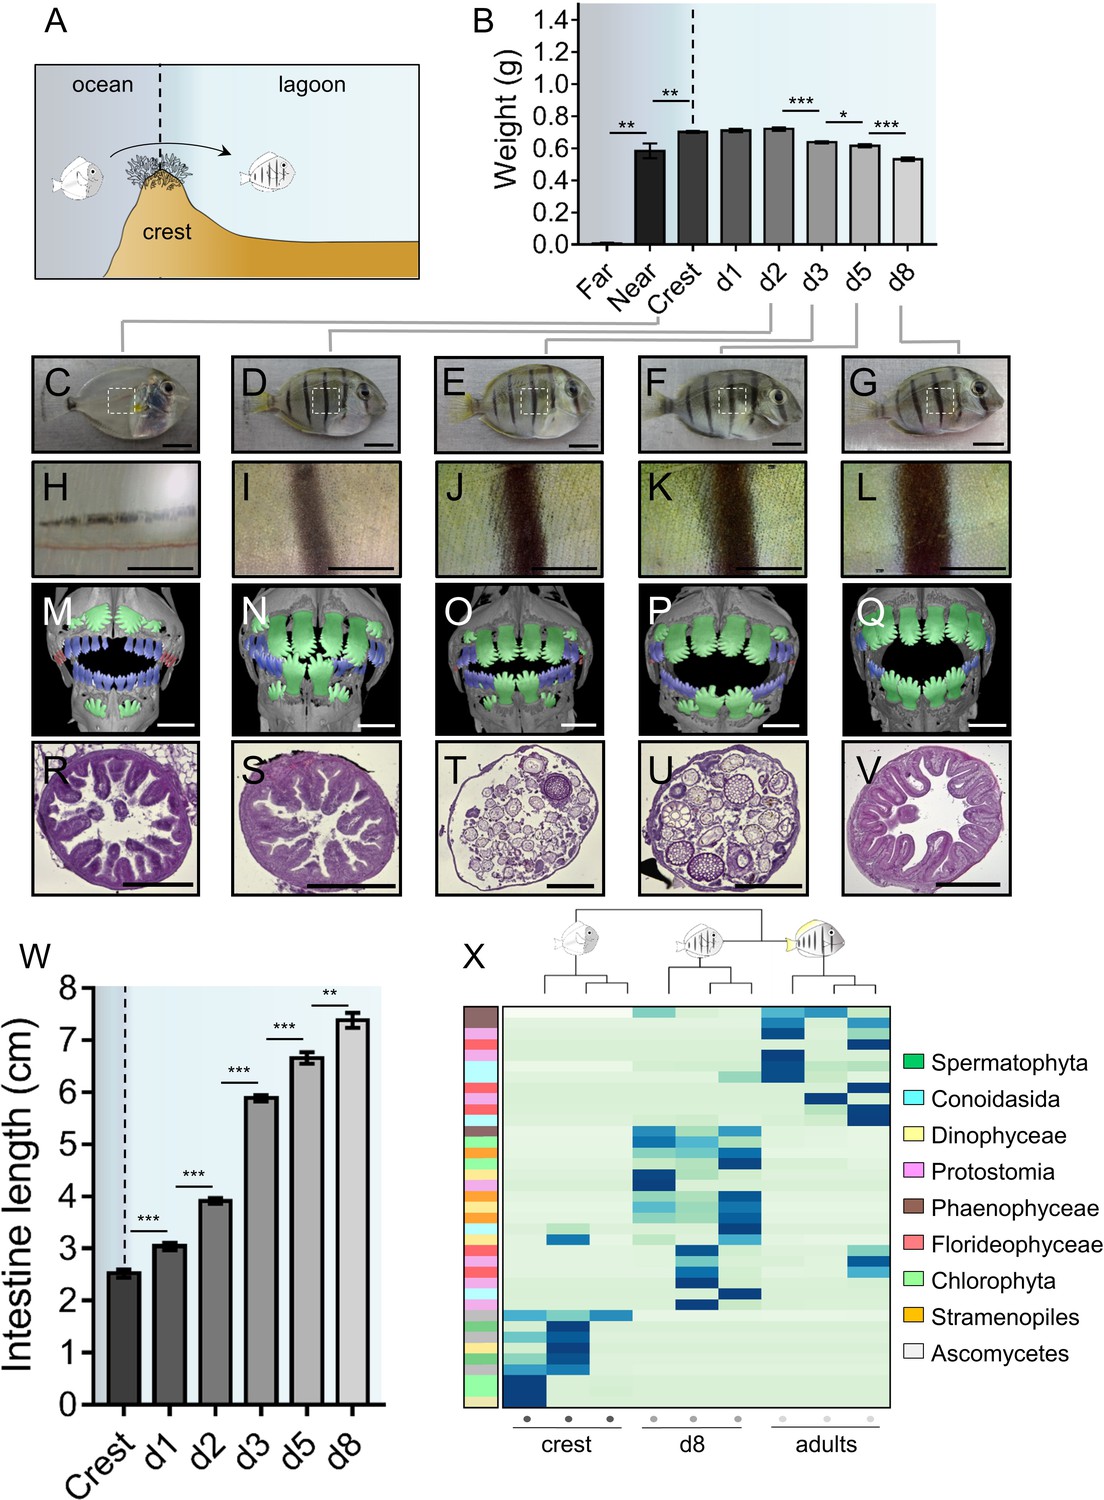
Changes in Acanthrurus triostegus during larval recruitment.
Error bars represent standard errors. *p-value<0.05; **p-value<0.01; ***p-value<0.001. (A) Schematization of the reef colonization by a larva (left) turning into a juvenile (right). The background color shading centered into the reef crest is re-used in following figures. (B) Weight variation during larval recruitment. n = 3 biological replicates for 5-to-10 km offshore fish (far), n = 5 for 2 km offshore fish (near) and n = 297 for crest to day 8 (d8) fish. Statistics: mean comparisons (Wilcoxon-Mann-Whitney U-test). See Figure 1—source data 1 for detailed data and statistics. (C–G) Variation in pigmentation and morphology at different sampling points, (C) crest larva, (D) day 2 juvenile, (E) day 3 juvenile, (F) day 5 juvenile and (G) day 8 juvenile; scale bars indicate 0.5 cm. The white square represent the magnified region shown in the line below. These pictures are representative of n > 50 fish (biological replicates) per developmental stage, sampled at n > 20 different times during the year (technical replicates). (H–L) Close-up on the pigmented middle body band. Scale bars indicate 0.2 cm. These pictures are representative of n > 50 fish (biological replicates) per developmental stage, sampled at n > 20 different times during the year (technical replicates). (M–Q) X-Ray microtomography of larva, dentition A, B or C are highlighted respectively in red, blue or green. Scale bars indicate 0.5 mm. These pictures are representative of n = 2 fish (biological replicates) per developmental stage. (R–V) Histological sections (5 µm width) of intestines with haematoxylin/eosin staining. Scale bars indicate 200 µm. These pictures are representative of n = 6 sectioning technical replicates, performed twice (sampling technical replicates), on n = 2 fish (biological replicate). (W) Intestine length variation of A. triostegus during its larval recruitment. n = 9 to 14 biological replicates for each developmental stage (from n = 2 technical sampling replicates). Statistics: mean comparisons (Wilcoxon-Mann-Whitney U-test). See Figure 1—source data 2 for detailed data and statistics. (X) Heatmap clustering of the 18S sequences identified in the intestine content of crest individual (n = 3, left panel), day 8 juveniles (n = 3, middle panel) and adults (n = 3, right panel). Each panel is made of three columns corresponding to one individual. Each line corresponds to one taxonomic group found in the intestines: Spermatophyta (dark green), Conoidasisa (cyan), Dinophyceae (light yellow), Protostomia (light mink), Phaeophyceae (brown), Florideophycae (dark pink), Chlorophyta (light green), Stramenopiles (orange) and Ascomycetes (grey).
-
Figure 1—source data 1
Acanthurus triostegus weight at different developmental stages.
- https://doi.org/10.7554/eLife.27595.005
-
Figure 1—source data 2
Acanthurus triostegus intestine length at different developmental stages.
- https://doi.org/10.7554/eLife.27595.006
Figure 1—figure supplement 1
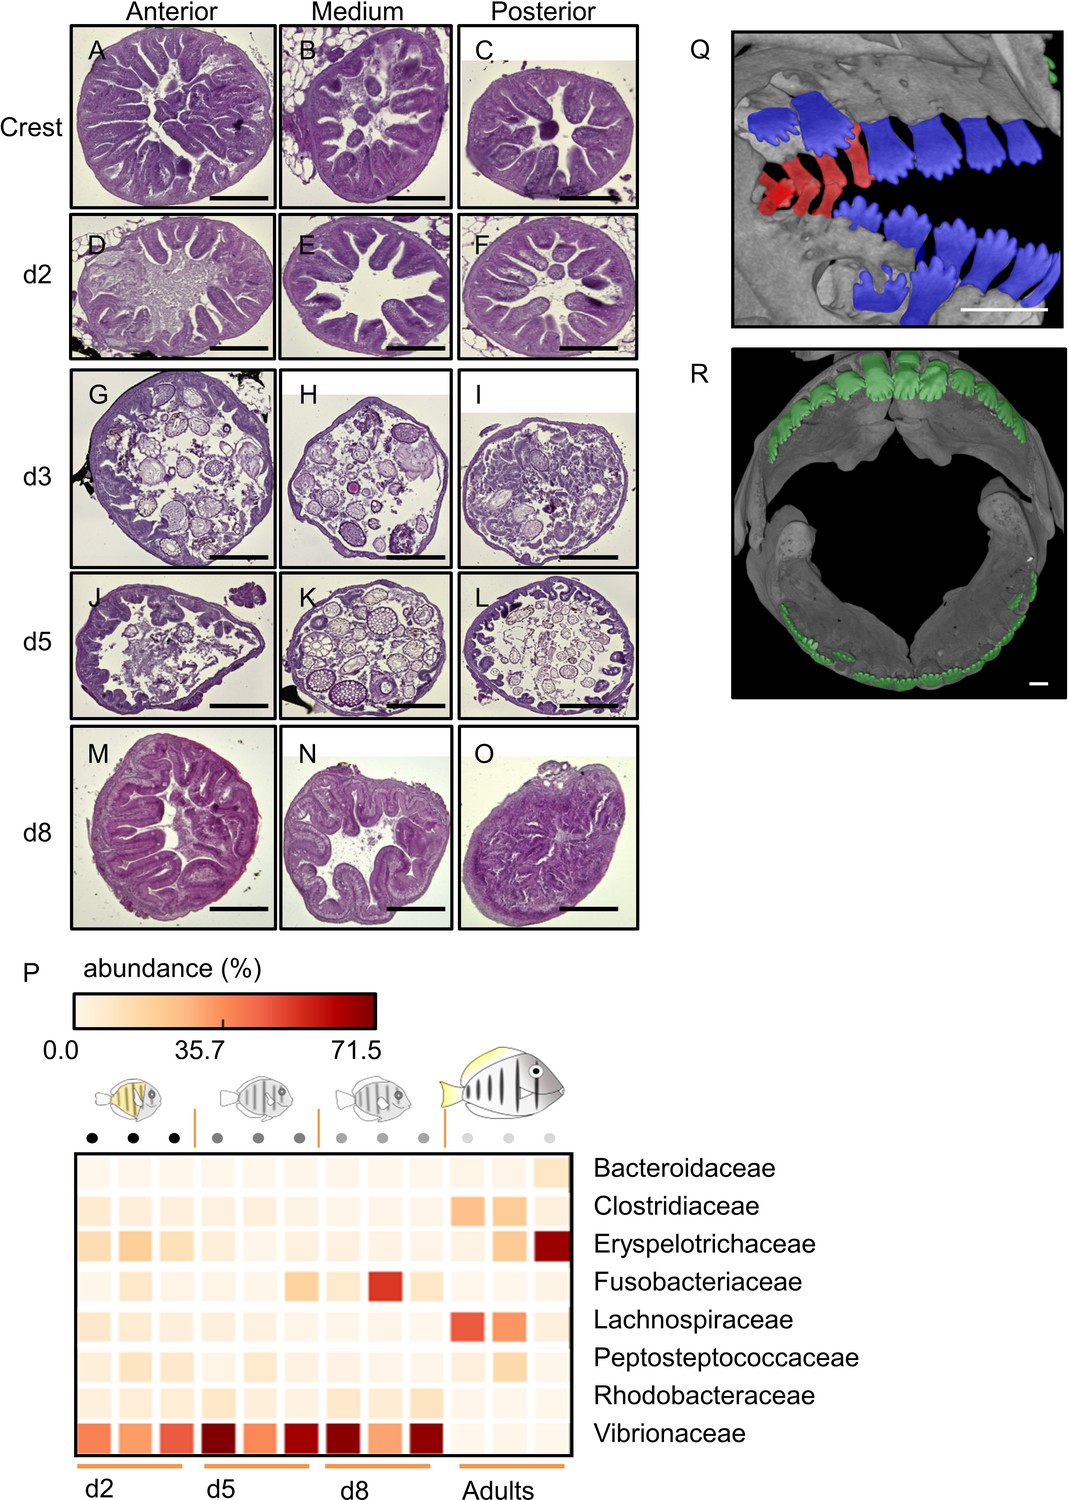
Changes in Acanthurus triostegus intestine and teeth during larval recruitment.
(A–O) Complete guts histology of Acanthurus triostegus after reef colonization. First column: anterior part of the intestine (first cm), middle column: medium part (variable), last column: posterior part of the intestine (1 cm), (A–C): crest individual, (D–F): 2 days juvenile, (G–I): 3 days juvenile, (J–L): 5 days juvenile, (M–O): 8 days juvenile. Scale bars represent 200 µm. These pictures are representative of n = 6 section technical replicates for each of the proximal, middle and distal intestine, and were performed twice (sampling technical replicates), on n = 2 fish (biological replicates). (P) Heat map of bacterial gut community. Each column is one individual. Each row is bacterial taxa. Only the taxa with differential representations between the samples are shown. Sampling stages: day 2, day 5, day 8 and adult are indicated below the heat map. The shape of each of this developmental stage is schematized over the heat map. Each column is highlighted by a circle, the difference in shade between the circles emphasizes the stage difference. The color of each square in the heat map is proportional to the abundance of the taxa (row) in the sample (column). (Q) µCT scan of a crest larva, lateral view. Dental family C are highlighted in red and dental family B in blue. (R) µCT scan of an adult, frontal view (mouth open). (Q–R) The scale bar indicates 0.5 mm. These pictures are representative of n = 2 fish (biological replicates).
Figure 2 with 3 supplements
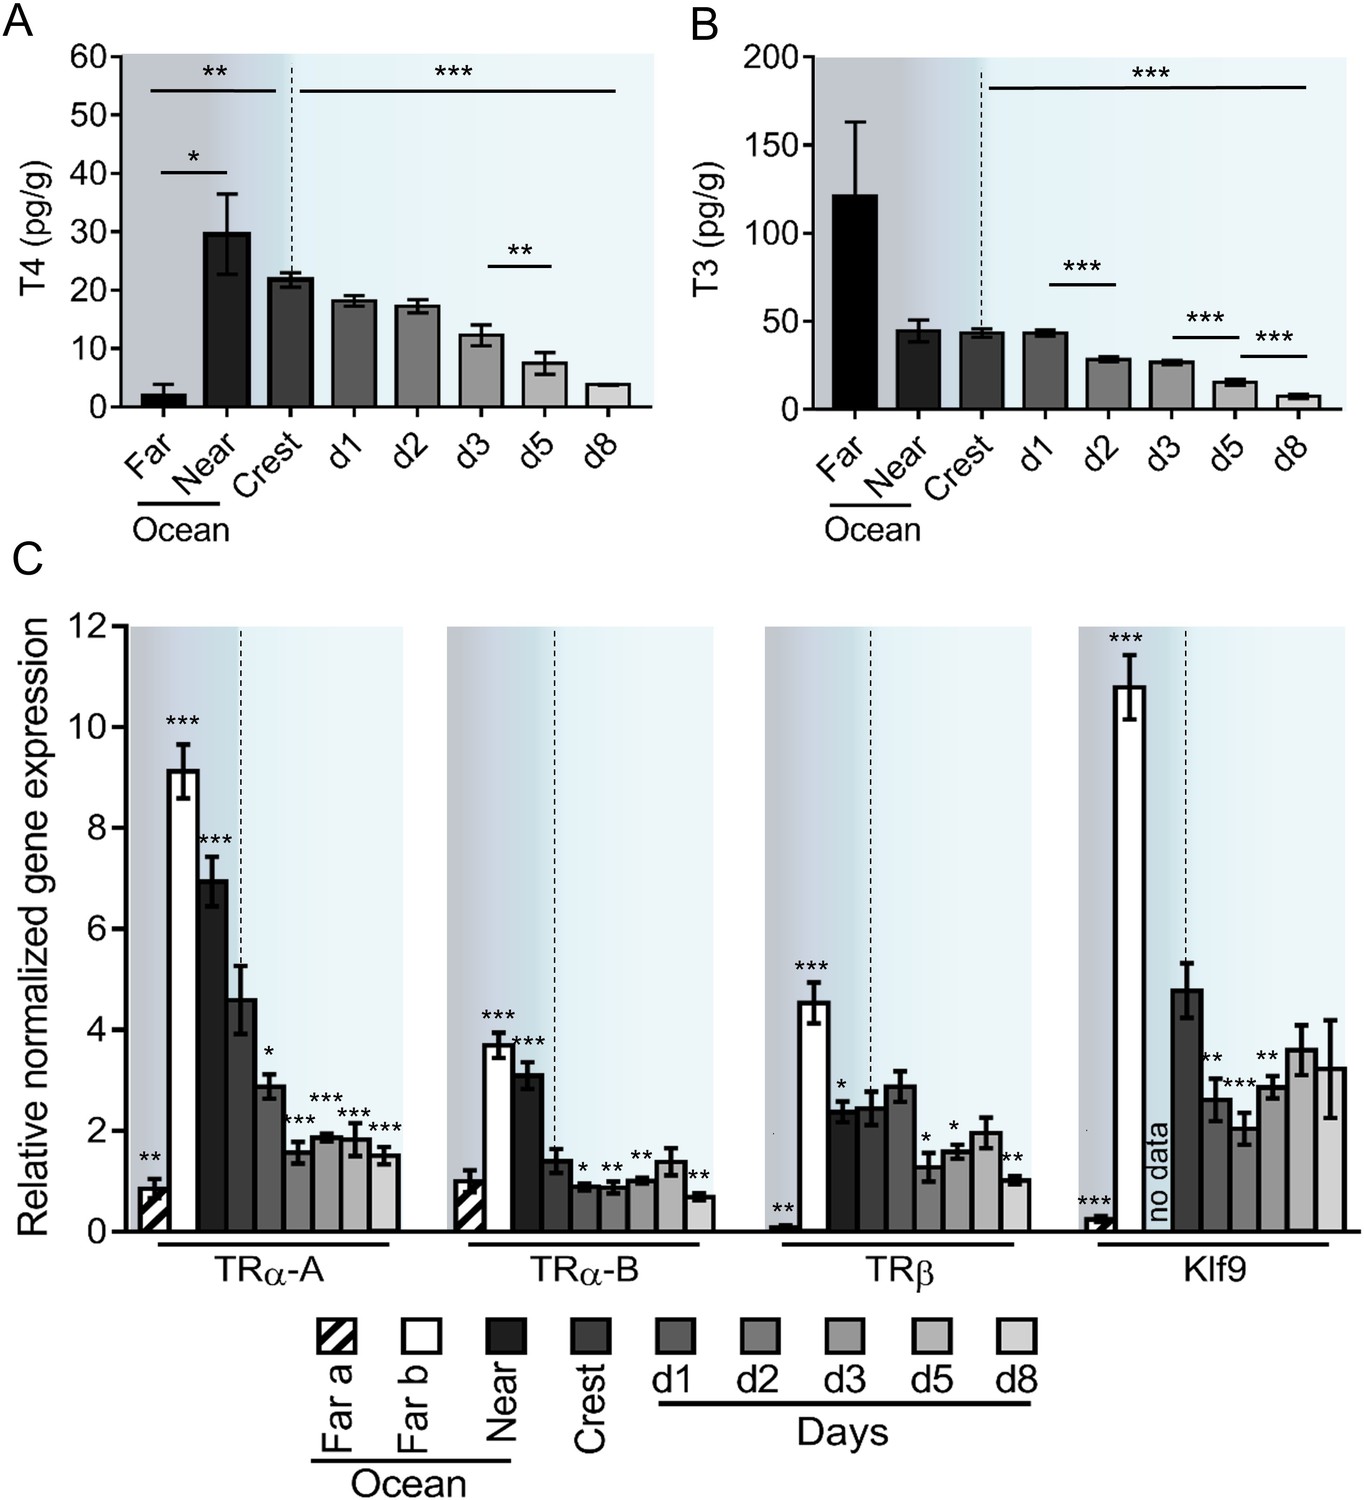
Thyroid hormone signaling during Acanthurus triostegus metamorphosis.
Error bars represent standard errors. *p-value<0.05; **p-value<0.01; ***p-value<0.001. (A) T4 and (B) T3 dosage: Y-axis: T4 and T3 levels in pg.g−1; X-axis: sampling point. n = 3 for 5 to 10 km offshore fish (far), n = 5 for 2 km offshore fish (near), n = 297 for crest to day 8 (d8) fish. Statistics: mean comparisons (Wilcoxon-Mann-Whitney U-test). See Figure 2—source data 1 and Figure 2—source data 2 for detailed data and statistics. (C) Expression level of TRα-A, TRα-B, TRβ and Klf9 by qPCR, normalized with Pold2 and Rpl7. Y-axis; Relative normalized expression X-axis: gene and sampling point.. Far ocean larvae are split in two groups: Far a (black stripes) and Far b (white). For each panel, the color shading is the same one as in Figure 1A. For each sampling point three biological replicates and three technical replicates were performed. Statistics: comparisons of each mean to the Crest condition mean (Student's t cumulative distribution function, which was automatically computed by qPCR software CFX Biorad Manager, CFX Manager SH, 2017). See Figure 2—source data 3 for detailed data and statistics.
-
Figure 2—source data 1
Acanthurus triostegus T4 levels in larvae and juveniles.
- https://doi.org/10.7554/eLife.27595.011
-
Figure 2—source data 2
Acanthurus triostegus T3 levels in larvae and juveniles.
- https://doi.org/10.7554/eLife.27595.012
-
Figure 2—source data 3
TR and Klf9 expression levels in Acanthurus triostegus at different developmental stages (qPCR).
- https://doi.org/10.7554/eLife.27595.013
-
Figure 2—source data 4
Transactivation assay of Acanthurus triostegus TR for several thyroid hormone derivatives.
- https://doi.org/10.7554/eLife.27595.014
-
Figure 2—source data 5
Transactivation assay of Acanthurus triostegus TR for the competition of T3 and NH3.
- https://doi.org/10.7554/eLife.27595.015
-
Figure 2—source data 6
List of primers used in this study.
- https://doi.org/10.7554/eLife.27595.016
-
Figure 2—source data 7
List of TR used for phylogenetic reconstruction.
- https://doi.org/10.7554/eLife.27595.017
Figure 2—figure supplement 1

Characterization of Acanthurus triostegus thyroid hormone receptors.
(A) Schematic representations of TRα-A, TRα-B and TRβ from upper to lower rows respectively. The amino acid numbering of the DBD (light gray) and LBD (dark grey) appear above each TR. The nine amino acid insertion of the TRβ long isoform is indicated below the gray dashed area. (B) Phylogenetic reconstruction of TR amino acid sequenced by maximum likelihood. Bootstrap over supporting each branches are indicated when >700/1000. A. triostegus genes are highlighted in red. (C) Transactivation assay of TRs in HEK293T cells with a luciferase reporter. X-axis: Tested genes and treatment condition. T4: blue bars, T3: red bars, T2: green bars, Tetrac: purple bars and Triac: orange bars. The concentrations range from 10−9 M to 10−7 M which corresponds to the light and dark shade of each color. Tested genes are indicated on the bottom line. Y-axis: arbitrary luciferase unit. Three technical replicates were performed. See Figure 2—source data 4 for detailed data. (D) Transactivation assay of TRs in HEK293T cells with a luciferase reporter. X-axis: tested genes and treatment conditions. Light blue to dark blue bars: T3 treatments at 10−9, 10−8, and 10–7 M respectively. Light blue to dark blue dashed bars: T3 + NH3 treatments with T3 at 10−8 M and NH3 at 10−8, 10−7 and 10−6 M respectively. Y-axis: arbitrary luciferase unit. Three technical replicates were performed. See Figure 2—source data 5 for detailed data.
Figure 2—figure supplement 2

Primers used in this study.
(A) Degenerated primers used for the cloning of the A. triostegus genes in this study. (B) qPCR primers used in this study. (C) Primers used for 18S mass sequencing. The overlapping nucleotides between 18 SR and the blocking primer are indicated in bold. The mean annealing temperature of each primer is indicated in the last column. See Figure 2—source data 6.
Figure 2—figure supplement 3
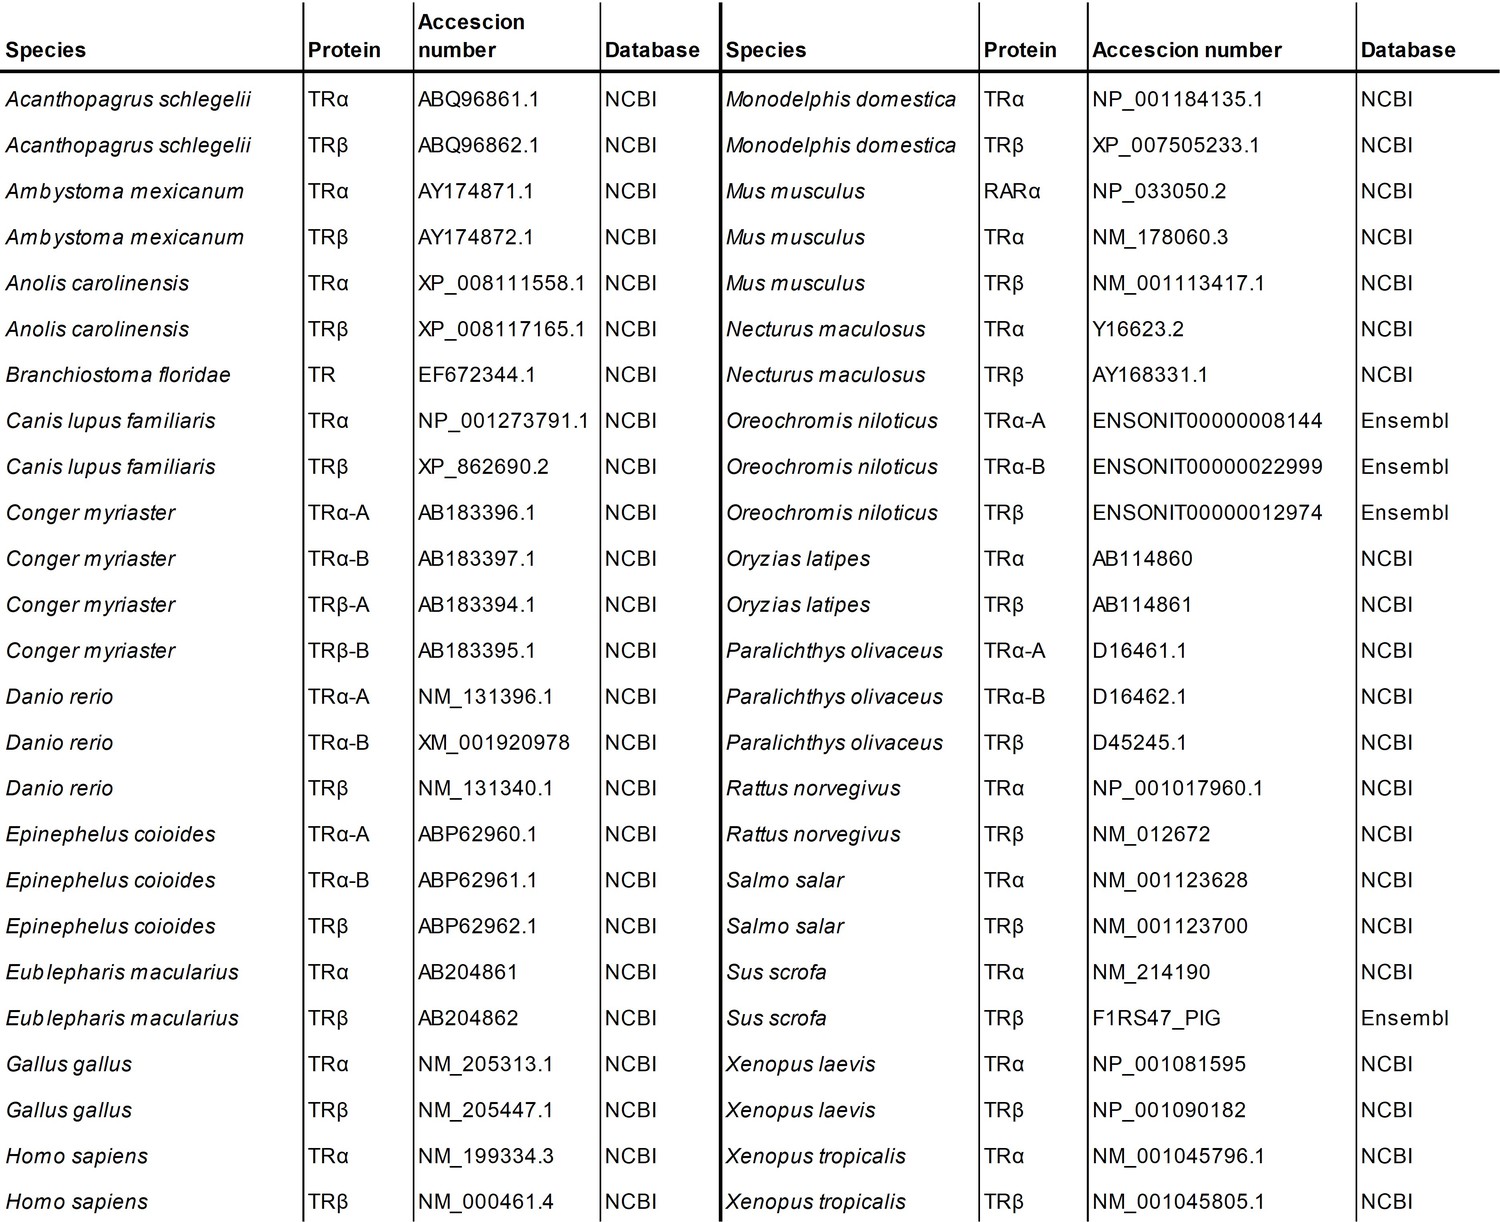
List of thyroid hormone receptors sequences used for the phylogeny.
Species, genes, databases and accession numbers are indicated. See Figure 2—source data 7.
Figure 3 with 2 supplements
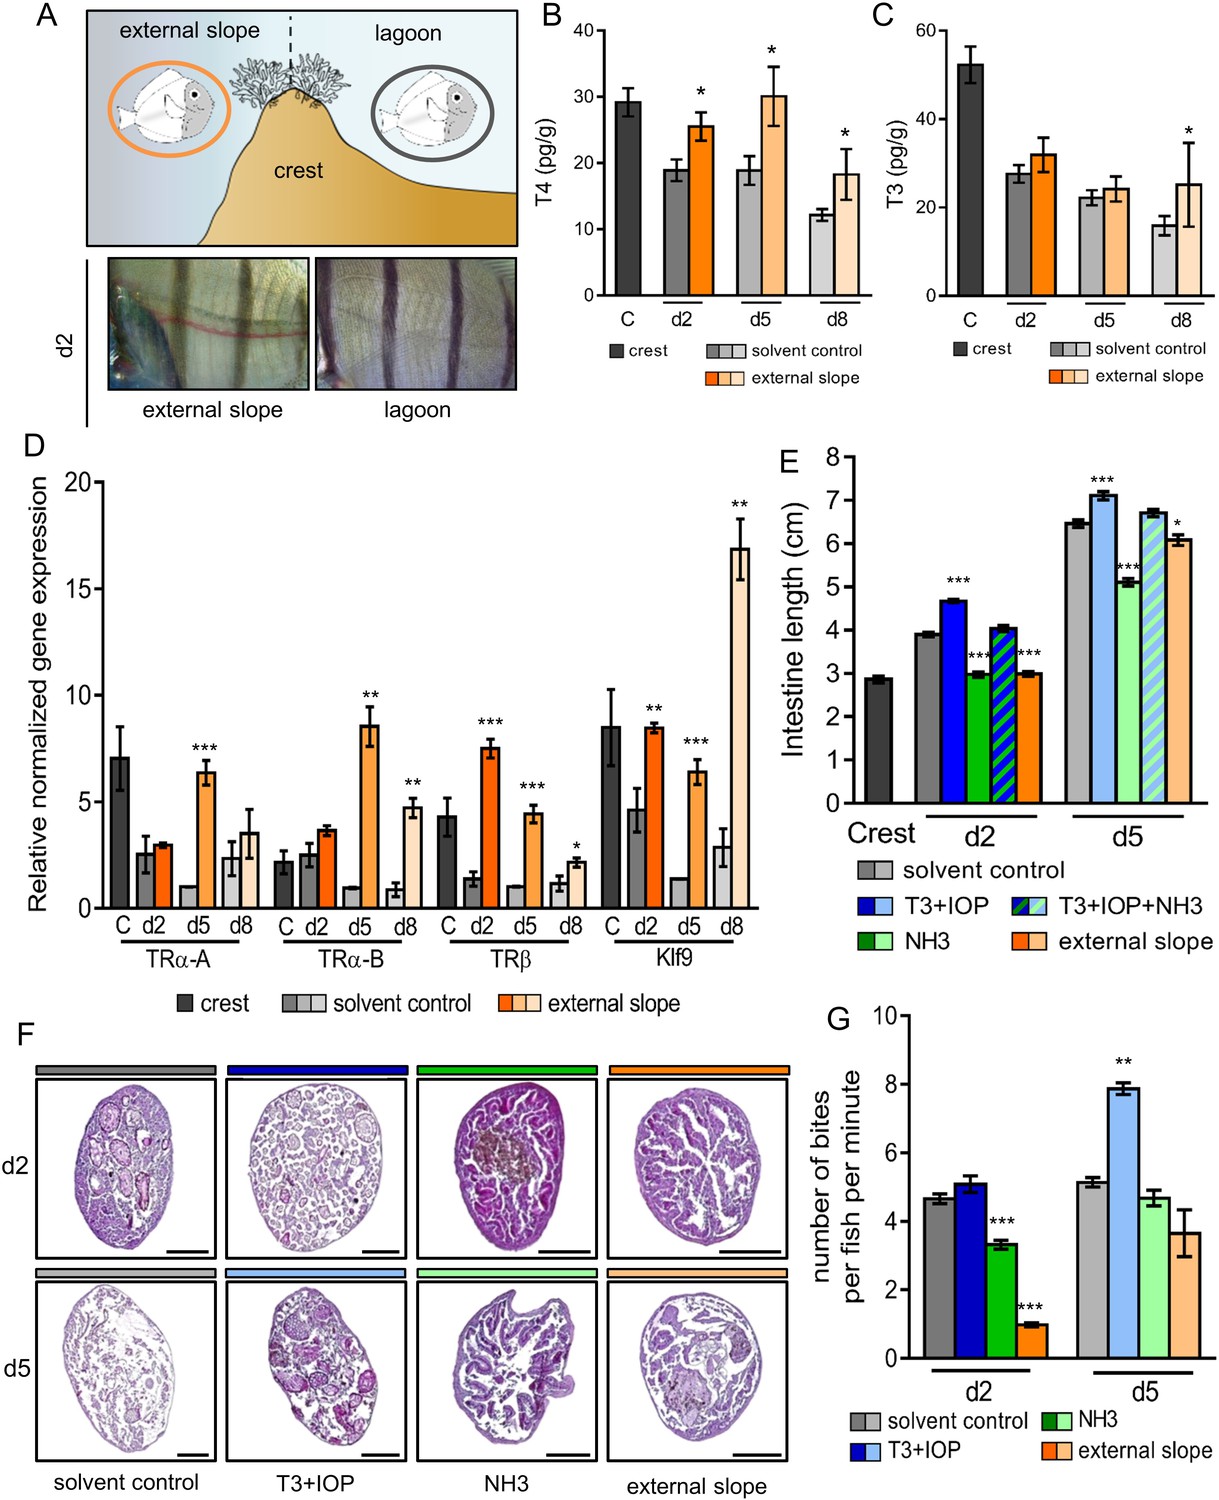
Impact of the environment and thyroid hormone signaling on Acanthurus triostegus metamorphic processes.
Error bars represent standard errors. *p-value<0.05; **p-value<0.01; ***p-value<0.001. (A) Upper panel: schematization of the external slope experiment with control fish, in the lagoon (grey circle), and relocated fish, on the external slope (orange circle). Lower panel: comparison of the pigmentation between the relocated fish (left) and the control lagoon fish (right) at day 2. (B) T4 and (C) T3 dosage of crest captured larvae and day 2, 5 and 8 juveniles, in control (grey shade) or external slope (orange shade) conditions. n = 4 fish for each experimental condition. X-axis: sampling point, Y-axis: T4 or T3 level in pg.g−1. Statistics: mean comparisons between control and external slope (Wilcoxon-Mann-Whitney U-test). See Figure 3—source data 1 and Figure 3—source data 2 for detailed data and statistics. (D) Expression level of TRα-A, TRα-B, TRβ and Klf9 by qPCR, normalized with pold2 and rpl7 housekeeping genes, in control (grey shade) or external slope (orange shade) conditions. Y-axis: Relative normalized expression. X-axis: gene and stages. For each point three biological replicates and three technical replicates were performed. Statistics: comparisons of ‘external slope’ means to their ‘control’ counterparts (Student's t cumulative distribution function). See Figure 3—source data 3 for detailed data and statistics. (E) Intestine length in cm of fish at crest (C), day 2 (d2) or day 5 (d5) under different treatment conditions: solvent-control (grey shade), T3 +IOP treated at 10−6 M (blue shade), NH3 treated at 10−6 M (green shade), T3 +IOP + NH3 treated at 10−6 M (blue and green dashed shade) or located to the external slope (orange shade). n > 10 fish for each experimental condition. Statistics: ANOVA followed by Tukey posthoc tests, only significant differences with the respective solvent-control condition are indicated. See Figure 3—source data 4 for detailed data and statistics (F) Histological cross section (5 µm width) of intestine stained by haematoxylin/eosin. Scale bars indicate 200 µm. These pictures are representative of n = 2 microtome section and staining technical replicates, performed on n = 3 fish (biological replicate) per treatment and per developmental stage. Two technical replicates of this experiment were performed. (G) Mean number of bites (on turf algae) per fish in a batch of 18 fish at day 2 (d2) and day 5 (d5) under different treatment conditions: solvent control (DMSO, grey shade), T3 + IOP at 10−6µM (blue shade), NH3 at 10−6µM (green shade) or relocated to the external slope (orange shade). n = 3 to 6 independent bite counts (technical replicates) for each condition. Bite counting was not performed on crest captured individuals as A. triostegus larvae do not feed for at least 12 hr after colonizing the reef at night (MB pers. obs.). Statistics: same as in (E). See Figure 3—source data 5 for detailed data and statistics.
-
Figure 3—source data 1
T4 levels in external slope relocated Acanthus triostegus.
- https://doi.org/10.7554/eLife.27595.021
-
Figure 3—source data 2
T3 levels in external slope relocated Acanthus triostegus.
- https://doi.org/10.7554/eLife.27595.022
-
Figure 3—source data 3
TR and Klf9 expression levels in external slope relocated Acanthurus triostegus (qPCR).
- https://doi.org/10.7554/eLife.27595.023
-
Figure 3—source data 4
Acanthurus triostegus intestine length under pharmacological treatments or relocation.
- https://doi.org/10.7554/eLife.27595.024
-
Figure 3—source data 5
Acanthurus triostegus grazing activity under pharmacological treatments or relocation.
- https://doi.org/10.7554/eLife.27595.025
Figure 3—figure supplement 1
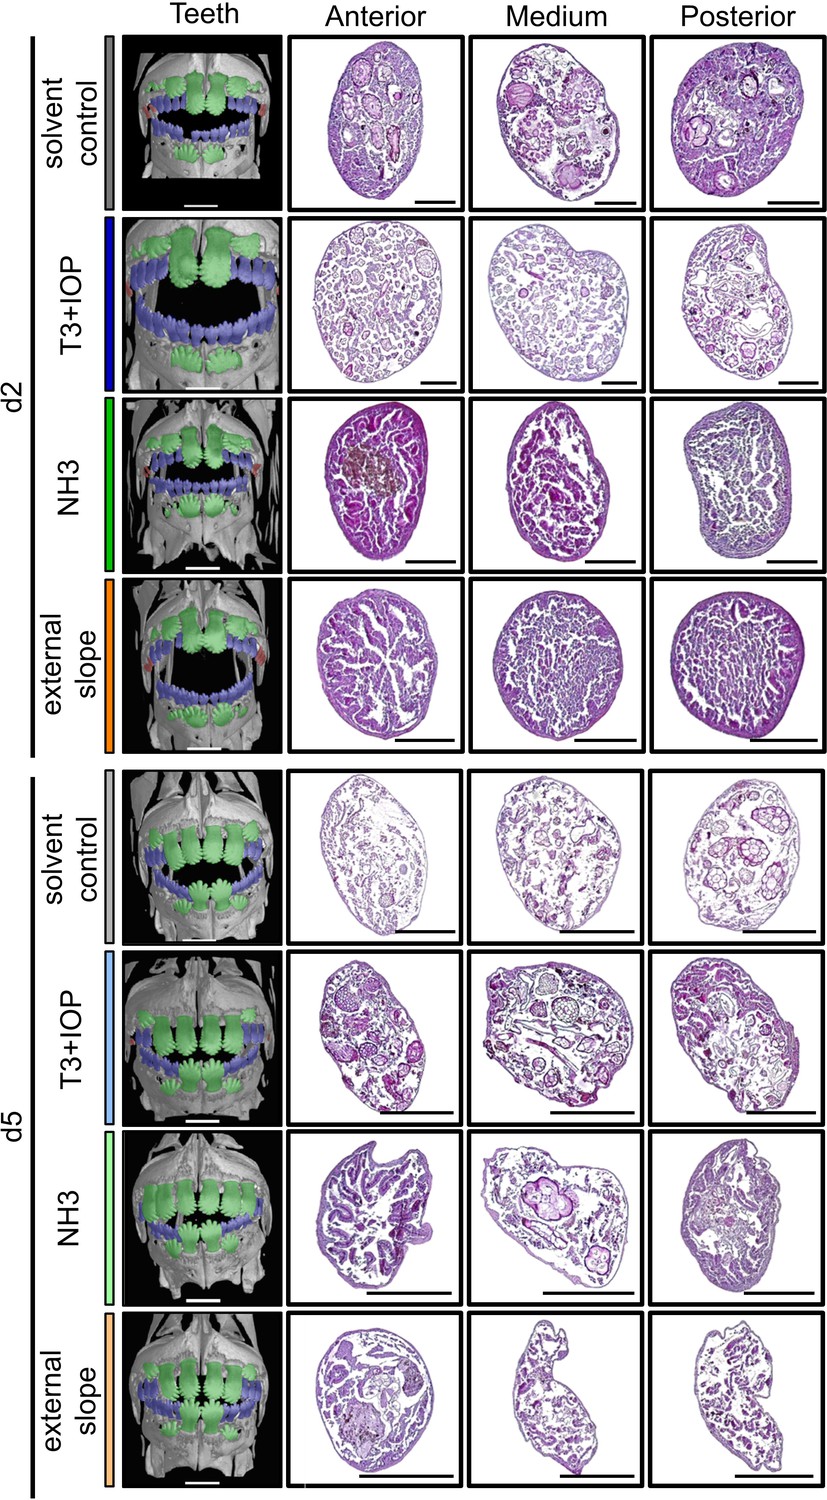
Thyroid hormone signaling and environment impact on the dentition and guts histology of Acanthurus triostegus at metamorphosis.
First column: X-Ray microtomography of larva, dentition A, B or C are highlighted respectively in red, blue or green. Scale bars indicate 0.5 mm. These pictures are representative of n = 3 fish (biological replicates) per developmental stage and per treatment condition. Second to fourth columns: complete guts histology (5 µm wide microtome sections) of A. triostegus at day 2 and day 5 following reef colonization. First column: anterior part of the intestine (first cm), middle column: medium part (variable), last column: posterior part of the intestine (last cm). Haematoxylin and eosin staining. Scale bars indicate 200 µm. These pictures are representative of n = 2 treatment technical replicates, and n = 2 microtome section and staining technical replicates, on n = 3 fish (biological replicates) per treatment and per day.
Figure 3—figure supplement 2
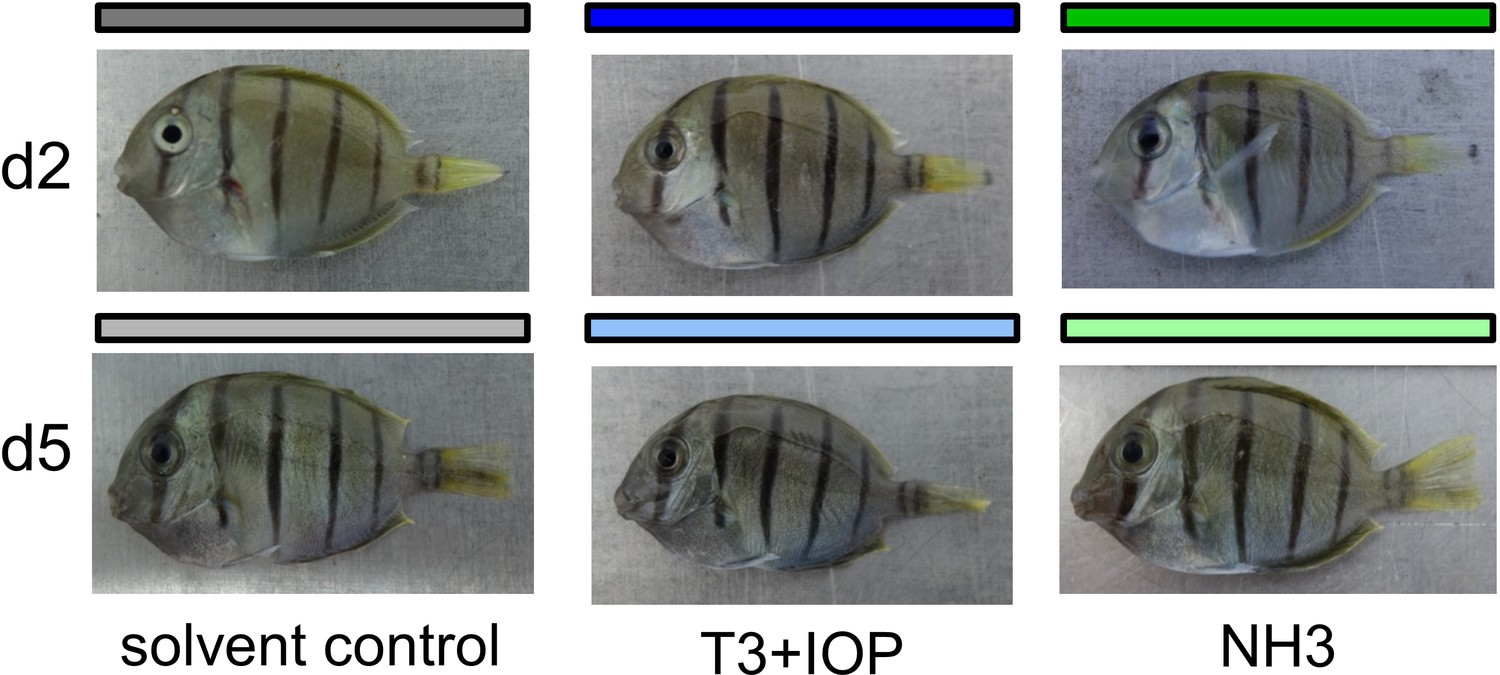
Pigmentation patterns and thyroid hormone signaling in Acanthurus triostegus at day 2 (d2) and day (d5) during larval recruitment.
These pictures are representative of n > 10 treatment technical replicates performed on n > 100 fish (biological replicates) per treatment and per developmental stage.
Figure 4
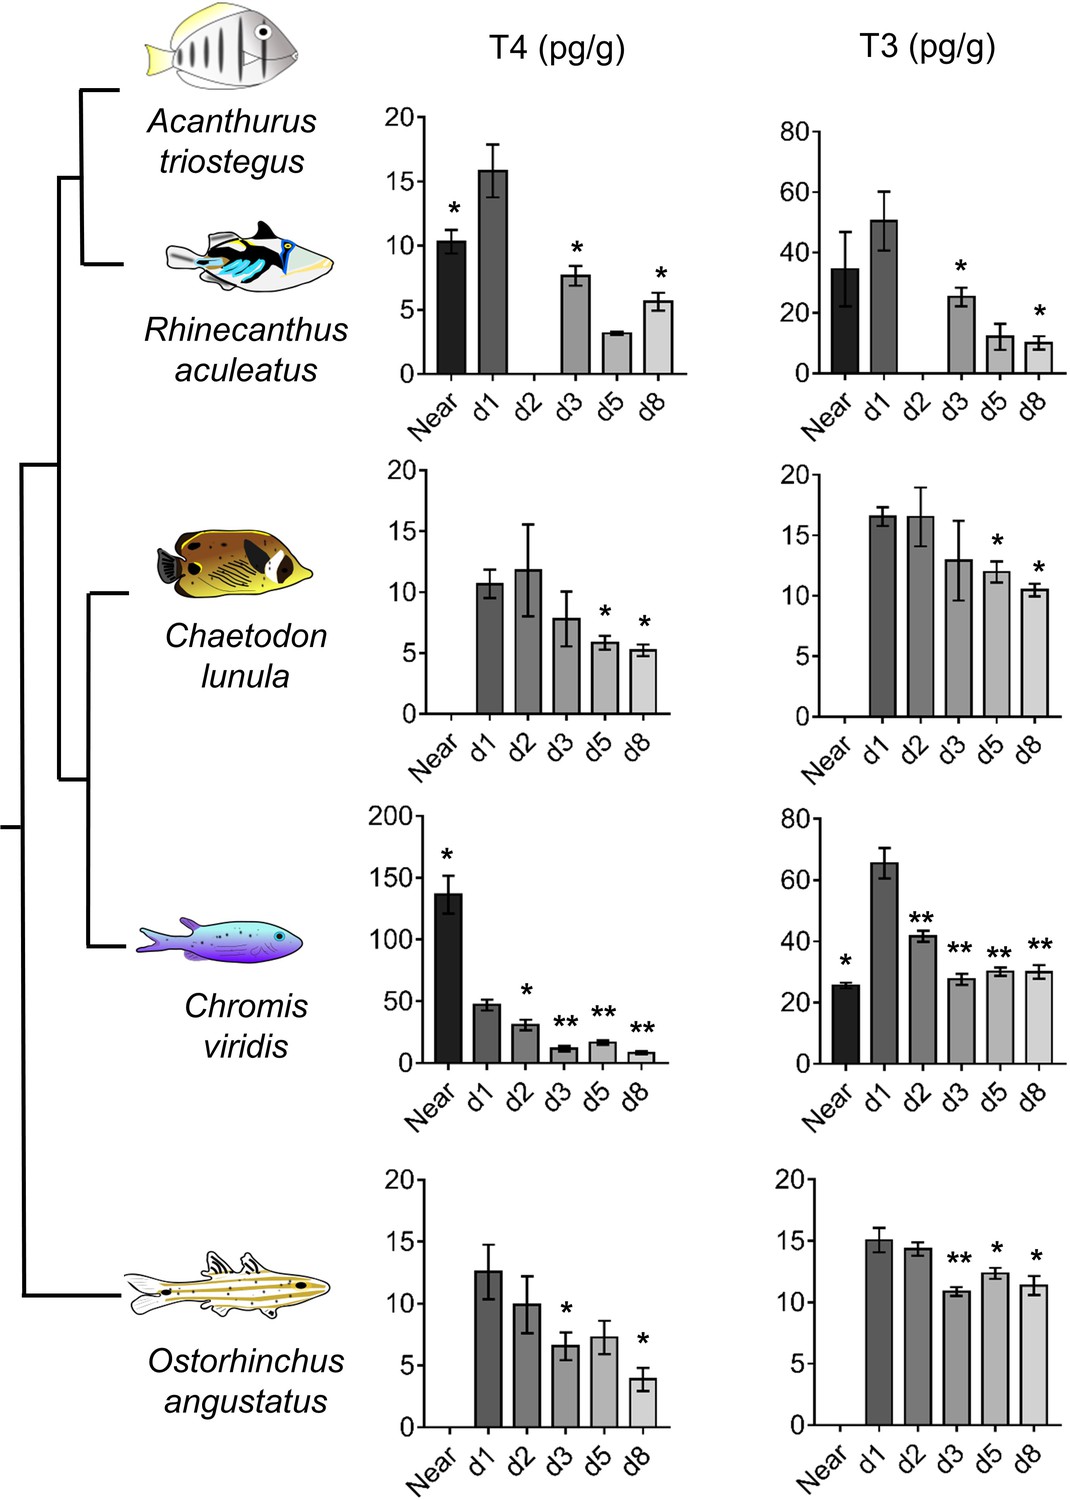
Thyroid hormone levels in distant coral reef fish at larval recruitment.
Error bars represent standard errors. *p-value<0.05; **p-value<0.01; ***p-value<0.001. TH levels of: Rhinecanthus aculeatus (upper), Chromis viridis (middle up), Chaetodon lunula (middle low) and Ostorhinchus angustatus (lower). n = 3 to 5 biological replicates for each condition. First column is T4, second column is T3. Y-axis: T4 or T3 level in pg.g−1. X-axis: sampling point (developmental stage). The phylogenic relationship between the species is plotted on the far left of the figure. Statistics: for each species, comparisons of each mean to the day 1 (d1) mean (Wilcoxon-Mann-Whitney U-test). See Figure 4—source data 1 for detailed data and statistics.
-
Figure 4—source data 1
T4 and T3 levels of various coral reef fishes at different development stages.
- https://doi.org/10.7554/eLife.27595.027
Figure 5 with 1 supplement

Influence of chlorpyrifos exposure on Acanthurus triostegus thyroid hormone signaling, intestine length, grazing activity, and algal removal efficiency.
Error bars represent standard errors. *p-value<0.05; **p-value<0.01; ***p-value<0.001. (A) T3 level in pg.g−1 of day 2 (d2) and day 5 (d5) fish exposed to different conditions: solvent control (C, acetone, white bars), or exposed to CPF at 1 µg.l−1 (1, light yellow bars), 5 µg.l−1 (5, yellow bars) or 30 µg.l−1 (30, dark yellow bars). Exposure started right after crest capture. n = 10 fish in each condition. Statistics: ANOVA followed by Tukey posthoc tests, only significant differences with the solvent-control condition are indicated. See Figure 5—source data 1 for detailed data and statistics. (B) Intestine length in cm of fish at day 2 (d2) or day 5 (d5) under different conditions: solvent control (C, acetone, white bars), or exposed to CPF at 1 µg.l−1 (1, light yellow bars), 5 µg.l−1 (5, yellow bars) or 30 µg.l−1 (30, dark yellow bars). Exposure started right after crest capture. n = 5 to 8 fish for each experimental condition. Statistics: same as in (A). See Figure 5—source data 2 for detailed data and statistics (C) Mean number of bites (on turf algae) per fish in a batch of 18 fish on reef turf at day 2 (d2) or day 5 (d5), under different conditions: solvent control (C, acetone, white bars), or exposed to CPF at 1 µg.l−1 (1, light yellow bars), 5 µg.l−1 (5, yellow bars) or 30 µg.l−1 (30, dark yellow bars). Exposure started right after crest capture. n = 3 independent bite counts for each condition. Statistics: same as in (A). See Figure 5—source data 3 for detailed data and statistics. (D) Mean turf biomass removed per fish in a batch of 10 fish, in 5 days following reef colonization, under different conditions: solvent control (C, acetone, white bars), or exposed to CPF at 1 µg.l−1 (1, light yellow bars), 5 µg.l−1 (5, yellow bars) or 30 µg.l−1 (30, dark yellow bars). Exposure started right after crest capture. n = 3 independent measurements of grazed turf for each condition. Statistics: comparisons of each mean to the solvent-control (C) mean (Wilcoxon-Mann-Whitney U-test). See Figure 5—source data 4 for detailed data and statistics.
-
Figure 5—source data 1
T3 levels in Acanthurus triostegus under different chlorpyrifos exposure conditions.
- https://doi.org/10.7554/eLife.27595.030
-
Figure 5—source data 2
Intestine length of Acanthurus triostegus under different chlorpyrifos exposure conditions.
- https://doi.org/10.7554/eLife.27595.031
-
Figure 5—source data 3
Grazing activity of Acanthurus triostegus under different chlorpyrifos exposure conditions.
- https://doi.org/10.7554/eLife.27595.032
-
Figure 5—source data 4
Quantity of grazed algae by Acanthurus triostegus under different chlorpyrifos exposure conditions.
- https://doi.org/10.7554/eLife.27595.033
-
Figure 5—source data 5
T4 levels in Acanthurus triostegus under different chlorpyrifos exposure conditions.
- https://doi.org/10.7554/eLife.27595.034
Figure 5—figure supplement 1
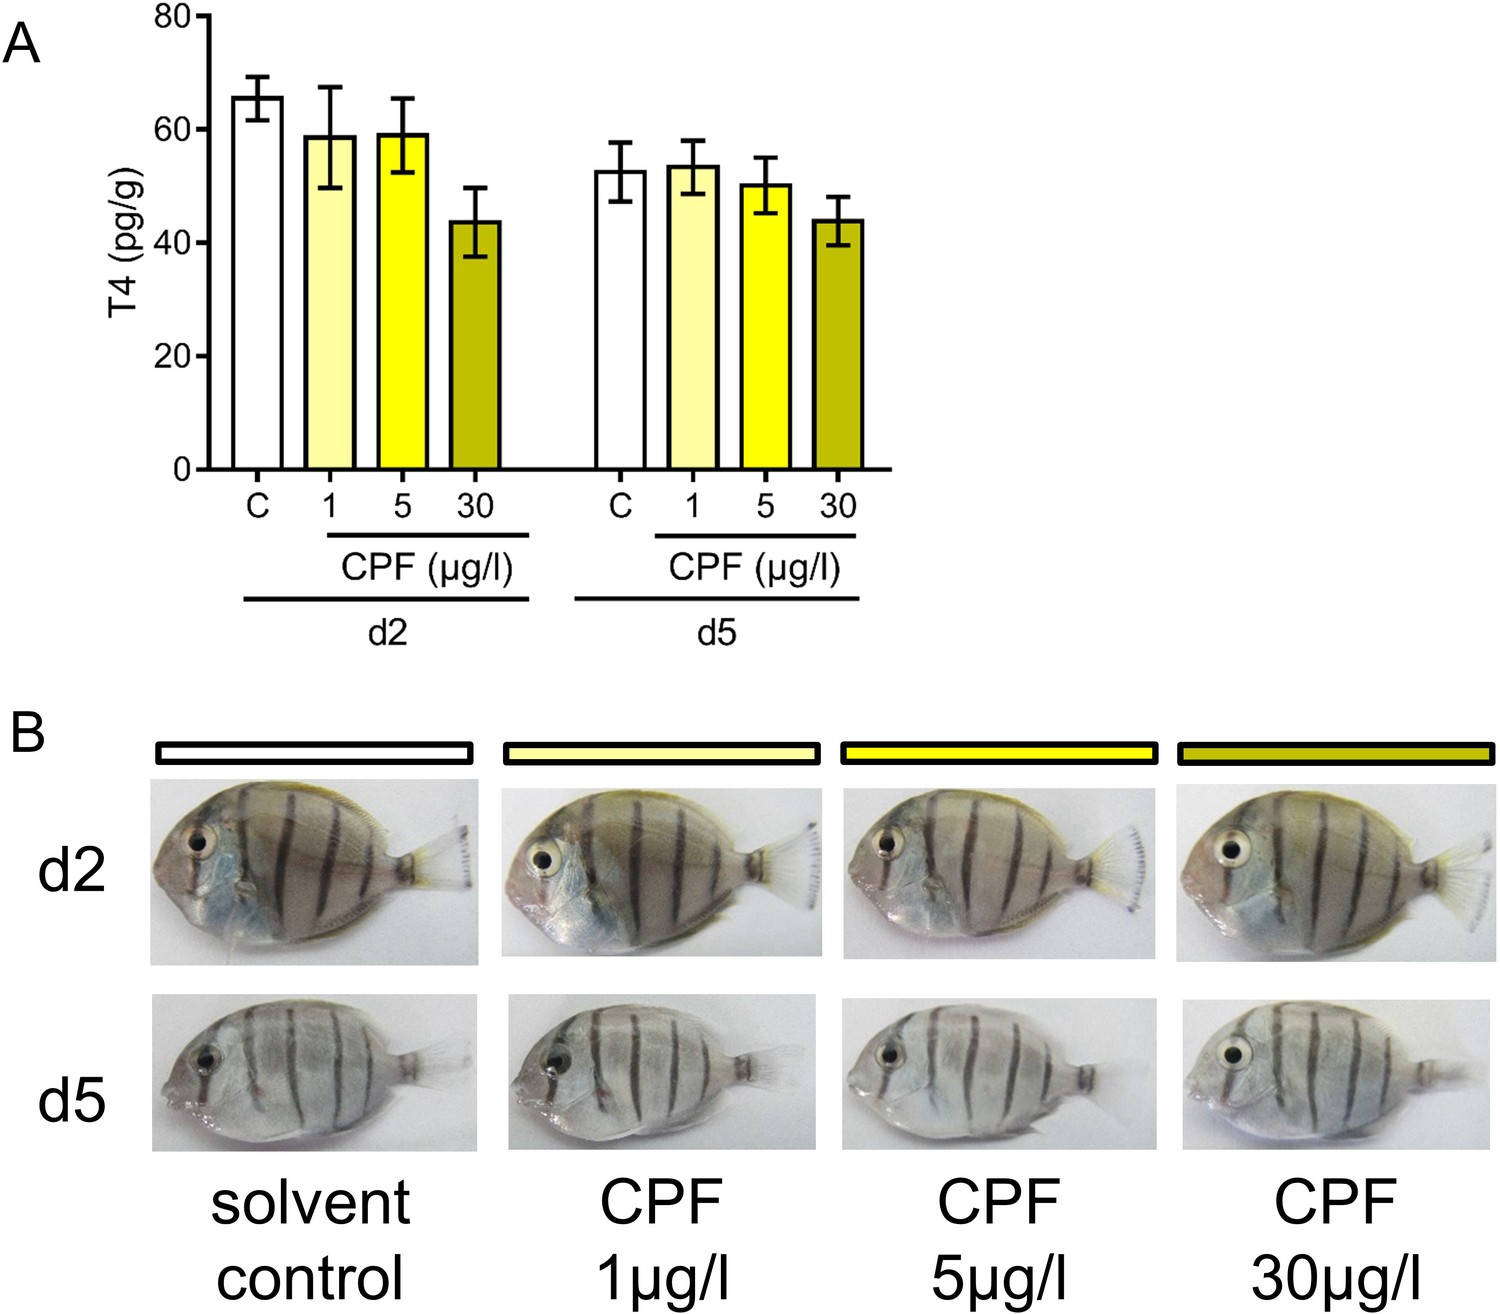
Pigmentation patterns and chlorpyrifos exposure in A. triostegus at metamorphosis.
(A) T4 level in pg.g−1 of day 2 (d2) and day 5 (d5) fish exposed to different conditions: solvent control (C, acetone, white bars), or exposed to CPF at 1 µg.l−1 (1, light yellow bars), 5 µg.l−1 (5, yellow bars) or 30 µg.l−1 (30, dark yellow bars). Exposure started right after crest capture. n = 10 fish in each condition.. See Figure 5—source data 5 for detailed data and statistics. (B) Pigmentation patterns and in A. triostegus exposed to different conditions: solvent control, or CPF at 1 µg.l−1, 5 µg.l−1, or 30 µg.l−1 at day 2 (d2) and day (d5) during larval recruitment. These pictures are representative of n = 2 chlorpyrifos CPF exposure technical replicates performed on n = 10 fish (biological replicates) per condition and per day.
Figure 6
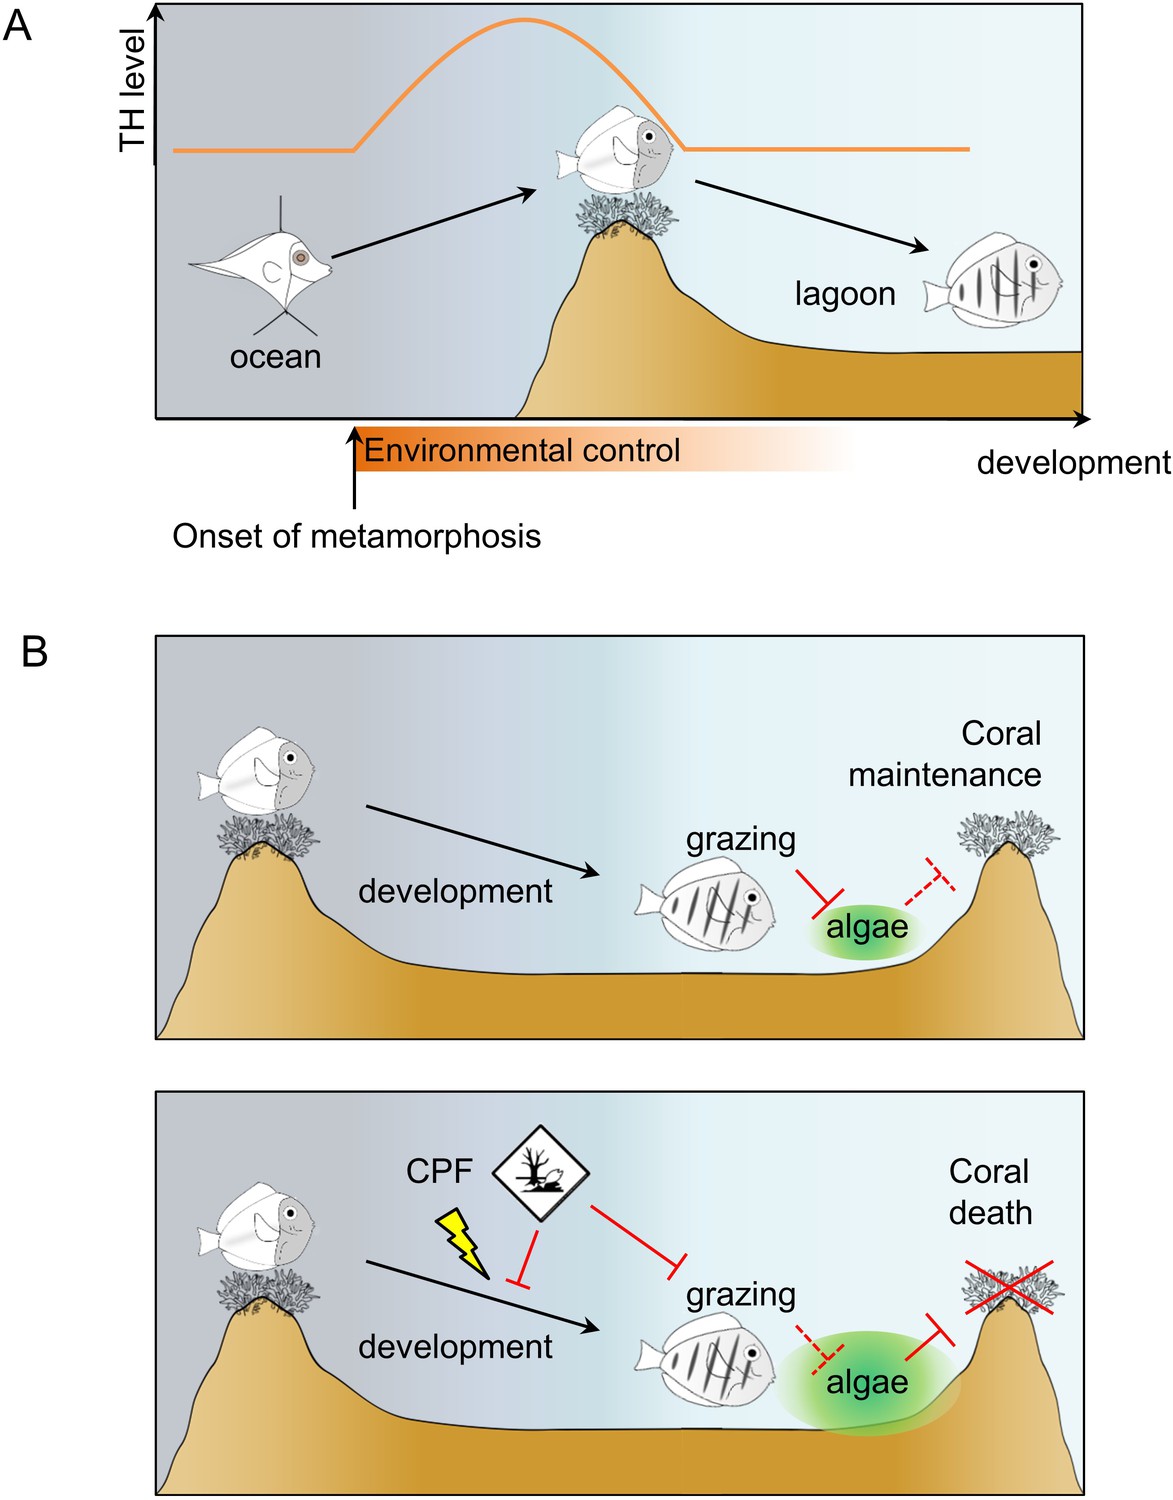
Model of Acanthurus triostegus metamorphosis and disruption by chlorpyrifos.
(A) Schematic representation of coral reef fish larval recruitment. TH level is plotted on the Y axis and development on the X axis. The onset of metamorphosis is in the open ocean and environmental influence upon development is plotted on the X-axis. (B) Consequences of undisturbed (upper panel) and CPF disturbed (lower panel) metamorphosis on grazing activity, and subsequent algal spreading and potential coral survival. Solid red bar indicates inhibition; dotted red line indicates lack of inhibition.
Additional files
-
Transparent reporting form
- https://doi.org/10.7554/eLife.27595.036
Download links
A two-part list of links to download the article, or parts of the article, in various formats.
Downloads (link to download the article as PDF)
Open citations (links to open the citations from this article in various online reference manager services)
Cite this article (links to download the citations from this article in formats compatible with various reference manager tools)
Fish larval recruitment to reefs is a thyroid hormone-mediated metamorphosis sensitive to the pesticide chlorpyrifos
eLife 6:e27595.
https://doi.org/10.7554/eLife.27595


