Maturation of selected human mitochondrial tRNAs requires deadenylation
- University of Cambridge, United Kingdom
- University of Porto, Portugal
Figures
Figure 1 with 1 supplement
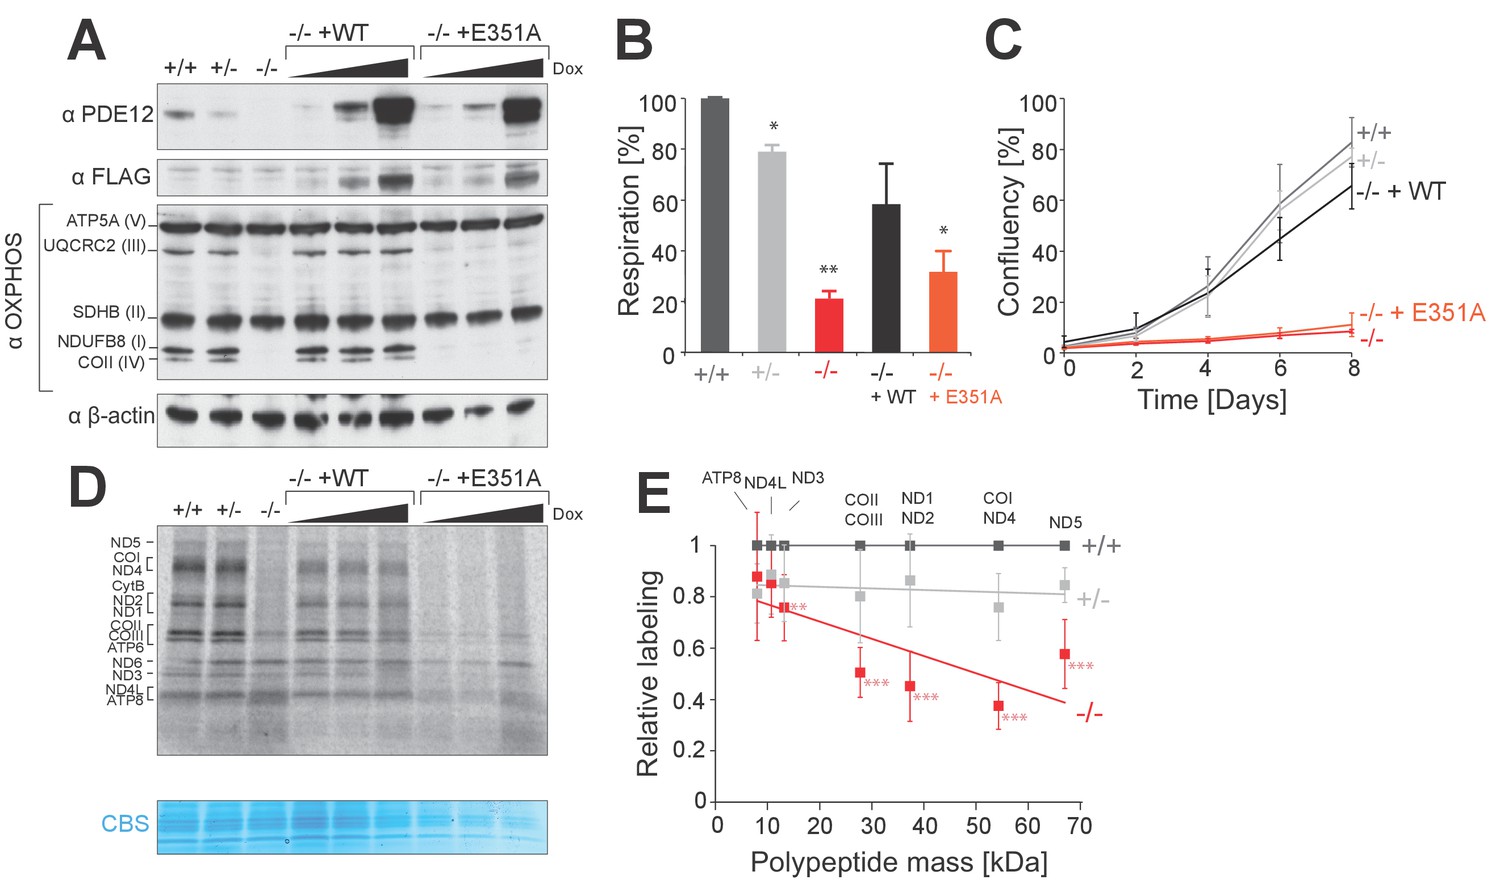
PDE12 is essential for efficient mitochondrial translation.
(A) Western blotting for steady-state levels of OxPhos components in PDE12+/+, PDE12 ± and PDE12−/− cells, and in PDE12−/− expressing either wild-type PDE12 or the E351A catalytic mutant at increasing expression levels. (B) Basal oxygen consumption of PDE12+/+ and PDE12−/− cells, and PDE12−/− cells expressing either wild-type PDE12 or E351A. Mean values ± SEM are shown, n = 3. *p<0.05, ***p<0.001 with Student t-test relative to PDE12+/+. (p values: [+/+] vs. [+/−] p=0.0141; [+/+] vs. [−/−] p=0.00134; [+/+] vs. [−/− + WT] p=0.12; [+/+] vs. [−/− + E351A] p=0.0144). (C) Growth curve of PDE12+/+, PDE12+/− and PDE12−/− cells, and PDE12−/− cells expressing either PDE12 wild-type or E351A cultured in DMEM containing 0.9 g/L galactose. Representative experiment is shown where each cell line was plated in quadruplicate (mean ± 1 SD). (D) Metabolic labelling of mitochondrial translation products with [35S]-methionine in PDE12+/+, PDE12+/− and PDE12−/− cells, and in PDE12−/− cells expressing either wild-type PDE12 or E351A for 24 hr at increasing levels. CBS: Coomassie blue stained gel as loading control. (E) Quantification of a subset of mitochondrial translation products in PDE12+/− and PDE12−/− relative to PDE12+/+using ImageQuant software. Relative quantification for each polypeptide was plotted against expected length of polypeptide. For COII/III, ND1/ND2 and COI/ND4 products were quantified together due to proximity of their bands on the gel, and plotted mass is the mean average of both proteins (mean ± SD; n = 6, for PDE12+/− n = 3, **p<0.01, ***p<0.001). (p values: [+/+] vs. [+/−]: ATP8 p=0.148, ND4L p=0.407, ND3 p=0.299, COX2/COX3 p=0.263, ND1/ND2 p=0.397, COX1/ND4 p=0.12124, ND5 p=0.08528; [+/+] vs. [+/+]: ATP8 p=0.328, ND4L p=0.058, ND3 p=0.00857, COX2/COX3 p=9.21×10⁻⁵, ND1/ND2 p=0.00029, COX1/ND4 p=2.08×10⁻⁵, ND5 p=0.00016.
Figure 1—figure supplement 1
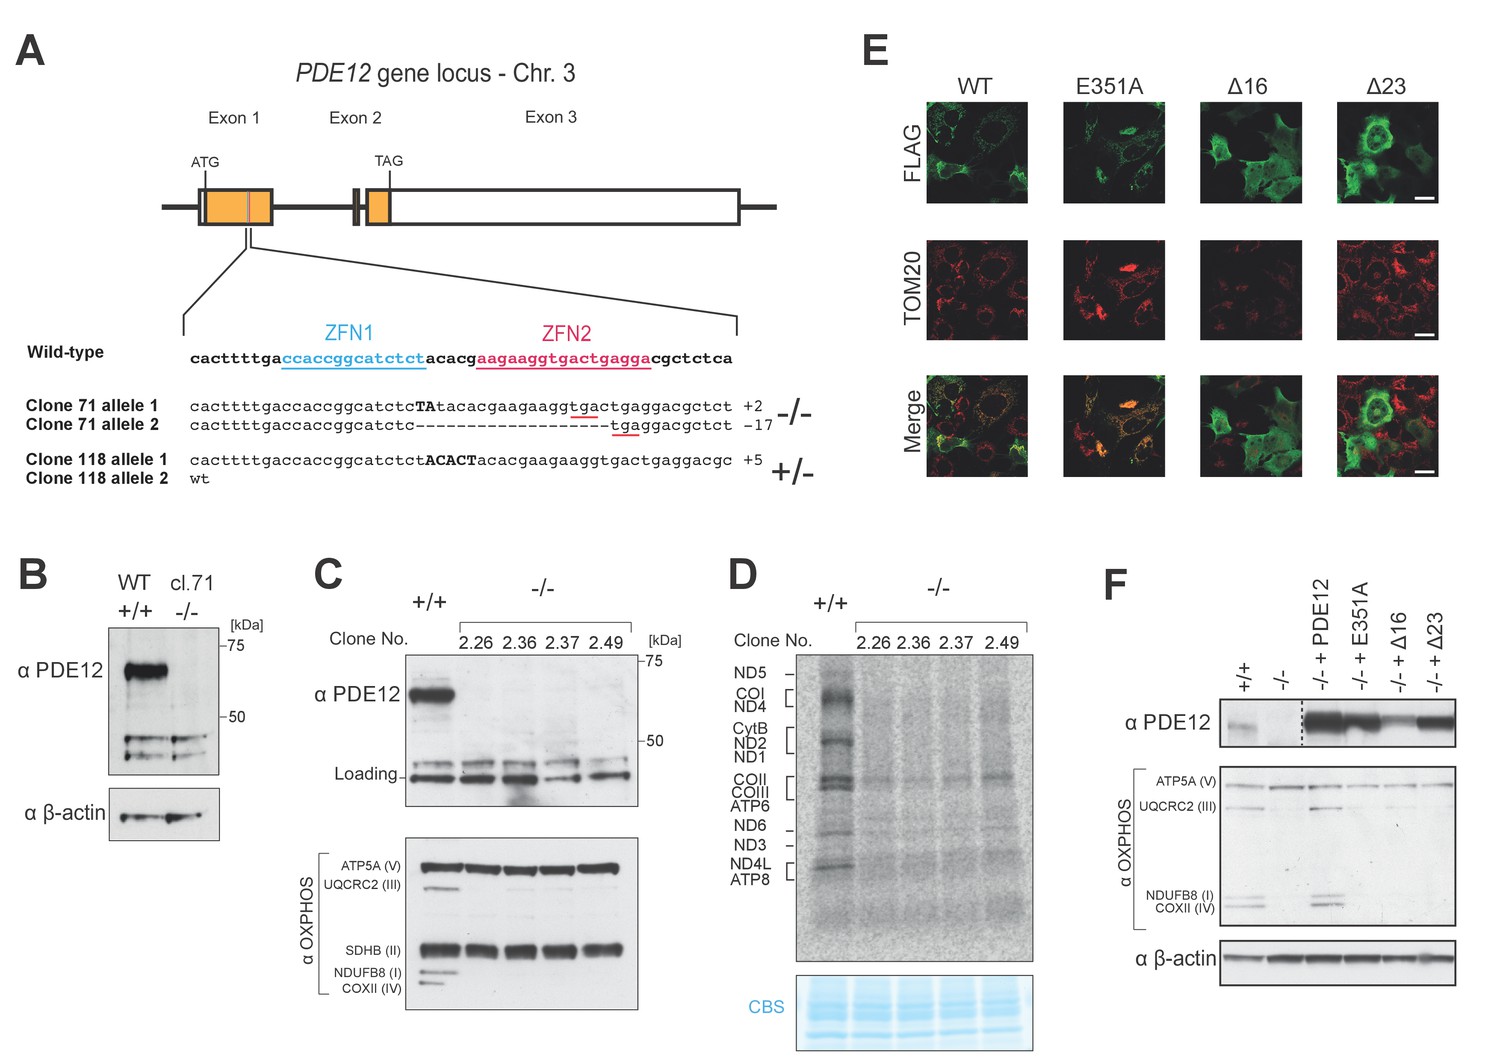
Gene targeting of PDE12 with ZFNs and complementation.
(A) Schematic of PDE12 gene locus indicating target sites of ZFNs. The indels present in clones 71 (PDE12−/−) or 118 (PDE12+/−) are indicated. (B) Western to confirm knockout of PDE12 in biallelic PDE12−/− cell line (clone 71). (C) Western blotting of four additional PDE12−/− clones produced by re-transfection of PDE12+/− (clone 118) to confirm knockout and reduction in steady-state levels of OxPhos subunits. (D) Mitochondrial translation products were labelled with [35S]-methionine in PDE12+/+ and four additional PDE12−/− clones. CBS- Coomassie blue stained gel as loading control. (E) Immunofluorescence to confirm exclusion of Δ16 and Δ23 PDE12 variants from mitochondria in human cells due to loss of mitochondrial targeting sequence. TOM20, translocator of the outer mitochondrial membrane 20. Scale bar = 20 μm. (F) Western to confirm PDE12−/− cells requires expression of catalytically active PDE12 to be targeted to mitochondria for recovery of steady-state levels of OxPhos subunits.
Figure 2 with 1 supplement
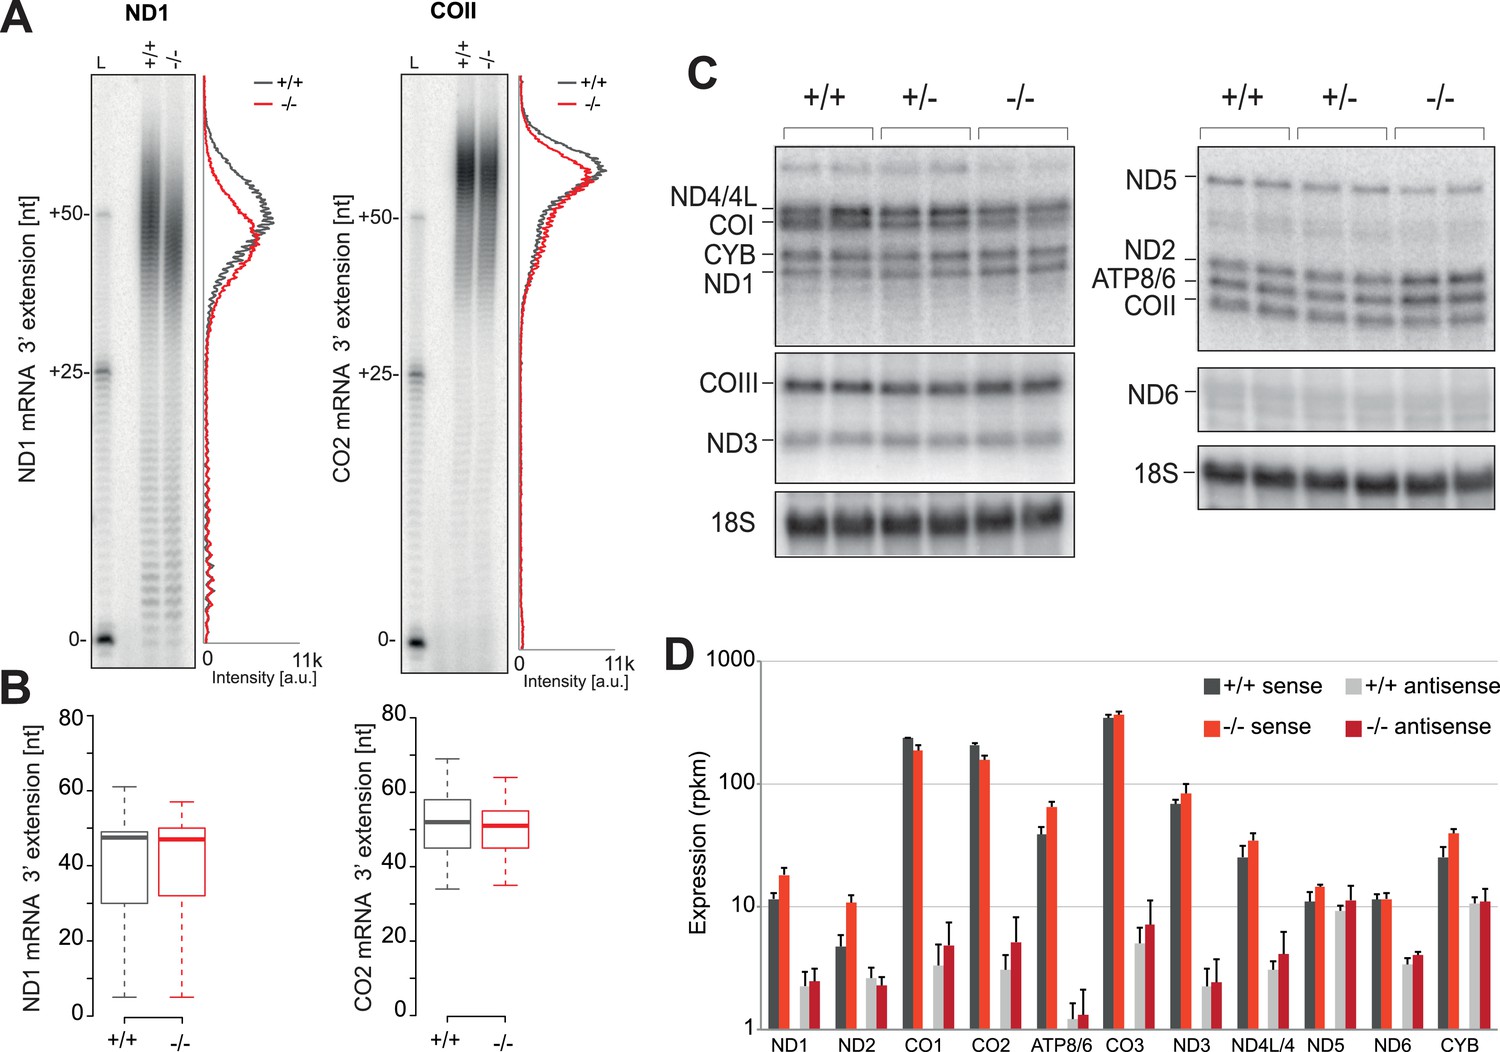
Mitochondrial mRNAs are unaffected by absence of PDE12.
(A) Radioactive MPAT assay for ND1 and COII transcripts for PDE12+/+ and PDE12−/− with densitometric profile of tail length determined via ImageQuant. (B) Box plot representing length of 3' extensions to ND1 and COII transcripts for PDE12+/+ and PDE12−/− determined via circularisation RT-PCR. PDE12−/− not significant with Student t-test relative to PDE12+/+. (p values: COX2 p=0.63, ND1 p=0.99). (C) Northern blots of mt-mRNA for PDE12+/+, PDE12+/− and PDE12−/−. Nuclear-encoded 18S rRNA was used as a loading control. Quantification provided in Figure 2—figure supplement 1C. (D) Steady-state levels of mt-mRNAs and mt-mRNA antisense transcripts for PDE12+/+, and PDE12−/− assessed via RNA-seq.
Figure 2—figure supplement 1
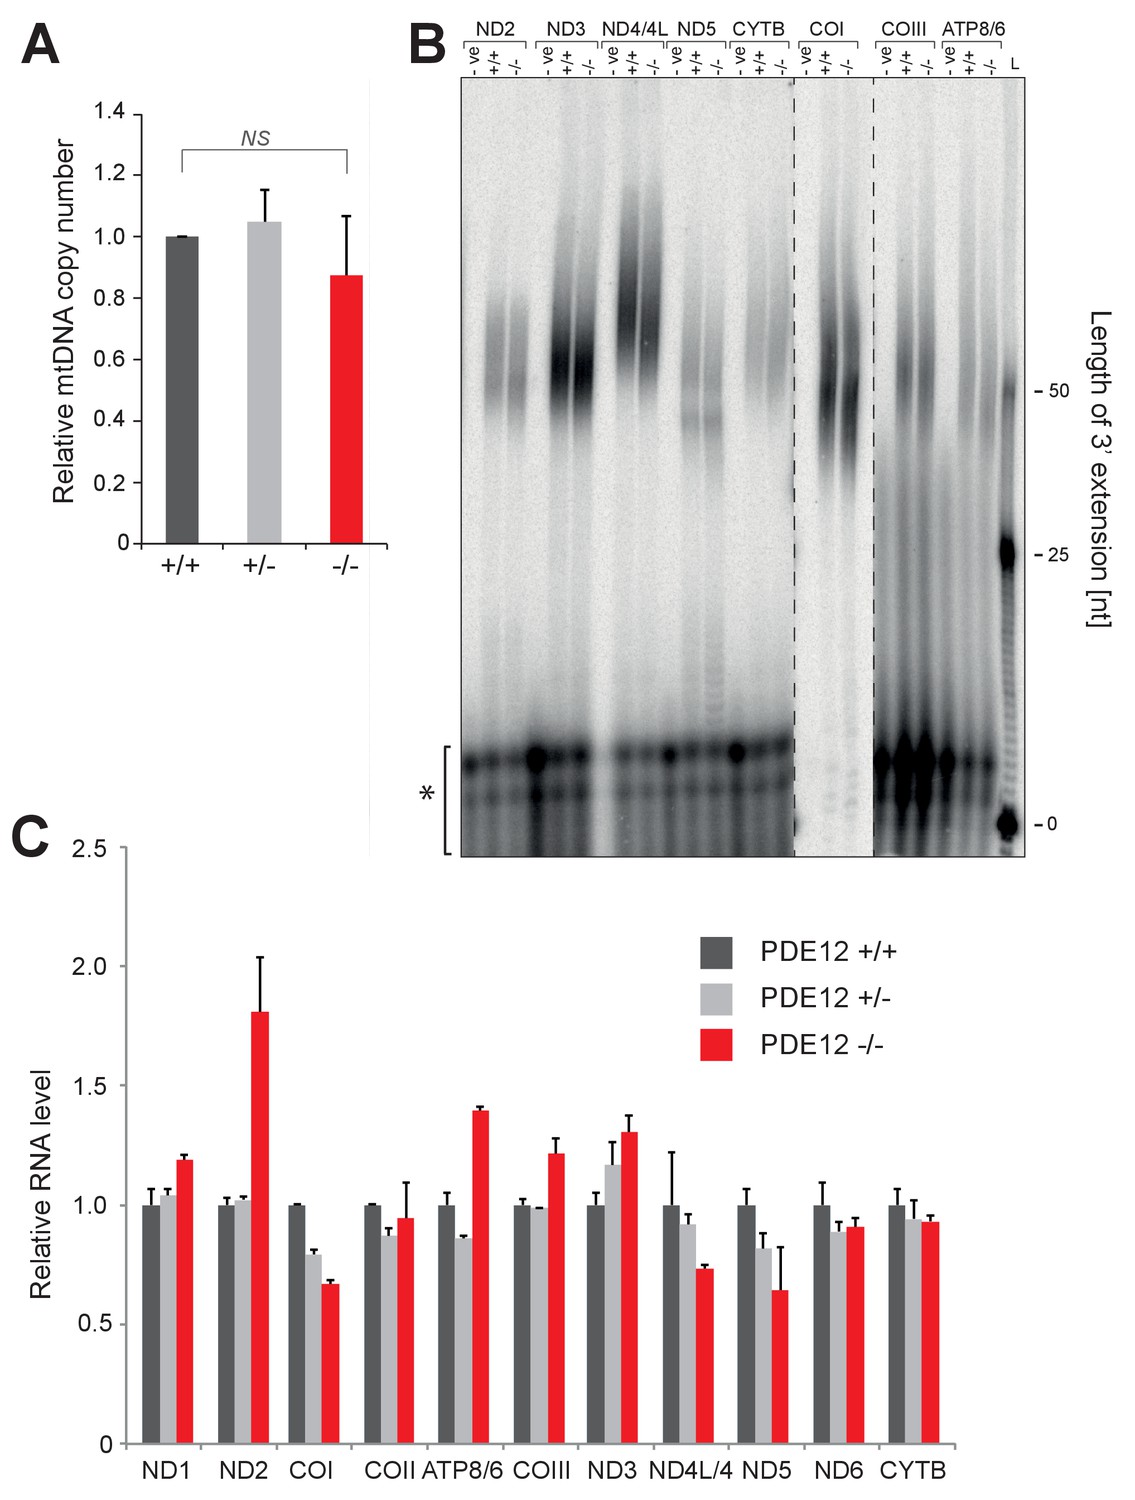
mtDNA copy-number and mt-mRNA are unaffected in PDE12−/−.
(A) mtDNA copy-number determination using qPCR of mitochondrial DNA fragments relative to the nuclear B2M gene. (mean ± SEM; n = 3). PDE12−/− not significant with Student t-test relative to PDE12+/+. (p values: [+/+] vs. [+/−] p=0.69, [+/+] vs. [−/−] p=0.59). (B) Radioactive MPAT assay for polyadenylated mt-mRNAs, other than ND1 and COII (Figure 2), for PDE12+/+ and PDE12−/−. (C) Quantification of northern data in Figure 3 for mt-RNA transcripts using ImageQuant.
Figure 3 with 1 supplement
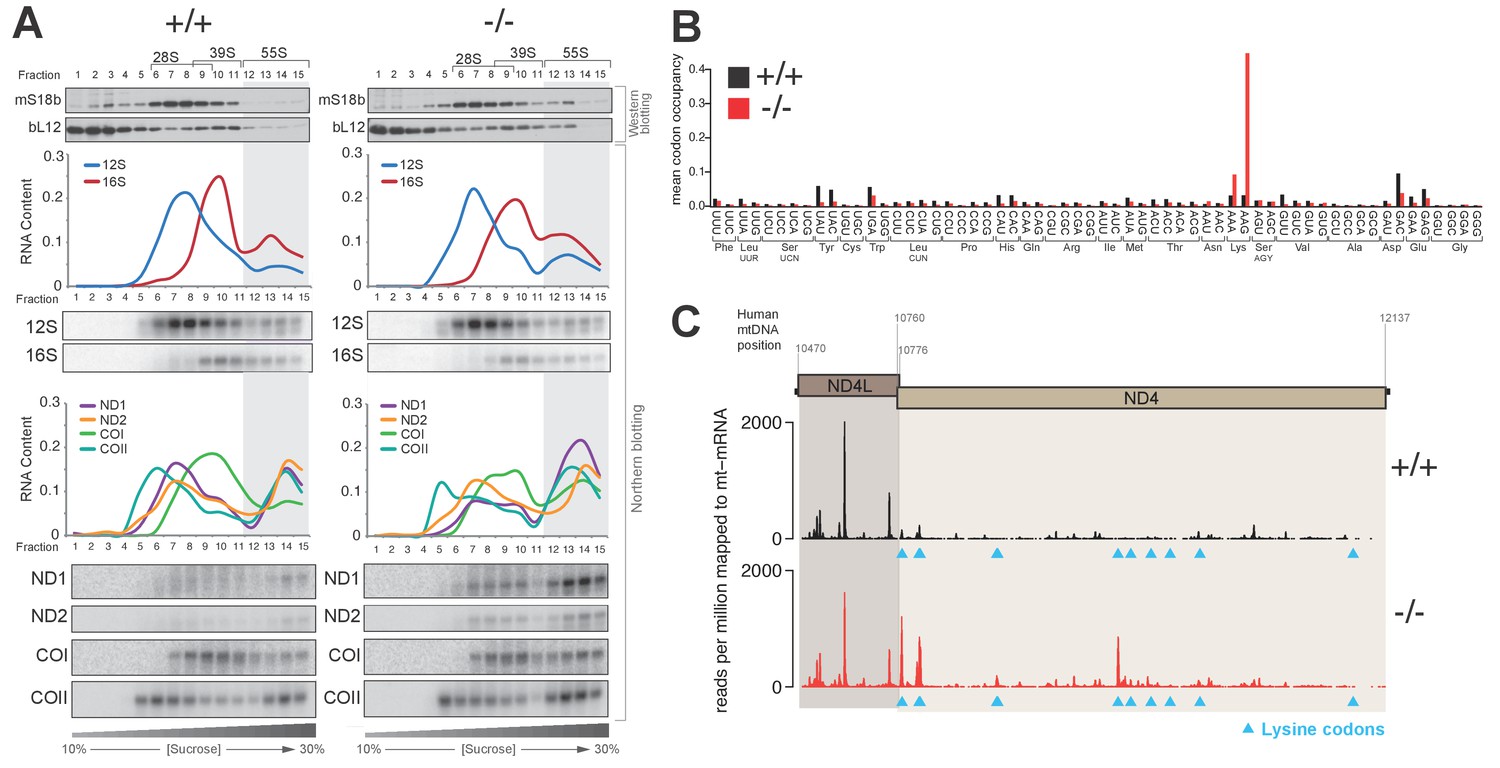
Knockout of PDE12 leads to increased stalling events on selected codons on mtDNA-encoded mRNAs.
(A) Sedimentation of mitochondrial ribosomes on 10–30% isokinetic sucrose gradients for PDE12+/− and PDE12−/− cell lines. Fractions obtained for PDE12+/+, and PDE12−/− were simultaneously analysed by western blotting with antibodies to bL12 (mt-LSU) and mS18b (mt-SSU). Northern blotting was performed using RNA extracted from each fraction with the indicated probes. Quantification of relative RNA content in each fraction was performed using ImageQuant. (B) Mean A-site codon occupancy of mitochondrial ribosomal protected fragments (mtRPFs) in the mitochondrial transcriptome of PDE12+/+ and PDE12−/−. See Materials and methods for further explanation. (C) mtRPF profile for the ND4L/ND4 transcript in PDE12+/+ and PDE12−/− as an example of increased stalling of mitoribosomes at lysine codons (Note: The ND4L ORF does not contain any lysine codons).
Figure 3—figure supplement 1
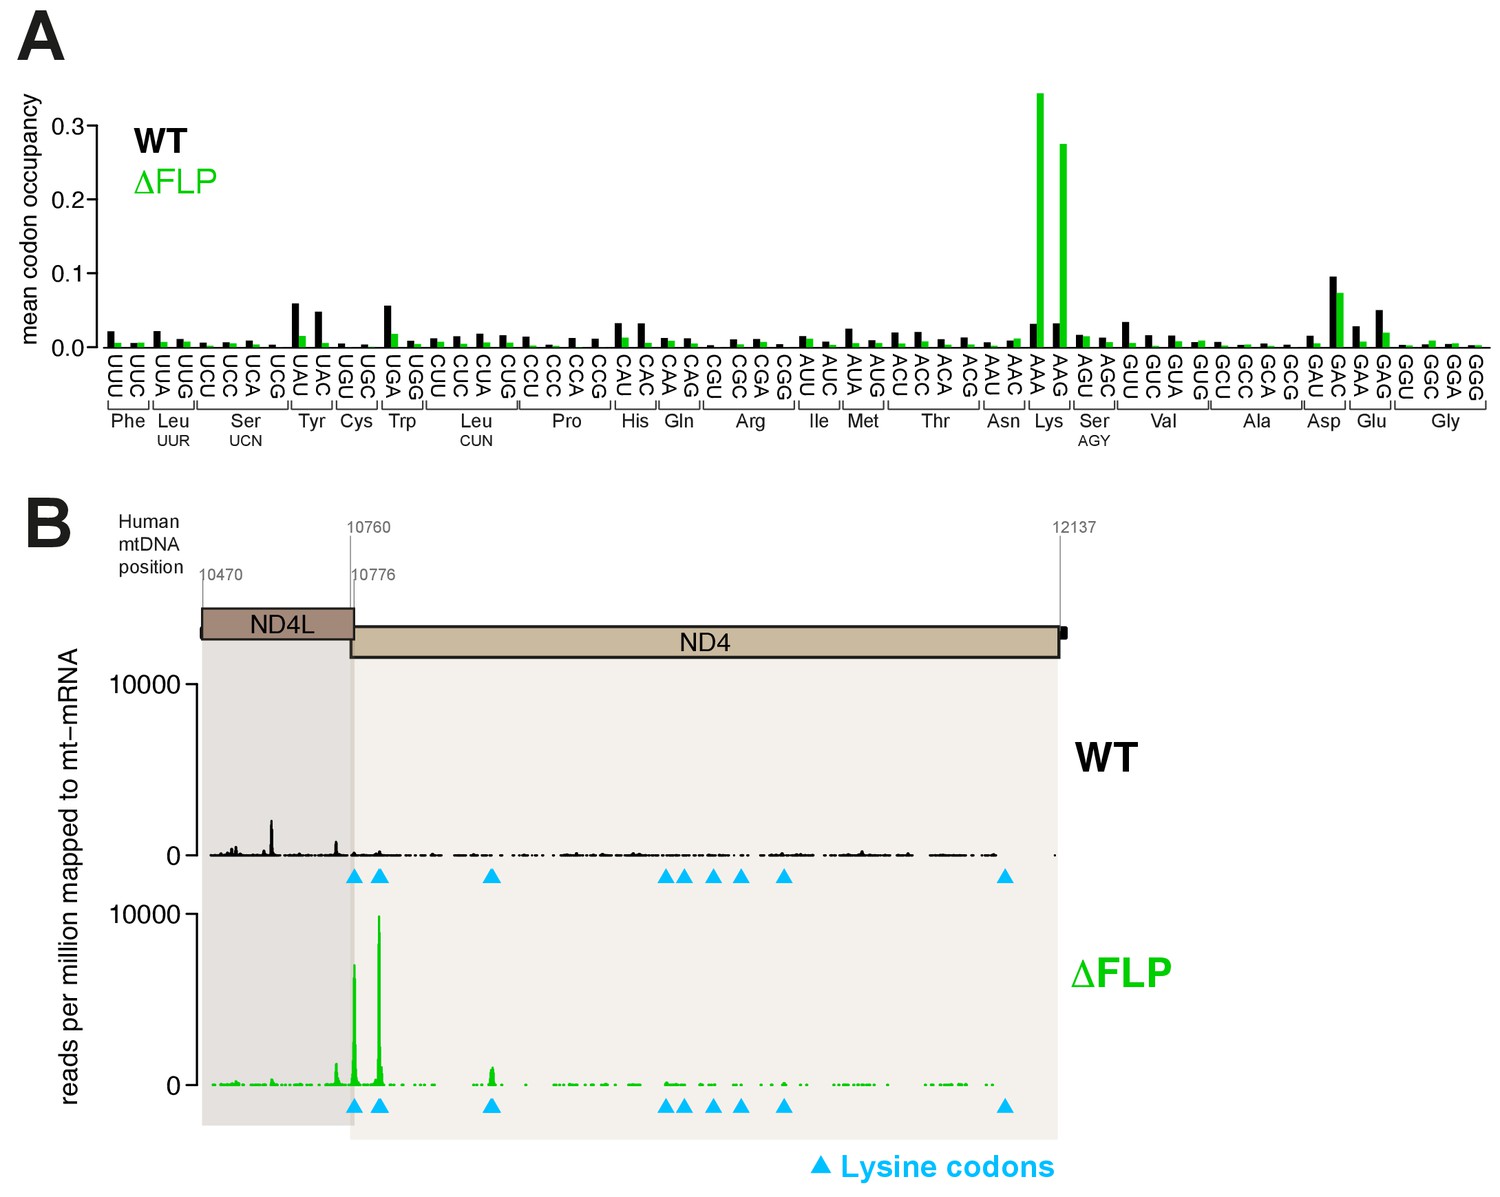
Increased stalling events on lysine codons in ΔFLP cell line.
(A) Mean A-site occupancy of mitochondrial ribosome protected fragments (mtRPFs) centred on each codon of the mitochondrial mRNA transcriptome of WT and ΔFLP. The ΔFLP cell line has been described in Gilkerson et al. (2008). (B) mtRPF profile for the ND4L/ND4 transcript in WT and ΔFLP as an example of increased stalling of mitoribosomes at lysine codons.
Figure 4 with 3 supplements
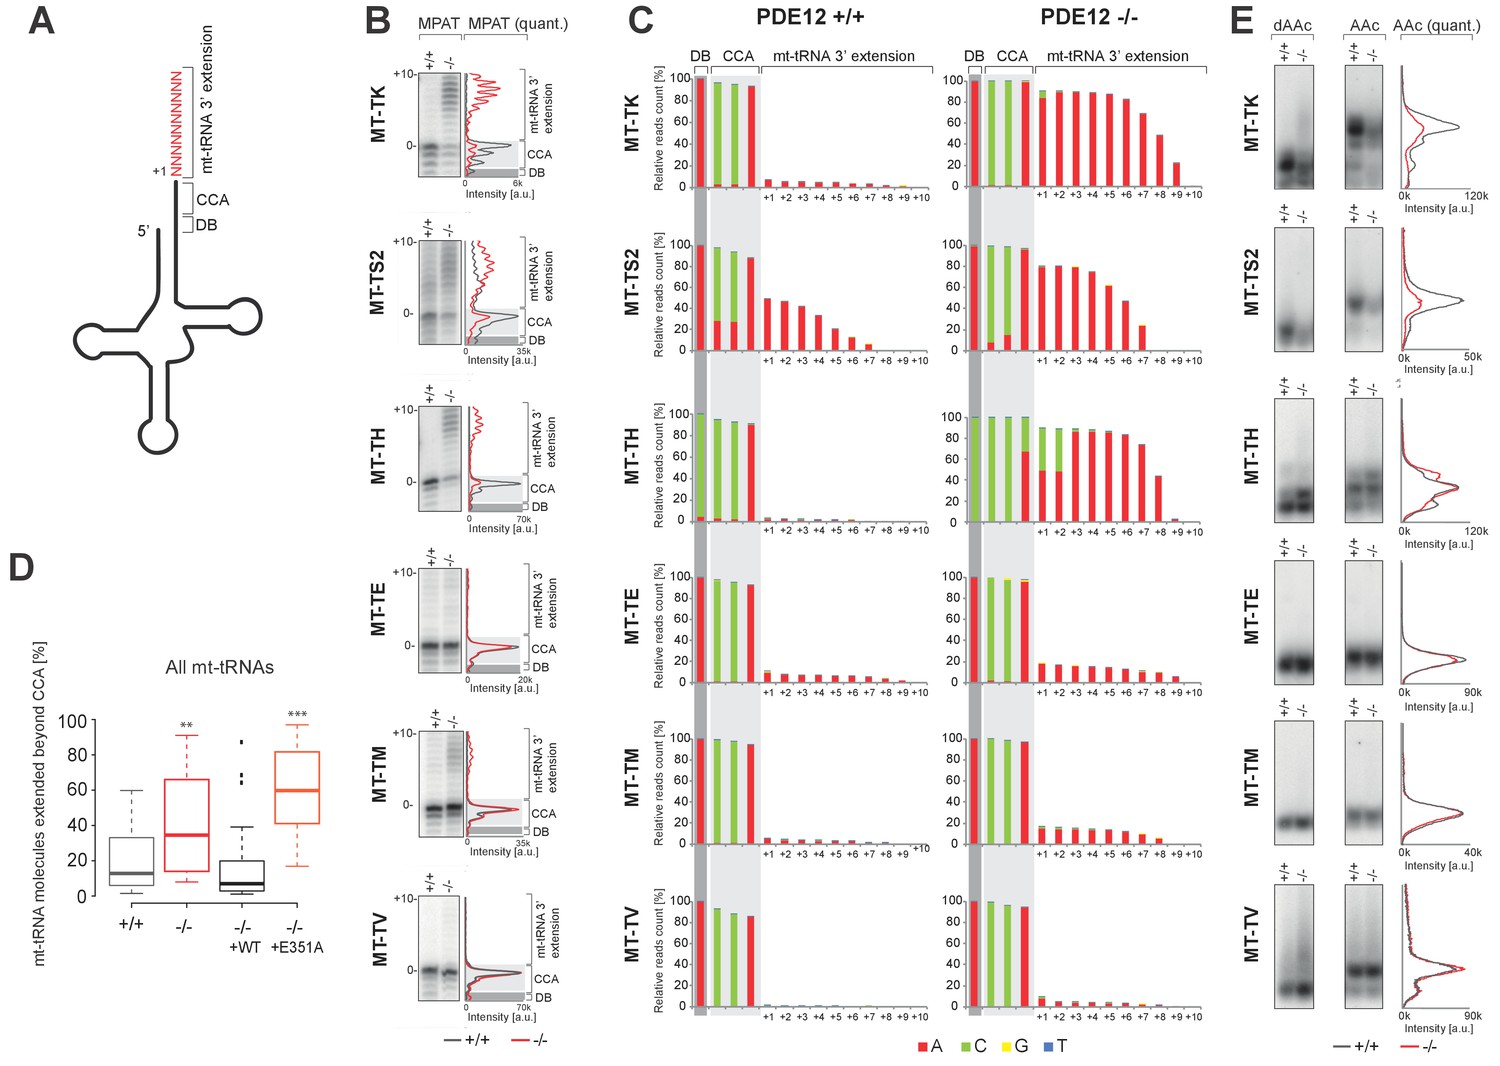
A subset of mt-tRNAs are affected by spurious 3’ adenylation in the absence of PDE12, leading to reduced aminoacylation of specific mt-tRNAs.
(A) Schematic of mt-tRNA structure depicting 3' extension determined via the radioactive MPAT (b) and MPAT-Seq (c). DB, discriminator base (B) Radioactive MPAT assay for a subset of mt-tRNAs extracted from PDE12+/+ and PDE12−/−. MPAT assay gel profiles were determined using ImageQuant. (C) Representation of 3’ ends of a subset of mt-tRNAs from PDE12+/+ and PDE12−/−, ascertained by MPAT-Seq. Read count shown for each position is relative to the read count for the corresponding discriminator base (DB) for each mt-tRNA. (D) Box-plot representation of percentage of mt-tRNAs molecules extended beyond the 3' CCA addition for all 22 mt-tRNAs, ascertained by MPAT-Seq, for PDE12+/+ and PDE12−/− cells, and in PDE12−/− cells expressing either wild-type PDE12 or E351A for 24 hr. **p<0.01, ***p<0.001 with Student t-test relative to PDE12+/+. (p values: [+/+] vs. [−/−] p=0.0089, [+/+] vs. [−/− + WT] p=0.83, [+/+] vs [−/− + E351A] p=2.14×10⁻⁷). (E) Aminoacylation assay for subset of mt-tRNAs for PDE12+/+ and PDE12−/−. Profiles of aminoacylated mt-tRNAs were determined using ImageQuant. dAAc indicates intentionally deacylated samples.
-
Figure 4—source data 1
Read count for mitochondrial poly(A) (MPAT) next generation RNA sequencing (MPAT-Seq).
- https://doi.org/10.7554/eLife.27596.009
Figure 4—figure supplement 1
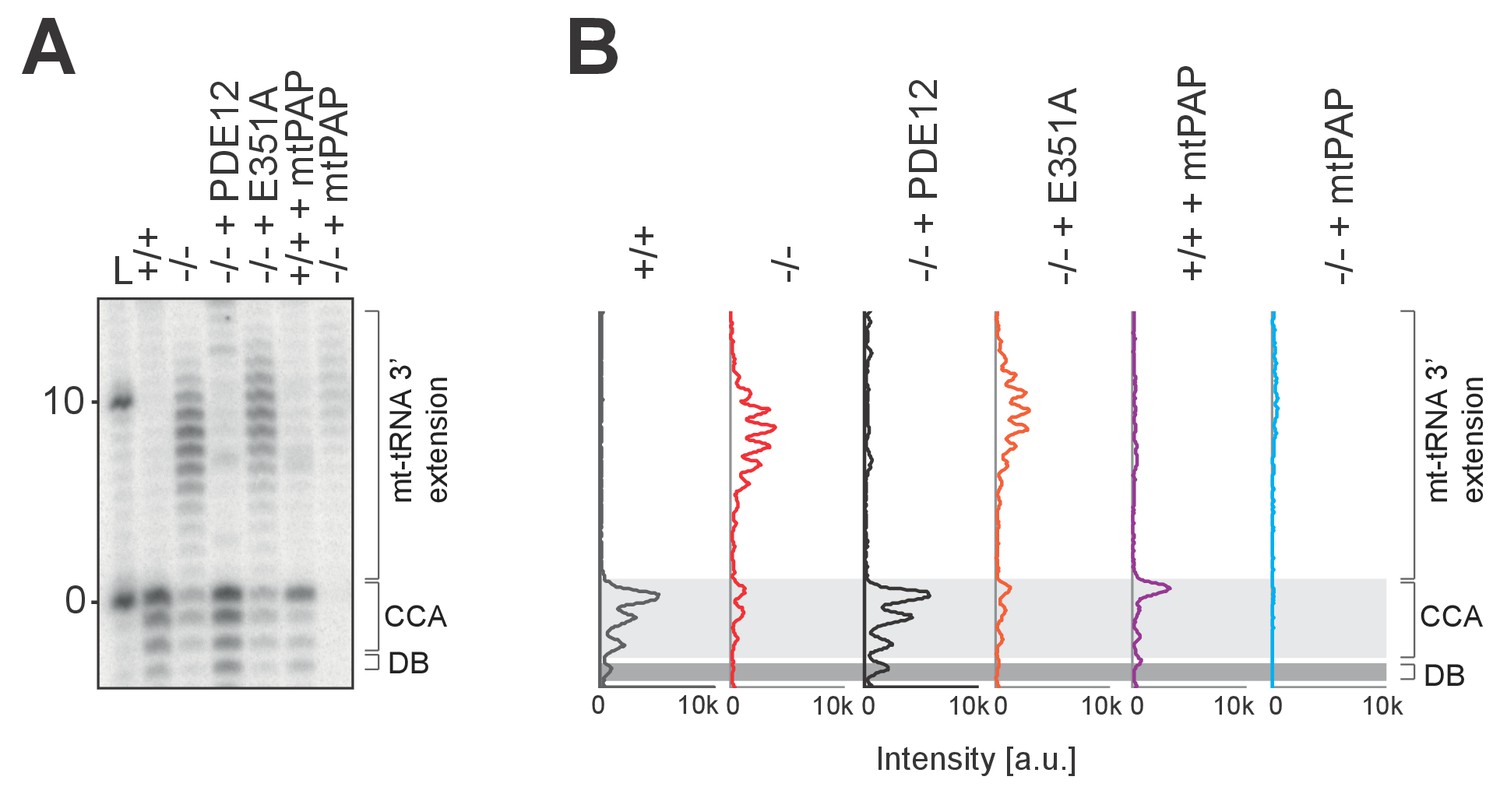
Radioactive MPAT assay for mt-tRNALys.
(A) Radioactive MPAT assay for mt-tRNALys for PDE12+/+, PDE12−/−, PDE12−/− cell lines expressing PDE12 wild-type cDNA or E351A, and PDE12+/+ and PDE12−/− expressing mtPAP. (B) Quantification of MPAT gel profiles shown in (A) using ImageQuant.
Figure 4—figure supplement 2
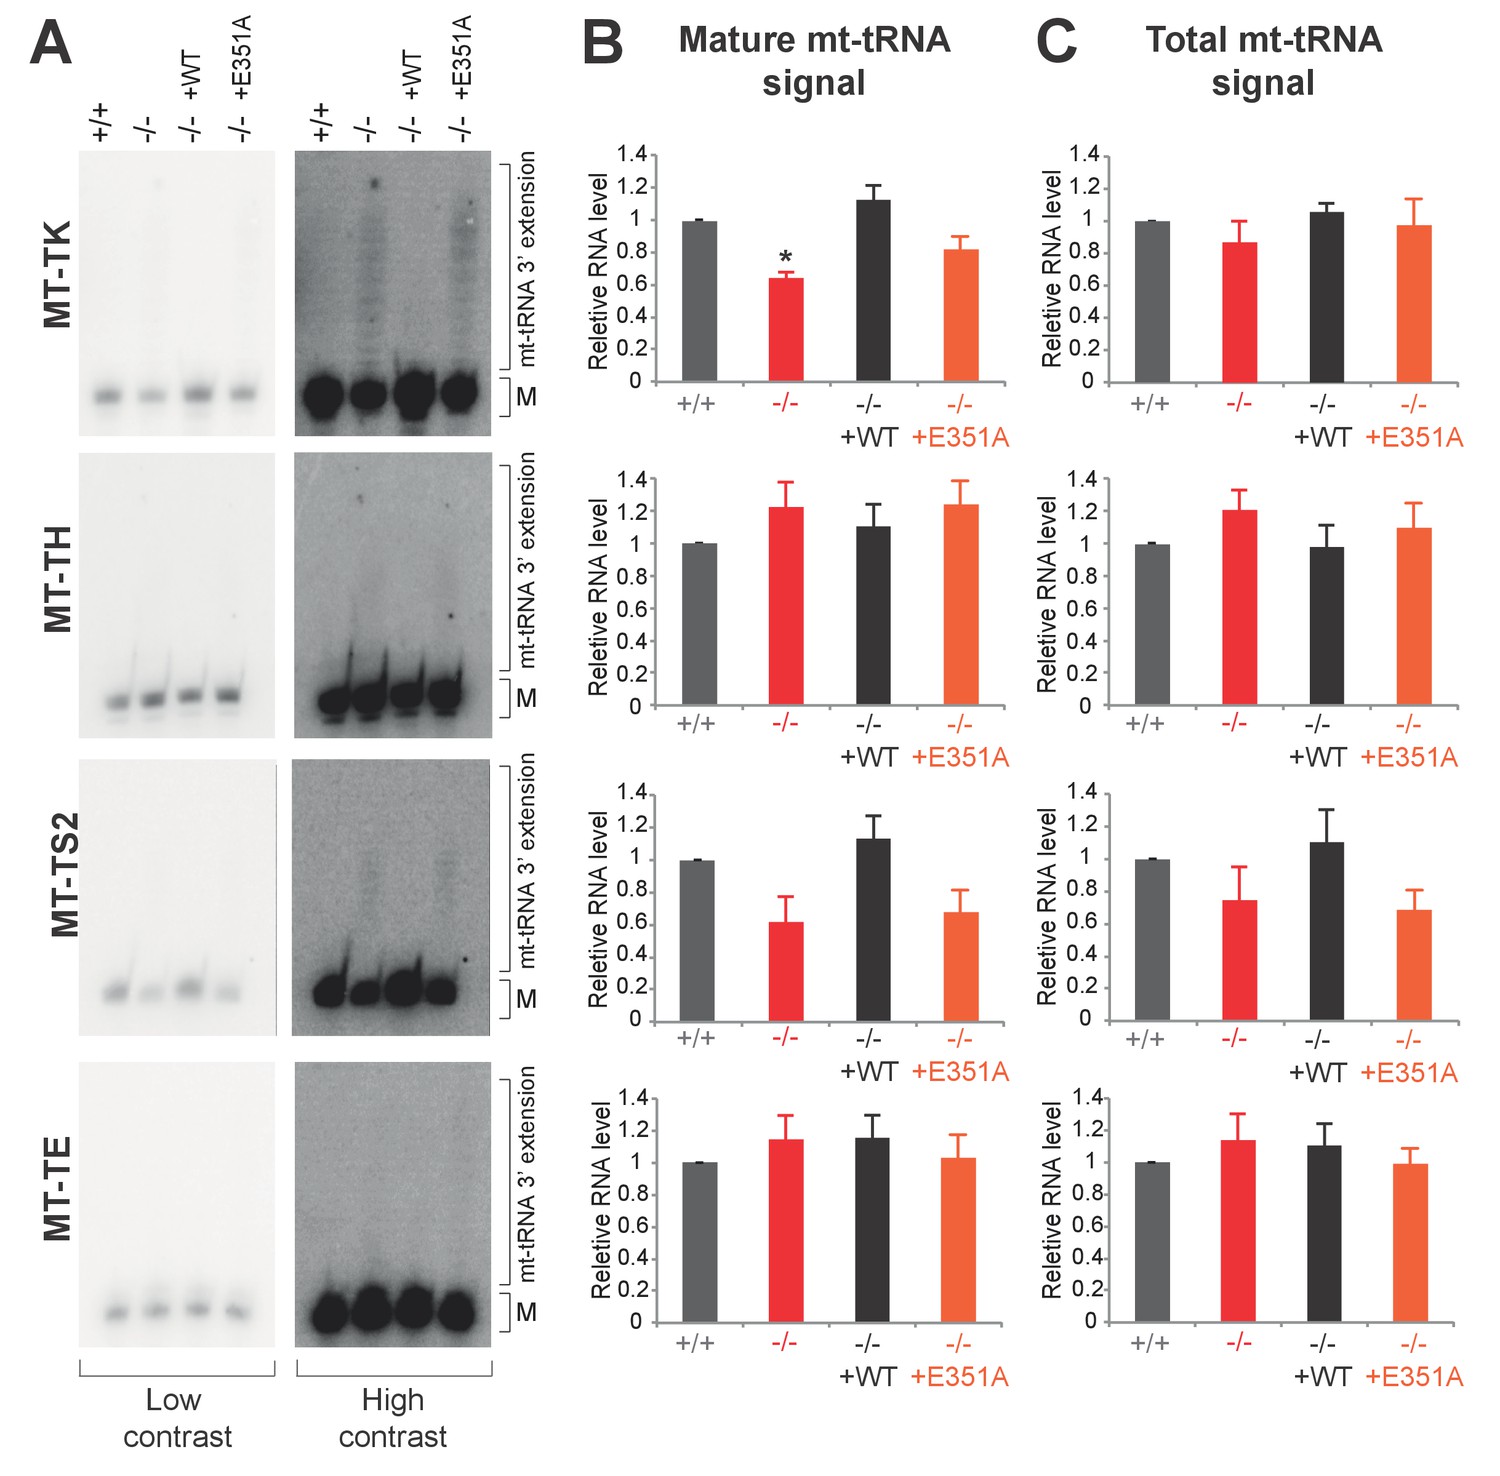
Northern blotting for mt-tRNAs.
(A) High-resolution northern blots for indicated mt-tRNAs for PDE12+/+, PDE12−/−, PDE12−/− cell lines expressing PDE12 wild-type cDNA or E351A. M indicates mature mt-tRNA species. (B) and (C) Quantification of the northern blot signal for mature mt-tRNA (B) and total signal from a given lane (C) using ImageQuant.
Figure 4—figure supplement 3
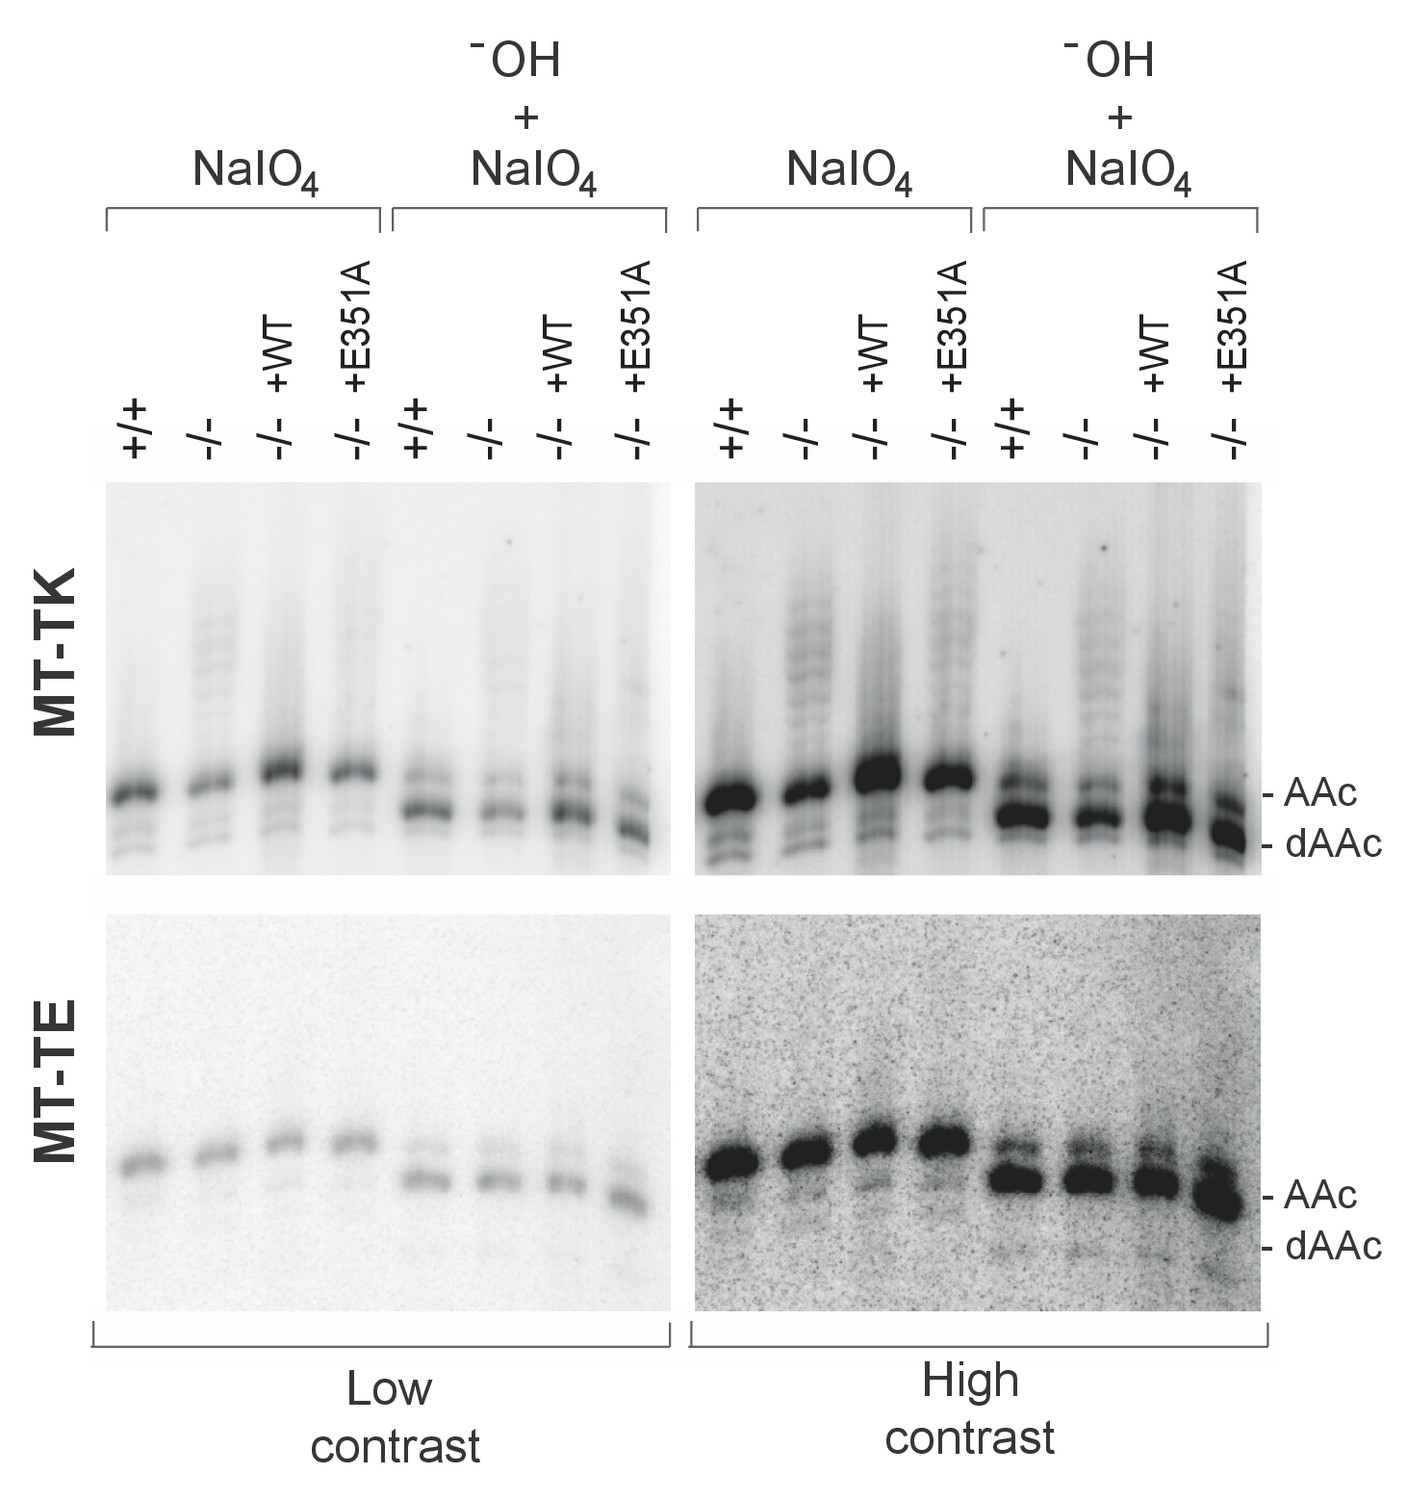
Aminoacylation analysis by sodium periodate oxidation.
High-resolution northern blot analysis of total RNA extracted from PDE12+/+, PDE12−/−, PDE12−/− cell lines expressing PDE12 wild-type cDNA or E351A. Following extraction, RNA samples were either treated with NaIO4 followed by lysine, or intentionally deacylated (-OH) and then treated with NaIO4 followed by lysine. The blots were probed with the mt-tRNA-specific riboprobes as indicated. AAc indicates aminoacylated mt-tRNA, dAAc indicates deacylated mt-tRNA.
Figure 5 with 1 supplement
Spurious adenylation to the 3' terminus of 16S mt-rRNA in the absence of PDE12 does not affect mitochondrial monosome formation.
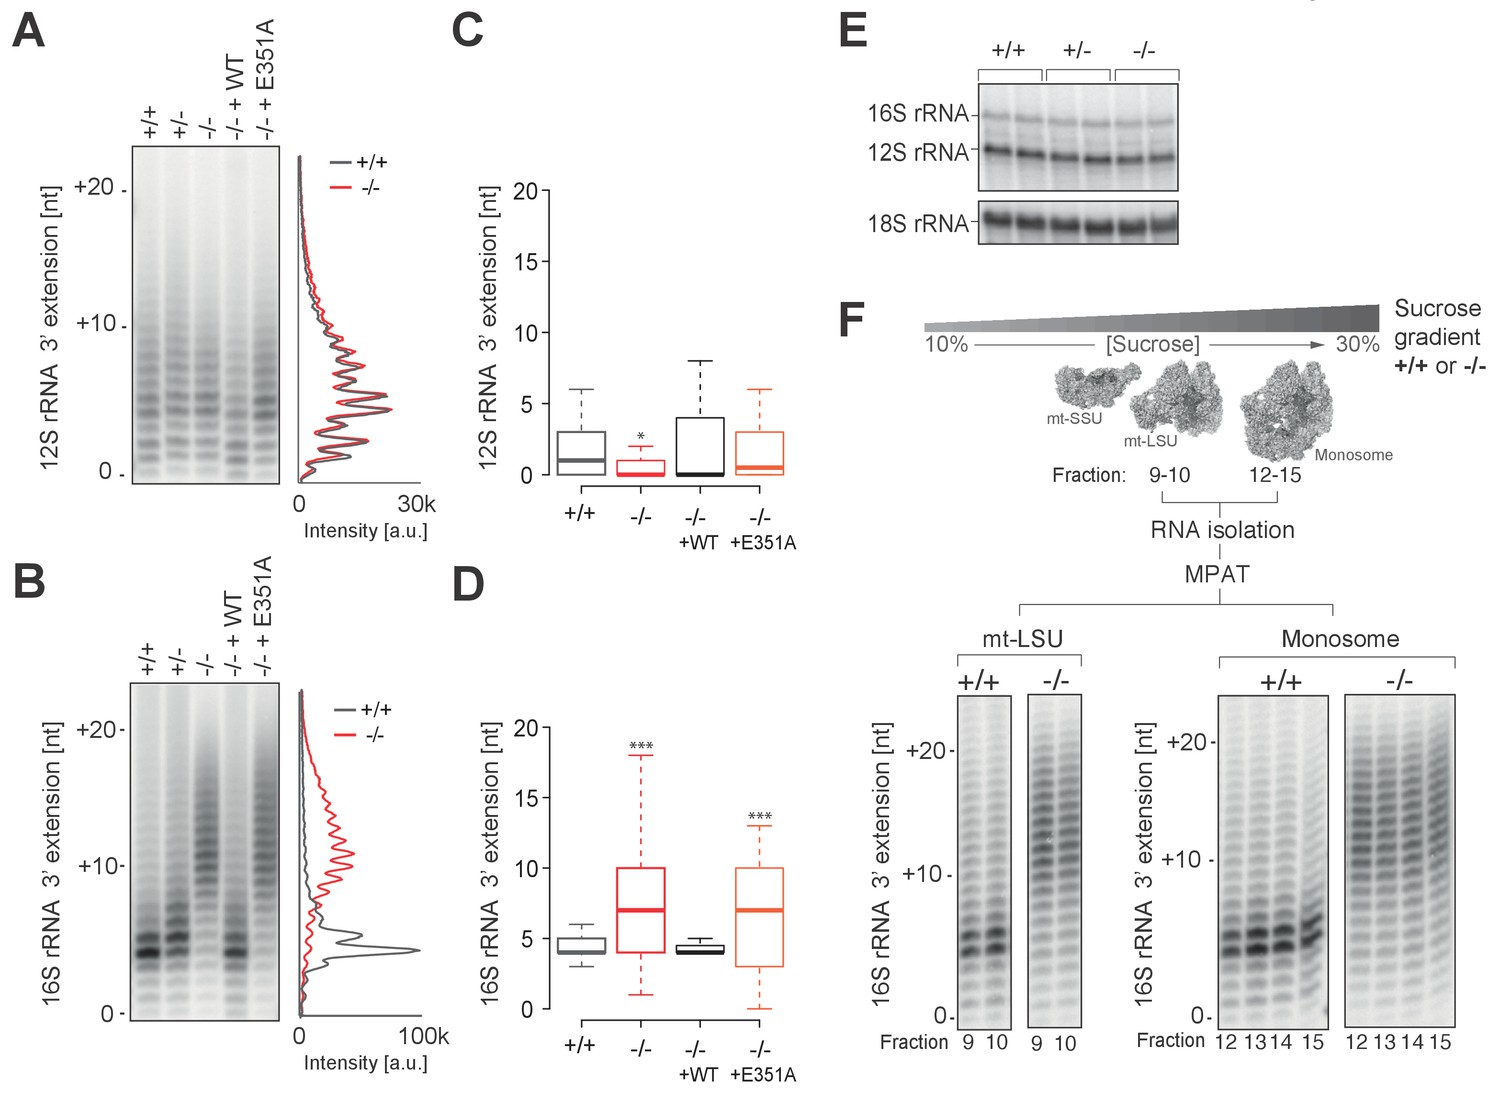
(A and B) Radioactive MPAT assay for 12S (a) and 16S (b) mt-rRNAs extracted from PDE12+/+, PDE12+/− and PDE12−/− cells, and for PDE12−/− cells expressing either wild-type PDE12 or E351A for 24 hr. (C and D) Box-plot representing 3' extensions to 12S (C) and 16S (D) mt-rRNAs via circularisation RT-PCR for PDE12+/+ and PDE12−/− cells, and from PDE12−/− cells expressing either wild-type PDE12 or E351A. *p<0.05, ***p<0.001 with Student t-test relative to PDE12+/+. (p values: 12S: [+/+] vs. [−/−] p=0.013, [+/+] vs. [−/− + WT] p=0.32, [+/+] vs. [−/− + E351A] p=0.84; 16S: [+/+] vs. [−/−] p=4.6×10⁻⁷, [+/+] vs. [−/− + WT] p=0.53, [+/+] vs. [−/− + E351A] p=5.3×10⁻⁴) (E) Steady-state levels of 12S and 16S mt-rRNAs for PDE12+/+, PDE12+/− and PDE12−/− determined via northern blotting. (F) Radioactive MPAT assay for 16S mt-rRNA extracted from sucrose-gradient fractions for free mt-LSU (fractions 9 and 10) and monosome (12-15) for PDE12+/+ and PDE12−/− cells.
Figure 5—figure supplement 1
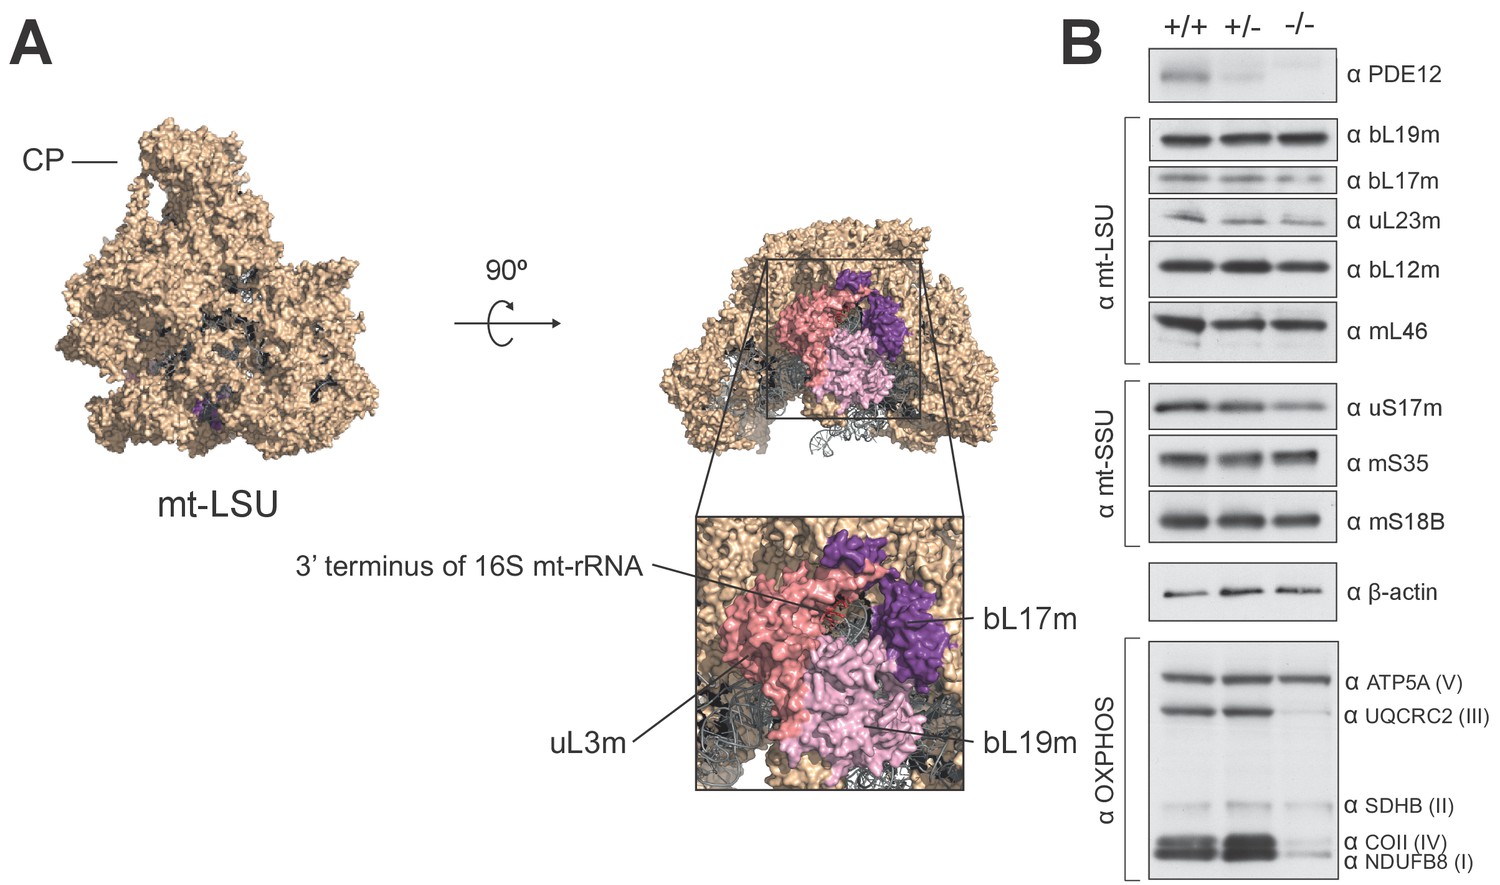
Structural and western blot analysis of mtLSU.
(A) Structure of the human mt-LSU indicating proteins adjacent to the 3’ terminus of 16S mt-rRNA. (B) western blotting of steady-state levels of protein subunits of the human mitoribosome in PDE12+/+, PDE12+/− and PDE12−/− cell lines.
Figure 6 with 1 supplement
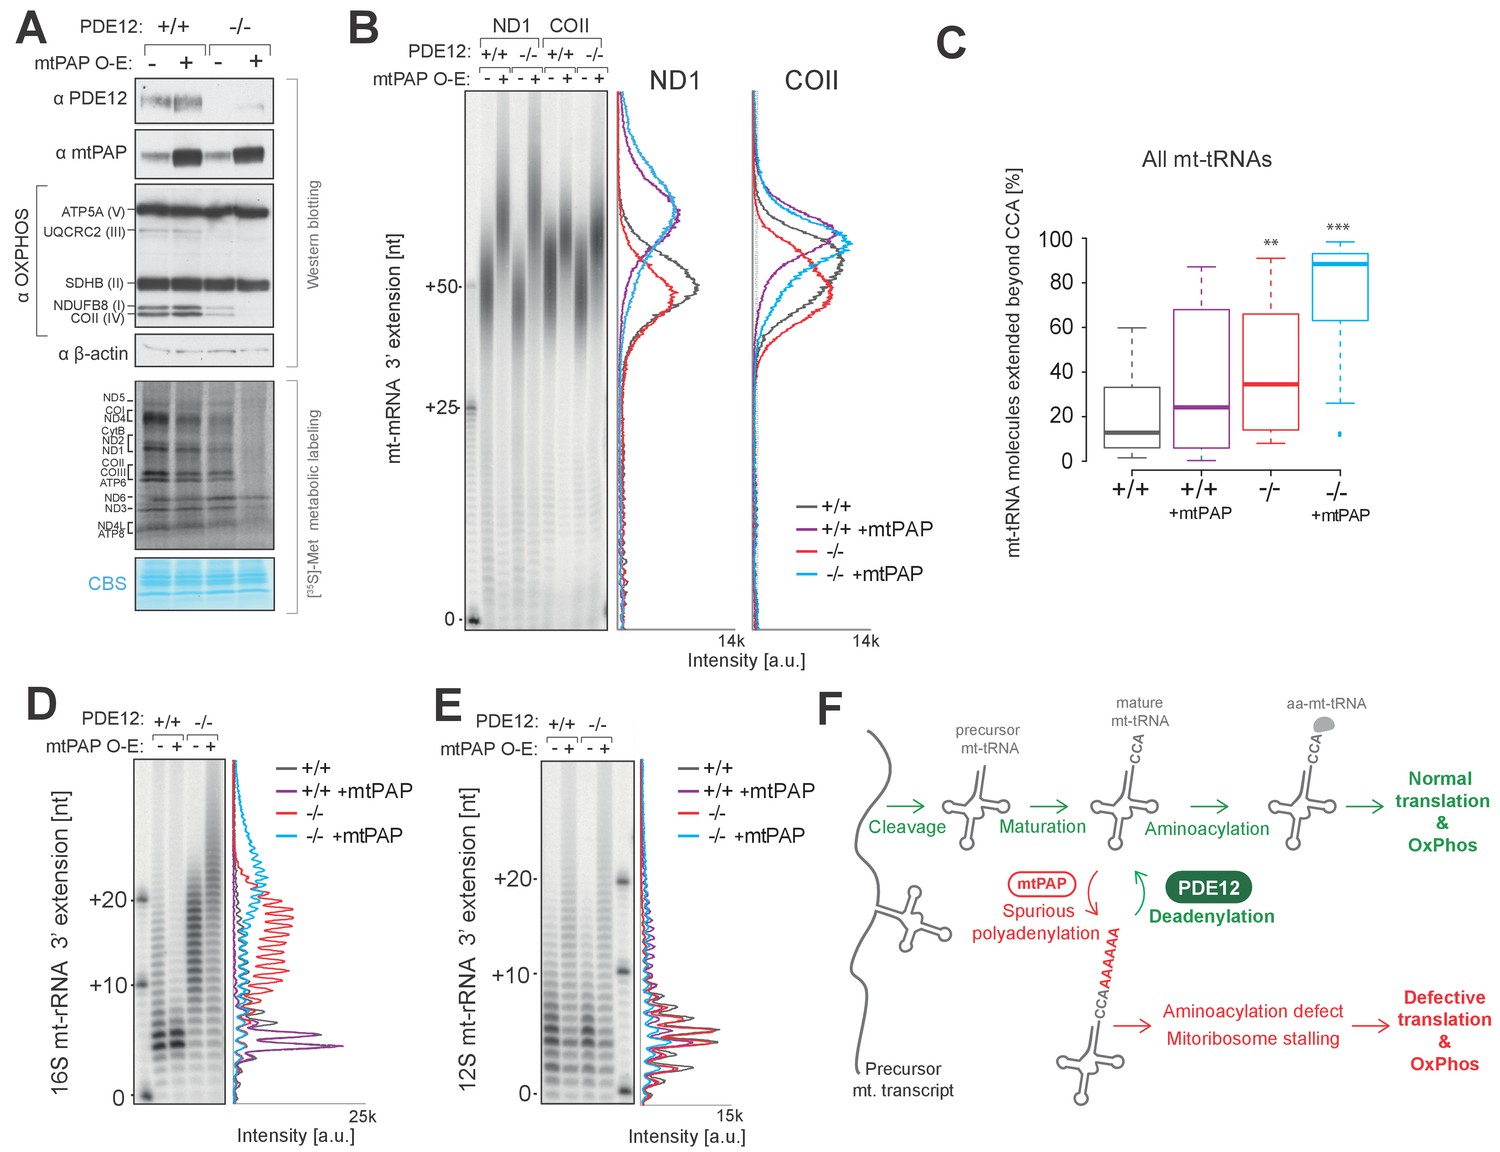
Increased adenylation activity is detrimental to mitochondrial gene expression.
(A) Western blotting for steady-state levels of OxPhos components and mtPAP (top). Mitochondrial translation products were labelled with [35S]-Met in PDE12+/+ and PDE12−/− cells with either endogenous or overexpressed levels of mtPAP (bottom). (B) Radioactive MPAT assay for ND1 and COII extracted from PDE12+/+ and PDE12−/− cells with either endogenous or overexpressed levels of mtPAP. MPAT assay gel profiles were determined using ImageQuant. (C) Box-plot representation of percentage of mt-tRNAs molecules extended beyond the 3' CCA addition for all 22 mt-tRNAs, ascertained by MPAT-Seq, for PDE12+/+ and PDE12−/− cells with either endogenous or overexpressed levels of mtPAP. **p<0.01, ***p<0.001 with Student t-test relative to PDE12+/+. (p values: [+/+] vs. [+/+ + mtPAP] p=0.053, [+/+] vs [−/−] p=0.0089, [+/+] vs [−/− + mtPAP] p=5.52×10⁻¹¹). (D and E) Radioactive MPAT assay for 16S (D) and 12S (E) mt-rRNAs extracted from PDE12+/+ and PDE12−/− cells with either endogenous or overexpressed levels of mtPAP. MPAT assay gel profiles were determined using ImageQuant. (F) Model of PDE12 function. Polycistronic precursor RNA is endonucleolytically processed, liberating the individual mt-tRNA transcripts, which undergo post-transcriptional maturation (nucleotide modifications, CCA addition) before being aminoacylated with a cognate amino acid for use in mitochondrial translation (green). In the case of some mt-tRNAs a spurious poly(A) tail is added by mtPAP, preventing aminoacylation, leading to mitoribosome stalling during mitochondrial translation and to OxPhos defect as a consequence (red). Deadenylation by PDE12 removes spurious polyadenylation on mt-tRNAs restoring the properly matured pool of mt-tRNAs available for aminoacylation (green). Note: The role of PDE12 in the processing of mt-rRNA not included.
Figure 6—figure supplement 1
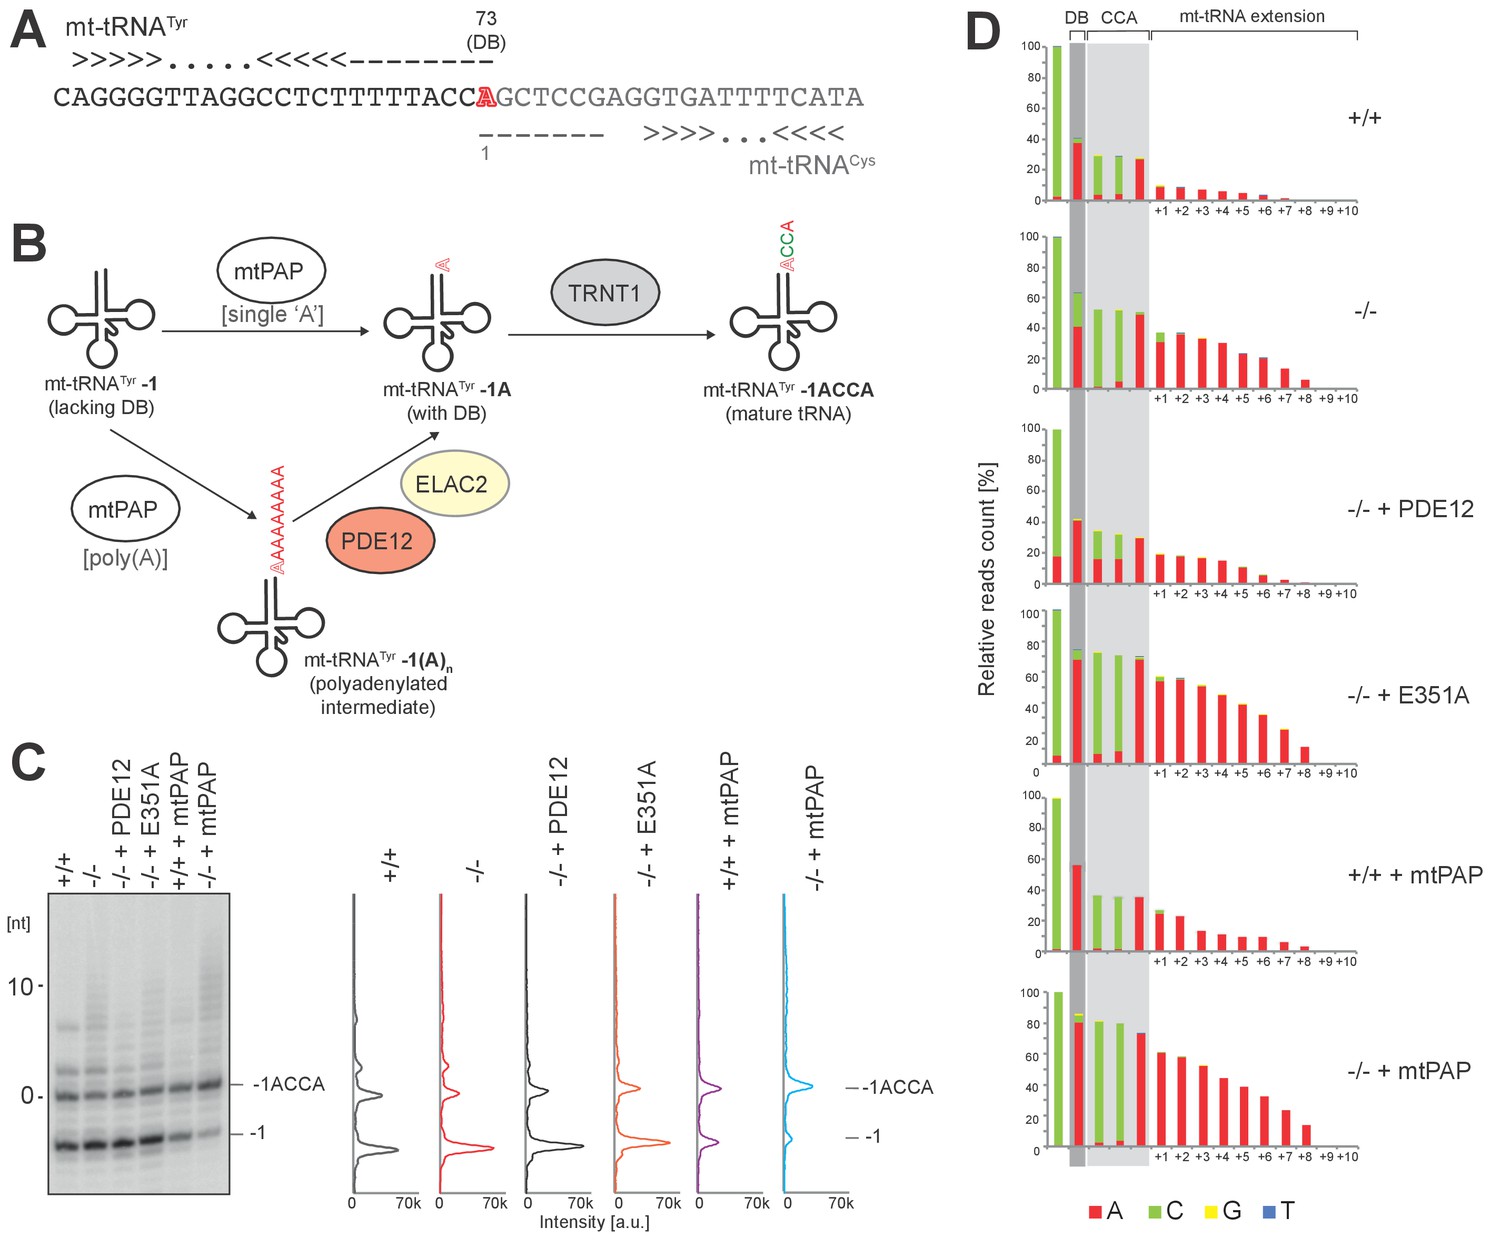
The role of PDE12 in maturation of mt-tRNATyr.
(A) Adjacent organization of mt-tRNATyr and mt-tRNACys genes in human mtDNA indicating overlapping ‘A’ residue (red) required for both transcripts. This residue is required as the discriminator base (DB) in mt-tRNATyr. (B) Schematic based on model proposed by Fiedler et al. (2015) for repair of mt-tRNATyr-1 to provide discriminator base. In vitro data suggested that mtPAP polyadenylation of mt-tRNATyr is required to add the DB and PDE12 is implicated in the exonucleolytic resolution of polyadenylated mt-tRNATyr-1(A)n intermediates to the repaired mt-tRNATyr-1A carrying DB. (C–D) In order to test whether PDE12 participates in the biogenesis of mt-tRNATyr in living cells, we have analysed the 3’ ends of this tRNA using the radioactive MPAT and MPAT-Seq assays in six conditions: control HEK293 cells, PDE12−/− cells, PDE12−/− cells complemented with wild-type PDE12 cDNA, PDE12−/− cells complemented with the catalytic mutant E351A, control HEK293 cells overexpressing mtPAP and PDE12−/− cells overexpressing mtPAP. Radioactive MPAT revealed that in control HEK293 cells a large proportion of mt-tRNATyr molecules resolve at −1 nt compared to the 3’ end processing site, the direct product released from the 5’ cleavage of mt-tRNACys by RNase P, consistent with the lack of both the DB and CCA in mt-tRNATyr ((C) - ‘mt-tRNATyr−1’). This confirms that cleavage of mt-tRNATyr- mt-tRNACys is likely to occur such that it leaves the overlapping nucleotide on mt-tRNACys in a large proportion of the molecules.
The ratio of mt-tRNATyr lacking DB compared to mature mt-tRNATyr carrying CCA ((C) - ‘mt-tRNATyr−1ACCA’) is not changed upon ablation of PDE12 (C). The analysis of the MPAT-Seq 3’ data revealed a drop in read count corresponding to DB in each condition tested, further supporting the presence of a substantial pool of mt-tRNATyr-1, which lacks the DB (D). However, the proportion of mature mt-tRNATyr-1ACCA compared to that lacking the DB (mt-tRNATyr−1) appeared to be increased when mtPAP is overexpressed. This is consistent with the notion that mtPAP is involved in the process of adding the DB, as suggested by Fiedler et al. (2015). In all conditions, there is no evidence to suggest accumulation of mt-tRNATyr species with just the DB added ((C) and (D), ‘mt-tRNATyr-1A’), suggesting that when the single ‘A’ DB is incorporated, the CCA extension is rapidly synthetized.
The proportion of ‘A’ incorporated at the ‘CC’ positions of the CCA extension in MPAT-Seq would be indicative of the proportion of mt-tRNATyr-1 molecules which carry oligoadenylate extensions (‘mt-tRNATyr−1 A(n)”). However, no increase in the proportion of ‘A’ at these positions in the absence of PDE12 was observed, suggesting that mt-tRNATyr-1 A(n) is not accumulating in PDE12−/− cells (D). In the absence of PDE12, mt-tRNATyr is polyadenylated, but only beyond the CCA according to MPAT-Seq (D), suggesting that while ablation of PDE12 does not appear to participate in DB incorporation, it does lead to accumulation of spurious adenylation beyond the CCA extensions as seen with other mt-tRNAs (Figure 4). Together, our findings would support the role of mtPAP in providing the DB to the mt- tRNATyr-1 repair substrate, as proposed by (Fiedler et al., 2015), but that PDE12 is not absolutely required for the trimming of the poly(A) tail to provide the single A residue for the DB. It is possible therefore that either mtPAP only incorporates a single A residue before the CCA adding enzyme acts to add the CCA extension to complete maturation of mt-tRNATyr, or that other factors, for example ELAC2 proposed by (Fiedler et al., 2015), act to remove the poly(A) tail added by mtPAP to the mt-tRNATyr-1 precursor.
Additional files
-
Supplementary file 1
Distribution of non-encoded extensions on the mature 3’ terminus of mt-rRNA in control cells (+/+), PDE12−/− cells, and PDE12−/− cells expressing either wild-type PDE12 or PDE12 E351A mutant determined by cRT-PCR.
- https://doi.org/10.7554/eLife.27596.017
-
Supplementary file 2
Antibodies and vectors.
- https://doi.org/10.7554/eLife.27596.018
-
Supplementary file 3
Oligonucleotide sequences.
Sequences of DNA oligonucleotides for use in radioactive MPAT assay
- https://doi.org/10.7554/eLife.27596.019
Download links
A two-part list of links to download the article, or parts of the article, in various formats.
Downloads (link to download the article as PDF)
Open citations (links to open the citations from this article in various online reference manager services)
Cite this article (links to download the citations from this article in formats compatible with various reference manager tools)
Maturation of selected human mitochondrial tRNAs requires deadenylation
eLife 6:e27596.
https://doi.org/10.7554/eLife.27596


