Macrophage dysfunction initiates colitis during weaning of infant mice lacking the interleukin-10 receptor
- Boston Children's Hospital, United States
- Harvard Medical School, United States
- Massachusetts Institute of Technology, United States
- Brigham and Women's Hospital, United States
- Edmond and Lily Safra Children’s Hospital, Sheba Medical Center, Israel
- Tel Aviv University, Israel
- University of Manchester, United Kingdom
- Hannover Medical School, Germany
- Brigham and Women’s Hospital, United States
Figures
Figure 1 with 1 supplement
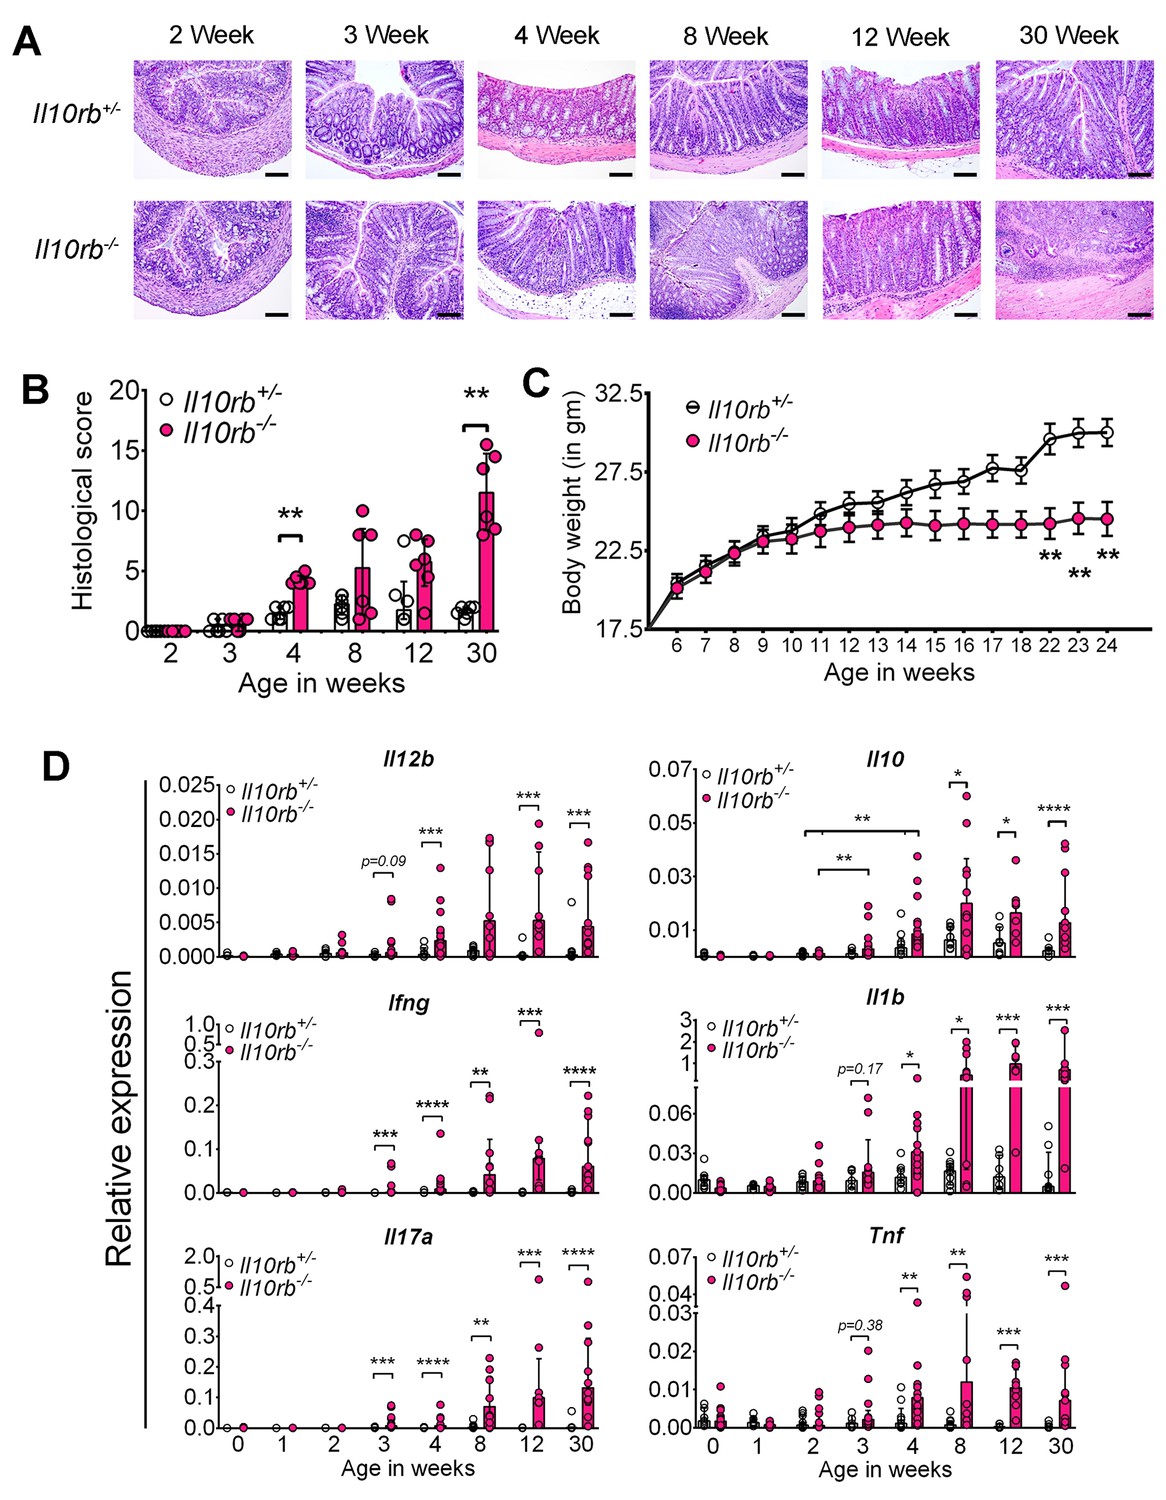
Spontaneous colitis develops in Il10rb-/- mice between 3–4 weeks.
(A) Representative histologic images of distal colon from Il10rb-/- and control mice at indicated age (10X magnification for 8 week and 30 week Il10rb-/-, scale = 200 μm; and 20X for all other samples, scale = 100 μm). (B) Histologic scores (0–24) from Il10rb-/- and control mice at indicated age (n = 6 mice/group). Median with interquartile range (IQR) is shown. Significance determined by Mann-Whitney test. (C) Body weight in a cohort of mice from 6 to 24 weeks (n = 10–12). Mean ± SEM of data analyzed by 2-way ANOVA followed by Bonferroni’s Multiple Comparison tests is shown; (D) Colonic gene expression assessed by qRT-PCR (n = 5–15 mice in each group). Median with IQR is shown. Significance determined by Mann-Whitney test. *p<0.05, **p<0.01, ***p<0.001, ****p<0.0001. Additional data file (Figure 1—figure supplement 1) showing severe colitis in 6 month old Il10rb-/- mice is provided.
Figure 1—figure supplement 1
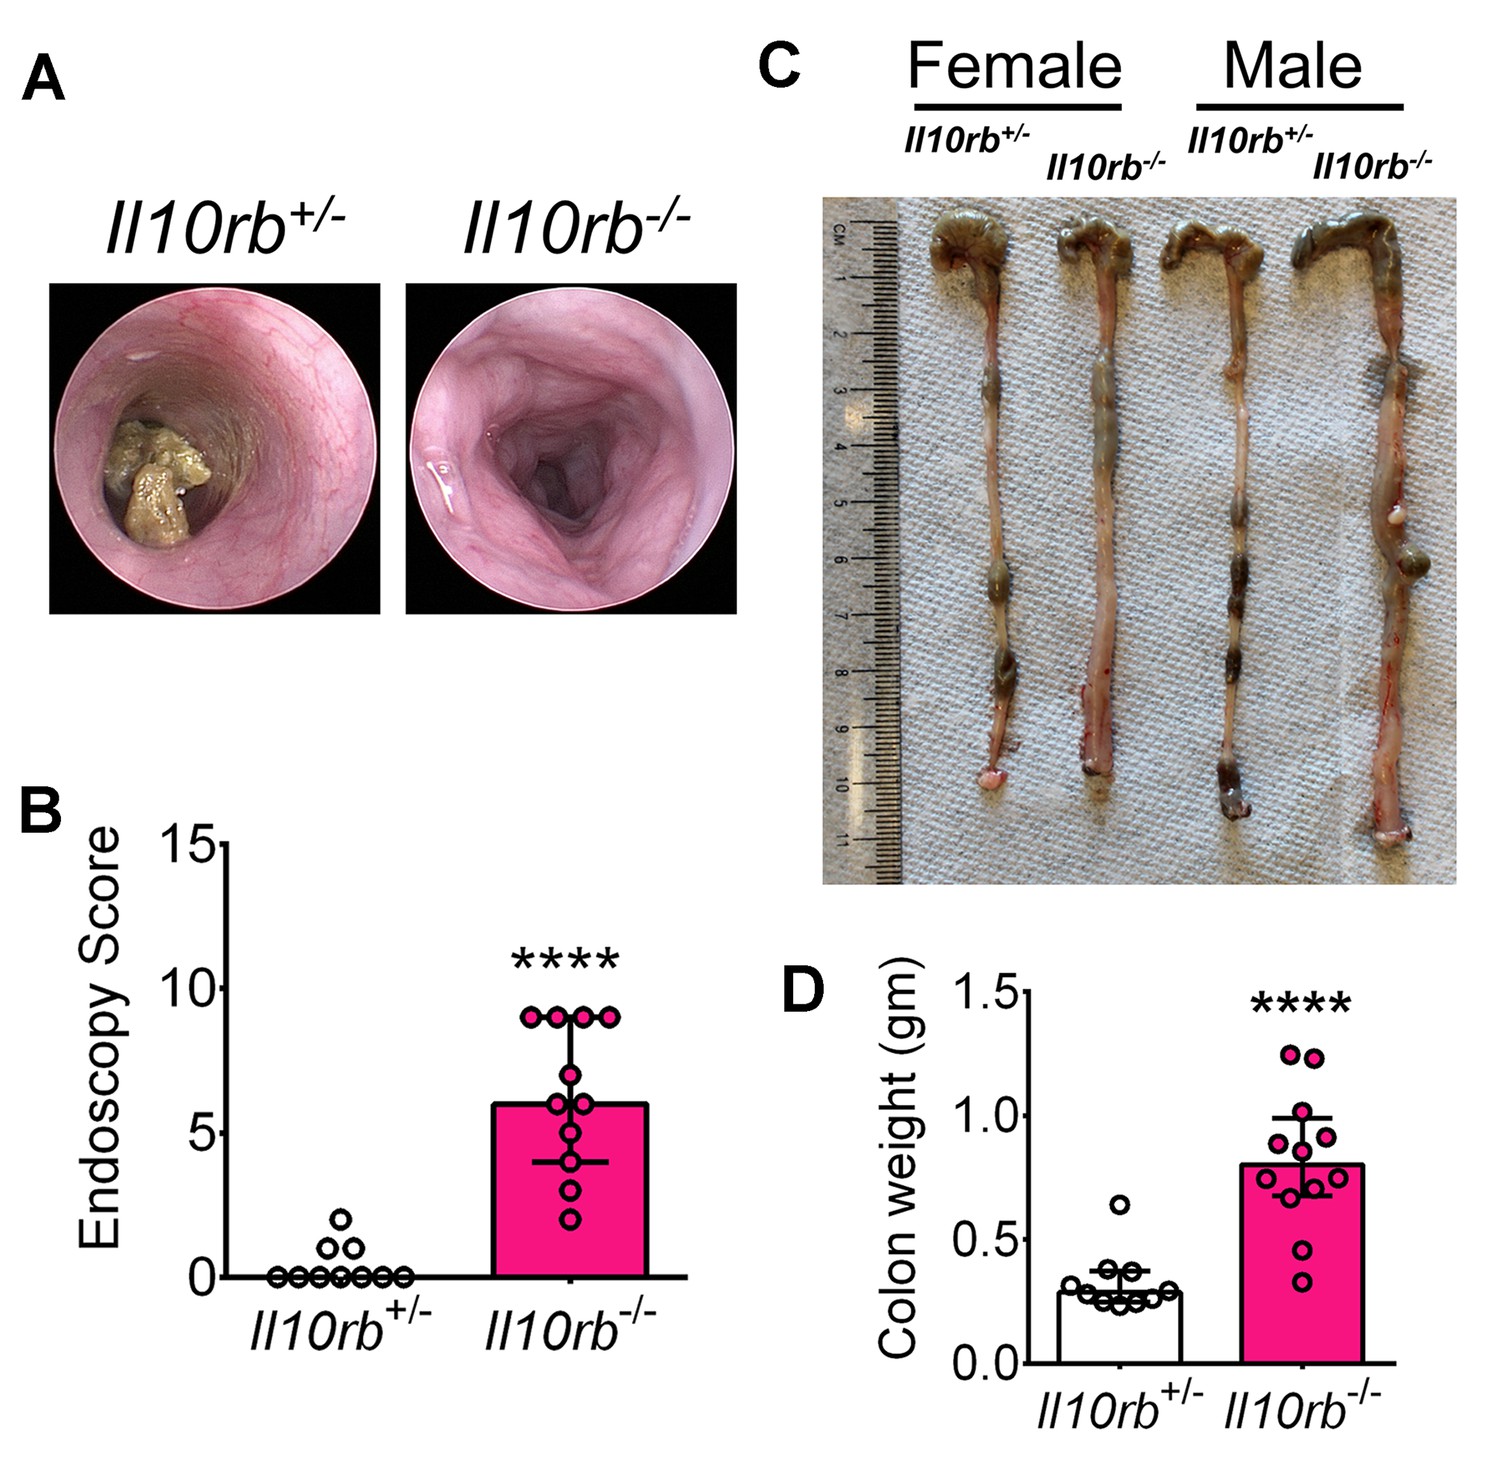
Severe colitis in 6 month old Il10rb-/- mice.
(A) Representative endoscopic images, (B) Endoscopy score, n = 10–12; (C) Representative gross colon images, and (D) Colon tissue weights without fecal contents at 6 months (30 weeks). Each data point represents one animal. ****p<0.0001, Mann-Whitney U test. Data shows Median with IQR.
Figure 2 with 2 supplements
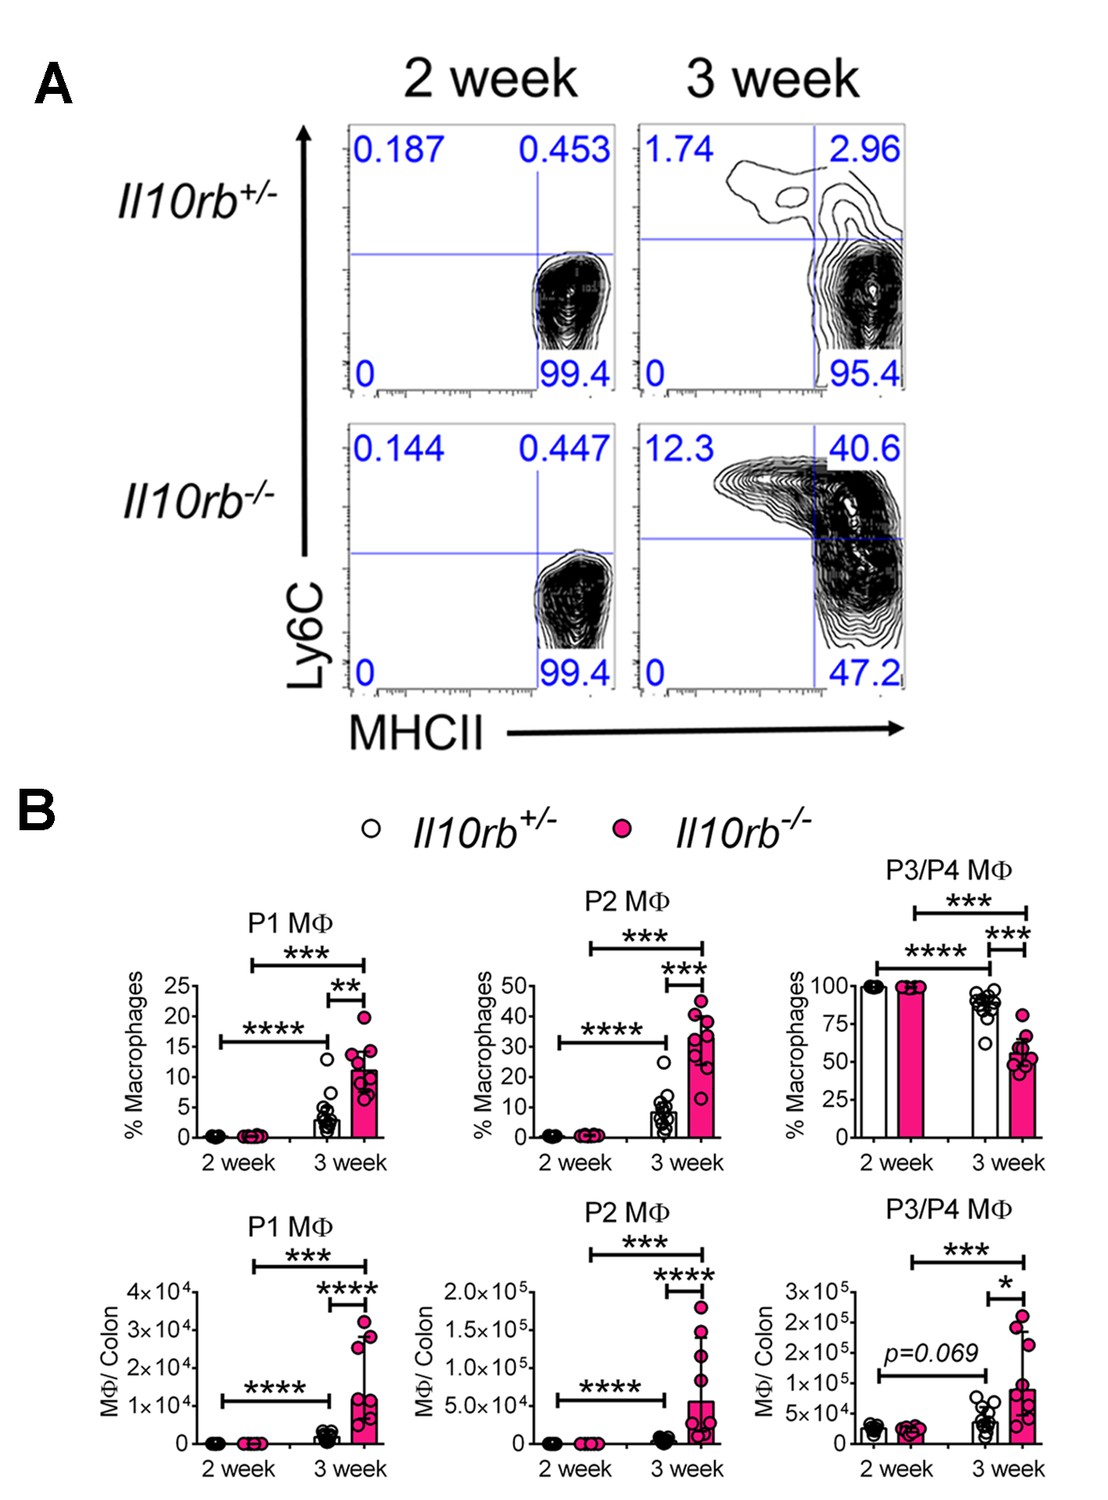
Colonic lamina propria macrophage dysfunction in 3–4 week old Il10rb-/- mice.
Representative FACS plots of (A) MΦ subsets, gated on CD45+CD11b+ CD11cintCD103-CD64+ cells in the LP of Il10rb-/- and littermate Il10rb+/- mice at 2 and 3–4 weeks. Gating strategy is shown in the accompanying Figure 2—figure supplement 1. Comparison of the frequencies and absolute numbers per colon of (B) LP MΦ subsets is shown for Il10rb-/- vs control Il10rb+/- mice at 2 and 3–4 weeks of age. Results are pooled from 2 to 3 litters leading to 7–11 mice in each group. *p<0.05, **p<0.01, ***p<0.001, ****p<0.0001, Mann-Whitney U test. Data represents Median with IQR. Additional data file (Figure 2—figure supplement 2) showing minimal alterations in colonic lymphocytes and dendritic cells in 3–4 week old Il10rb-/- mice is provided.
Figure 2—figure supplement 1
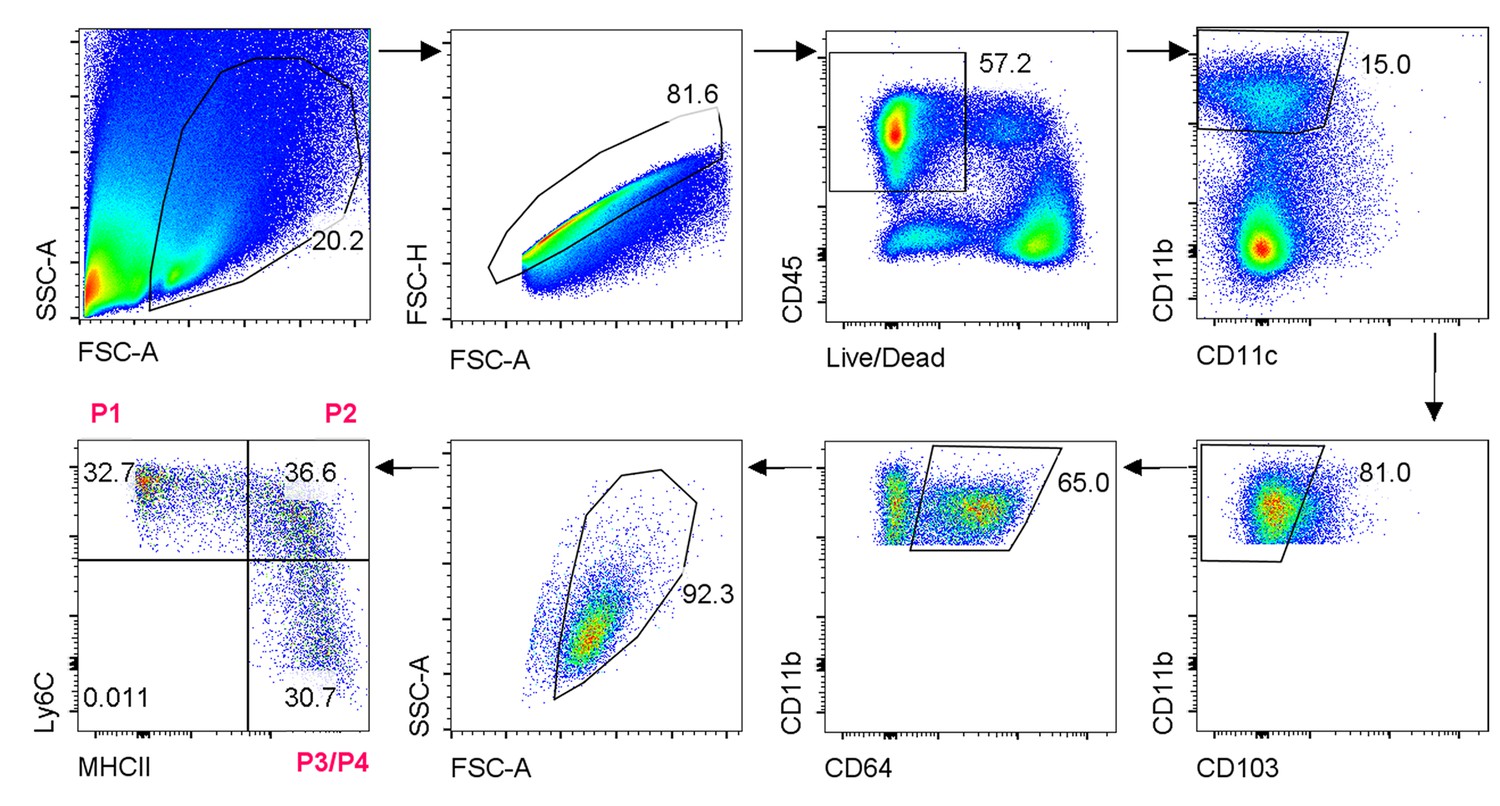
Gating strategy for colonic lamina propria macrophages.
https://doi.org/10.7554/eLife.27652.006
Figure 2—figure supplement 2
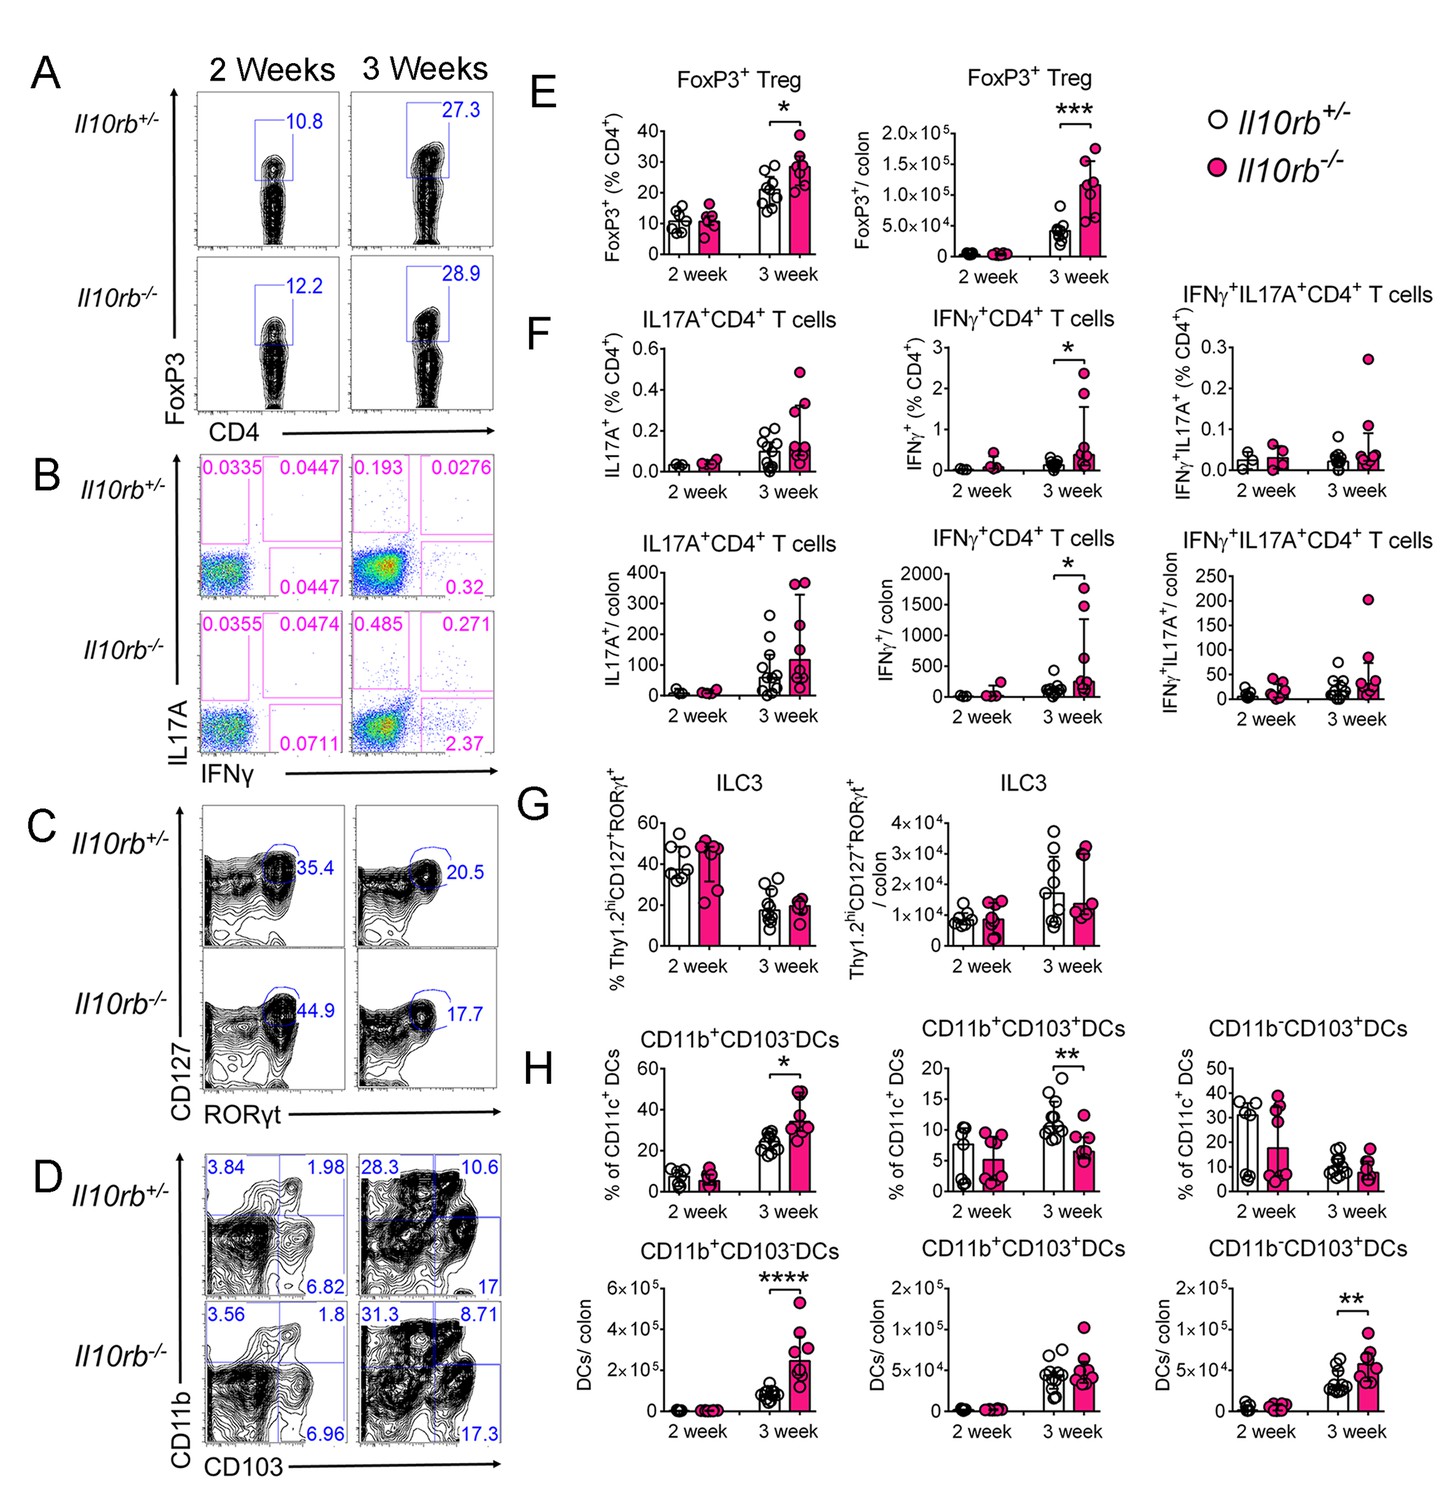
Minimal alterations in colonic lymphocytes and dendritic cells occur in the absence of IL10Rβ signaling in 3–4 week old mice.
Representative FACS plots of (A) FoxP3+ Tregs, gated on CD45+CD3e+CD4+ T cells, (B) CD4+ Th effectors following PMA and ionomycin stimulation for 4.5 hr, gated on CD45+CD3e+CD4+ T cells, (C) Type three innate lymphoid cells (ILC3), gated on CD3e-CD45loThy1.2hi cells, and (D) DCs, gated on CD45+CD11c+ cells in the LP of 2 and 3–4 week old Il10rb-/- and littermate Il10rb+/- controls. Comparison of the frequencies and absolute numbers per colon of (E) FoxP3+ Tregs, (F) CD4+ Th effectors, (G) ILC3s, and (H) DCs is shown for Il10rb-/- vs control Il10rb+/- mice at 2 and 3–4 weeks of age. Results are pooled from 2 to 3 litters leading to 7–11 mice in each group. *p<0.05, **p<0.01, ***p<0.001, ****p<0.0001, Mann-Whitney U test. Data represents Median with IQR.
Figure 3
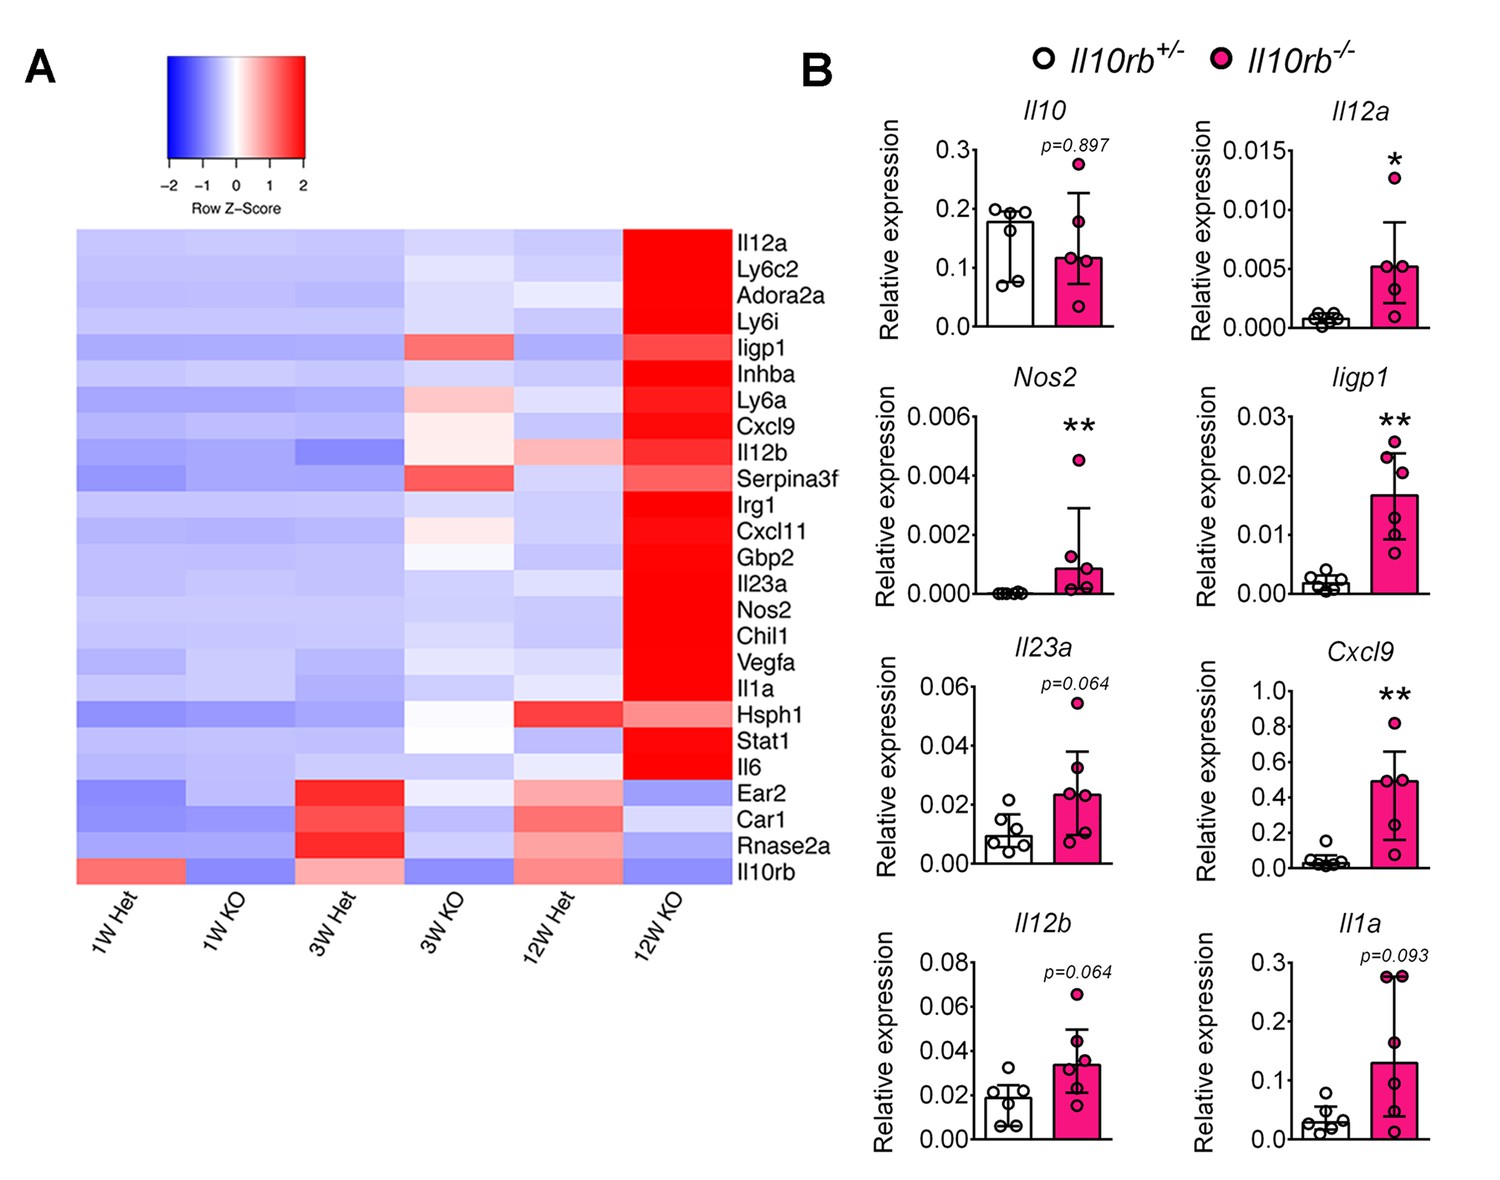
Lamina propria macrophages of infant Il10rb-/- mice exhibit proinflammatory transcriptional profile.
Colonic LP MΦs (P3/P4; gated on CD45+CD11b+CD11cint CD103-CD64+Ly6C-MHCII+ cells) were sorted (minimum 10,000 cells), RNA was prepared, and RNA-seq was performed. (A) Heatmap showing relative expression intensity of >3 fold differentially expressed genes in the LP MΦs between Il10rb-/- (KO) and Il10rb+/- (Het) mice. Genes were identified based on the differential expression in LP MΦs between 3 week old Il10rb-/- and control mice. Each sorting time-point represents one mouse at 3 and 12 weeks, whereas pooled colons from 4 to 5 mice for 1 week data points were used. (B) Validation of RNA-seq data by qRT-PCR for selected genes and Il10 from LP P3/P4 MΦs sorted from Il10rb-/- and littermate Il10rb+/- mice at 3–4 weeks of age. *p<0.05, **p<0.01, n = 6 mice in each group. Median with IQR is shown. Additional data files showing codes used for ‘R’ scripts (Figure 3—source data 1 and Figure 3—source data 2), and the normalized gene expression values for Figure 3A (Figure 3—source data 3) are provided.
-
Figure 3—source data 1
R-script used to generate differential gene expression data shown in Figure 3A.
- https://doi.org/10.7554/eLife.27652.009
-
Figure 3—source data 2
R-script used to generate heat map shown in Figure 3A.
- https://doi.org/10.7554/eLife.27652.010
-
Figure 3—source data 3
Normalized gene expression values used to construct heat map shown in Figure 3A.
- https://doi.org/10.7554/eLife.27652.011
Figure 4
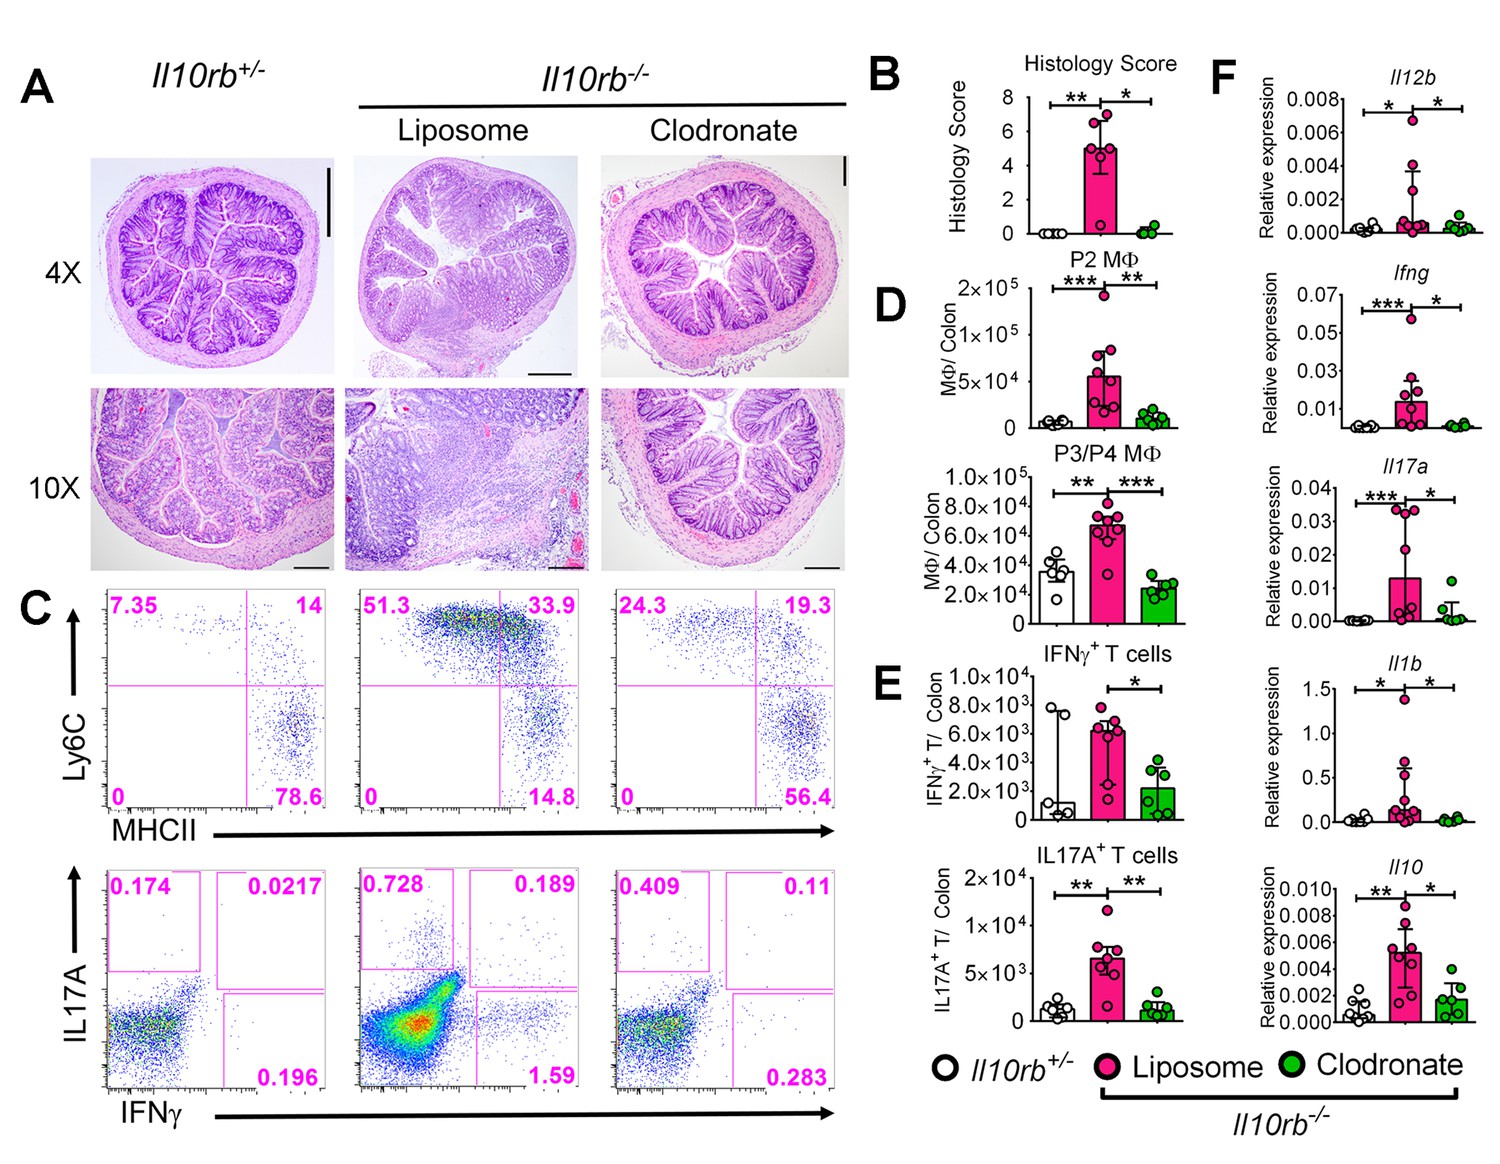
Liposomal clodronate-mediated depletion of colonic macrophages ameliorates colitis in infant Il10rb-/- mice.
Three week old Il10rb-/- mice were injected intraperitoneally (i.p.) with liposomal control or liposomal-clodronate for three times within a week. (A) Representative histologic images of distal colons (4X and 10X magnification). Scale = 500 μm (4X) and 200 μm (10X). (B) Histological scores from 4 to 6 mice in each group. (C) Representative FACS plots of colonic LP MΦ subsets (upper panel) gated on CD45+CD11b+CD11cintCD103-CD64+ cells, and (lower panel) CD4+ T effector subsets following PMA and ionomycin stimulation for 4.5 hr, gated on CD45+CD3e+CD4+ T cells. Comparison of the total numbers per colon of (D) LP MΦs, and (E) CD4+ T effector cells. (F) Gene expression analysis by qRT-PCR from the colons of mice indicated above. *p<0.05, **p<0.01, ***p<0.001, Mann-Whitney U test. Data shows Median with IQR of 2 pooled experiments leading to 4–8 mice in each group.
Figure 5

IL10Rα is necessary to prevent intestinal inflammation in infant mice.
Il10ra-/- mice (C57BL/6) were crossed with congenic Cdcs1 mice and the development of spontaneous colitis was investigated. (A) Representative histologic images from the colon of Cdcs1+/+Il10ra-/- and littermate Cdcs1+/+Il10ra+/- control mice at indicated ages (bar represents 100 μm for 2 weeks and 200 μm for 3 weeks). (B) Histologic scores from indicated mice; (C) Representative FACS plots of colonic LP MΦ populations, gated on CD45+ CD11b+CD11cintCD103-CD64+ cells. (D) Comparison of the frequencies and numbers of LP MΦ subsets in the colons of mice described. (E) Summary of gene expression analysis by qRT-PCR from the colons of mice indicated above. *p<0.05, **p<0.01, ***p<0.001, Mann-Whitney U test, Median with IQR is shown. Data were pooled from 2 to 3 litters resulting in a total of 4–11 mice in each group.
Figure 6 with 1 supplement
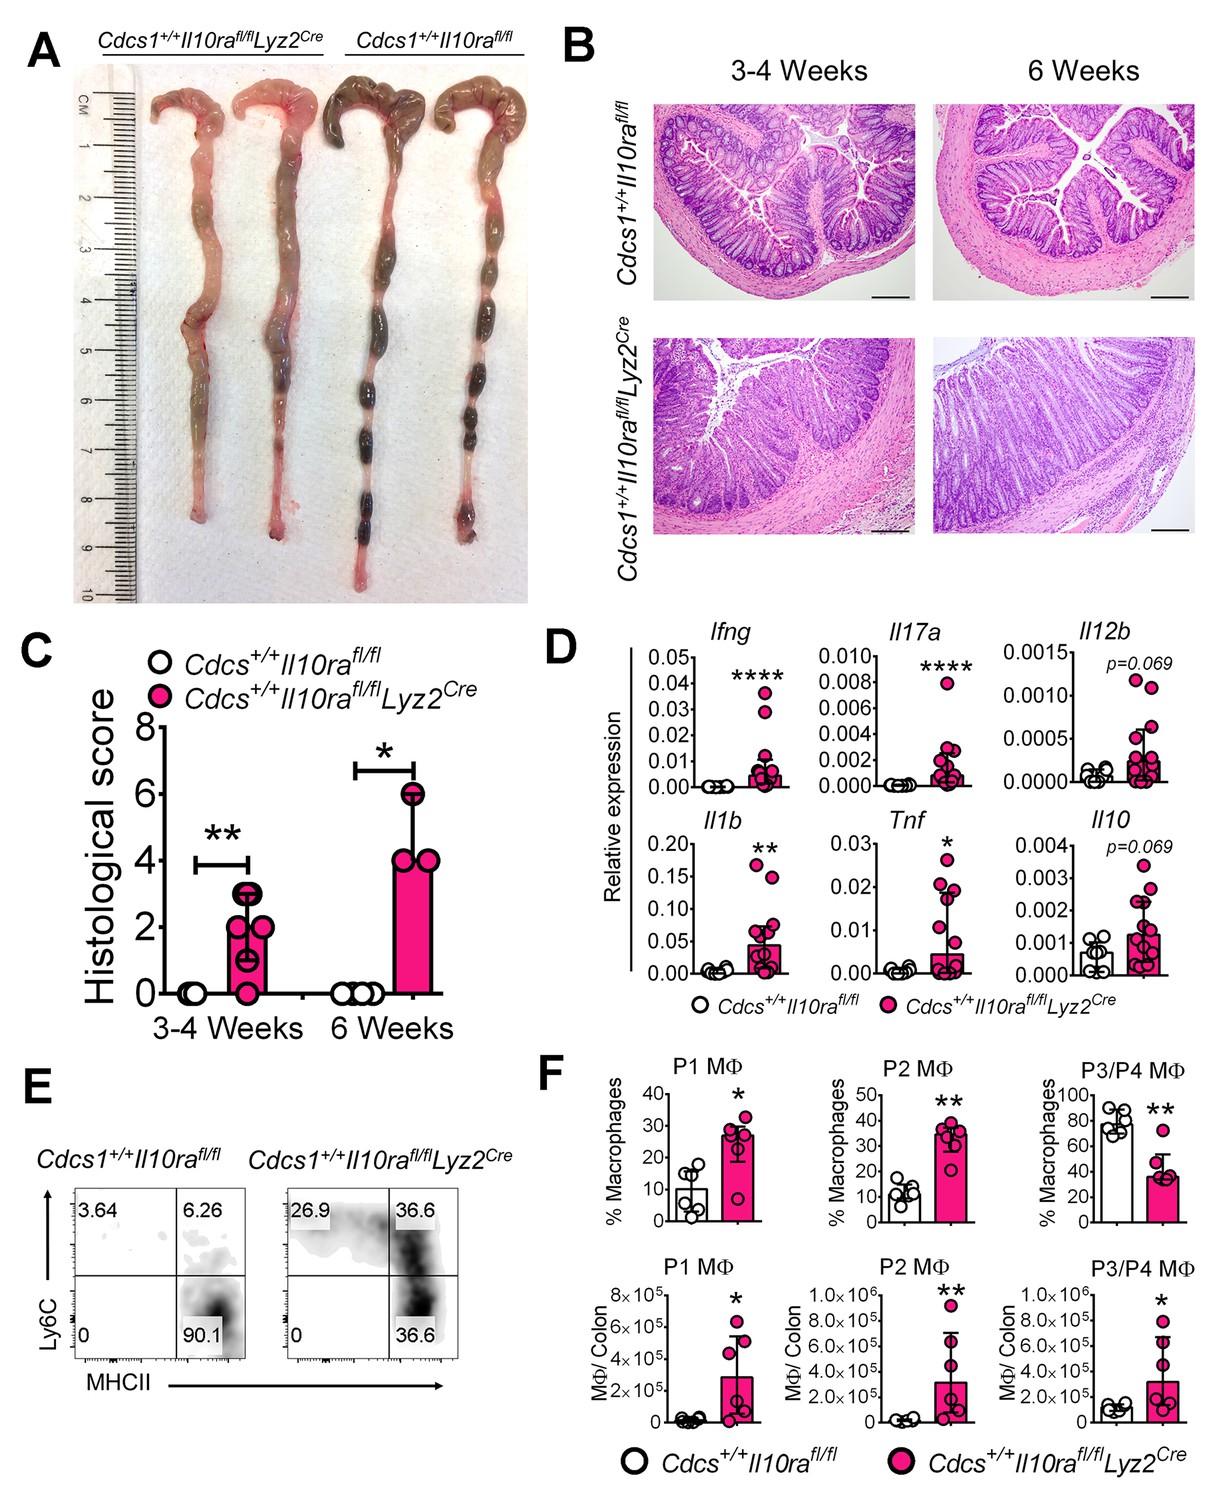
Macrophage-specific IL10Rα is necessary to prevent intestinal inflammation in infant mice.
(A) Representative gross macroscopic images of colon from 6 week old mice. (B) Representative histologic images of distal colons of Cdcs1+/+Il10rafl/flLyz2Cre and littermate Cdcs1+/+Il10rafl/fl control mice (bar = 200 μm). (C) Histologic scores from indicated mice. (D) Colonic gene expression analysis by qRT-PCR. (E) Representative FACS plots; and (F) frequencies and numbers of colonic LP MΦ populations in the colons of 3–4 week old mice. *p<0.05, **p<0.01, ****p<0.0001, Mann-Whitney U test, Median with IQR is shown. Each data point indicates individual mouse, data were pooled from 2 to 3 litters resulting in a total of 4–12 mice in each group; whereas a representative of 2 litters is shown for 6 week old mice in A-C. Additional data file (Figure 6—figure supplement 1) showing the frequency and numbers of colonic CD4+ lymphocytes in 3–4 week old Cdcs1+/+Il10rafl/fl Lyz2Cre and littermate Cdcs1+/+Il10rafl/fl mice is provided.
Figure 6—figure supplement 1

Immunophenotyping of 3–4 week old Cdcs1+/+Il10rafl/fl Lyz2Cre and littermate Cdcs1+/+Il10rafl/fl control mice.
Representative FACS plots (A, B), and graphical comparison of frequencies and total numbers of intracellular cytokine positive CD4+ Th cells (C), and FoxP3+ Tregs (D) in the colons of 3–4 week old mice described in Figure 6. *p<0.05, **p<0.01, Mann-Whitney U test. Data shows Median with IQR. Each data point indicates individual mouse. Data in (C) is representative of 2 litters, whereas pooled data from two litters resulting in 5–6 mice in each group is shown in (D).
Figure 7

Antibiotics exposure prevents colitis in infant Il10rb-/- mice.
(A) Representative histological images (4X magnification in upper panel, scale = 500 μm; 10X in lower panel, scale = 200 μm for Il10rb+/-, Il10rb-/- Water, and Poly B; and 20X in lower panel, scale = 100 μm for Abx and Vanco) of distal colons from 4 week old Il10rb-/- or control mice exposed to regular water or indicated antibiotics. (B) Summary of histological scores from 4 to 6 mice. (C) Representative FACS plots of colonic LP MΦ populations, (D) Frequencies of LP MΦ subsets in the colons of mice described in C. (E) Gene expression analysis by qRT-PCR from the colons of mice indicated above. *p<0.05, **p<0.01, ***p<0.001, ****p<0.0001, Mann-Whitney U test. Data were pooled from mice (n = 3–11) obtained from 2 to 3 independent experiments. Poly B, polymyxin B; Vanco, vancomycin.
Figure 8
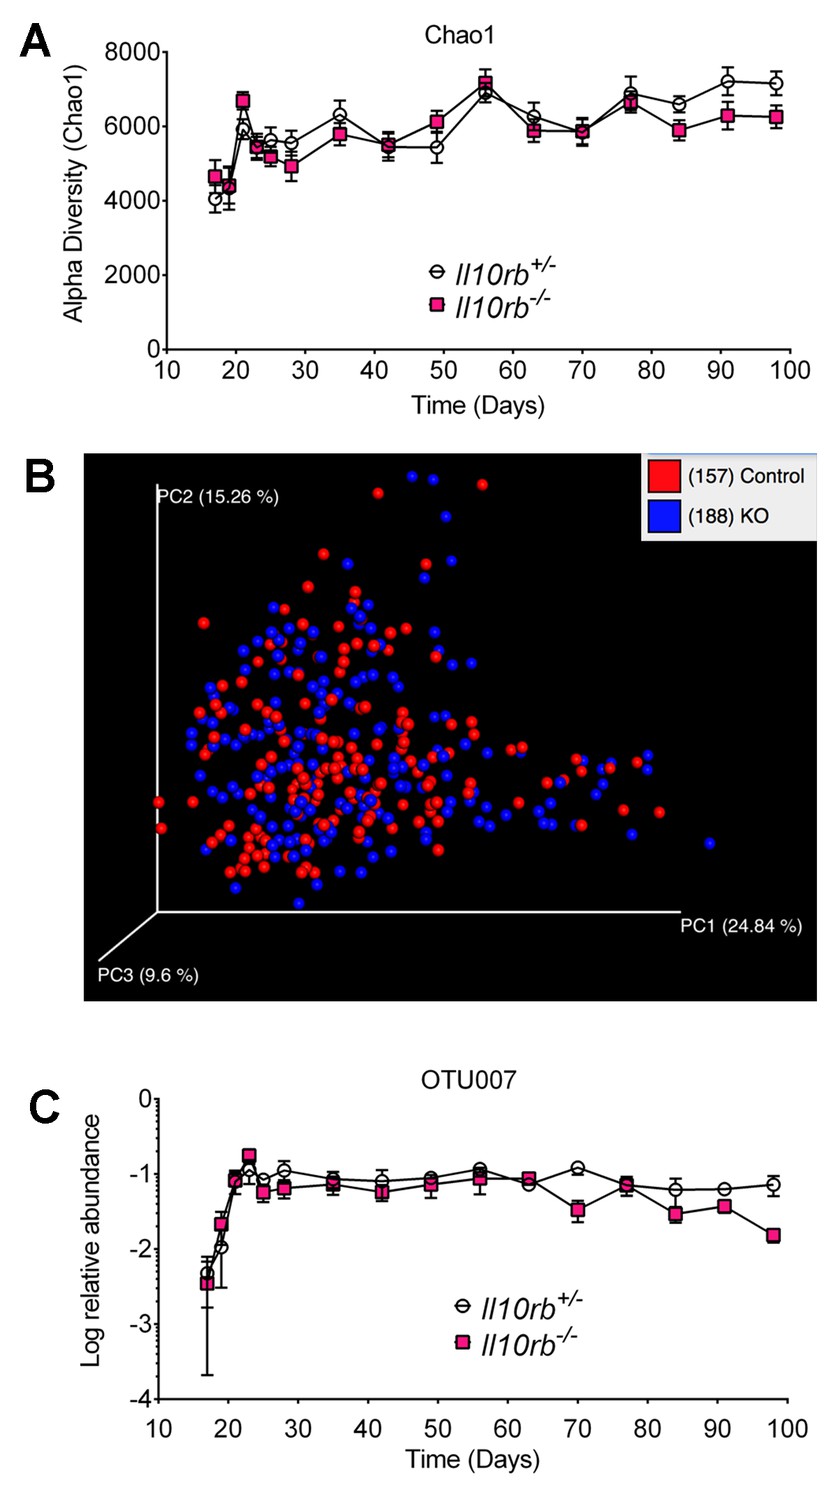
IL10Rβ does not regulate fecal microbiome in developing mice.
Fecal pellets were collected aseptically every other day until day 28 and then weekly until day 98 from Il10rb-/- and littermate Il10rb+/- mice co-housed under SPF conditions. Composition of the microbiota was interrogated via 16S rRNA amplicon pyrosequencing. (A) Comparison of alpha diversity (Chao1), and (B) Beta diversity (weighted Unifrac). (C) Relative abundance (log) of operational taxonomic unit (OTU007, mapping most closely to Helicobacter ganmani). Data in (A) and (C) shows Mean ± SEM of 10–12 mice per genotype, analyzed by 2-way ANOVA followed by Tukey’s Multiple Comparison tests. No significant differences between genotypes were found at any point of time (p>0.05). The raw values of (A) alpha diversity (Chao1), and (C) quantification of OTU007 are provided in additional data file (Figure 8—source data 1).
-
Figure 8—source data 1
Raw values of alpha diversity (Chao1), and quantification of OTU007 shown in Figure 8A and C, respectively.
- https://doi.org/10.7554/eLife.27652.018
Author response image 1
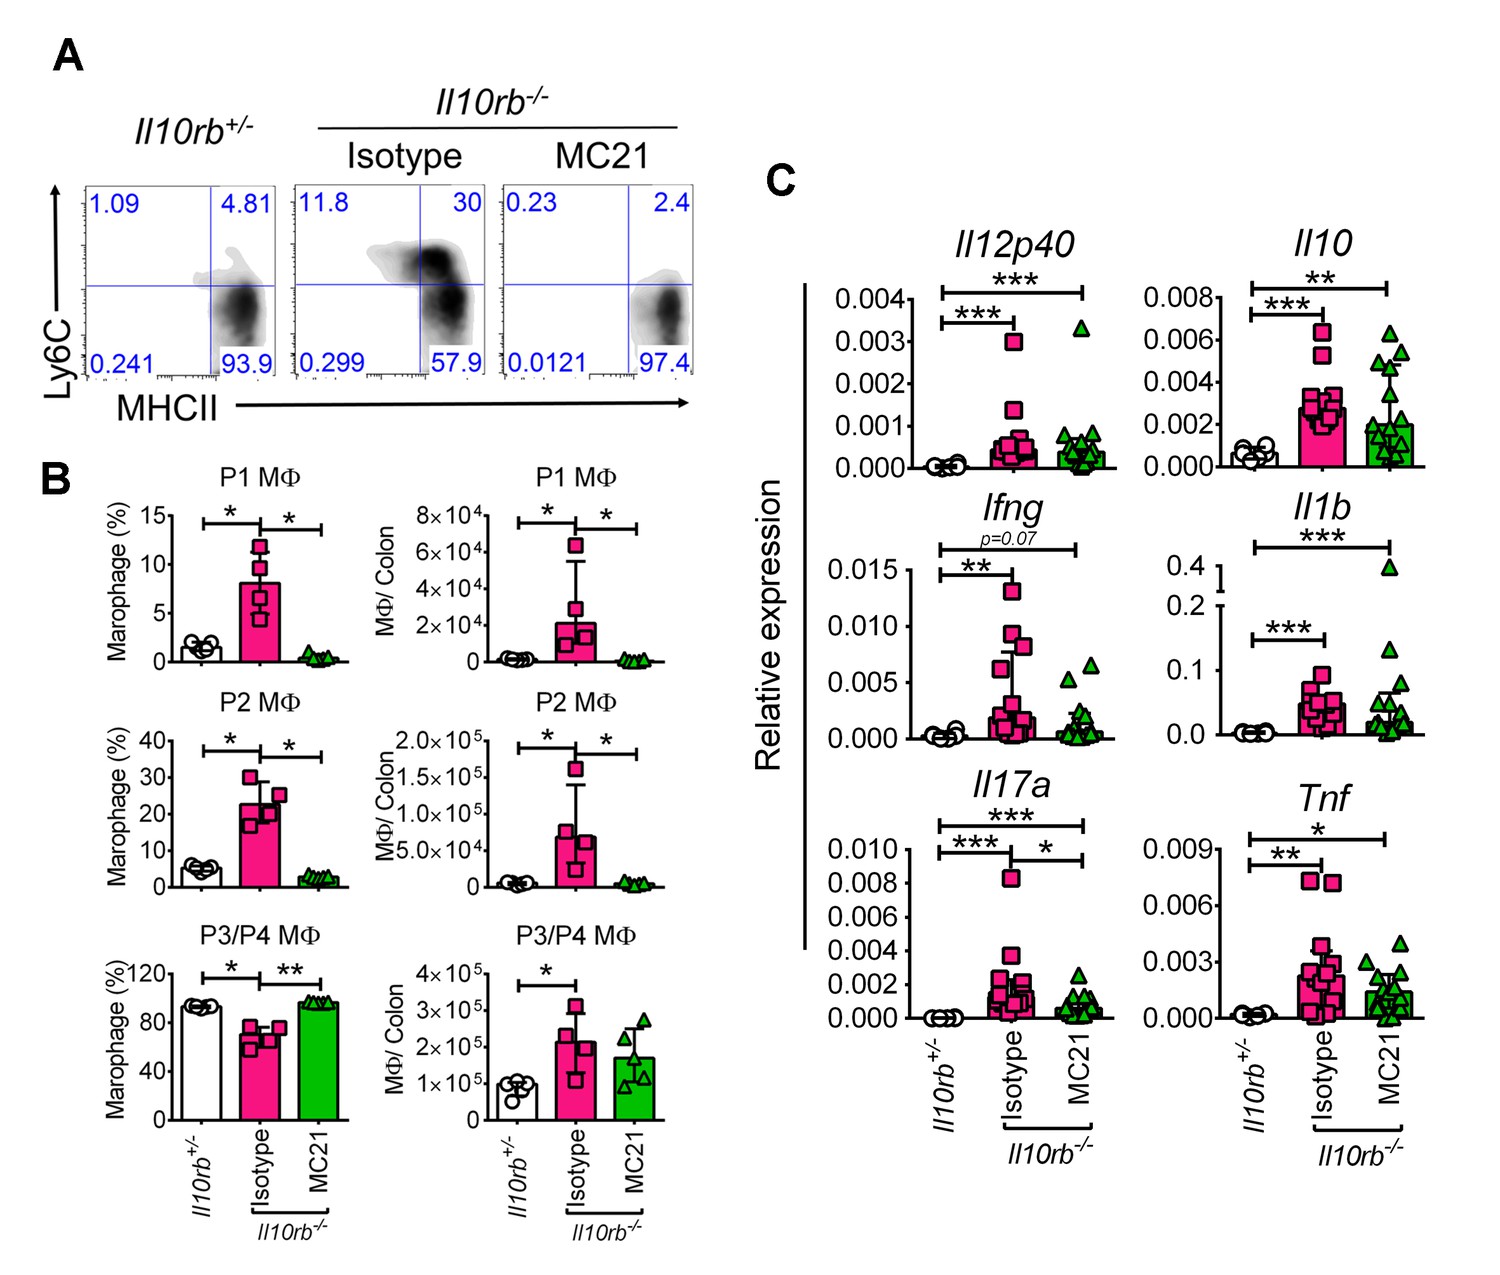
CCR2 blocking does not inhibit inflammatory gene expression in the infant Il10rb-/- mice.
(A) Flow cytometry analyses of colonic lamina propria macrophages of indicated mice after 5 days of treatment (20μg/mouse/day, i.p.) with anti-CCR2 (MC21) or rat IgG2b, κ (isotype). (B) Graphical summary of the frequency and numbers of colonic LP macrophage subsets gated on CD45+CD11b+CD11cintCD103-CD64+ cells. (C) Graphical summary of gene expression by qRT-PCR from the colons of mice indicated above. *p<0.05, **p<0.01, ***p<0.001, Mann-Whitney U test. Data shows Median + IQR, each data point indicates individual mouse.
Download links
A two-part list of links to download the article, or parts of the article, in various formats.
Downloads (link to download the article as PDF)
Open citations (links to open the citations from this article in various online reference manager services)
Cite this article (links to download the citations from this article in formats compatible with various reference manager tools)
Macrophage dysfunction initiates colitis during weaning of infant mice lacking the interleukin-10 receptor
eLife 6:e27652.
https://doi.org/10.7554/eLife.27652


