Directing visceral white adipocyte precursors to a thermogenic adipocyte fate improves insulin sensitivity in obese mice
- University of Texas Southwestern Medical Center, United States
Figures
Figure 1 with 1 supplement
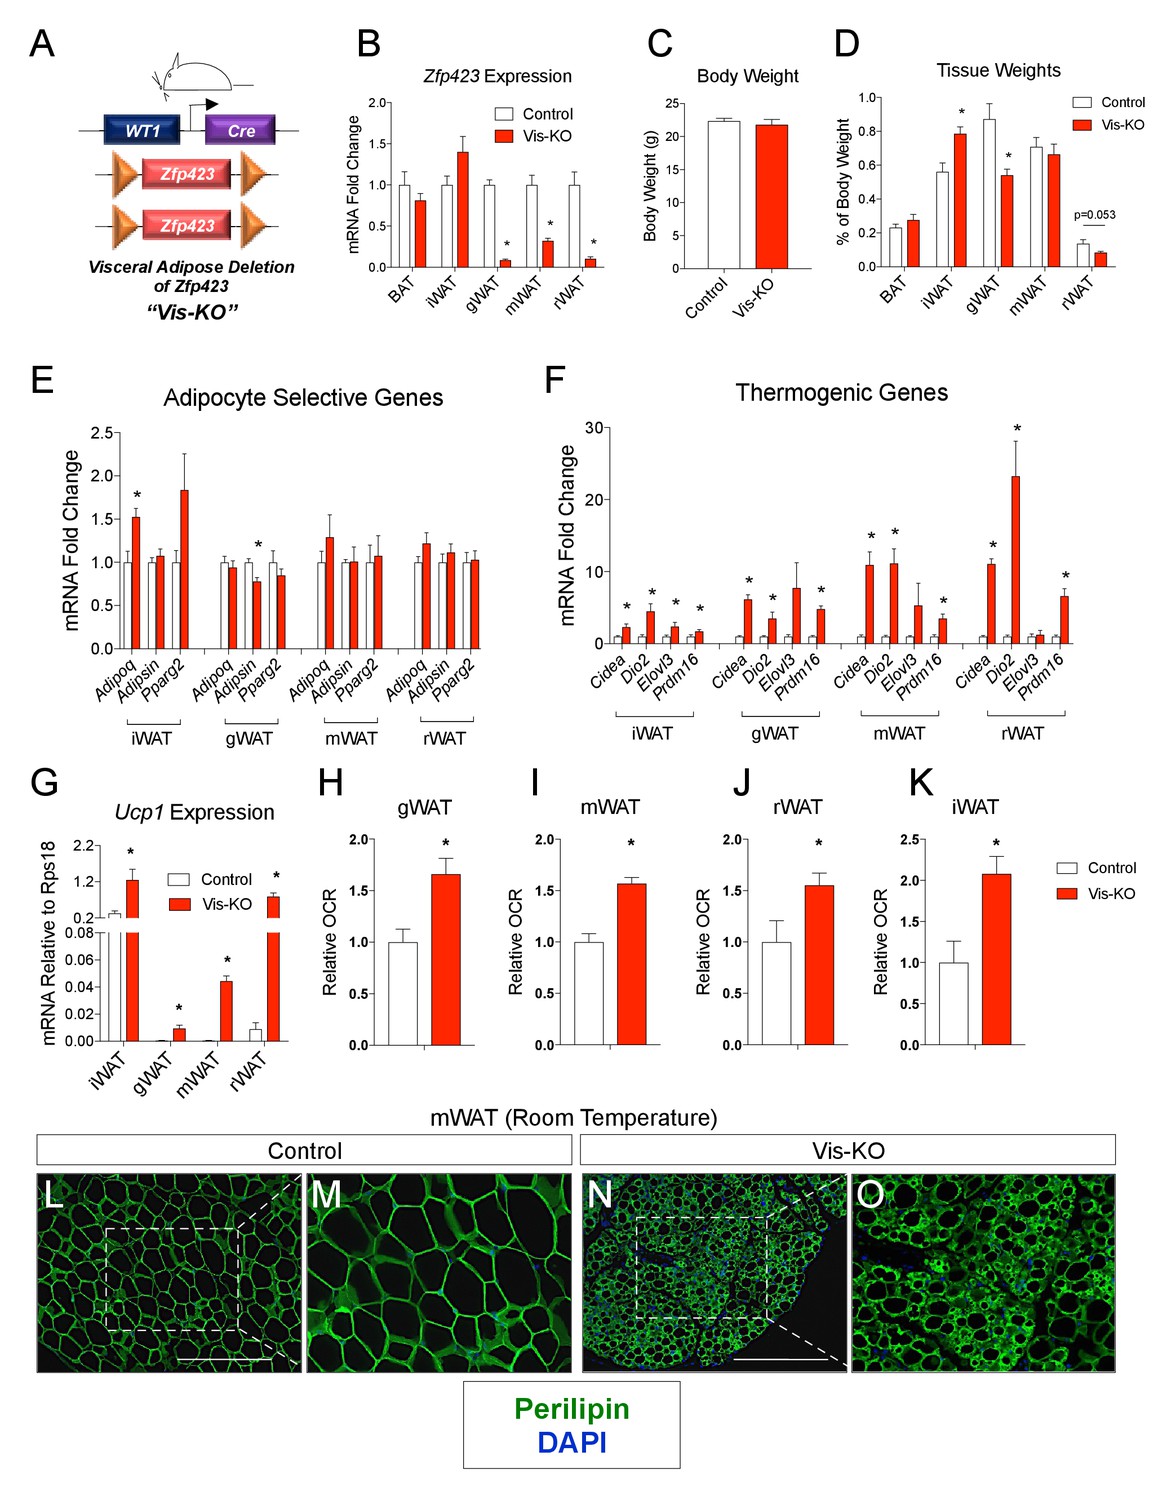
Deletion of Zfp423 in fetal visceral white adipocyte precursors leads to the formation of thermogenic adipocytes in visceral depots.
(A) A mouse model of visceral WAT selective ablation of Zfp423 (Visceral-Knockout or ‘Vis-KO’) was derived by breeding animals expressing the gene encoding Cre recombinase under the control of the Wilms Tumor 1 (WT1) promoter to animals carrying floxed Zfp423 alleles (Zfp423loxP/loxP). Littermates carrying only Zfp423loxp/loxP alleles were used as control animals. (B) Fold change in mRNA levels within brown (BAT), inguinal (iWAT), gonadal (gWAT), mesenteric (mWAT), or retroperitoneal (rWAT) adipose tissue of control (white bar) and Vis-KO (red bar) mice at 8 weeks of age. * denotes p<0.05 from unpaired Student’s t-test. n = 6 mice. (C) Body weight of control (white bar) and Vis-KO (red bar) mice at 8 weeks of age. n = 6 mice. (D) Fat pad weight (normalized to body weight) of control (white bar) and Vis-KO (red bar) mice at 8 weeks of age. * denotes p<0.05 from unpaired Student’s t-test. n = 6 mice. (E– F) Fold change in mRNA levels of mature adipocyte genes (E) and thermogenic genes (F) isolated from whole adipose tissue from control (white bar) and Vis-KO (red bar) mice at 8 weeks of age. * denotes p<0.05 from unpaired Student’s t-test. n = 6 mice. (G) mRNA levels (normalized to Rps18) of Ucp1 isolated from whole adipose tissue from control (white bar) and Vis-KO (red bar) mice at 8 weeks of age. * denotes p<0.05 from unpaired Student’s t-test. n = 6 mice. (H–K) Relative basal oxygen consumption rates (OCRs) within diced gWAT (H), mWAT (I), rWAT (J), and iWAT (K) from control (white bar) and Vis-KO (red bar) mice at 8 weeks of age. * denotes p<0.05 from unpaired Student’s t-test. n = 4 independent replicates pooled from two mice. (L–O) Representative immunofluorescence staining of Perilipin (green) and DAPI (blue) in mWAT sections obtained from control (L, M) and Vis-KO (N, O) mice at 8 weeks of age. Scale bar, 200 μM. Panels M and O represent digital enhancements of the boxed regions shown in L and N, respectively.
Figure 1—figure supplement 1
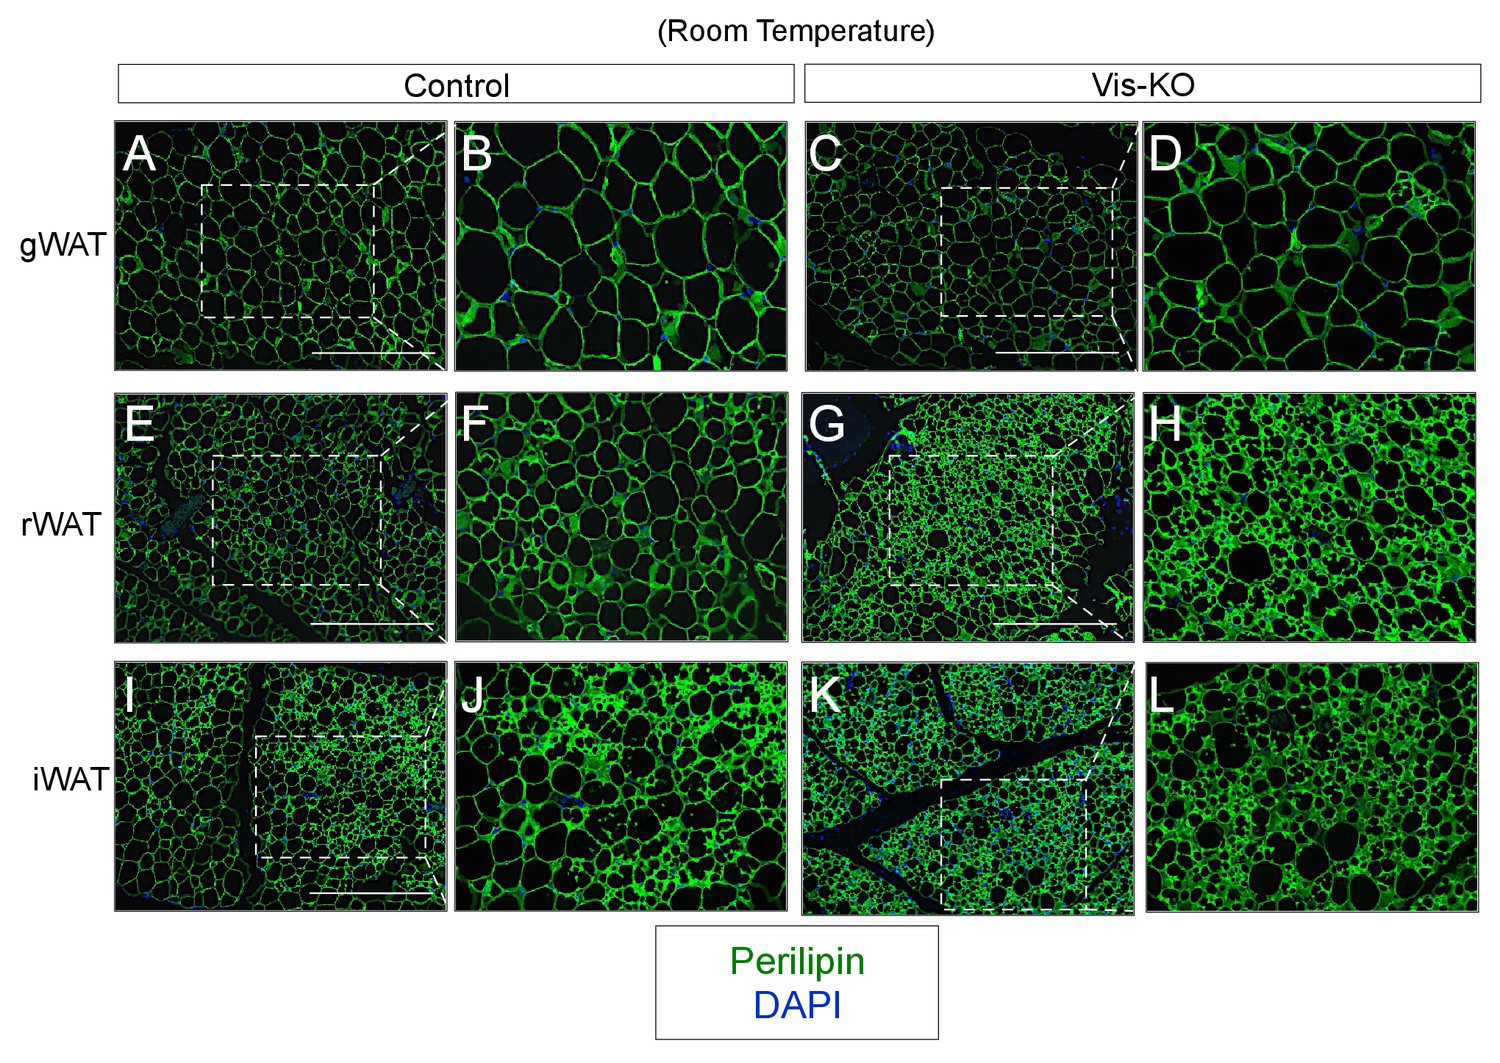
(A–L) Representative images of gonadal (gWAT), retroperitoneal (rWAT), and inguinal WAT (iWAT) from control and Vis-KO mice immunostained with antibodies raised against Perilipin (green).
Scale bar = 200 μM. Panels B,D,F,H,J, and L represent digital enhancements of the boxed regions shown in A, C, E, G, I, and K, respectively.
Figure 2

Zfp423-deficient visceral adipose precursors differentiate into functional thermogenic adipocytes in vitro.
(A) Oil Red O staining of adipocytes differentiated in vitro from inguinal and gonadal SVF of control and Vis-KO mice. (B) Fold change in mRNA levels of adipocyte-selective genes in inguinal adipocyte cultures differentiated as shown in A. * denotes p<0.05 from unpaired Student’s t-test. n = 4 replicates from two mice. (C) Fold change in mRNA levels of thermogenic genes in inguinal adipocyte cultures differentiated as shown in A and treated with vehicle or forskolin (10 µm) for 3 hr. n = 4 replicates from two mice. (D) Fold change in mRNA levels of adipocyte-selective genes in gonadal adipocyte cultures as shown in A. * denotes p<0.05 from unpaired Student’s t-test. n = 4 replicates from two mice. (E) Fold change in mRNA levels of thermogenic genes in gonadal adipocyte cultures differentiated as shown in A and treated with vehicle or forskolin (10 µm) for 3 hr. * denotes p<0.05 from unpaired Student’s t-test. n = 4 replicates from two mice. (F) Oxygen consumption rates (OCRs) within differentiated cultures of control (white bars) or Zfp423-deficient (red bars) gonadal adipocytes in the basal state, and in response to sequential additions of oligomycin (ATP synthase inhibitor), FCCP (chemical uncoupler), and rotenone/antimycin A (complex I and complex III inhibitor). * denotes p<0.05 from unpaired Student’s t-test. n = 4 replicates from two mice. (G) Percent uncoupled respiration of differentiated cultures of control (white bar) or Zfp423-deficient (red bar) gonadal adipocytes as determined by basal and uncoupled (oligomycin) respiration data from Figure 2F. * denotes p<0.05 from unpaired Student’s t-test. n = 4 replicates from two mice. (H) Fold change in mRNA levels of white-, beige-, and brown-selective genes in differentiated cultures of control (white bars) or Zfp423-deficient (red bars) gonadal adipocytes. * denotes p<0.05 from unpaired Student’s t-test. n = 4 replicates from two mice.
Figure 3
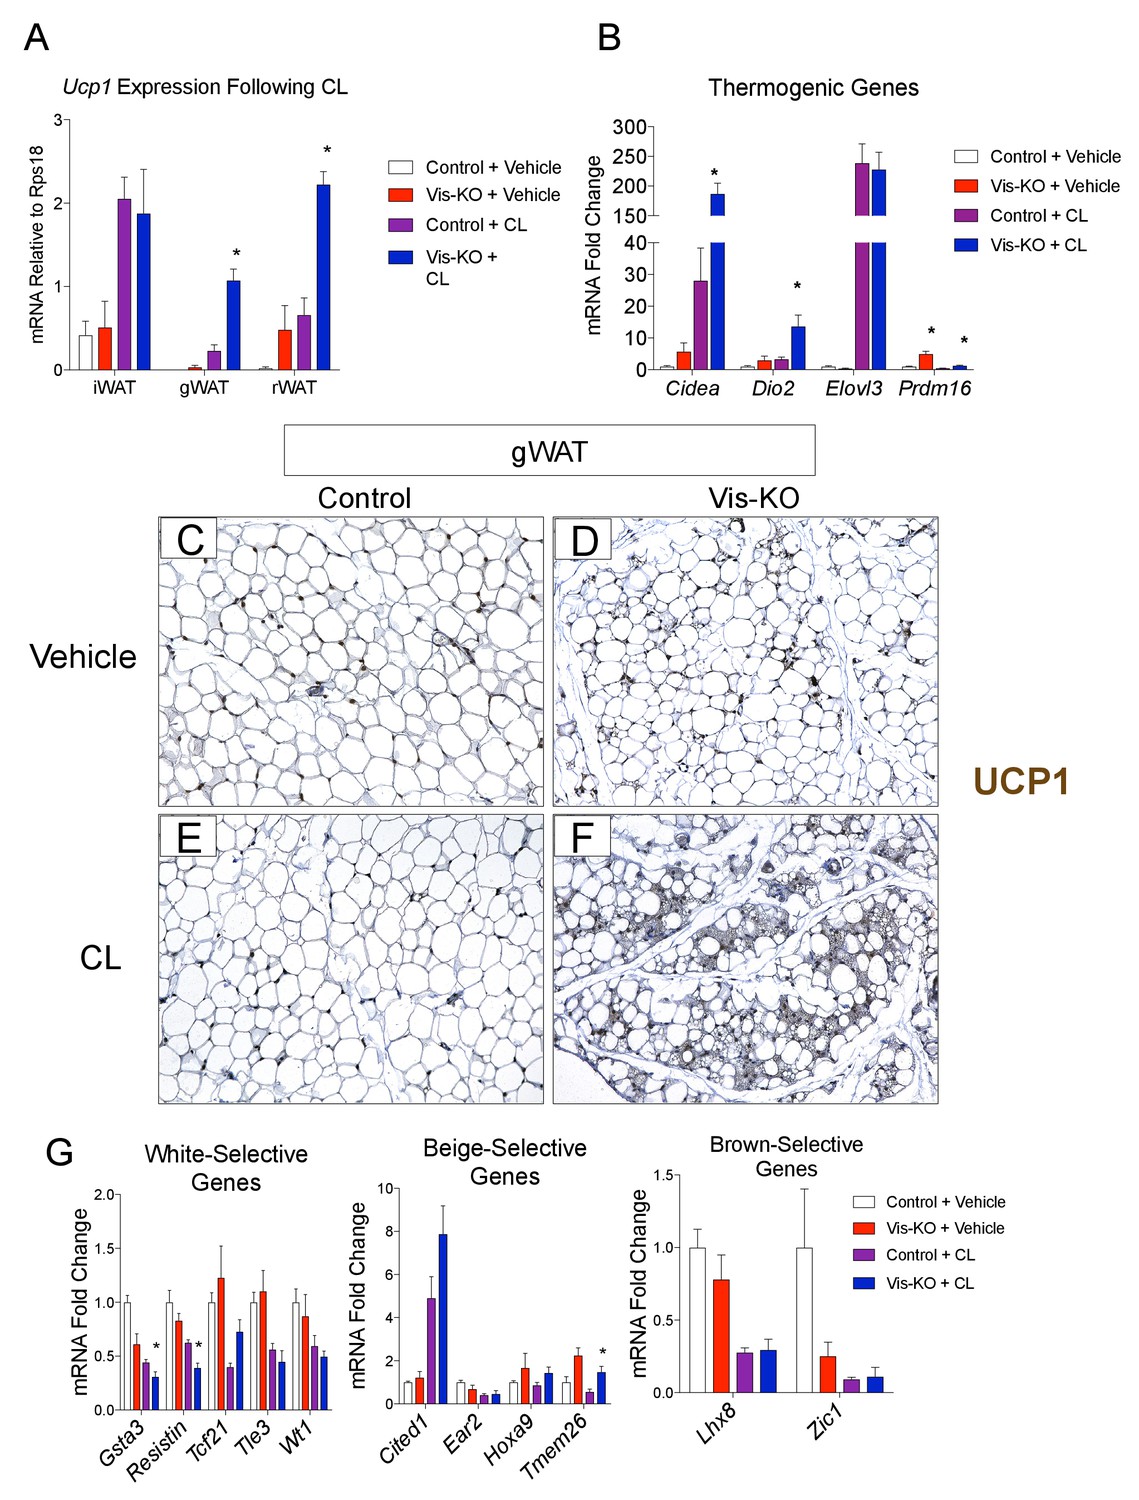
Visceral adipose tissue deletion of Zfp423 leads to enhanced visceral browning upon β−3 adrenergic receptor agonism at thermoneutrality.
(A) Control and Vis-KO mice were housed at room temperature (22°C) until 6 weeks of age then transferred to thermoneutral housing conditions (30°C) for 2 weeks. After 2 weeks at thermoneutrality, mice were treated with PBS (vehicle) or CL316,243 (1 mg/kg, intraperitoneal) daily for 3 days. On the 4thday, tissues were harvested for analysis. mRNA levels (relative to Rps18) of Ucp1 in iWAT, gWAT, and rWAT obtained from control and Vis-KO mice treated with vehicle or CL316,243 (CL) for 3 days at thermoneutrality. * denotes p<0.05 from unpaired Student’s t-test. n = 4–5 mice. (B) Fold change in mRNA levels of thermogenic genes in gWAT obtained from control and Vis-KO mice treated with vehicle or CL316,243 (CL) for 3 days at thermoneutrality. * denotes p<0.05 from unpaired Student’s t-test. n = 4–5 mice. (C–F) Representative brightfield images of Ucp1 immunoreactivity (brown staining) in gWAT sections obtained from control or Vis-KO mice treated with vehicle (C,D) or CL316,243 (E,F). (G) Fold change in mRNA levels of white-, beige-, and brown-selective genes in gWAT obtained from control and Vis-KO mice treated with vehicle or CL316,243 (CL) for 3 days at thermoneutrality. * denotes p<0.05 from unpaired Student’s t-test. n = 4–5 mice.
Figure 4

Thermogenic Zfp423-deficient visceral adipose tissue is largely distinct from subcutaneous beige adipose tissue.
(A) RNA-sequencing was performed on mRNA libraries derived from gonadal WAT (gWAT) of vehicle- and β3 agonist (CL)-treated control and Vis-KO mice, as well as from inguinal WAT and interscapular BAT of vehicle- and CL-treated control mice. Principle component (PC) analysis of sequencing data obtained from CL-treated animals. n = 3 sequenced libraries for each condition. (B) Unsupervised clustering dendogram of adipose depot samples. (C) Venn diagram depicting overlap in 1) transcripts that are differentially expressed between β3-agonist treated Zfp423-deficient gWAT and β3-agonist treated gWAT of control animals, and 2) transcripts that are differentially regulated between β-agonist treated iWAT and vehicle-treated iWAT of wild-type animals. See Figure 4—source data 1, Figure 4—source data 2, Figure 4—source data 3. (D) Gene ontology analysis (GOTERM_CC_FAT) of the 207 overlapping genes shown in D. (E) Heatmap of top 50 induced genes of the 207 highlighted in C.
-
Figure 4—source data 1
Genes whose expression is significantly altered in gonadal WAT of Vis-KO CL316,243 treated mice.
- https://doi.org/10.7554/eLife.27669.008
-
Figure 4—source data 2
Genes whose expression is significantly altered in Inguinal WAT of CL316,243 treated mice.
- https://doi.org/10.7554/eLife.27669.009
-
Figure 4—source data 3
List of 207 genes highlighted in Figure 4C.
- https://doi.org/10.7554/eLife.27669.010
Figure 5

Zfp423-deficiency enables cold-induced visceral WAT browning.
(A) Control and Vis-KO mice were housed at room temperature (22°C) until 6 weeks of age then transferred to thermoneutral housing (30°C) for 2 weeks. After 2 weeks at thermoneutrality, animals were transferred to 6°C or left at thermoneutrality for seven full days. On the 8th day, tissues were harvested for analysis. mRNA levels (relative to Rps18) of Ucp1 in iWAT, gWAT, and rWAT from control and Vis-KO mice cold exposed (CE) or housed at thermoneutrality (TN) for 7 days. * denotes p<0.05 from unpaired Student’s t-test. n = 4–5 mice. (B) Fold change in mRNA levels of thermogenic genes in rWAT and gWAT from control and Vis-KO mice cold exposed (CE) or housed at thermoneutrality (TN) for 7 days. * denotes p<0.05 from unpaired Student’s t-test. n = 4–5 mice. (C–J) Brightfield images of Ucp1 immunostaining (brown) within rWAT (C–F) and gWAT (G–J) sections obtained from control or Vis-KO mice following cold exposure (CE) or housing at thermoneutrality (TN). (K) Body temperature at indicated time points following transfer of mice from thermoneutrality to cold (6°C). n = 4–5 mice. (L) Body temperature at indicated time points during a cold tolerance test after 4 weeks of acclimation to cold (6°C). * denotes p<0.05 from unpaired Student’s t-test. n = 4–5 mice.
Figure 6
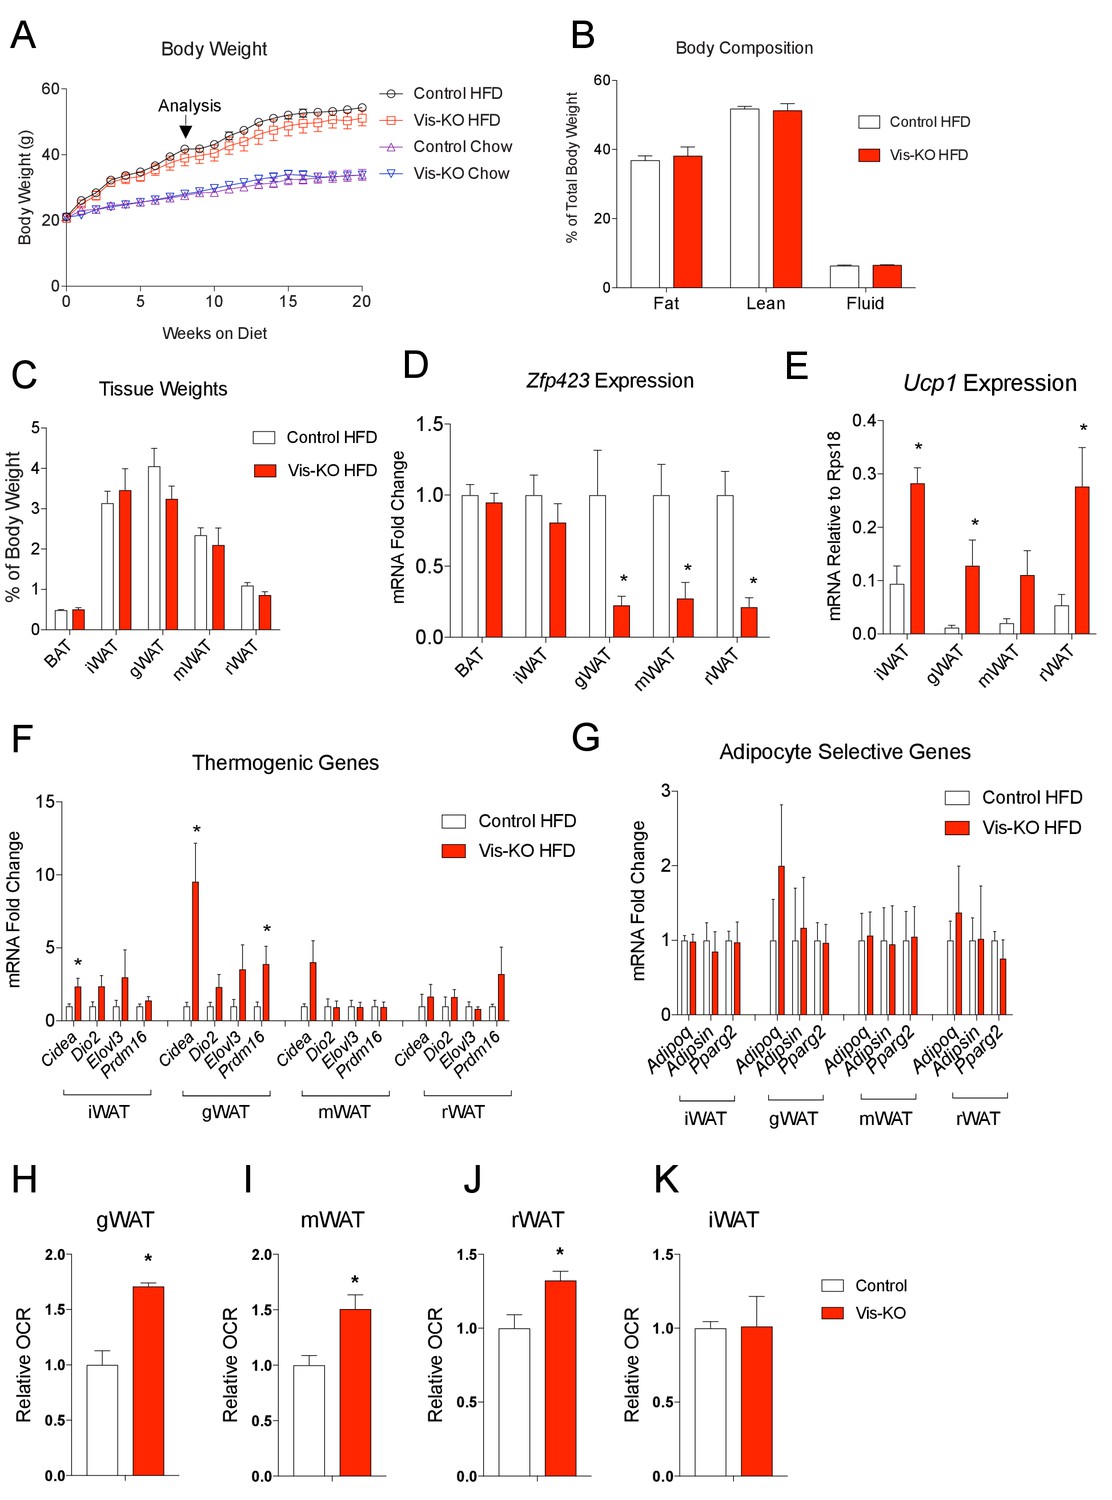
Obese mice lacking Zfp423 in visceral adipose tissue display enhanced visceral adipose tissue thermogenesis.
(A) Weekly measurements of body weights of 8 weeks-old control and Vis-KO mice fed a standard chow diet (Chow) or high fat diet (HFD) for 20 weeks. n = 6–7 mice per group. (B) Total fat mass, lean mass, and water mass (normalized to body weight) of control (white bars) and Vis-KO (red bars) mice after 8 weeks of HFD feeding. n = 6–7 mice. (C) Fat depot mass (normalized to body weight) of control (white bars) and Vis-KO (red bars) mice after 8 weeks of HFD feeding. n = 6–7 mice. (D) Relative mRNA levels of Zfp423 in BAT, iWAT, gWAT, mWAT, and rWAT isolated from control (white bars) and Vis-KO (red bars) mice after 8 weeks of HFD feeding. * denotes p<0.05 from unpaired Student’s t-test. n = 6–7 mice per group. (E) mRNA levels (normalized to Rps18) of Ucp1 within adipose depots of control (white bars) and Vis-KO (red bars) mice after 8 weeks of chow or HFD feeding. * denotes p<0.05 from unpaired Student’s t-test. n = 6–7 mice. (F–G) Relative mRNA levels of thermogenic genes (F) and adipocyte-selective genes (G) in iWAT, gWAT, mWAT, and rWAT isolated from control (white bars) and Vis-KO (red bars) mice after 8 weeks of HFD feeding. * denotes p<0.05 from unpaired Student’s t-test. n = 6–7 mice. (H–K) Relative basal oxygen consumption rates (OCRs) within gWAT (H), mWAT (I), rWAT (J), and iWAT (K) isolated from control (white bars) and Vis-KO (red bars) mice after 8 weeks of chow or HFD feeding. * denotes p<0.05 from unpaired Student’s t-test. n = 4 independent replicates pooled from two mice.
Figure 7

Browning of visceral adipose tissues is associated with increased energy expenditure.
(A) Body weight of control (white bar) and Vis-KO (red bar) mice after 8 weeks of high fat diet feeding. n = 4–5 mice. (B) Total fat mass, lean mass, and water mass (normalized to body weight) of control (white bars) and Vis-KO (red bars) mice after 8 weeks of HFD feeding. n = 4–5 mice. (C) O2 consumption during two complete 12 hr light-dark cycles of control and Vis-KO mice following 8 weeks of high fat diet feeding. n = 4–5 mice. (D–G) Average O2 consumption (D), heat production (E), CO2 production (F), and food intake (G) during the 24 hr, day, and night cycle in control (white bars) and Vis-KO (red bars) mice following 8 weeks of high fat diet. Bars represent averages from over the course of the 5 day measurement. * denotes p<0.05 from unpaired Student’s t-test. n = 4–5 mice. (H) Average 24 hr X-beam, Y-beam, and Z-beam breaks of control (white bars) and Vis-KO (red bars) mice following 8 weeks of high fat diet. Bars represent averages from over the course of the 5 day measurement. n = 4–5 mice. (I) Average RER during the 24 hr, day, and night cycle in control (white bars) and Vis-KO (red bars) mice following 8 weeks of high fat diet. Bars represent averages from over the course of the 5 day measurement. n = 4–5 mice.
Figure 8
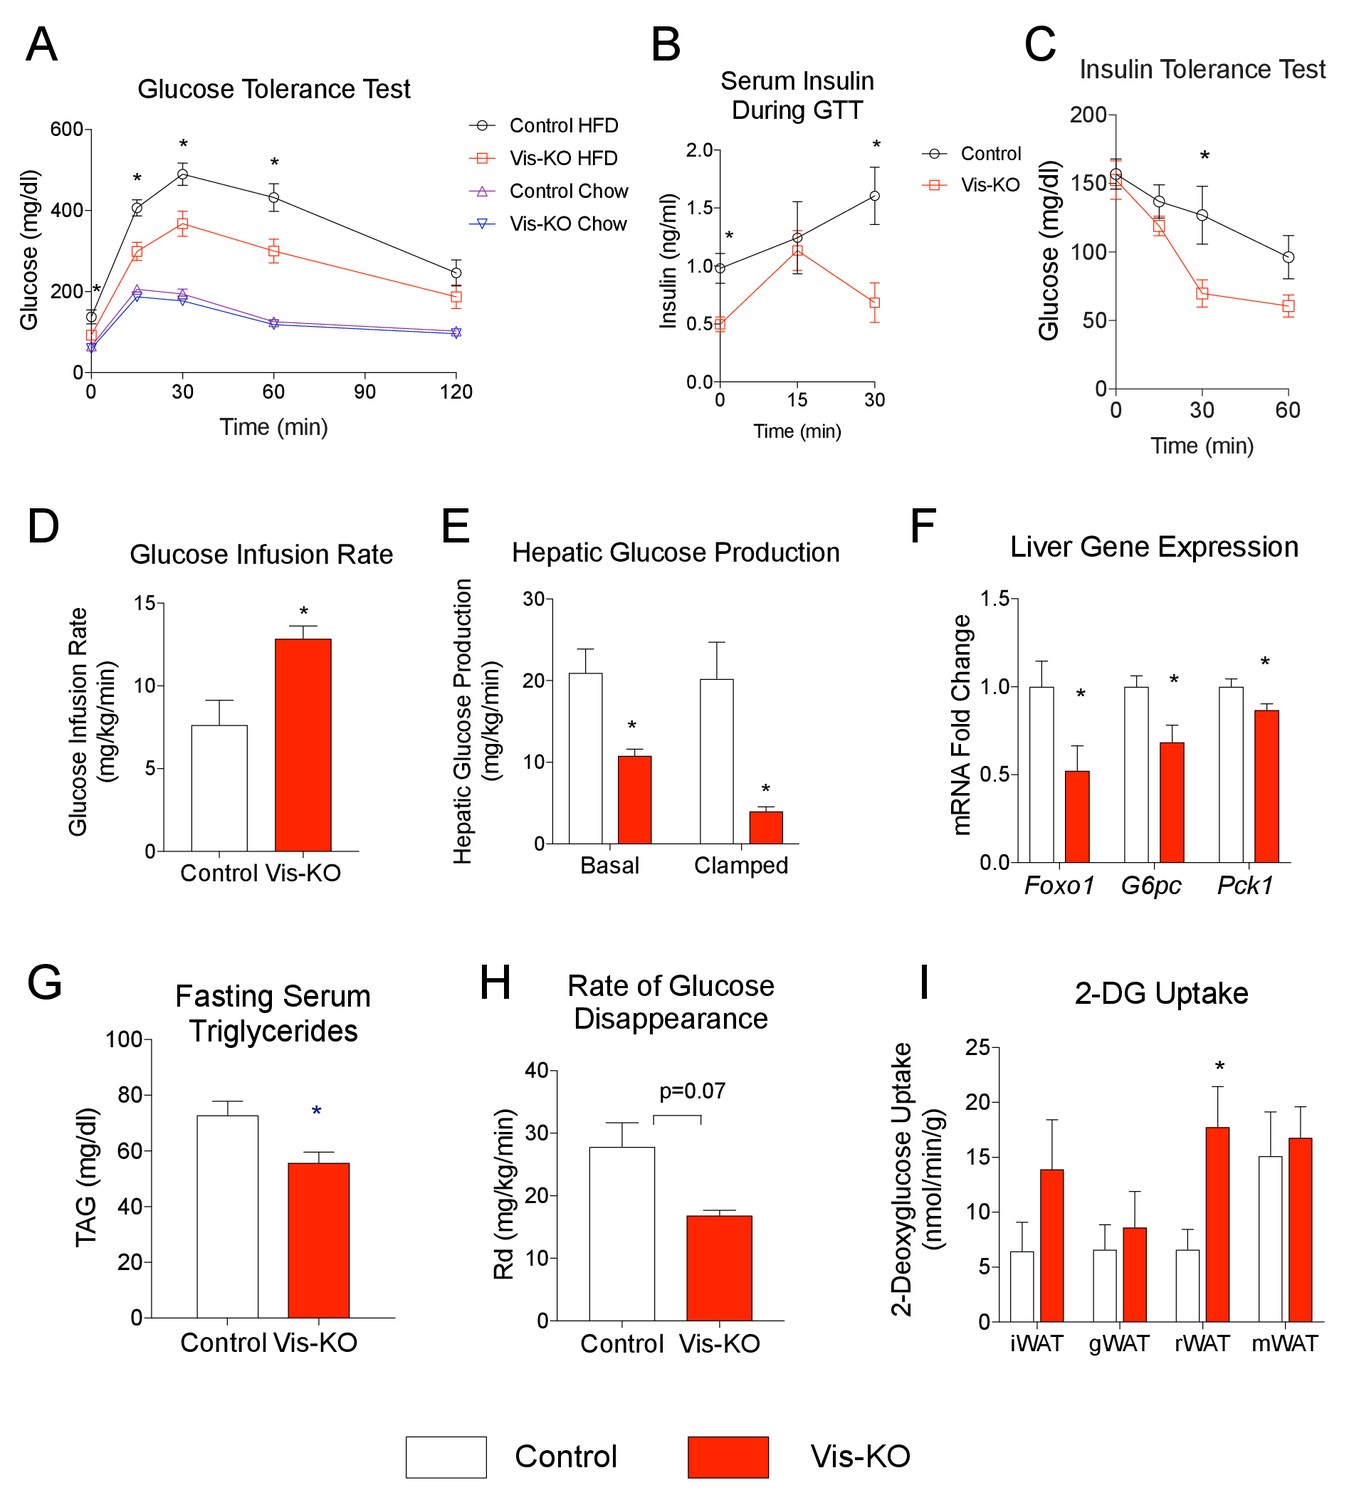
Mice lacking visceral adipose Zfp423 are protected against insulin resistance in obesity.
(A) Intraperitoneal glucose tolerance tests of control and Vis-KO mice after 8 weeks of chow or HFD feeding. * denotes p<0.05 from unpaired Student’s t-test. n = 6–7 mice. (B) Serum insulin levels of control and Vis-KO mice after 8 weeks of HFD feeding during the glucose tolerance test shown in A. * denotes p<0.05 from unpaired Student’s t-test. n = 6–7 mice. (C) Insulin tolerance tests of control and Vis-KO mice after 8 weeks of HFD feeding. * denotes p<0.05 from unpaired Student’s t-test. n = 6–7 mice. (D–E) Glucose infusion rate (D) and basal and clamped hepatic glucose production (E) during hyperinsulinemic-euglycemic clamp experiments performed on conscious, unrestrained control (white bars) and Vis-KO (red bars) mice after 8 weeks of HFD feeding. * denotes p<0.05 from unpaired Student’s t-test. n = 5–6 mice. (F) Relative mRNA levels of gluconeogenic genes in the livers of control (white bars) and Vis-KO (red bars) mice after 8 weeks of HFD feeding. * denotes p<0.05 from unpaired Student’s t-test. n = 6–7 mice. (G) Serum triglyceride levels in control (white bars) and Vis-KO (red bars) mice after 8 weeks of HFD feeding. * denotes p<0.05 from unpaired Student’s t-test. n = 6–7 mice. (H) Glucose disappearance rate during hyperinsulinemic-euglycemic clamp experiments performed on conscious, unrestrained control (white bars) and Vis-KO (red bars) mice after 8 weeks of HFD feeding. n = 5–6 mice. (I) 2-deoxyglucose uptake quantification of iWAT, gWAT, rWAT, and mWAT during hyperinsulinemic-euglycemic clamp experiments performed on conscious, unrestrained control (white bars) and Vis-KO (red bars) mice after 8 weeks of HFD feeding. * denotes p<0.05 from unpaired Student’s t-test. n = 5–6 mice.
Figure 9
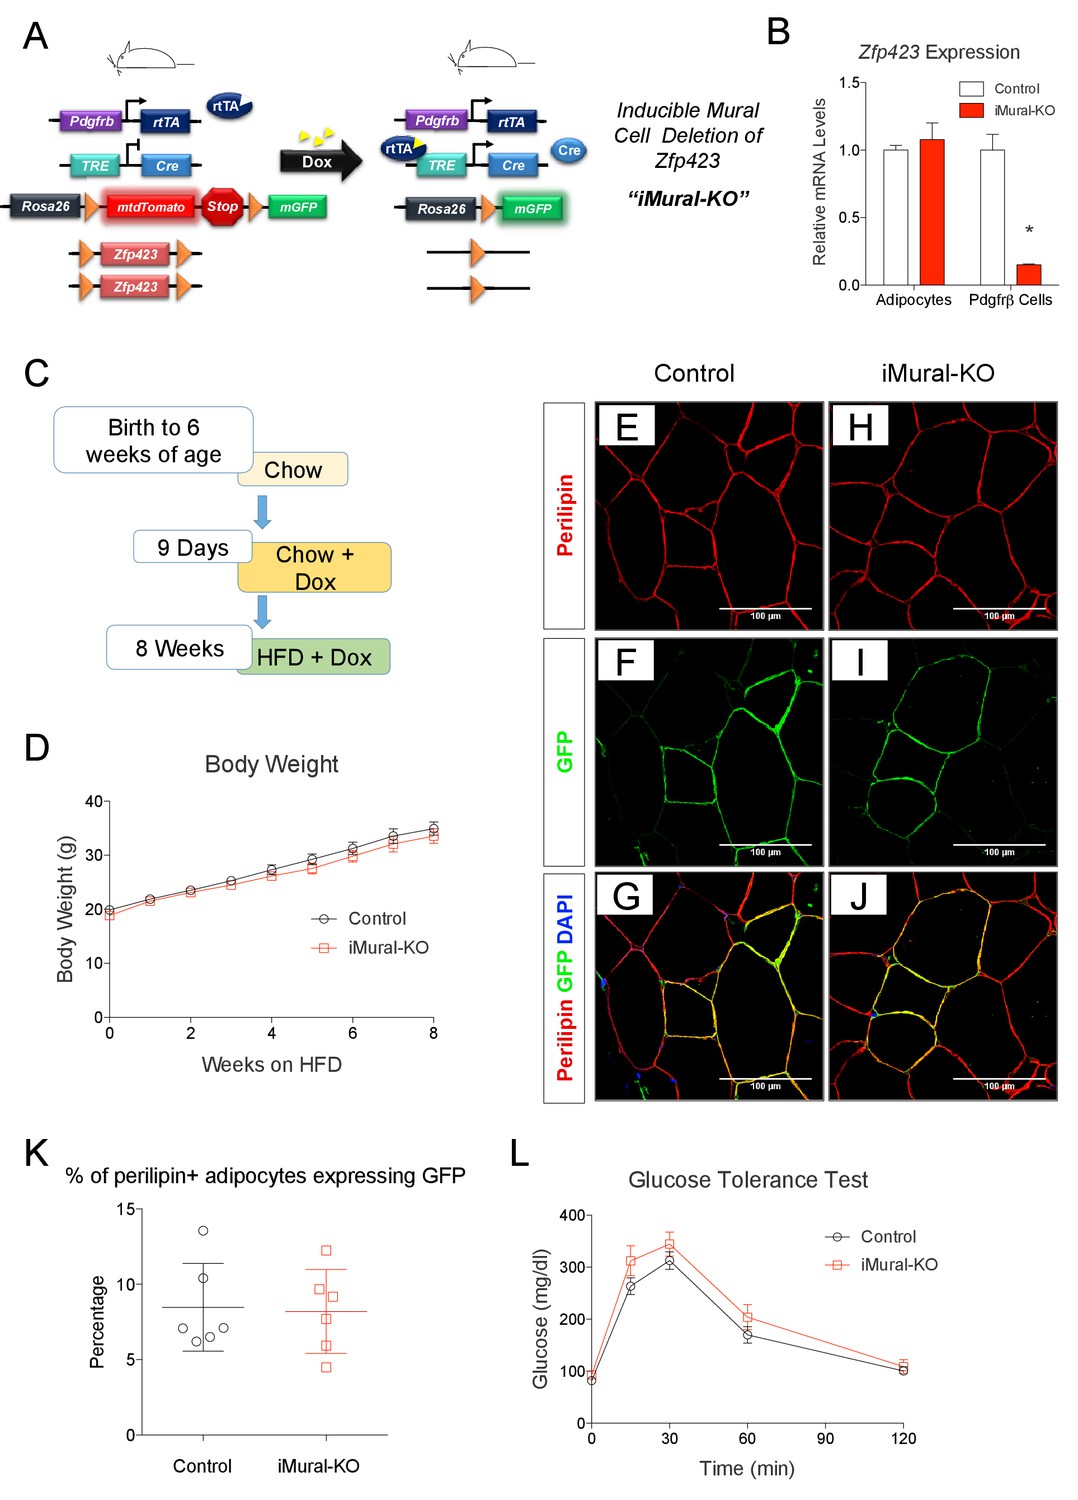
Adult mural cell deletion of Zfp423 does not impact visceral white adipogenesis associated with high fat diet feeding.
(A) Doxycycline (Dox) inducible deletion of Zfp423 in adult mural cells (inducible-Mural-Knockout or ‘iMural-KO’) is achieved by breeding PdgfrbrtTA transgenic mice to animals expressing Cre recombinase under the control of a tetracycline response element (TRE-Cre), the Rosa26R loxP-mtdTomato-loxP-mGFP (mT/mG) fluorescent reporter allele, and the floxed Zfp423 alleles (Zfp423loxP/loxP). Animals carrying only PdgfrbrtTA, TRE-Cre, and Rosa26RmT/mG alleles were used as controls. (B) Validation of the iMural-KO model. Relative mRNA levels of Zfp423 in purified adipocytes and purified Pdgfrβ+ cells from WAT obtained from control (white bars) and iMural-KO (red bars) mice at 8 weeks of age. * denotes p<0.05 from unpaired Student’s t-test. n = 4–5 mice. (C) Mice were maintained at room temperature and fed standard chow diet until 6 weeks of age. Animals were then switched to Dox-containing chow diet for 9 days in order to induce Zfp423 deletion and mGFP expression in mural cells. Animals were then maintained on a Dox-containing high-fat diet (HFD) for 8 weeks then sacrificed for analysis. (D) Weekly body weight measurements of control and iMural-KO mice during HFD feeding. n = 6–8 mice. (E–J) Confocal images of immunostained gWAT obtained from control (E–G) and iMural-KO (H–J) mice fed high fat diet for 8 weeks. (K) Quantification of mGFP-expressing adipocytes (mGFP+; perlipin+) observed in randomly chosen 10X magnification fields of gWAT sections obtained from control (black circles) and iMural-KO (red squares) mice following 8 weeks of HFD feeding. n = 6 mice. (L) Glucose tolerance tests of control and iMural-KO mice after 8 weeks of HFD feeding. n = 6–8 mice.
Figure 10 with 1 supplement
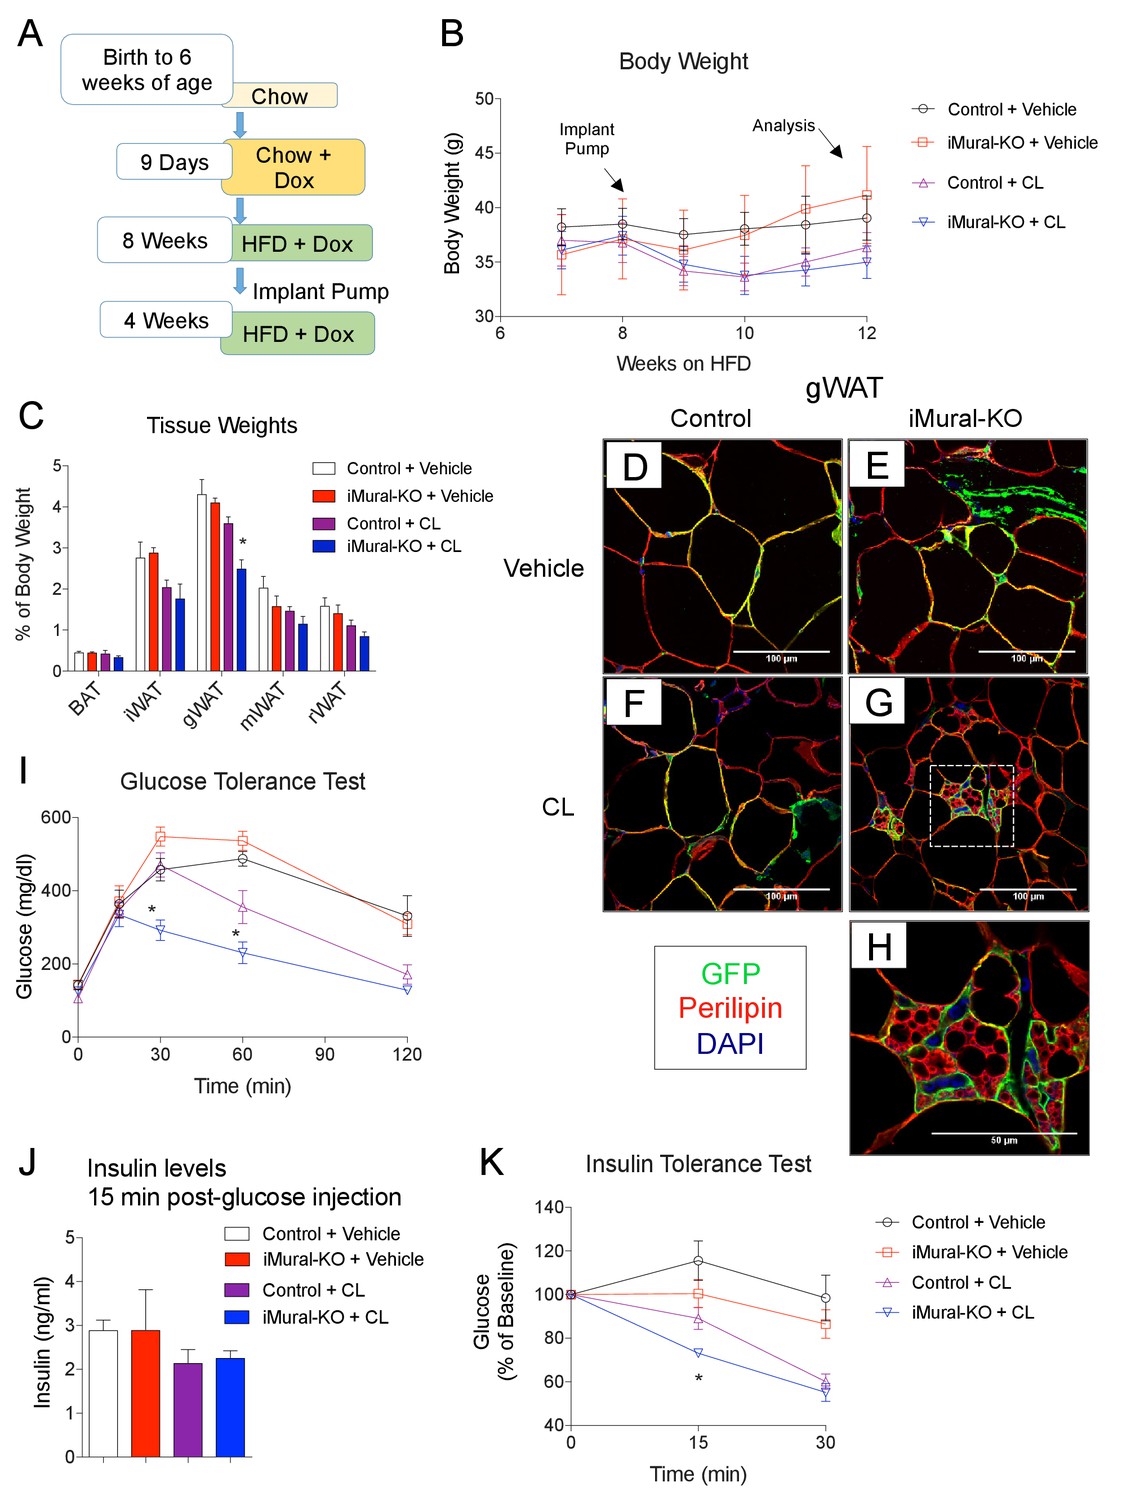
Inactivation of Zfp423 in adult mural cells leads to beige, rather than white, adipocyte hyperplasia in diet-induced obesity.
(A) Chow-fed 6 weeks-old animals were first administered Dox-containing chow for 9 days in order to inactive Zfp423 and induce permanent mGFP expression in Pdgfrb+ cells. Mice were then switched to a high-fat diet (HFD) containing Dox. After 8 weeks of Dox-HFD, the mice were treated daily with CL316,243 (1 mg/kg/24 hr) or vehicle (PBS) for 4 weeks. (B) Weekly body weight measurements of obese control and iMural-KO mice following vehicle or CL316,243 administration. n = 6–8 mice. (C) Fat depot weights (normalized to body weight) of control and iMural-KO mice after vehicle or CL316,243 administration. * denotes p<0.05 from unpaired Student’s t-test. n = 6–8 mice. (D–G) Representative confocal images of Perilipin (red), mGFP (green) and DAPI (blue) immunostaining of gWAT sections obtained from control and iMural-KO mice administered vehicle (D, E), or CL316,243 (F, G). (H) Digital enhancement of region outlined in (G). (I) Glucose tolerance tests of control and iMural-KO mice following vehicle or CL316,243 administration. * denotes p<0.05 from unpaired Student’s t-test. n = 6–8 mice. (J) Serum insulin levels measured during intraperitoneal glucose tolerance tests of control and iMural-KO mice following vehicle or CL316,243 administration. n = 6–8 mice. (K) Insulin tolerance tests of control and iMural-KO mice following vehicle or CL316,243 administration. * denotes p<0.05 from unpaired Student’s t-test. n = 6–8 mice.
Figure 10—figure supplement 1

Quantification of beige adipocyte hyperplasia in iMural-KO mice.
(A–B) Quantification of mGFP-expressing adipocytes (mGFP+; perlipin+) observed in randomly chosen 10X magnification fields of gWAT (A) or iWAT (B) sections of obese control and iMural-KO mice following vehicle or CL316,243 administration. n = 7 mice. (C) Percentage of all perilipin+ adipocytes counted in (A) that are multilocular. * denotes p<0.05 from unpaired Student’s t-test. n = 7 mice. (D) Percentage of all perilipin+ adipocytes counted in (B) that are multilocular. n = 7 mice. (E) Relative mRNA levels of Ucp1 in indicated WAT depots obtained from control and iMural-KO mice following vehicle or CL316,243 administration. * denotes p<0.05 from unpaired Student’s t-test. n = 6–8 mice. (F) Relative basal oxygen consumption rates (OCRs) of isolated WAT depots from control and iMural-KO mice. * denotes p<0.05 from unpaired Student’s t-test. n = 4 independent replicates pooled from two mice.
Tables
Table 1
qPCR primer sequences utilized for gene expression analysis
| Gene | Forward 5'−3' | Reverse 5'−3' |
|---|---|---|
| Adipoq | AGATGGCACTCCTGGAGAGAA | TTCTCCAGGCTCTCCTTTCCT |
| Adipsin | CTACATGGCTTCCGTGCAAGT | AGTCGTCATCCGTCACTCCAT |
| Cidea | TCCTATGCTGCACAGATGACG | TGCTCTTCTGTATCGCCCAGT |
| Cited1 | AACCTTGGAGTGAAGGATCGC | GTAGGAGAGCCTATTGGAGATGT |
| Dio2 | CATTGATGAGGCTCACCCTTC | GGTTCCGGTGCTTCTTAACCT |
| Ear2 | CCACAAAGCAGACAGGGAAAC | GCATGAGGCAAGCATTAGGAC |
| Elovl3 | GTGTGCTTTGCCATCTACACG | CTCCCAGTTCAACAACCTTGC |
| Fabp4 | GATGAAATCACCGCAGACGAC | ATTCCACCACCAGCTTGTCAC |
| Foxo1 | GGCACTCCAAAACAGGACTTG | AAGAAATGGCAGAGGGAGGAG |
| G6pc | GGGCTGTTTGAGGAAAGTGTG | TATCCGACAGGAGGCTGGTAA |
| Gsta3 | AGATCGACGGGATGAAACTGG | CAGATCCGCCACTCCTTCT |
| Hoxa9 | CCCCGACTTCAGTCCTTGC | GATGCACGTAGGGGTGGTG |
| Lhx8 | GAGCTCGGACCAGCTTCA | TTGTTGTCCTGAGCGAACTG |
| Pck1 | TGTCTGTCCCATTGTCCACAG | AAGGTAAGGAAGGGCGGTGTA |
| Pgc1α | GCACCAGAAAACAGCTCCAAG | CGTCAAACACAGCTTGACAGC |
| Pparg2 | GCATGGTGCCTTCGCTGA | TGGCATCTCTGTGTCAACCATG |
| Prdm16 | ACACGCCAGTTCTCCAACCTGT | TGCTTGTTGAGGGAGGAGGTA |
| Resistin | AAGAACCTTTCATTTCCCCTCCT | GTCCAGCAATTTAAGCCAATGTT |
| Rps18 | CATGCAAACCCACGACAGTA | CCTCACGCAGCTTGTTGTCTA |
| Tcf21 | CCCTGAAAGTGGACTCCAACA | GCTGAGCGGGCTTTTCTTAGT |
| Tle3 | GAGACTGAACACAATCCTAGCC | GGAGTCCACGTACCCCGAT |
| Tmem26 | AGGGGCTTCCTTAGGGTTTTC | CCGTCTTGGATGAAGAAGCTG |
| Ucp1 | TCTCAGCCGGCTTAATGACTG | GGCTTGCATTCTGACCTTCAC |
| Wt1 | ATAGGCCAGGGCATGTGTATG | CTGGTGCCTTGCTCTCTGATT |
| Zfp423 | CAGGCCCACAAGAAGAACAAG | GTATCCTCGCAGTAGTCGCACA |
| Zic1 | CTGTTGTGGGAGACACGATG | CCTCTTCTCAGGGCTCACAG |
Table 2
Statistical information.
| Figure | N(sample size) | Statistical test method | Description | p-value | |
|---|---|---|---|---|---|
| 1B | Control n = 6 | Unpaired Student’s t test | gWAT | 4.56E-08 | |
| Vis-KO n = 6 | mWAT | 0.0019 | |||
| rWAT | 0.0002 | ||||
| 1D | Control n = 6 | Unpaired Student’s t test | iWAT | 0.0043 | |
| Vis-KO n = 6 | gWAT | 0.0051 | |||
| 1E | Control n = 6 | Unpaired Student’s t test | iWAT | Adipoq | 0.0111 |
| Vis-KO n = 6 | gWAT | Adipsin | 0.004 | ||
| 1F | Control n = 6 | Unpaired Student’s t test | iWAT | Cidea | 0.012678087 |
| Vis-KO n = 6 | Dio2 | 0.015258263 | |||
| Elovl3 | 0.035976522 | ||||
| Prdm16 | 0.043549713 | ||||
| gWAT | Cidea | 6.91848E-06 | |||
| Dio2 | 0.017046004 | ||||
| Prdm16 | 9.5932E-05 | ||||
| mWAT | Cidea | 0.008754783 | |||
| Dio2 | 0.013198702 | ||||
| Prdm16 | 0.018964447 | ||||
| rWAT | Cidea | 4.6109E-07 | |||
| Dio2 | 0.000934576 | ||||
| Prdm16 | 0.000260661 | ||||
| 1G | Control n = 6 | Unpaired Student’s t test | iWAT | 0.019621248 | |
| Vis-KO n = 6 | gWAT | 0.002534473 | |||
| mWAT | 0.000189507 | ||||
| rWAT | 7.14636E-06 | ||||
| 1H | Control n = 4 | Unpaired Student’s t test | gWAT | Basal | 0.02847 |
| Vis-KO n = 4 | |||||
| 1I | Control n = 4 | Unpaired Student’s t test | mWAT | Basal | 0.00457 |
| Vis-KO n = 4 | |||||
| 1J | Control n = 4 | Unpaired Student’s t test | rWAT | Basal | 0.04901 |
| Vis-KO n = 4 | |||||
| 1K | Control n = 4 | Unpaired Student’s t test | iWAT | Basal | 0.03254 |
| Vis-KO n = 4 | |||||
| 2B | Control n = 4 | Unpaired Student’s t test | Inguinal | Adipoq | 0.00251 |
| Vis-KO n = 4 | |||||
| 2D | Control n = 4 | Unpaired Student’s t test | Gonadal | Zfp423 | 2.1E-06 |
| Vis-KO n = 4 | |||||
| 2E | Control n = 4 | Unpaired Student’s t test | Gonadal | Cidea (red bar) | 3.1573E-06 |
| Vis-KO n = 4 | Cidea (blue bar) | 0.028888184 | |||
| Dio2 | 0.039314815 | ||||
| Ppargc1a | 0.00022784 | ||||
| Ucp1 (red bar) | 0.004431674 | ||||
| Ucp1 (blue bar) | 0.000356176 | ||||
| 2F | Control n = 4 | Unpaired Student’s t test | Gonadal | Basal | 6.73733E-05 |
| Vis-KO n = 4 | Oligo. | 0.000488801 | |||
| FCCP | 0.02909696 | ||||
| 2G | Control n = 4 | Unpaired Student’s t test | Gonadal | 0.03356 | |
| Vis-KO n = 4 | |||||
| 2H | Control n = 4 | Unpaired Student’s t test | Gonadal | Gsta3 | 0.019517318 |
| Vis-KO n = 4 | Tcf21 | 0.014978261 | |||
| Wt1 | 0.000632618 | ||||
| Ear2 | 0.009978141 | ||||
| Hoxa9 | 0.000427928 | ||||
| Tmem26 | 0.004299176 | ||||
| Zic1 | 0.034783957 | ||||
| 3A | Control n = 5 | Unpaired Student’s t test | gWAT | 0.000759641 | |
| Vis-KO n = 4 | rWAT | 0.001739073 | |||
| 3B | Control n = 5 | Cidea | 0.000155141 | ||
| Vis-KO n = 4 | Dio2 | 0.009600651 | |||
| Prdm16 (red bar) | 0.002457629 | ||||
| Prdm16 (blue bar) | 7.9394E-05 | ||||
| 3G | Control n = 5 | Unpaired Student’s t test | gWAT | Gsta3 | 0.044793954 |
| Vis-KO n = 4 | Resistin | 0.002421899 | |||
| Tmem26 | 0.011651978 | ||||
| 5A | Control n = 5 | Unpaired Student’s t test | gWAT | Ucp1 | 0.011438323 |
| Vis-KO n = 4 | rWAT | Ucp1 | 0.001188624 | ||
| 5B | Control n = 5 | Unpaired Student’s t test | rWAT | Cidea | 0.000780591 |
| Vis-KO n = 4 | Dio2 | 0.002682038 | |||
| Elovl3 | 0.01642267 | ||||
| Prdm16 (red bar) | 0.042213109 | ||||
| Prdm16 (blue bar) | 0.000810897 | ||||
| gWAT | Dio2 | 0.0221 | |||
| Prdm16 | 0.0127 | ||||
| 5L | Control n = 5 | Unpaired Student’s t test | t = 4 hr | 0.014972958 | |
| Vis-KO n = 4 | t = 5 hr | 0.035138826 | |||
| 6D | Control n = 7 | Unpaired Student’s t test | gWAT | Zfp423 | 0.002716658 |
| Vis-KO n = 6 | mWAT | Zfp423 | 0.042346922 | ||
| rWAT | Zfp423 | 0.018568608 | |||
| 6E | Control n = 7 | Unpaired Student’s t test | iWAT | Ucp1 | 0.002716658 |
| Vis-KO n = 6 | gWAT | Ucp1 | 0.042346922 | ||
| rWAT | Ucp1 | 0.018568608 | |||
| 6F | Control n = 7 | Unpaired Student’s t test | iWAT | Cidea | 0.044864901 |
| Vis-KO n = 6 | gWAT | Cidea | 0.011872021 | ||
| Prdm16 | 0.046343663 | ||||
| 6H | Control n = 4 | Unpaired Student’s t test | gWAT | 0.00648 | |
| Vis-KO n = 4 | |||||
| 6I | Control n = 4 | Unpaired Student’s t test | mWAT | 0.03908 | |
| Vis-KO n = 4 | |||||
| 6J | Control n = 4 | Unpaired Student’s t test | rWAT | 0.03982 | |
| Vis-KO n = 4 | |||||
| 7D | Control n = 4 | Unpaired Student’s t test | O2 Consumption | 24 hr | 0.020700477 |
| Vis-KO n = 5 | Dark | 0.006034333 | |||
| 7E | Control n = 4 | Unpaired Student’s t test | Heat Production | 24 hr | 0.022957861 |
| Vis-KO n = 5 | Dark | 0.007378241 | |||
| 7F | Control n = 4 | Unpaired Student’s t test | CO2 Production | 24 hr | 0.041576891 |
| Vis-KO n = 5 | Dark | 0.017964281 | |||
| 8A | Control n = 7 | Unpaired Student’s t test | t = 0 min | 0.043779825 | |
| Vis-KO n = 6 | t = 15 min | 0.004769743 | |||
| t = 30 min | 0.012903721 | ||||
| t = 60 min | 0.014915684 | ||||
| 8B | Control n = 7 | Unpaired Student’s t test | t = 0 min | 0.009873322 | |
| Vis-KO n = 6 | t = 30 min | 0.01583899 | |||
| 8C | Control n = 7 | Unpaired Student’s t test | t = 30 min | 0.0426 | |
| Vis-KO n = 6 | |||||
| 8D | Control n = 6 | Unpaired Student’s t test | Glucose Infusion Rate | 0.04689 | |
| Vis-KO n = 5 | |||||
| 8E | Control n = 6 | Unpaired Student’s t test | Hepatic Glucose Prod. | Basal | 0.039627397 |
| Vis-KO n = 5 | Clamped | 0.0346953 | |||
| 8F | Control n = 7 | Unpaired Student’s t test | Liver | Foxo1 | 0.046418578 |
| Vis-KO n = 6 | G6Pc | 0.024438785 | |||
| Pck1 | 0.047698079 | ||||
| 8G | Control n = 7 | Unpaired Student’s t test | TAG | 0.02449 | |
| Vis-KO n = 6 | |||||
| 8I | Control n = 4 | Unpaired Student’s t test | 2-DG Uptake | rWAT | 0.04023 |
| Vis-KO n = 5 | |||||
| 9B | Control n = 4 | Unpaired Student’s t test | Pdgfrβ cells | 1.1E-05 | |
| iMural-KO n = 5 | |||||
| 10C | Control n = 8 | Unpaired Student’s t test | gWAT | 0.00276 | |
| iMural-KO n = 6 | |||||
| 10I | Control n = 8 | Unpaired Student’s t test | t = 30 min | 0.003328841 | |
| iMural-KO n = 6 | t = 60 min | 0.048919491 | |||
| 10K | Control n = 8 | Unpaired Student’s t test | t = 15 min | 0.03752 | |
| iMural-KO n = 6 | |||||
| 10-S1C | Control n = 7 | Unpaired Student’s t test | gWAT | 7.8E-08 | |
| iMural-KO n = 7 | |||||
| 10-S1E | Control n = 8 | Unpaired Student’s t test | iWAT | Ucp1 | 0.015960549 |
| iMural-KO n = 6 | gWAT | Ucp1 | 0.005703268 | ||
| rWAT | Ucp1 | 0.011883251 | |||
| 10-S1F | Control n = 5 | Unpaired Student’s t test | iWAT | 0.00019253 | |
| Vis-KO n = 5 | gWAT | 0.042623514 | |||
| mWAT | 0.017424031 | ||||
| rWAT | 0.00228672 | ||||
Download links
A two-part list of links to download the article, or parts of the article, in various formats.
Downloads (link to download the article as PDF)
Open citations (links to open the citations from this article in various online reference manager services)
Cite this article (links to download the citations from this article in formats compatible with various reference manager tools)
Directing visceral white adipocyte precursors to a thermogenic adipocyte fate improves insulin sensitivity in obese mice
eLife 6:e27669.
https://doi.org/10.7554/eLife.27669


