Test of the 'glymphatic' hypothesis demonstrates diffusive and aquaporin-4-independent solute transport in rodent brain parenchyma
- University of California, San Francisco, United States
Figures
Figure 1 with 1 supplement
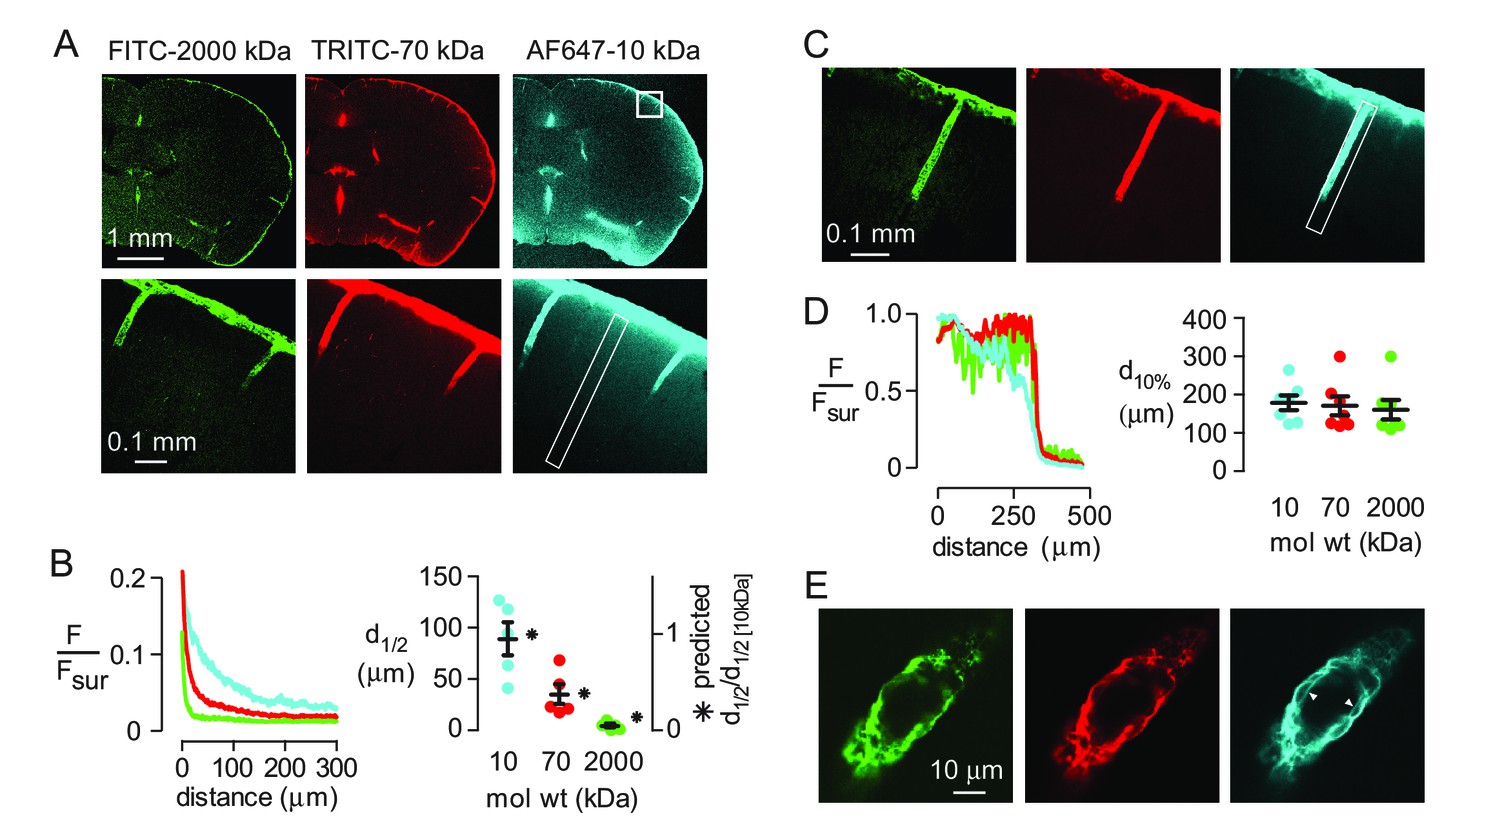
Strongly size-dependent penetration of dextrans into mouse brain from the subarachnoid space following intracisternal injection.
(A) Confocal images showing the distribution of 10, 70 and 2000 kDa fixable dextrans in brain 60 min after their co-injection into the cisterna magna. The lower panels show a higher magnification view of the boxed region in the top right panel. (B) (left) Profile of dextran fluorescence, normalized to fluorescence at the brain surface, as a function of distance from the cortical surface for the rectangular region shown in the lower right panel in A. (right) Cortical depth at which measured fluorescence intensity decreases to half its value at the cortical surface (d1/2, circles, left axis, n = 5 mice, black bars mean ± S.E.M.), and the relative distance that each fluorophore is predicted penetrate in 60 min by diffusion alone (asterisks, right axis). (C) Confocal image of brain cortex 60 min after cisternal injection showing fluorescence along the paravascular space of a penetrating arteriole. (D) (left) Relative fluorescence as a function of distance from the parenchymal surface in the paravascular space outlined on the right of C, measured for each dextran. (right) Distance at which fluorescence intensity decreases to 10% of its initial value (mean ± S.E.M., seven arterioles). (E) High magnification confocal slice through a cortical penetrating arteriole showing subtle differences in the distributions of 10, 70 and 2000 kDa fixable dextrans in the paravascular sheath at 60 min after cisternal injection.
Figure 1—figure supplement 1
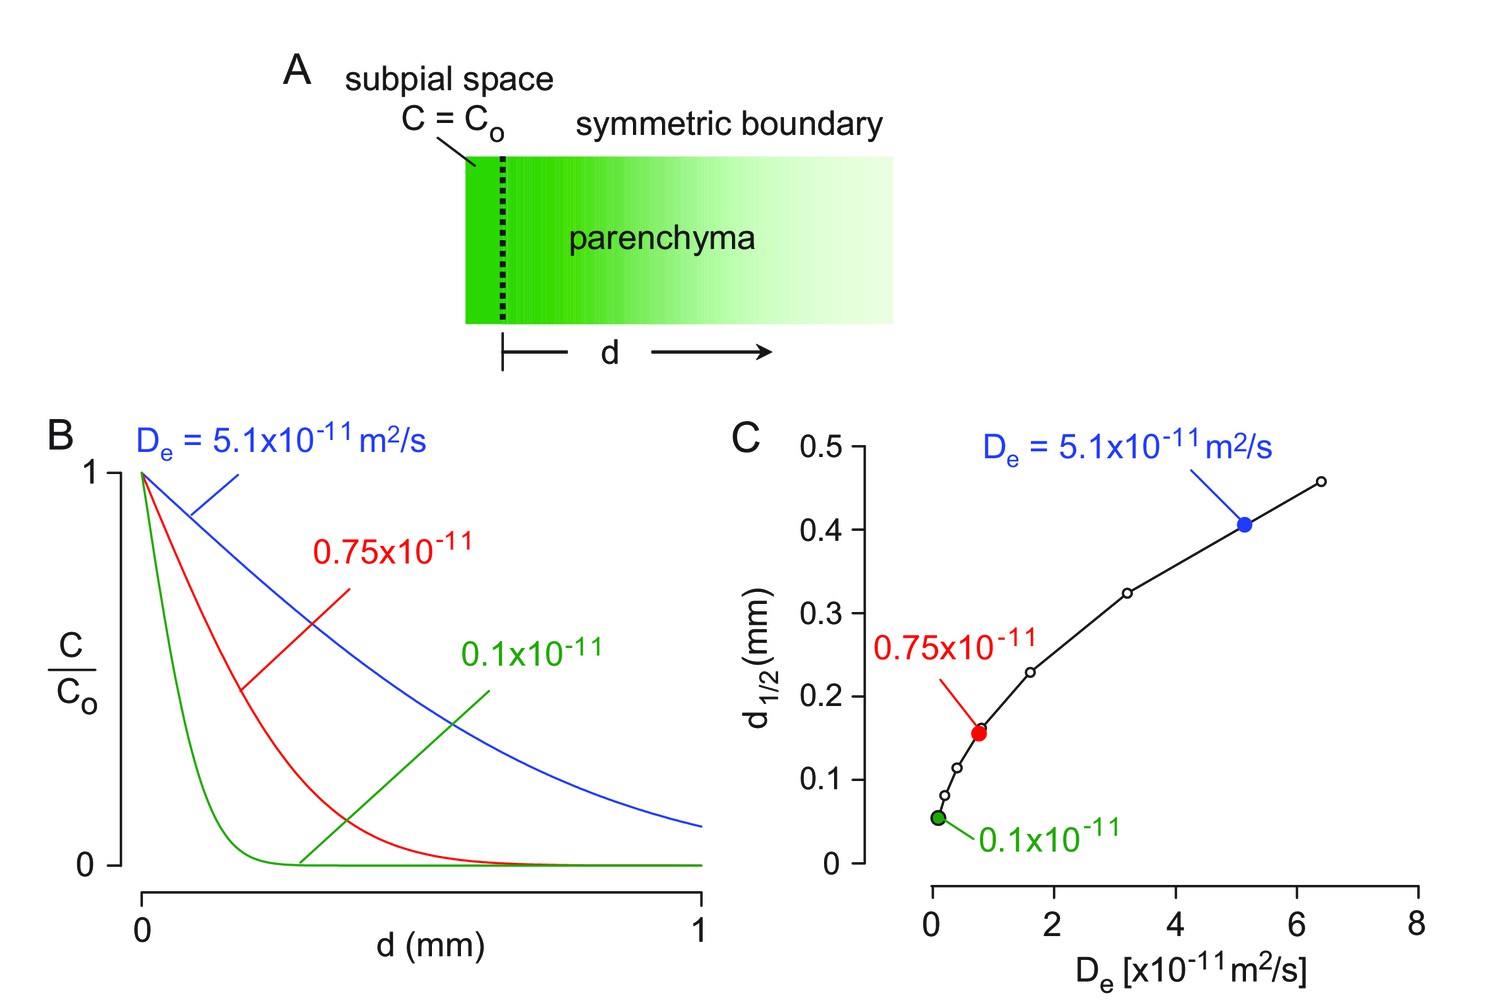
1-D diffusion modeling of solute transport from the subarachnoid into the brain parenchyma.
(A) Schematic of solute diffusion and mathematical boundary conditions. (B) Concentration profile over time based on equation 1 for indicated diffusion coefficients. (C) Distance at which concentration is reduced by 50% for the indicated diffusion coefficients.
Figure 2 with 1 supplement
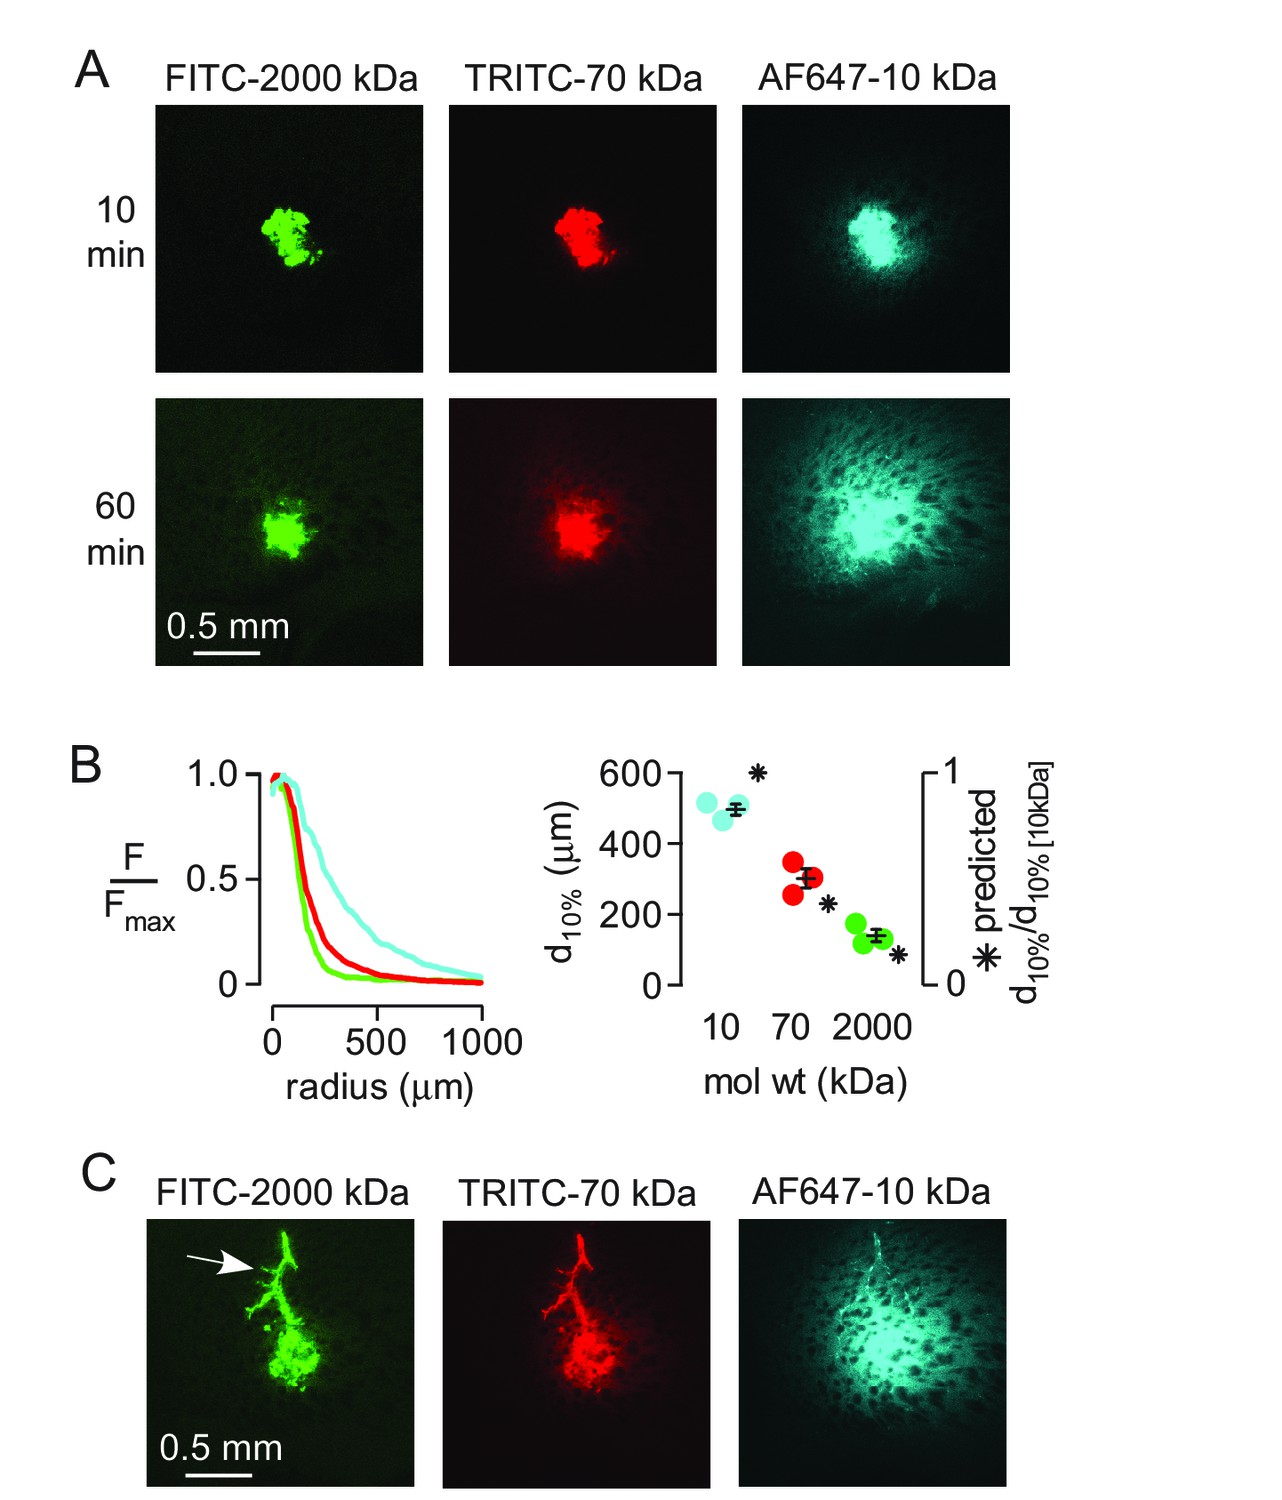
Strongly size-dependent transport of dextrans after direct injection into brain parenchyma.
(A) Confocal images showing the distribution of 10, 70 and 2000 kDa fixable dextrans at 10 and 60 min after coinjection into the striatum. (B) (left) Relative fluorescence of each dextran integrated over a circular region centered on the injection site, as a function of radial distance from the center, for the images shown in A. (right) Individual results and mean ± S.E.M. for three experiments showing the distance at which fluorescence decreases to 10% of that at the injection site for each dextran. Asterisks indicate the theoretical relative distance that would be expected for each dextran by diffusion alone. (C) Transport of injected dextrans into the paravascular space of vessels running through the injection site occurred independently of size.
Figure 2—figure supplement 1
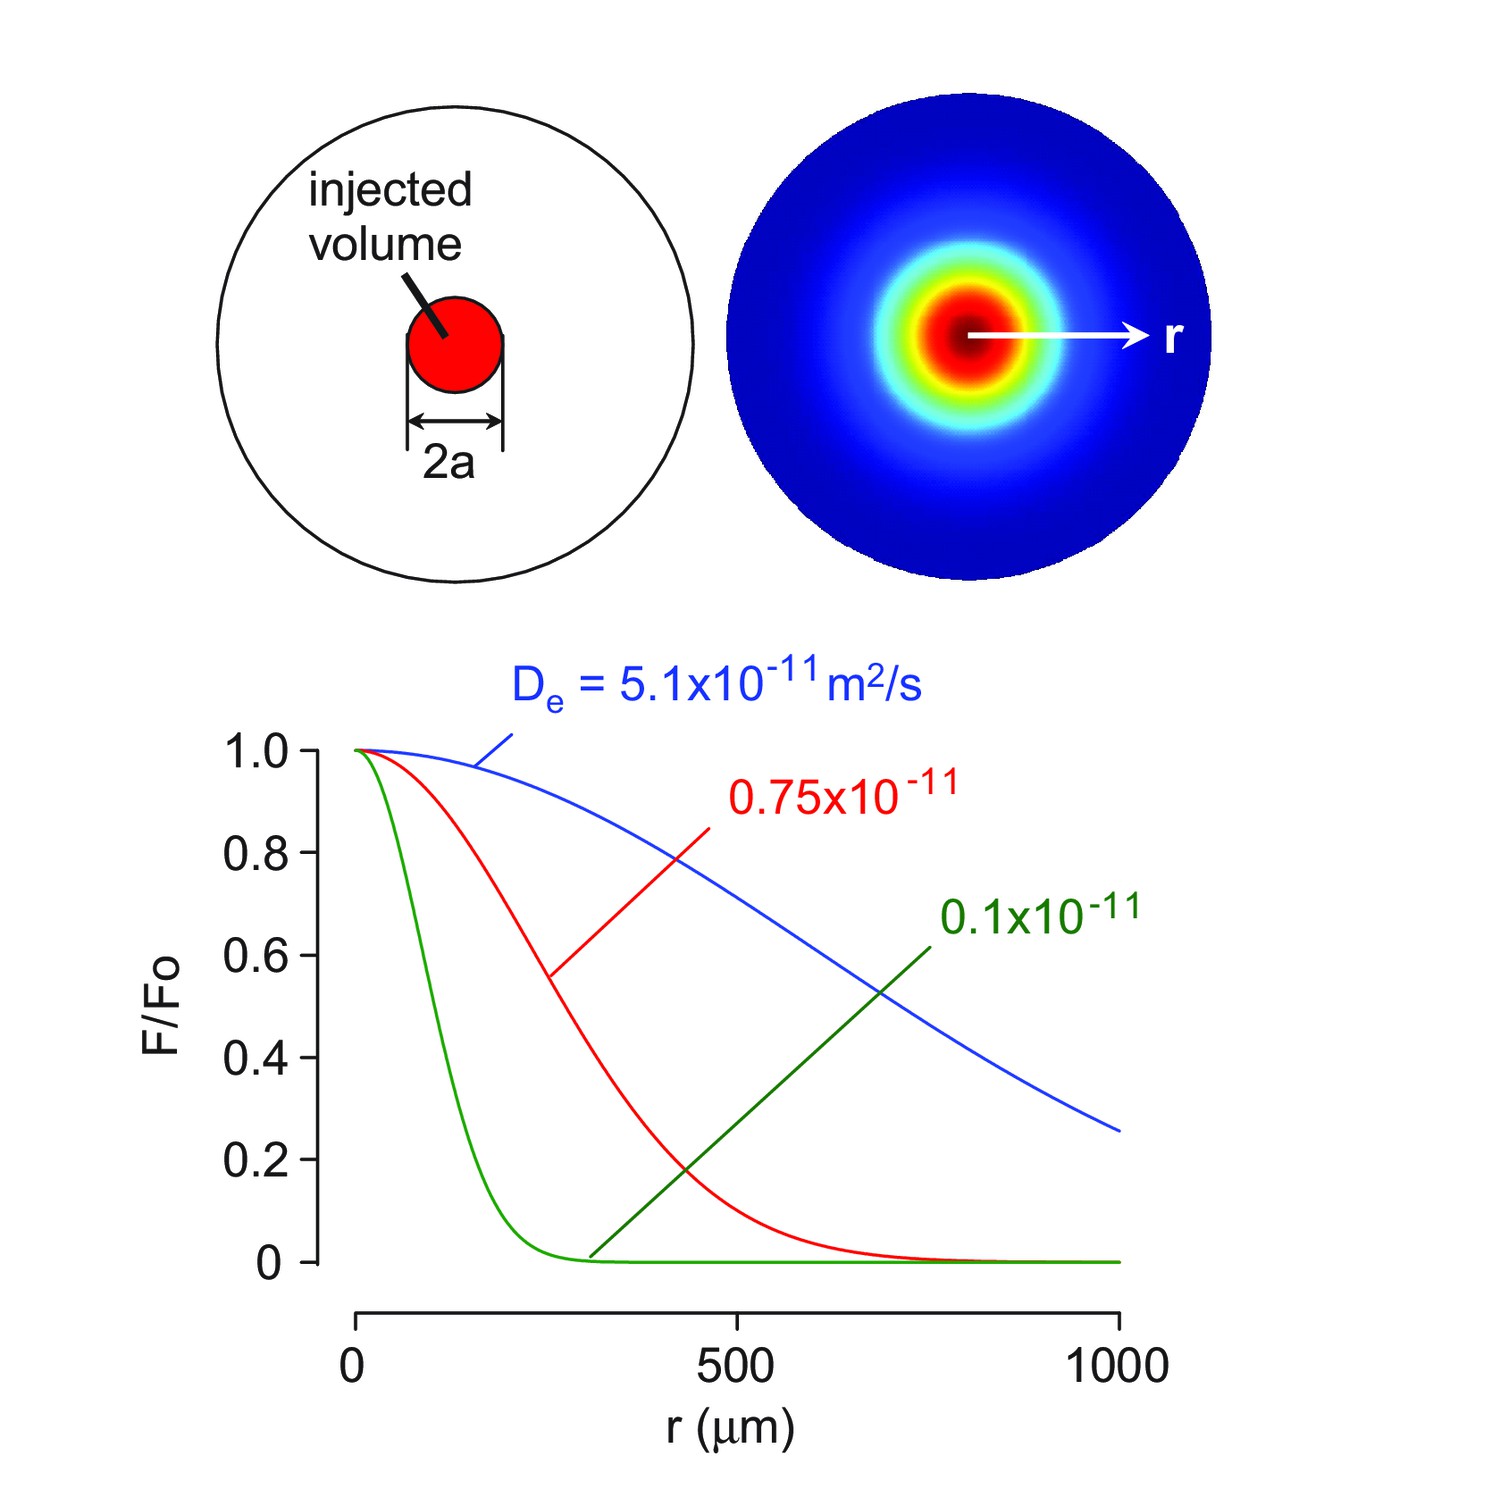
3-D diffusion modeling of solute transport in the brain cortex.
(A) Schematic of solute diffusion. (B) Concentration profiles over distance for indicated diffusion coefficients.
Figure 3 with 3 supplements

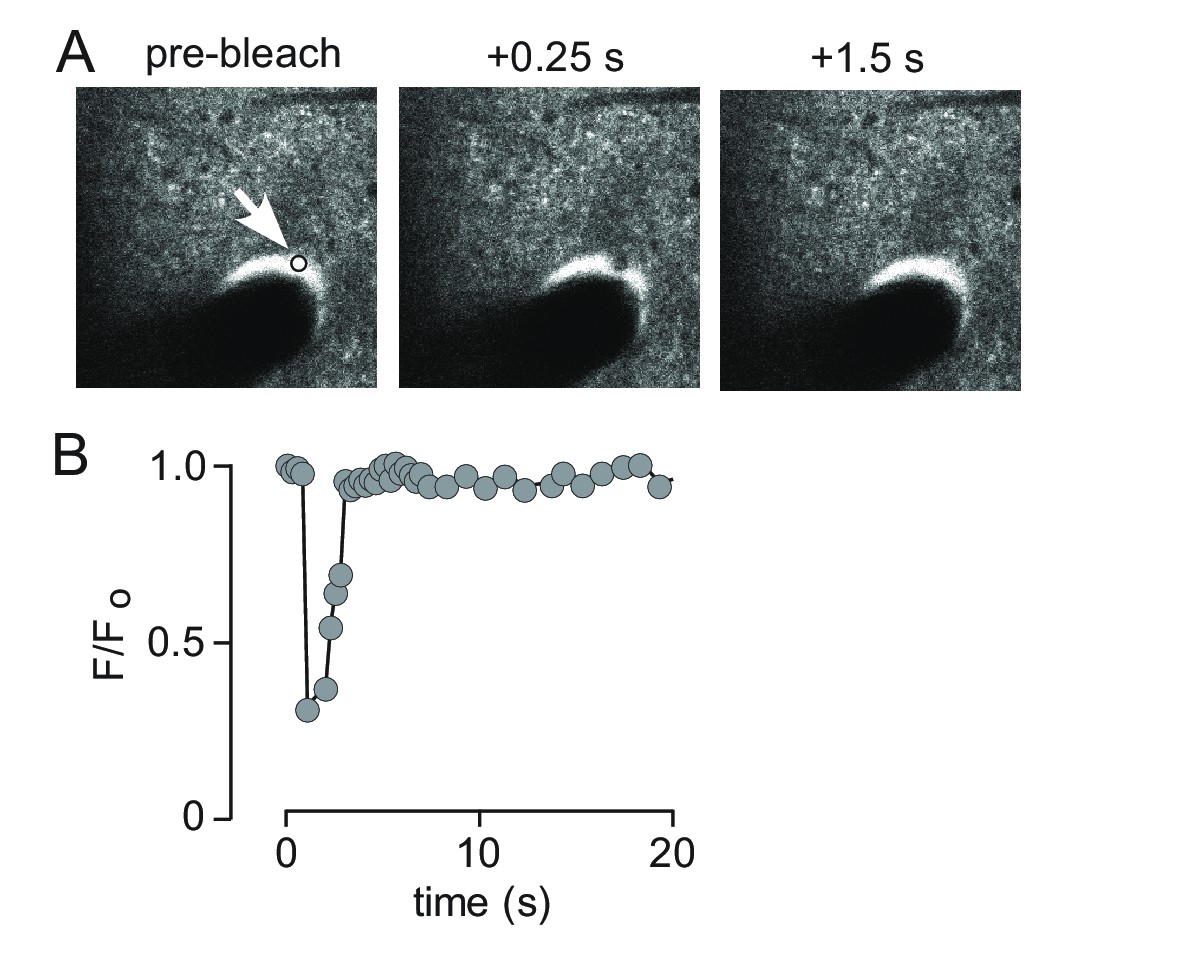
Two-photon photobleaching demonstrates non-directional solute transport in brain parenchyma.
(A) (left panel) Image of 500 kDa FITC-dextran in mouse cortex visualized by 2-photon fluorescence microscopy at a depth of 60 μm. (center panels) Photobleaching of a 10 μm diameter disk immediately adjacent to a penetrating arteriole showing partial recovery of fluorescence in the bleached region 20 s after bleaching. Images are pseudocolored for intensity. (right) Kinetics of fluorescence recovery in the bleached area. (B) Kinetics of fluorescence recovery within subdomains 1–4 of the original bleached area, showing spatially homogenous recovery. (C) Time course of fluorescence measured at different positions away from a nearby arteriole demonstrates confinement of bleached molecules to the initial bleaching area. (D) Positional tracking of the bleached area during recovery (left and center panels), and displacement over time (right panel).
Figure 3—figure supplement 1

Characterization of 2-photon photobleaching of 500 kDa FITC-dextran.
(A) Recovery curves following bleaching in disks from 5 to 80 μm in diameter measured in vitro. (B) Relationship between bleached disk size and recovery time constant for measurements done as in A. (C) Time constant of recovery following bleaching of a 40 μm diameter disk in vitro and in vivo.
Figure 3—figure supplement 2
Rapid solute transport in the paravascular space.
(A) Images of 500 kDa FITC-dextran in paravascular space before and following photobleaching show rapid recovery from deep bleaching. (B) Time course of fluorescence recovery following bleaching shown in A.
Figure 3—figure supplement 3
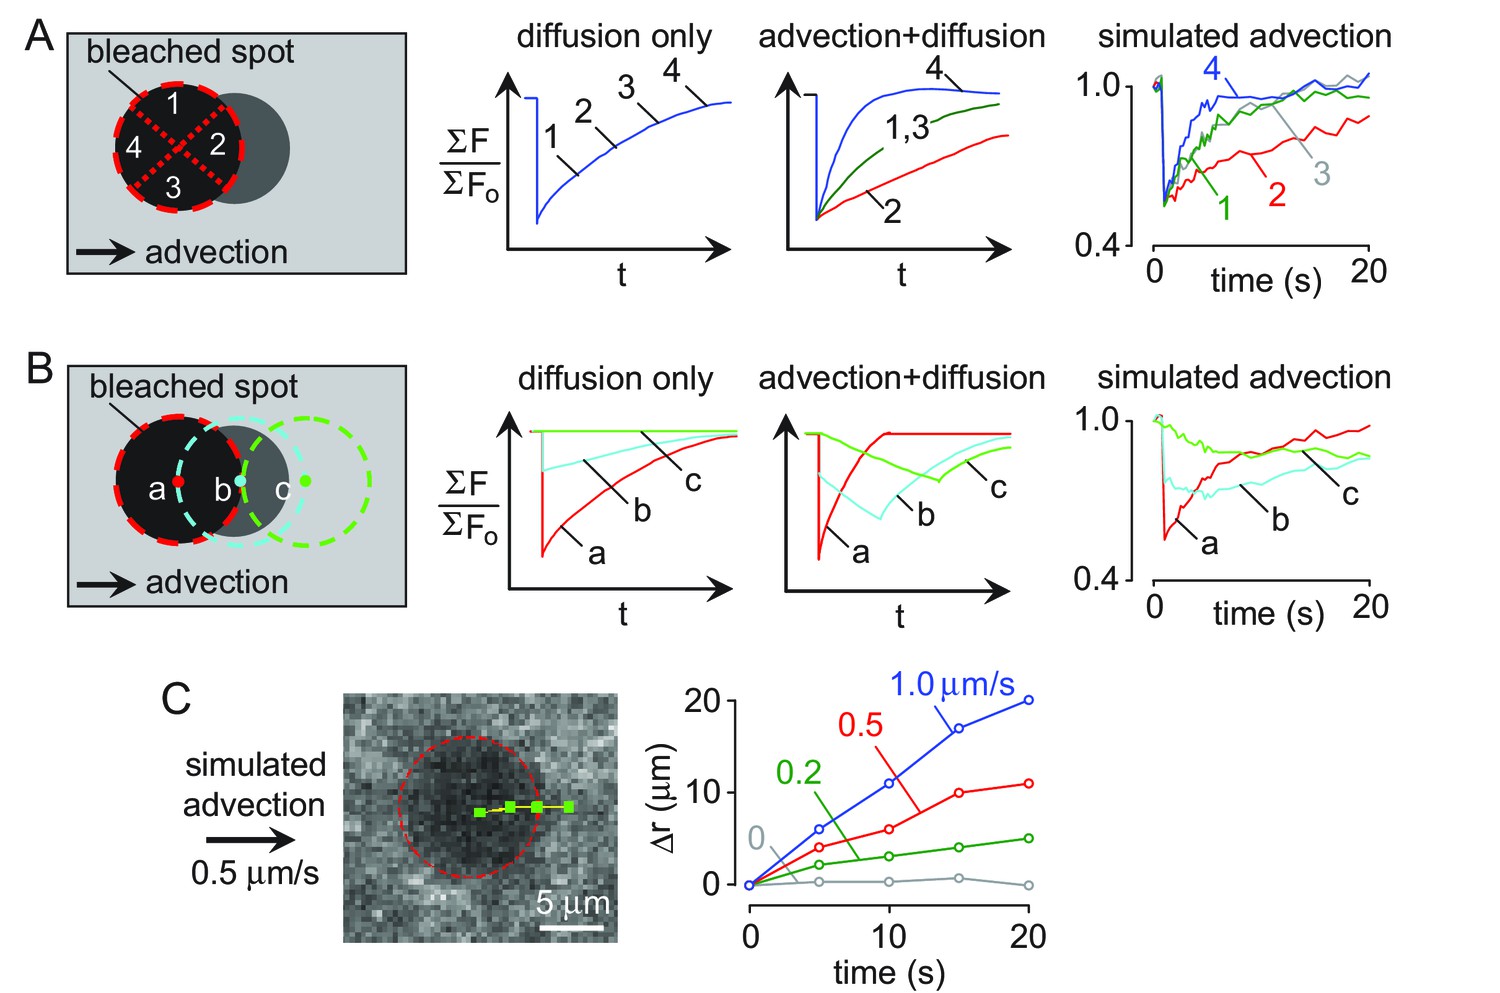
Quantification of convection verses diffusion from 2-photon photobleaching data.
(A). (left) Schematic of angle-segmened fluorescence recovery. (center) Schematic of fluorescence recovery profiles for four angle segments (each 90 degrees) from the center of mass of the bleached spot. (right) Angular average of fluorescence recovery by simulated convection generated by moving the experimentally recorded images at 0.5 μm/s. (B) (left) Schematic showing expected effect of convection on fluorescence in analysis regions along the direction of flow. (center) Simulated results in the presence of pure diffusion or convection at 0.5 μm/s. (right) Convection was simulated by moving the experimentally recorded images at 0.5 μm/s in the analysis regions. (C) (left) Detected center position of bleached area measured at 5 s intervals in the presence of simulated convection (0.5 μm/s). (right) Displacement of the bleached region in the presence of simulated convection (0, 0.2, 0.5 and 1 μm/s).
Figure 4

Effects of abrupt cessation of cardiac and respiratory pulsations on solute transport in brain parenchyma.
(A) Individual frames of a 10 μm diameter circular region (white circle) taken prior to (top panels), immediately following (middle panels) and 4 min after (bottom panels) cardiorespiratory arrest. (B) Fluorescence recovery curves for experiments as in A showing average of 2–3 trials done before (basal), at 1–3 min, or at 4–5 min following cardiorespiratory arrest. (C) Summary of fluorescence recovery half-times (t1/2) before and following cardiopulmonary arrest (mean ± S.E.M., 3 mice). Recovery half-time was not significantly different between baseline and 1–3 min. following cardiorespiratory arrest by t-test (p=0.78).
Figure 5 with 1 supplement
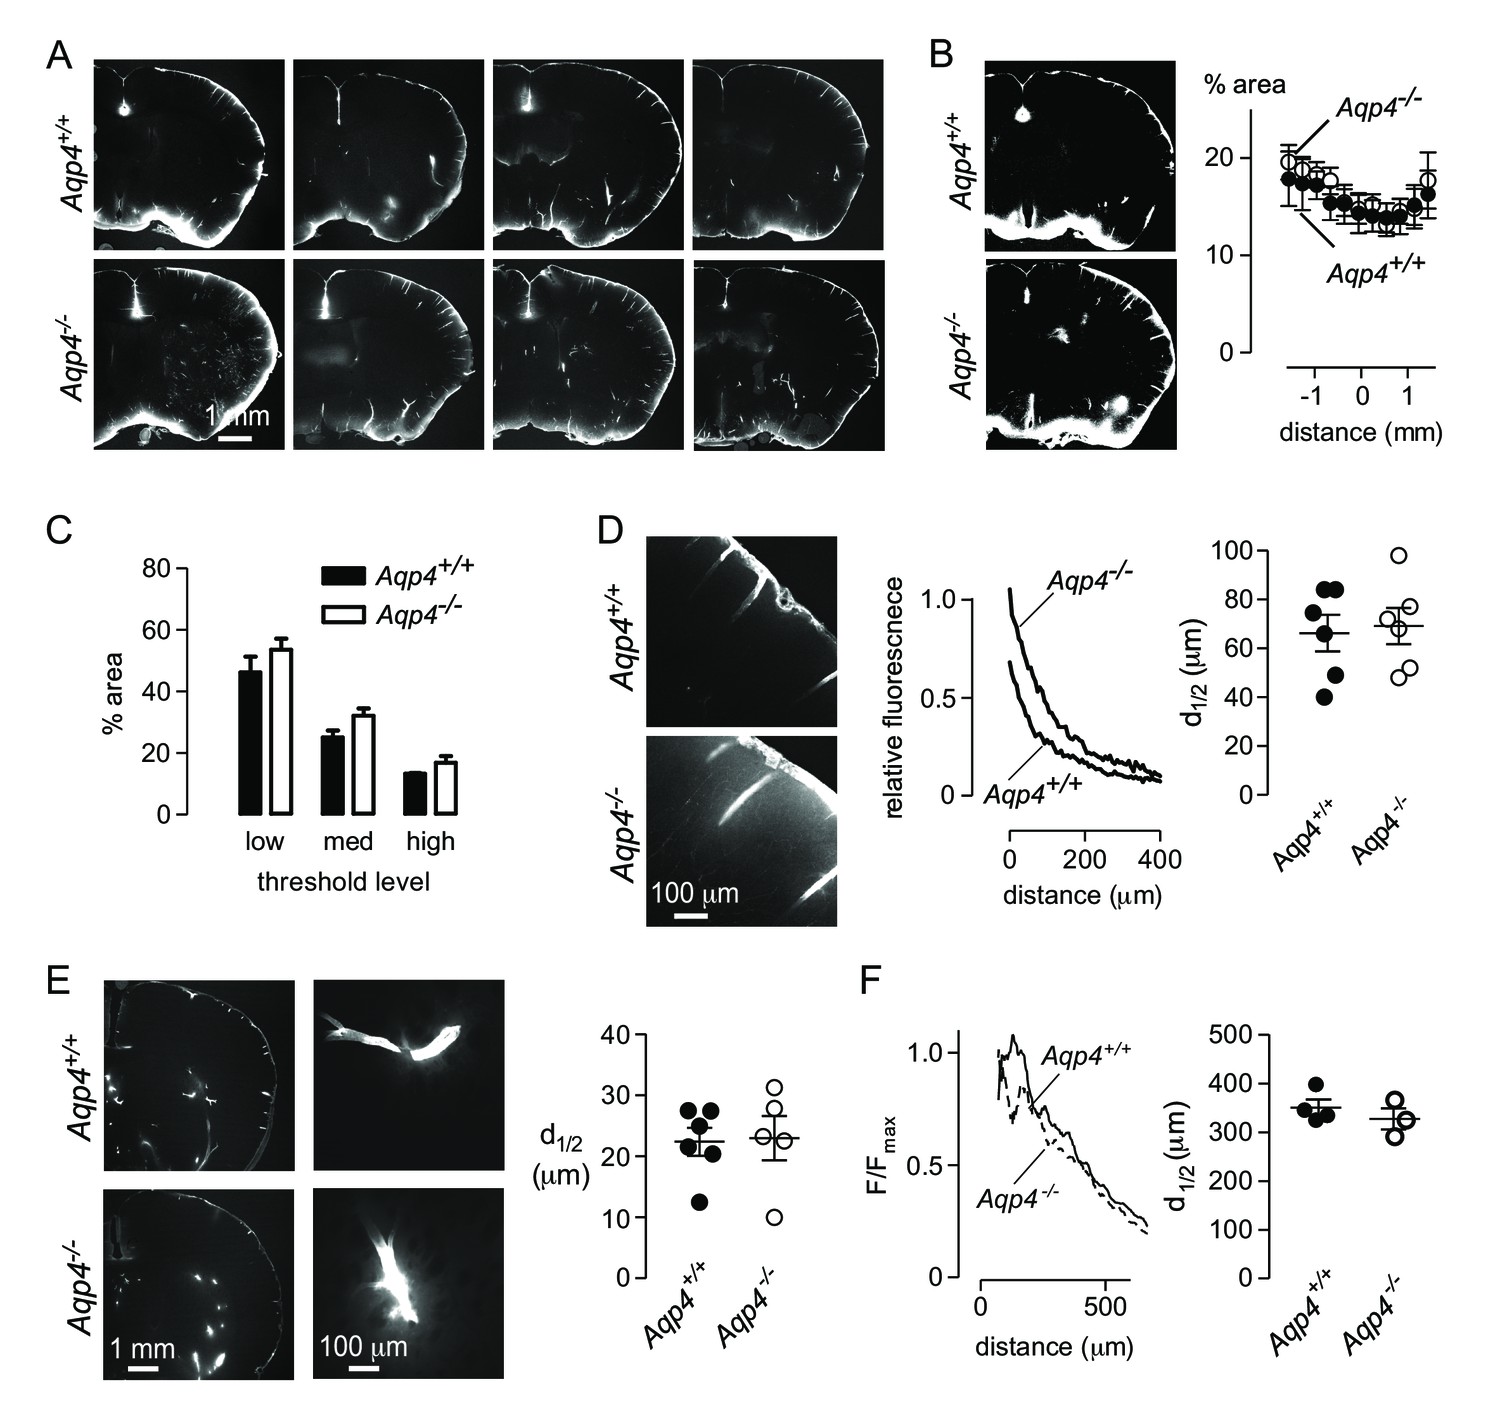
Aqp4 gene deletion does not impair penetration of fluorescent ovalbumin into brain parenchyma from the subarachnoid space.
(A) Fluorescence images of brain sections from Aqp4+/+ and Aqp4-/- mice that were fixed 30 min after injection of Alexa647-labelled ovalbumin into the cisterna magna, showing fluorescence in the paravascular spaces and parenchyma near the brain surface. (B) (left) Thresholding approach used to determine the fraction of the section containing labelled ovalbumin. (right) Fractional area of ovalbumin uptake for individual brain sections at indicated distances from the bregma (mean ± S.E.M., six mice per genotype, p=0.72 by two-way ANOVA). (C) Choosing different threshold levels for image analysis altered the area covered by fluorescence but did not reveal genotype-specific differences. (D) (left) Higher magnification images showing penetration of solute from the brain surface into the parenchyma in Aqp4+/+ and Aqp4-/- mice. (center) Fluorescence intensity as a function of distance from the surface, for the sections shown at left. (right) Average half-penetration distance of solute into the parenchyma from the brain surface in slices from six mice per genotype (mean ± S.E.M.). (E) (left) Distribution of Alexa 647-labelled ovalbumin at 30 min after injection into rat brain. (center) Movement of ovalbumin into the parenchyma from the para-arterial spaces. (right) Average half-distance moved by dye from the paravascular spaces into the striatal parenchyma for Aqp4+/+ (n = 6) and Aqp4-/- (n = 5) rats (mean ± S.E.M.). (F) Distribution of Aβ1-40 following interparenchymal injection in Aqp4+/+ and Aqp4-/- mice. (Left) Average fluorescence intensity of HiLyte-647 Aβ1-40 as a function of radial distance from the injection site. (Right) Distance at which fluorescence decreases to 50% of its value at the center of the injection site (4 Aqp4+/+ mice; 3 Aqp4-/- mice; p=0.42 by t-test).
Figure 5—figure supplement 1
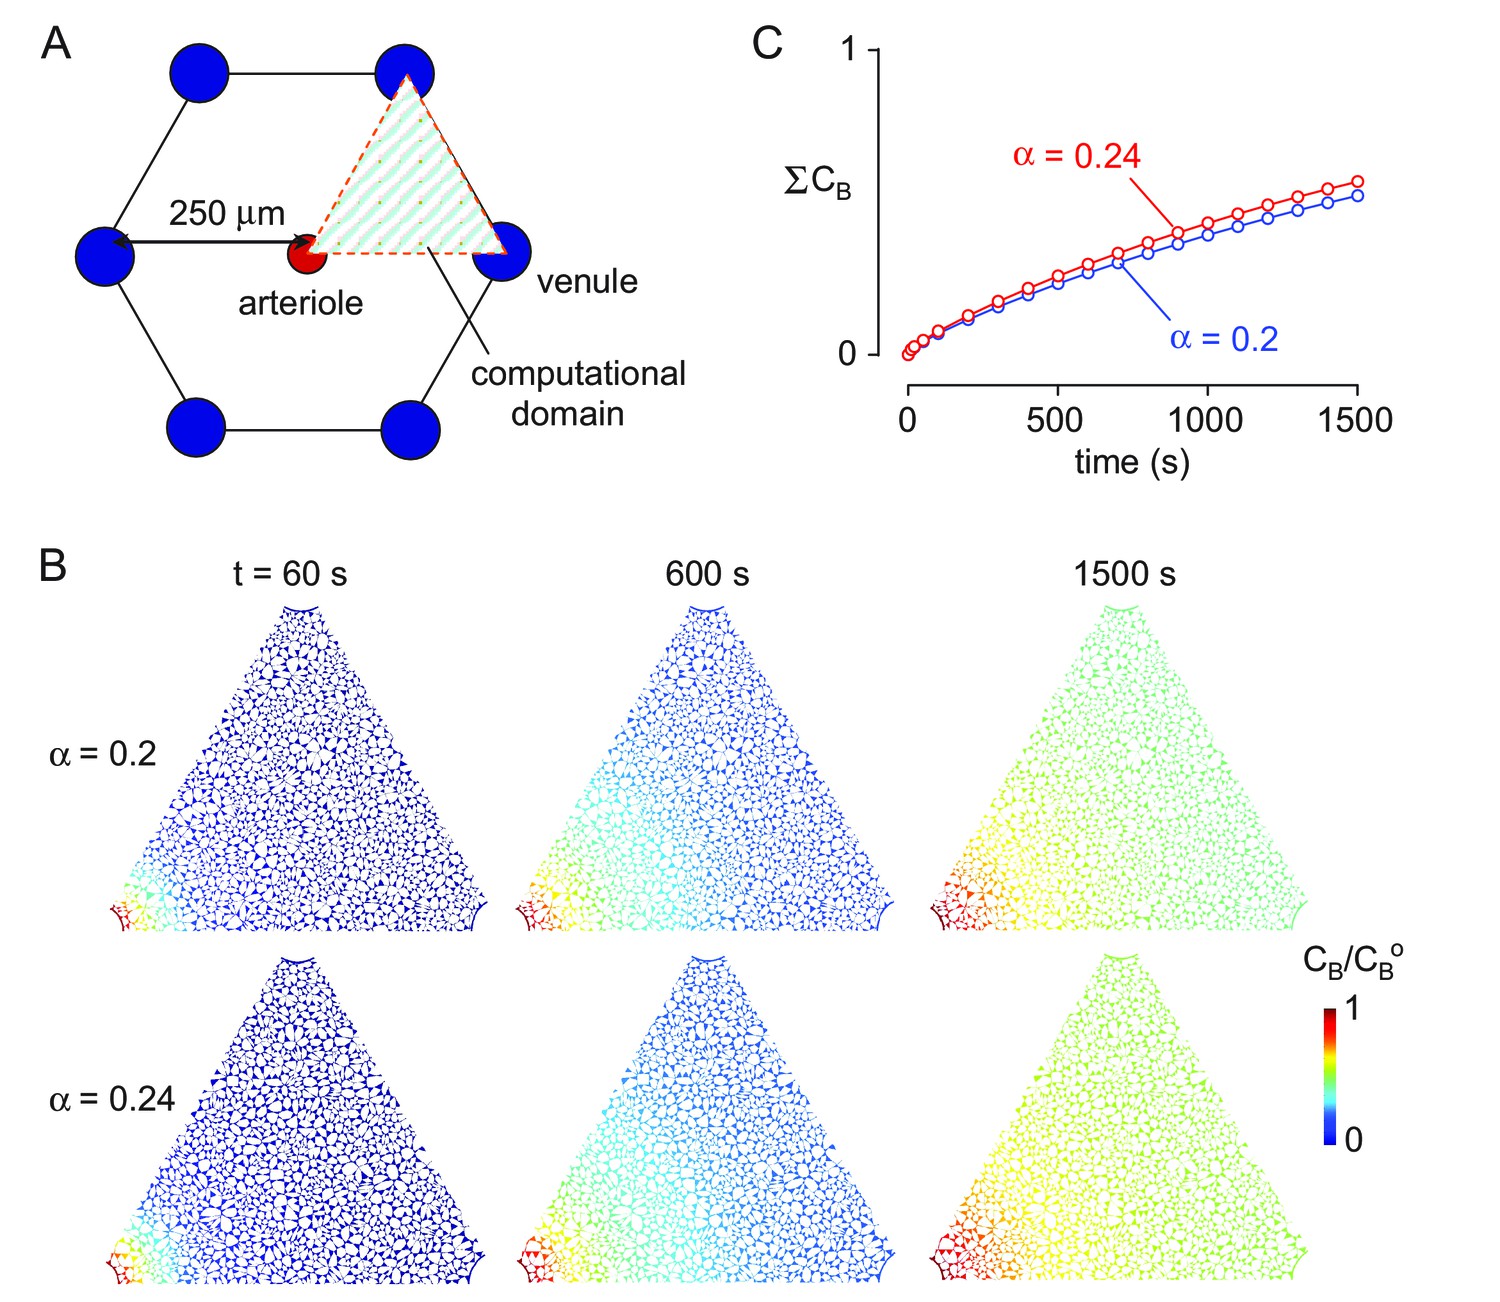
Computation of solute transport in brain parenchyma for different ECS volume fractions.
(A) (left) Hexagonal spatial arrangement of arterioles and venules (in rodent brain parenchyma) showing triangular computational domain (right) with one arteriole and two venules. (B) Pseudocolored images showing tracer solute accumulation in ECS for indicated ECS volume ratio. Parameters: Pf = 0.04 cm/s, D = 10−10 m2/s. (C) Kinetics of tracer solute accumulation in ECS for indicated ECS volume ratio.
Videos
Video 1
Photobleaching and fluorescence recovery for 150 kDa FITC-dextran under baseline conditions (corresponds to top panels in Figure 4A).
Arrow indicates bleached region.
Video 2
Photobleaching and fluorescence recovery for 150 kDa FITC-Dextran immediately following cardiorespiratory arrest (note the absence of image jitter caused by heartbeat).
Corresponds to middle panels in Figure 4A. Arrow indicates bleached region.
Video 3
Photobleaching and fluorescence recovery 3 min after cardiorespiratory arrest and subsequent swelling due to anoxic spreading depolarization.
Arrow indicates bleached region.
Video 4
Photobleaching and fluorescence recovery 4 min after cardiorespiratory arrest demonstrates very slow fluorescence recovery in swollen brain.
Corresponds to bottom panels in Figure 4A. Arrow indicates bleached region.
Additional files
-
Transparent reporting form
- https://doi.org/10.7554/eLife.27679.017
Download links
A two-part list of links to download the article, or parts of the article, in various formats.
Downloads (link to download the article as PDF)
Open citations (links to open the citations from this article in various online reference manager services)
Cite this article (links to download the citations from this article in formats compatible with various reference manager tools)
Test of the 'glymphatic' hypothesis demonstrates diffusive and aquaporin-4-independent solute transport in rodent brain parenchyma
eLife 6:e27679.
https://doi.org/10.7554/eLife.27679


