Causal role for the subthalamic nucleus in interrupting behavior
- University of California, San Diego, United States
Figures
Figure 1 with 1 supplement
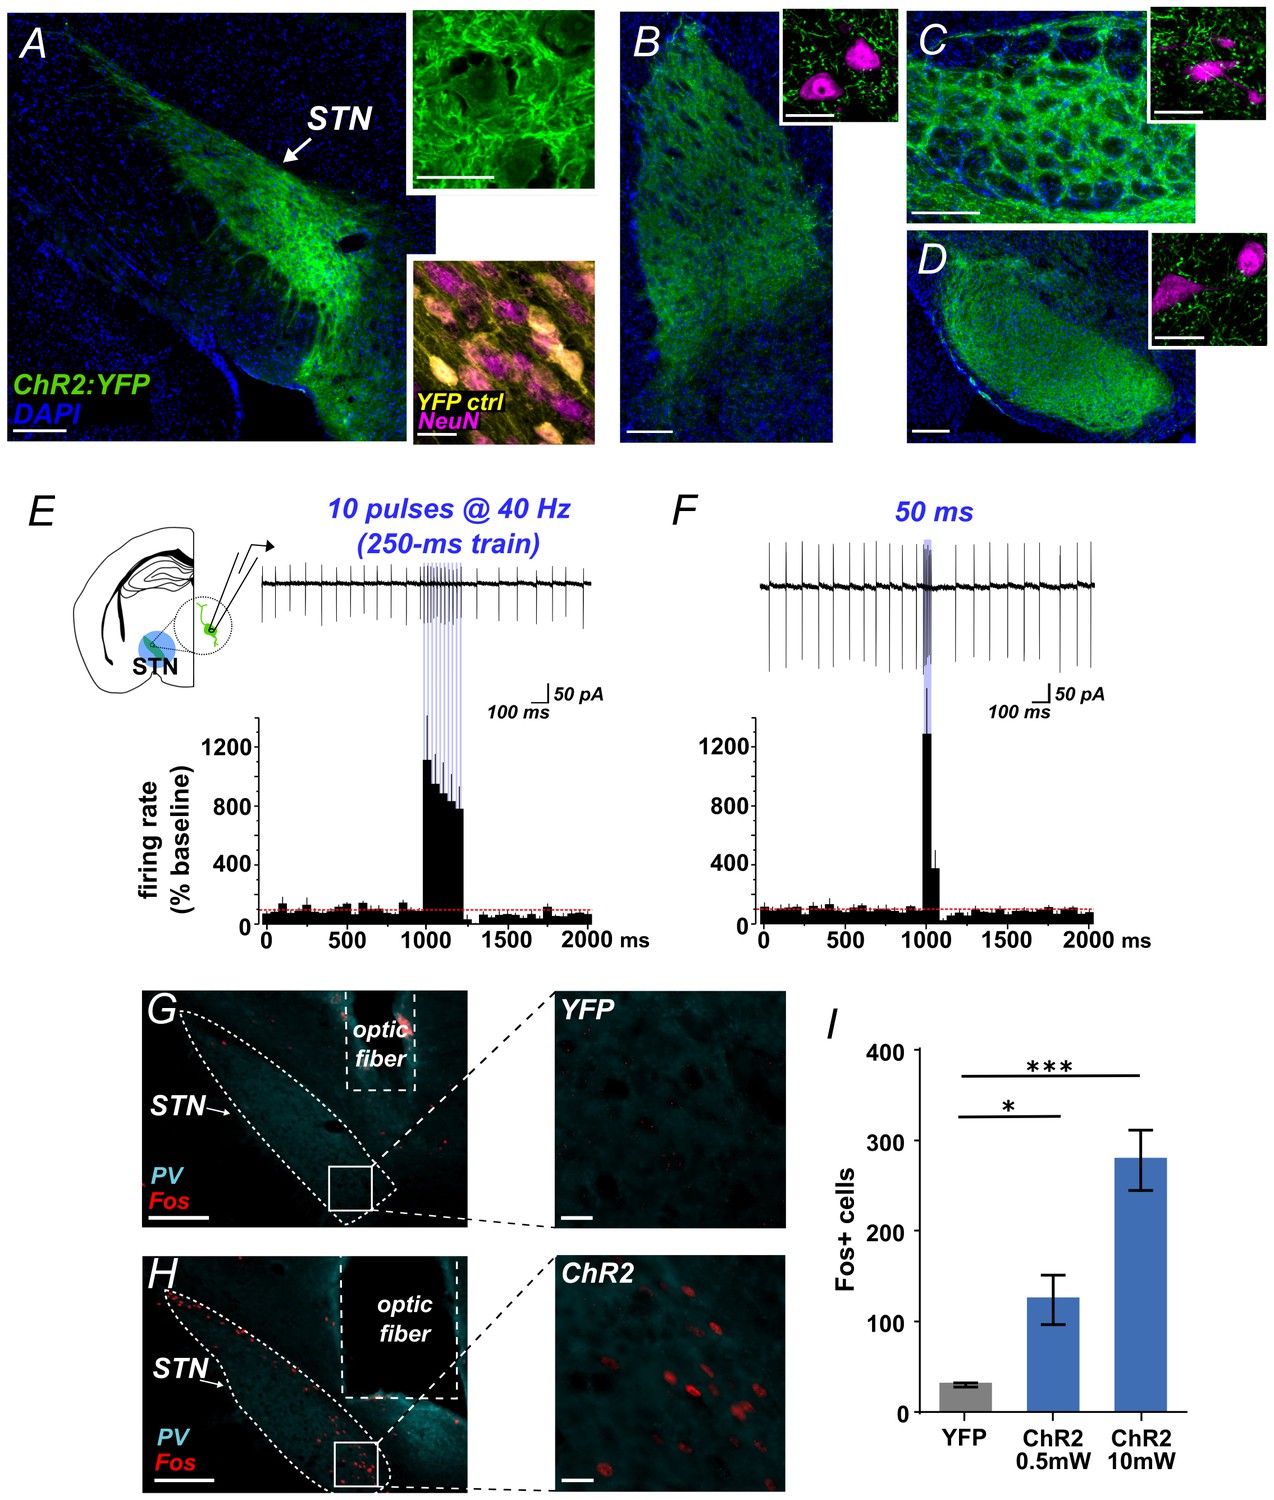
Functional photoactivation of STN projection neurons.
(A) Image of coronal sections showing native ChR2:YFP fluorescence (green) in VGLUT2-Cre STN neurons; scale, 200 μ. High-magnification insets of ChR2:YFP (top) or YFP control (bottom) expression in STN cell bodies with co-labeling for nuclear marker (DAPI, blue or NeuN, pink); scale, 20 μ. Images through STN terminal fields in (B) GPe, (C) EP, and (D) SNr; scales as in A. (E) Example cell-attached recordings of action potentials from ChR2-expressing STN neuron in response to 10 ms blue light pulses at 40 Hz, or (F) a single 50 ms blue light pulse. Histograms show % change in firing rate from a 1 s pre-stim baseline, n = 6 cells. (G) Example low- and high-magnification images show Fos immunolabeling in STN of YFP-control or (H) ChR2-expressing mice following in vivo photostimulation of STN (10 mW). Parvalbumin (PV) was used to delineate STN; scale 200 μ and 20 μ. (I) Fos-labeled cells are more abundant in ChR2:YFP-expressing STN compared to YFP control; n = 3-4 mice; unpaired t-test: t = 3.4, *p<0.05; t = 8.8, ***p<0.001.
Figure 1—figure supplement 1
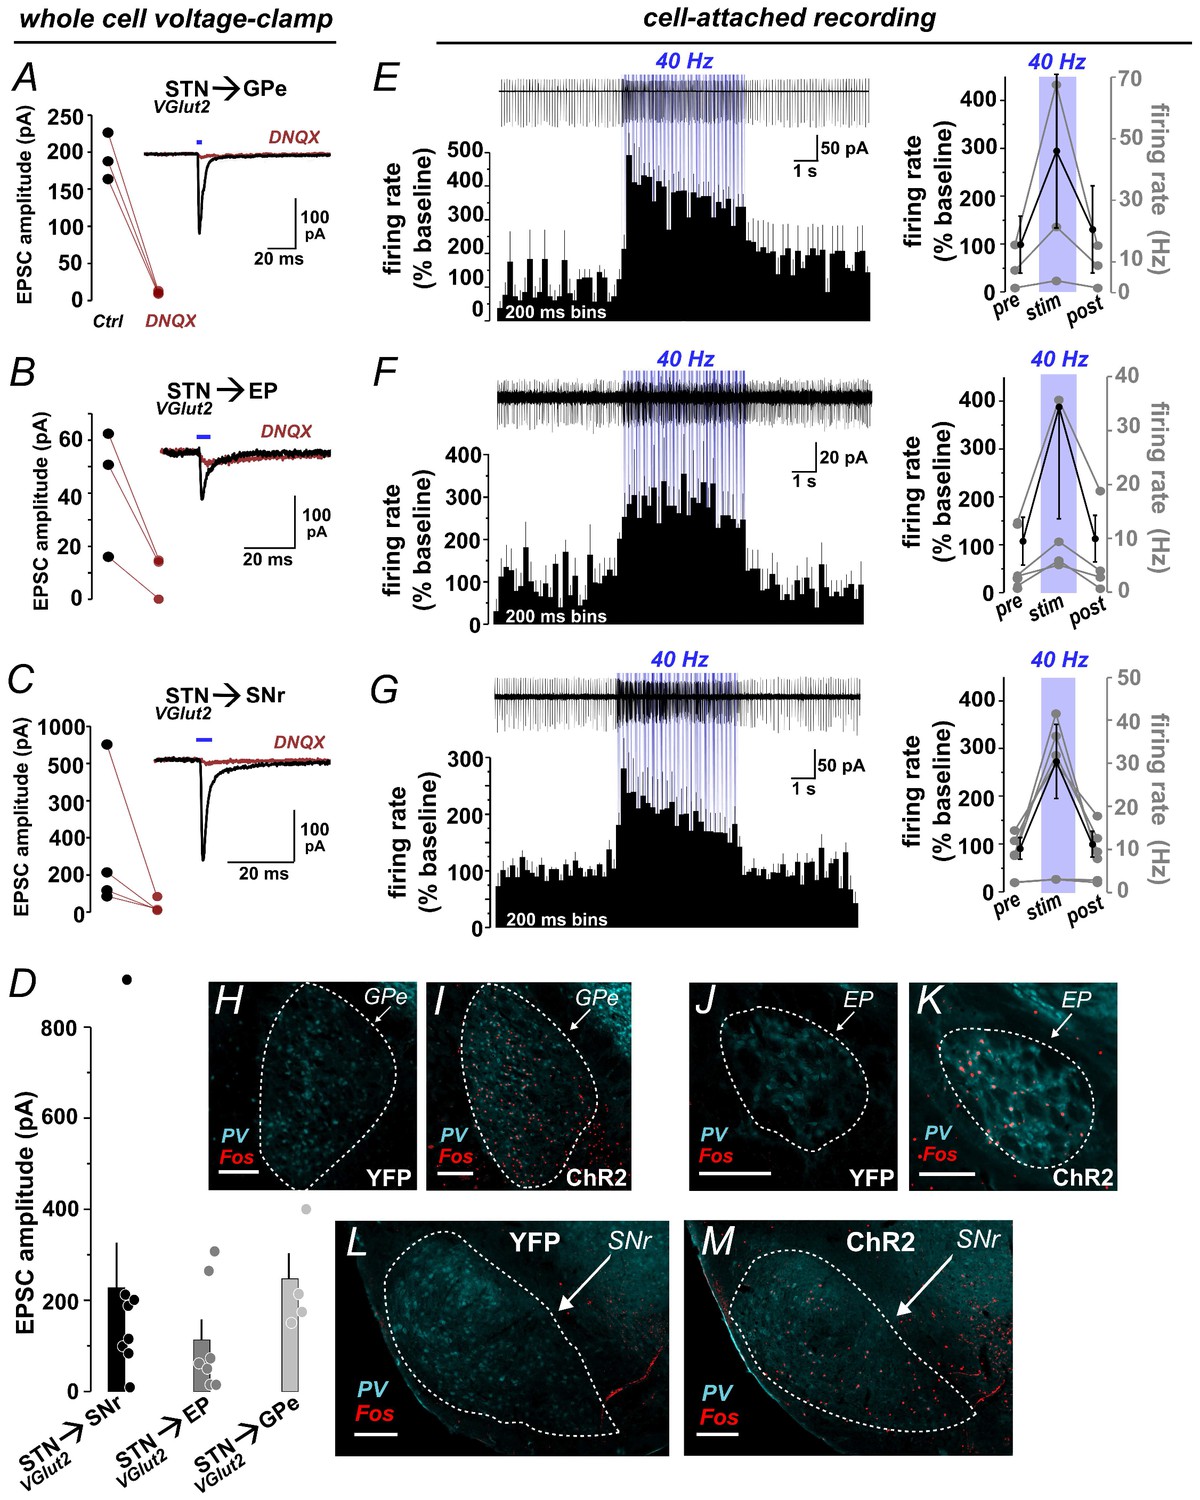
Functional photoactivation of STN targets.
(A) Voltage-clamp recordings from GPe, (B) EP, and (C) SNr neurons show DNQX-sensitive EPSCs evoked by 5 ms blue light pulses to activate ChR2:mCherry+ STN terminals. Line plots represent EPSC amplitudes from individual cells before/after DNQX, insets show example traces. (D) Bar graph shows mean ± SEM EPSC amplitudes and points represent individual cells. (E) Cell-attached recording from GPe, (F) EP, and (G) SNr show increased firing of postsynaptic cells during 5 s photostimulation at 40 Hz; top show example traces at top; bottom show histograms with % change from 5 s pre-stim baseline (n = 3 GPe, 4 EP, 6 SNr cells); right show % change (black) and firing rates (grey) summed over 5 s pre-stim, stim, and post-stim periods. Example images through (H, I) GPe, (J, K) EP, and (L, M) SNr show Fos immunolabeling in STN of YFP-control or ChR2:YFP-expressing mice following in vivo photostimulation of STN (10 mW); PV was used to delineate nuclei; scale 200 μ.
Figure 2 with 2 supplements
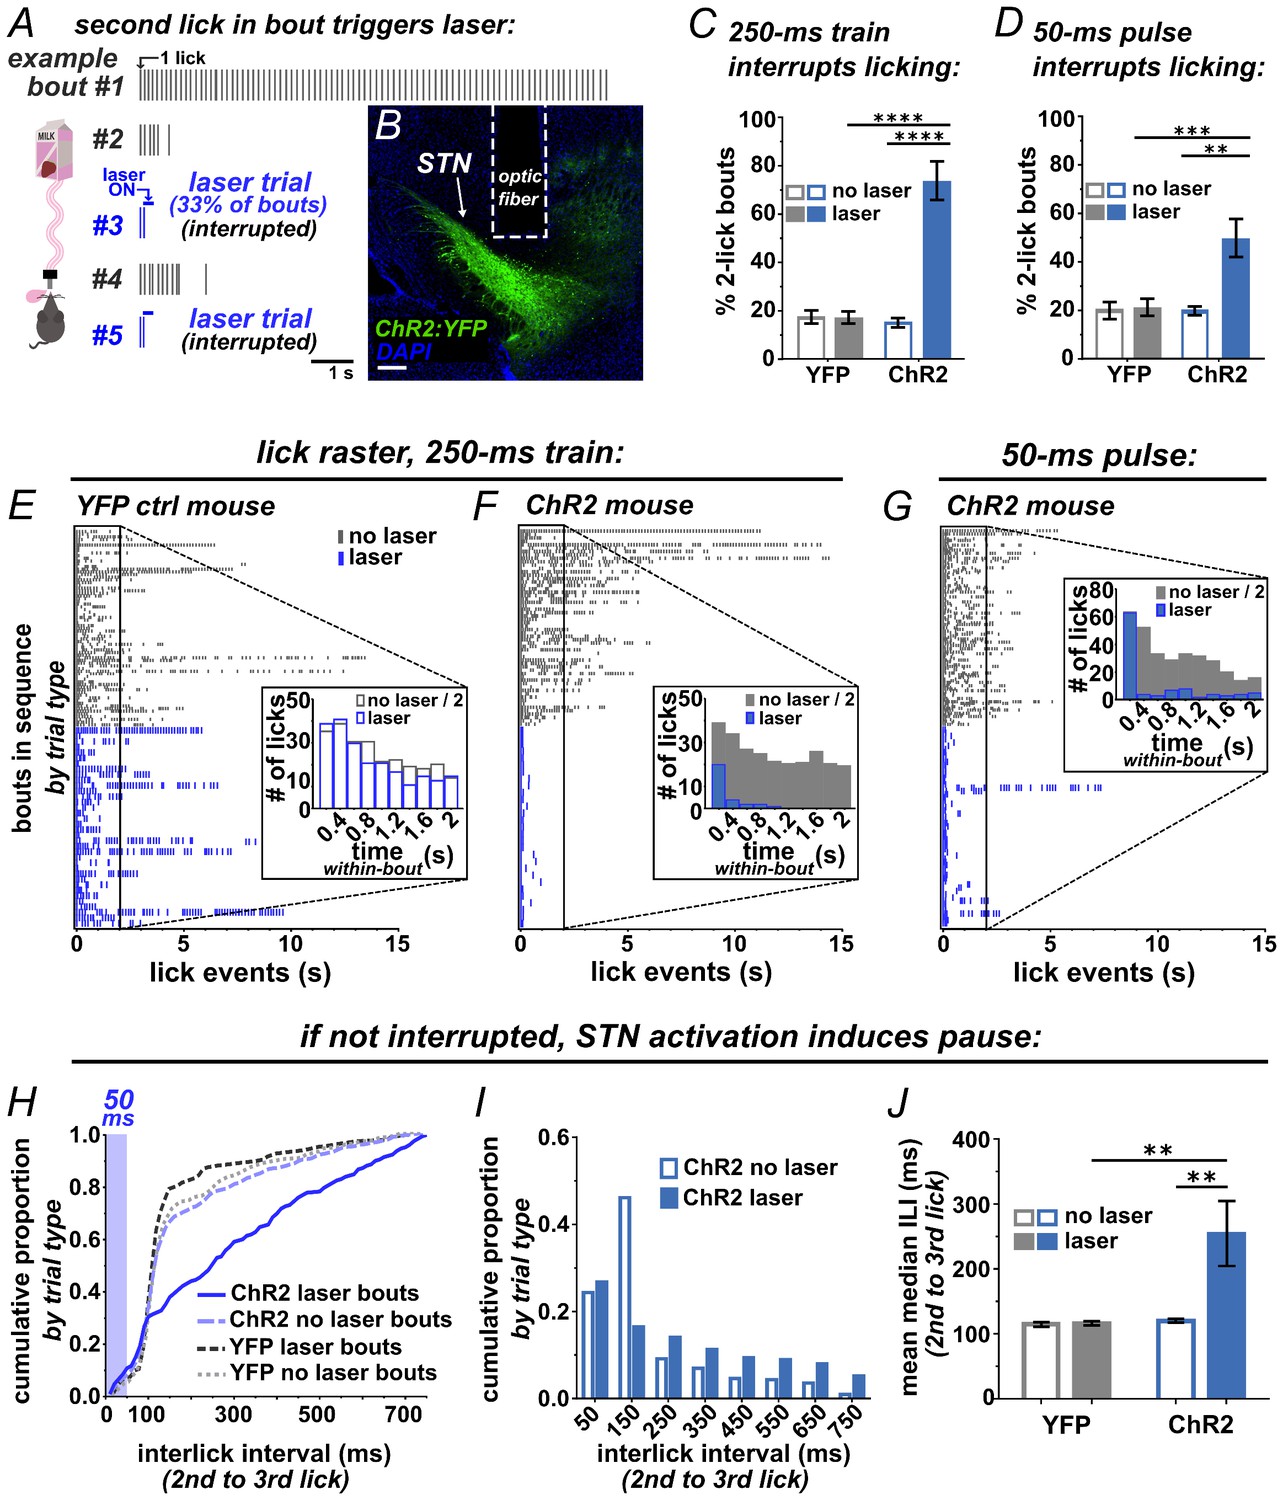
Brief optogenetic activation of STN rapidly interrupts licking.
(A) Schematic of task, mice were provided 30 min daily access to palatable strawberry-milk and licks and bouts are recorded using contact lickometers. On one third of bouts within a given session, blue light photostimulation was delivered in response to the second lick of the bout. Vertical dashes represent licks within bouts of example animal. Horizontal dashes in laser trials represent timing of light delivery. (B) Coronal section showing unilateral ChR2:YFP expression in STN and optic fiber placement; scale 200 μ. (C) In ChR2:YFP mice, but not YFP controls, laser photostimulation (ten 10 ms 10 mW pulses at 40 Hz) increased the fraction of bouts that stop at precisely 2 licks (n = 8 YFP, n = 10 ChR2 mice; RM-ANOVA, treatment x stimulus interaction F1,16 = 31.6, p<0.0001; Sidak posthoc ****p<0.0001. (D) Similar results were observed with animals subjected to a single 50 ms photostimulus (n = 8 YFP, n = 10 ChR2 mice, RM-ANOVA, treatment x stimulus interaction F1,16 = 7.0, p<0.05; Sidak posthoc ***p<0.001, **p<0.01. (E) Example raster plots of licks within bout from YFP-control or (F, G) ChR2-expressing mice; insets show frequency distribution of licks in first 2 s of all bouts [Note that ‘no-laser’ values were divided by two to account for 2:1 ratio of trial type]. (H) In bouts that were not interrupted (>2 licks), 50 ms photostimulation led to a shift in the ILI distribution between the second and third licks in ChR2 mice; Kolmogorov-Smirnov (KS), p<0.0001. (I) This pause in licking was most apparent between 100–200 ms (100 ms bins) and (J) led to an increase in the mean median ILI between second and third licks; n = 8 YFP, n = 10 ChR2 mice; RM-ANOVA, treatment x stimulus interaction F1,16 = 5.4, p<0.05; Sidak posthoc **p<0.01.
Figure 2—figure supplement 1
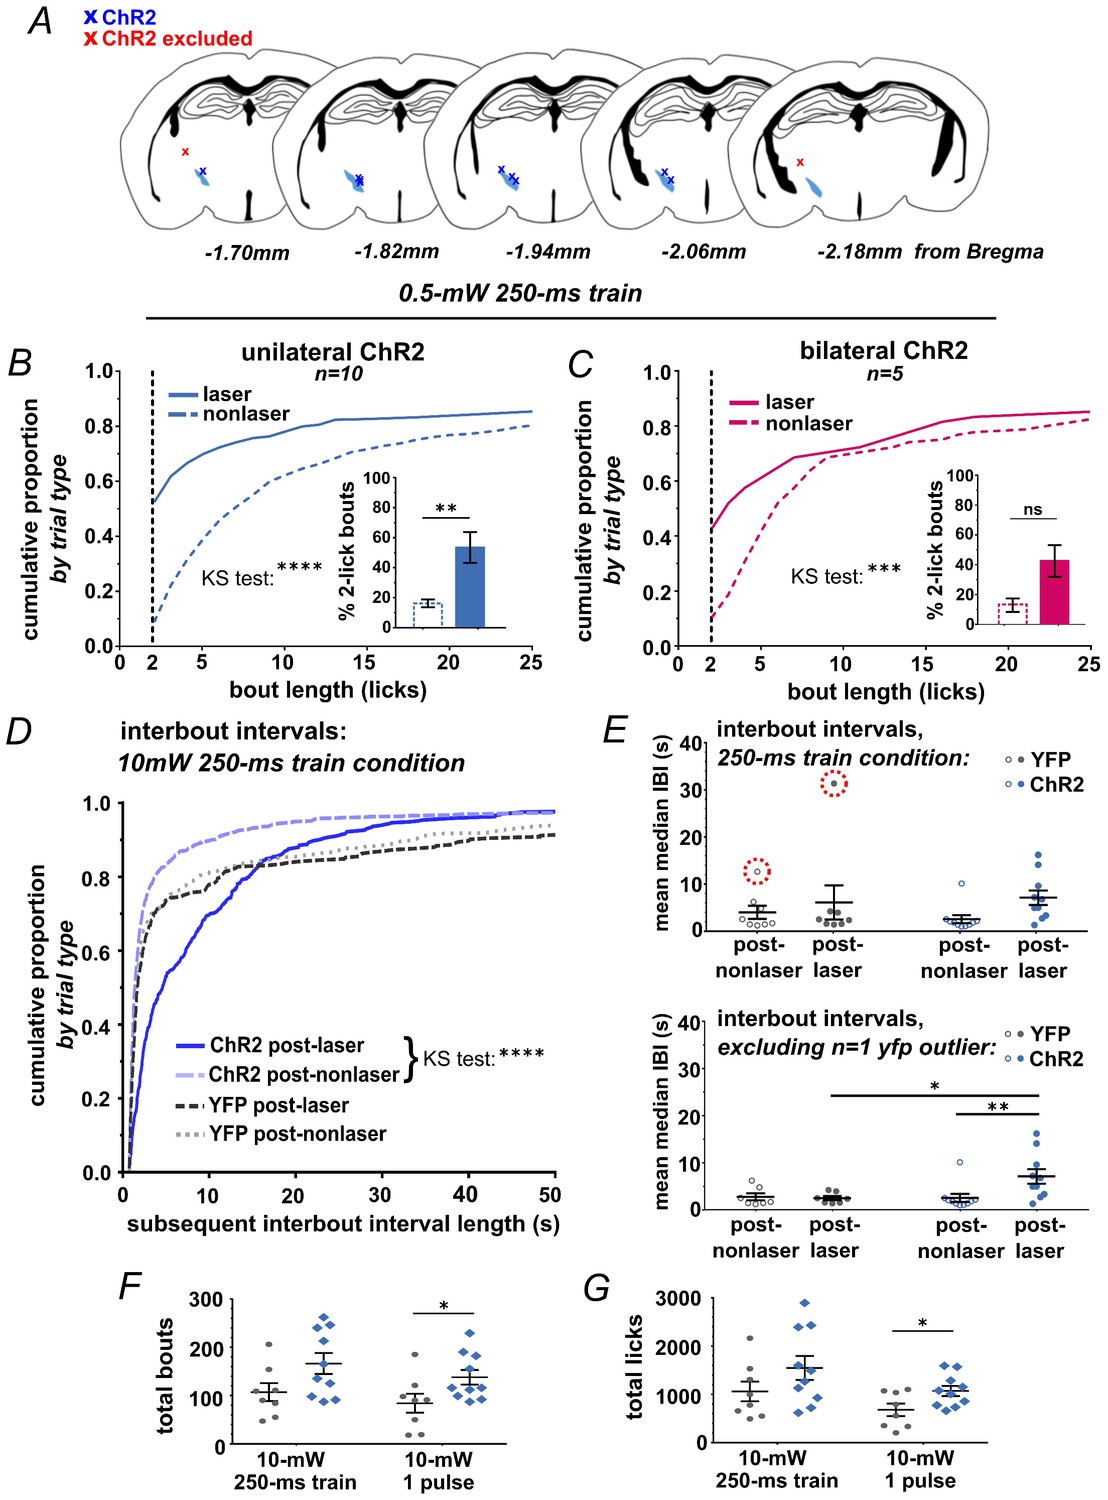
Optic fiber placements and effect of STN photostimulation on licking.
(A) Schematic illustrating location of unilateral optic fiber placements in STN of ChR2:YFP-expressing mice. (B) In ChR2:YFP but not control mice, reduced power unilateral (n = 10) or (C) bilateral (n = 5) STN photostimulation (ten 10 ms 0.5 mW pulses at 40 Hz) produces a significant shift in the distribution of bout sizes, toward shorter bouts; KS ****p<0.0001, ***p<0.001. Insets show the proportion of 2-lick bouts; paired t-test, **p<0.01. (D) STN photostimulation led to a significant shift in the distribution of IBI lengths toward longer intervals. (E) STN stimulation induces an increase in the mean median IBI; n = 8 YFP and 10 ChR2; RM-ANOVA, treatment x stimulus interaction F1,15 = 5.1, p<0.05; Sidak posthoc **p<0.01, *p<0.05. One YFP-control outlier was excluded from this analysis as illustrated. (F) The total number of bouts initiated and (G) licks made per session was increased in the ChR2:YFP expressing group, and this effect reached significance in the 50-ms-pulse condition; n = 8 YFP and 10 ChR2; unpaired t-test, t = 2.2 (F), t = 2.4 (G), *p<0.05.
Figure 2—figure supplement 2
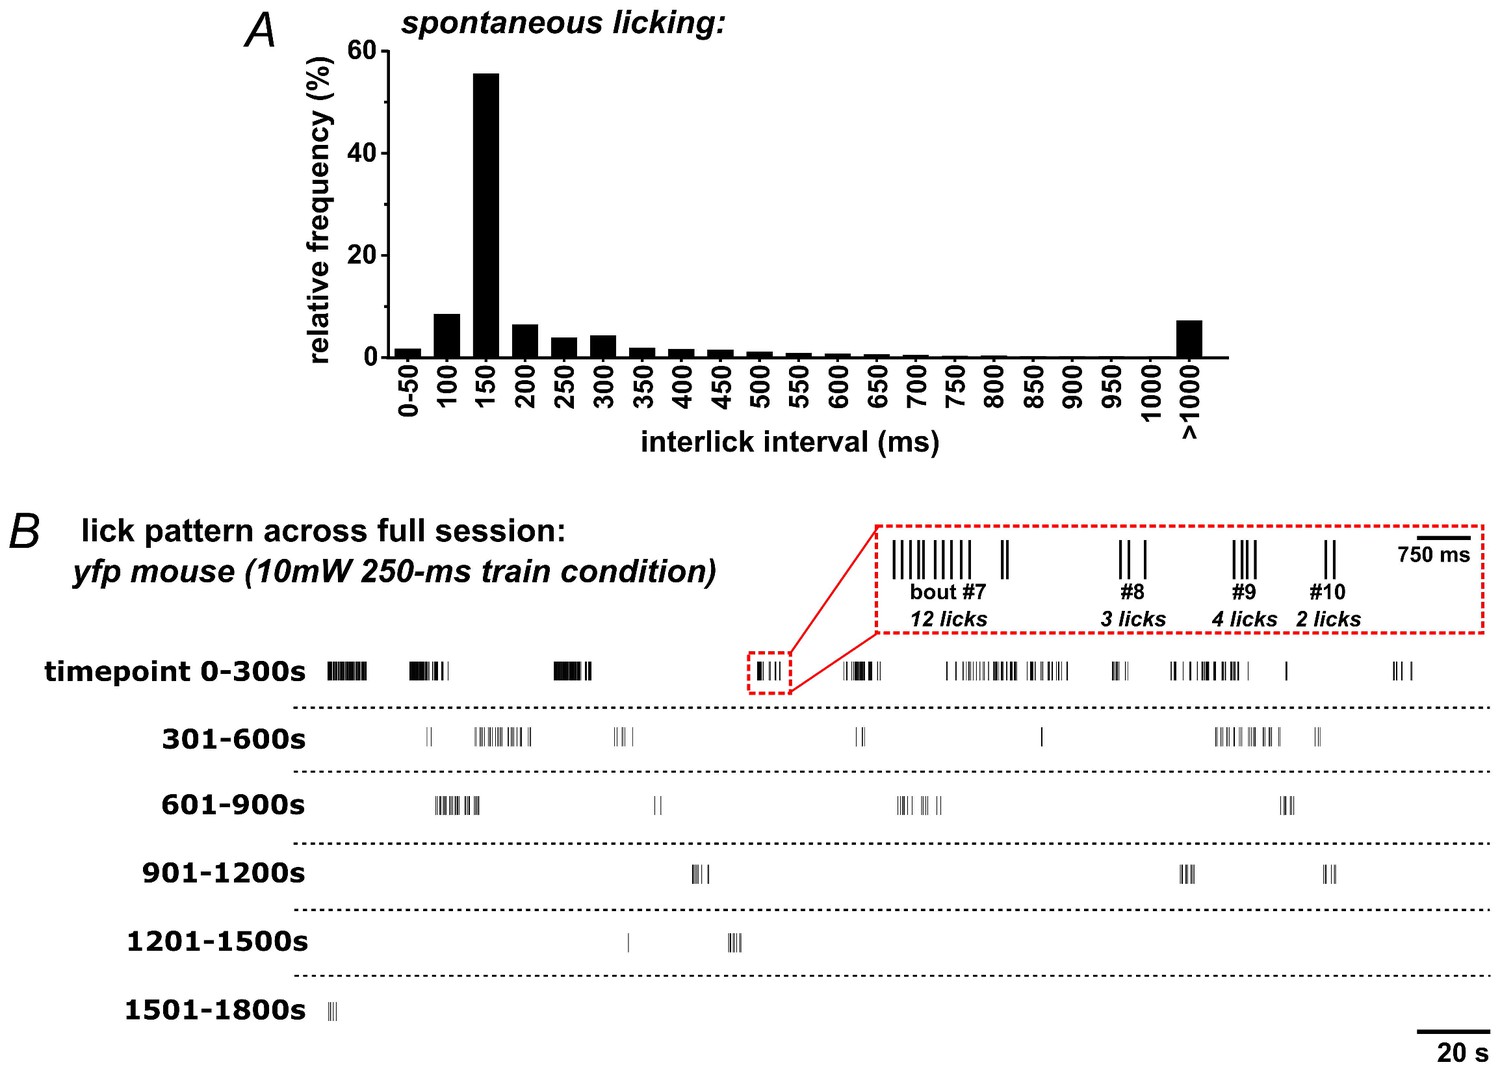
Patterns of self-initiated spontaneous licking in mice.
(A) The distribution of inter-lick intervals (ILI) in ad libitum-fed mice (n = 13) given access to sweetened strawberry milk in lickometer-equipped operant chambers. (B) Example lick raster across an entire 30 min session in a YFP-control mouse.
Figure 3 with 2 supplements
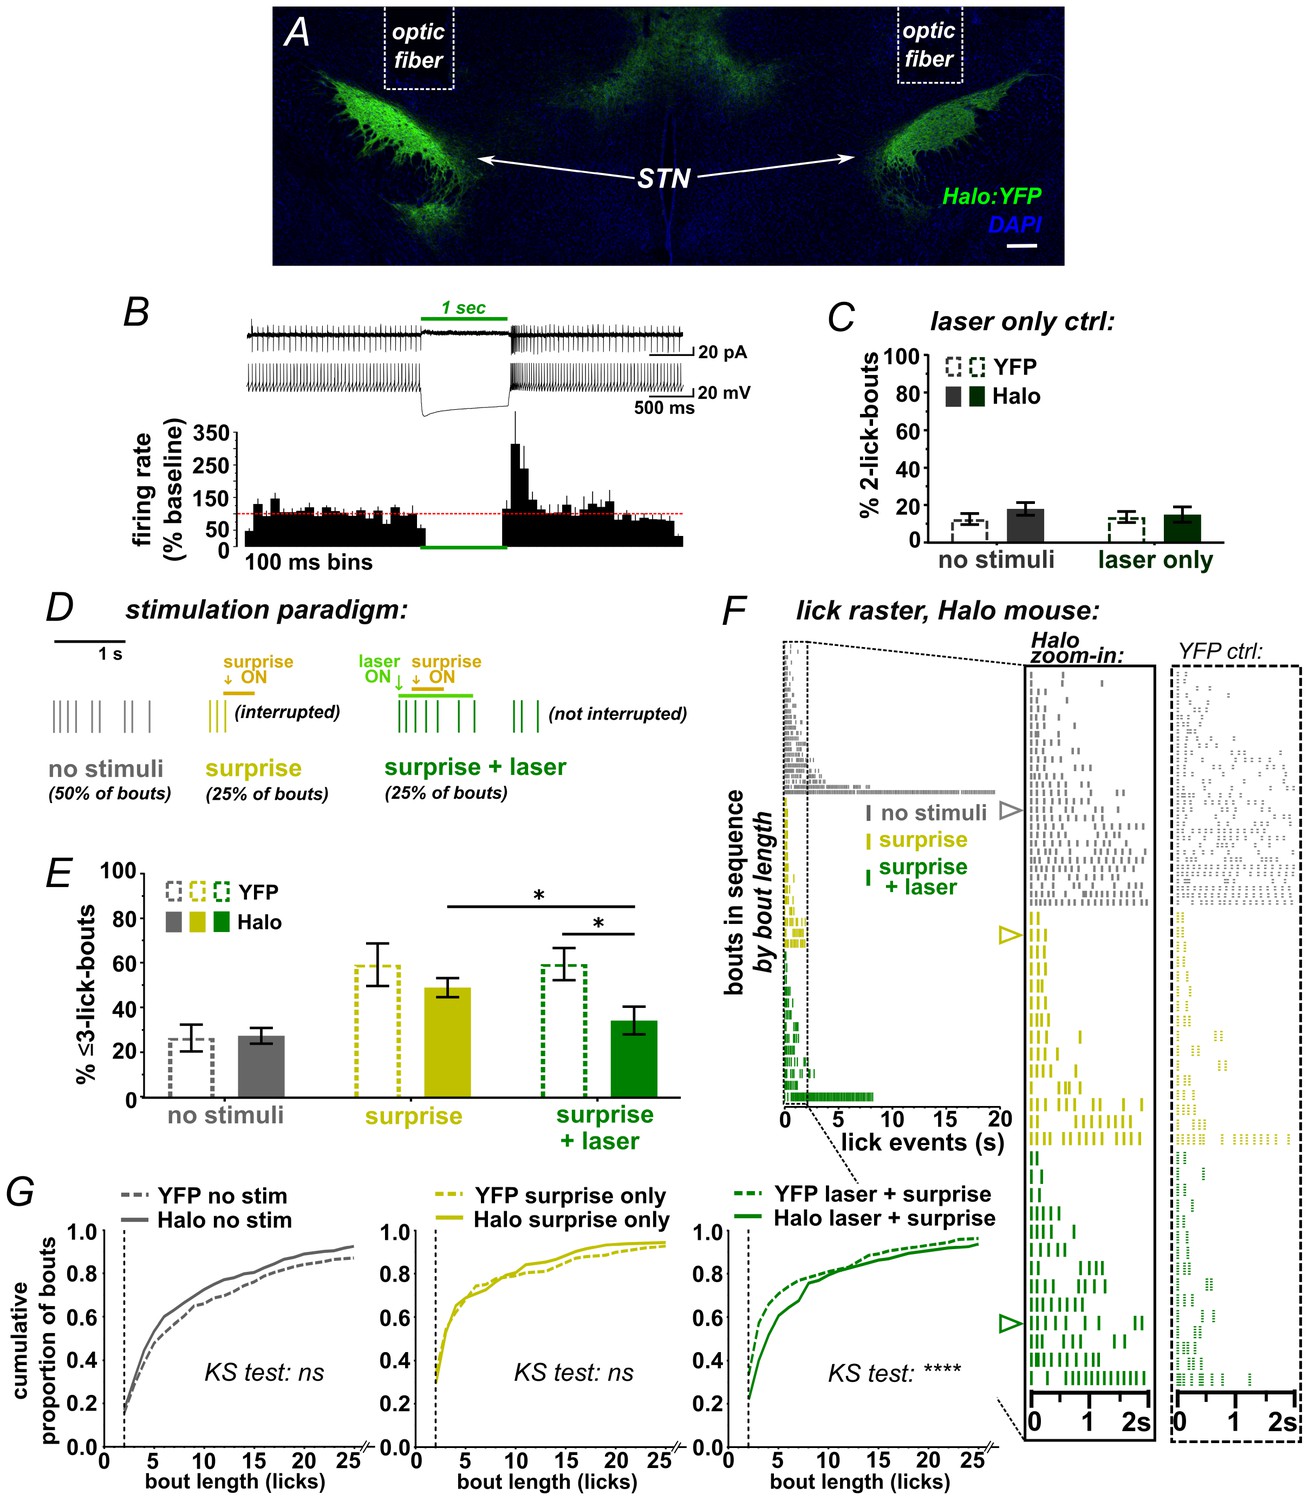
STN inhibition reduces the impact of surprise on interrupting licking.
(A) Image of coronal section showing bilateral expression of eNPh3.0:EYFP (Halo) in STN. (B) Cell-attached (top trace) or whole-cell current-clamp (bottom trace) recordings from Halo-expressing STN neurons. Histogram shows % change in firing rate from a 2 s baseline; n = 7 cells. (C) Green laser photoinhibition delivered alone (following the second lick in a bout on 50% of bouts) did not affect licking in YFP-control or Halo-expressing mice; n = 8 YFP and 11 Halo mice. (D) Schematic of task. On 50% of bouts, the second lick triggers a 100 ms delay followed by visual and auditory ‘surprise’ stimuli to disrupt licking behavior. On 25% of bouts the surprise is preceded by green laser to photo-inhibit, with the laser delivered on the first lick in a bout and ending 950 ms after surprise onset. (E) Plot showing the number of bouts ending with three or fewer licks is increased by surprise, but laser inhibition reduces the interruptive effect of surprise on licking in the Halo-expressing mice compared to controls; n = 7 YFP and 11 Halo mice; RM-ANOVA, stimulus effect F2,32 = 24, p<0.0001; treatment x stimulus interaction F2,32 = 5.3, p=0.01; Sidak posthoc *p<0.05, surprise vs no stim p<0.0001 (YFP) and p<0.001 (Halo). (F) Example lick raster from a Halo-expressing mouse, insets include data from a YFP-control mouse for comparison. Arrowheads in raster denote the bouts illustrated in panel D. (G) Cumulative probability plots comparing Halo- vs YFP-expressing mice bout length distributions without stimulus, with surprise-induced interruption, and with surprise plus laser. When compared to YFP controls, STN inhibition reduced the interruptive effects of surprise; n = 7 YFP, n = 11 Halo; KS = Kolmogorov-Smirnov, ****p<0.0001, ns = not significant.
Figure 3—figure supplement 1
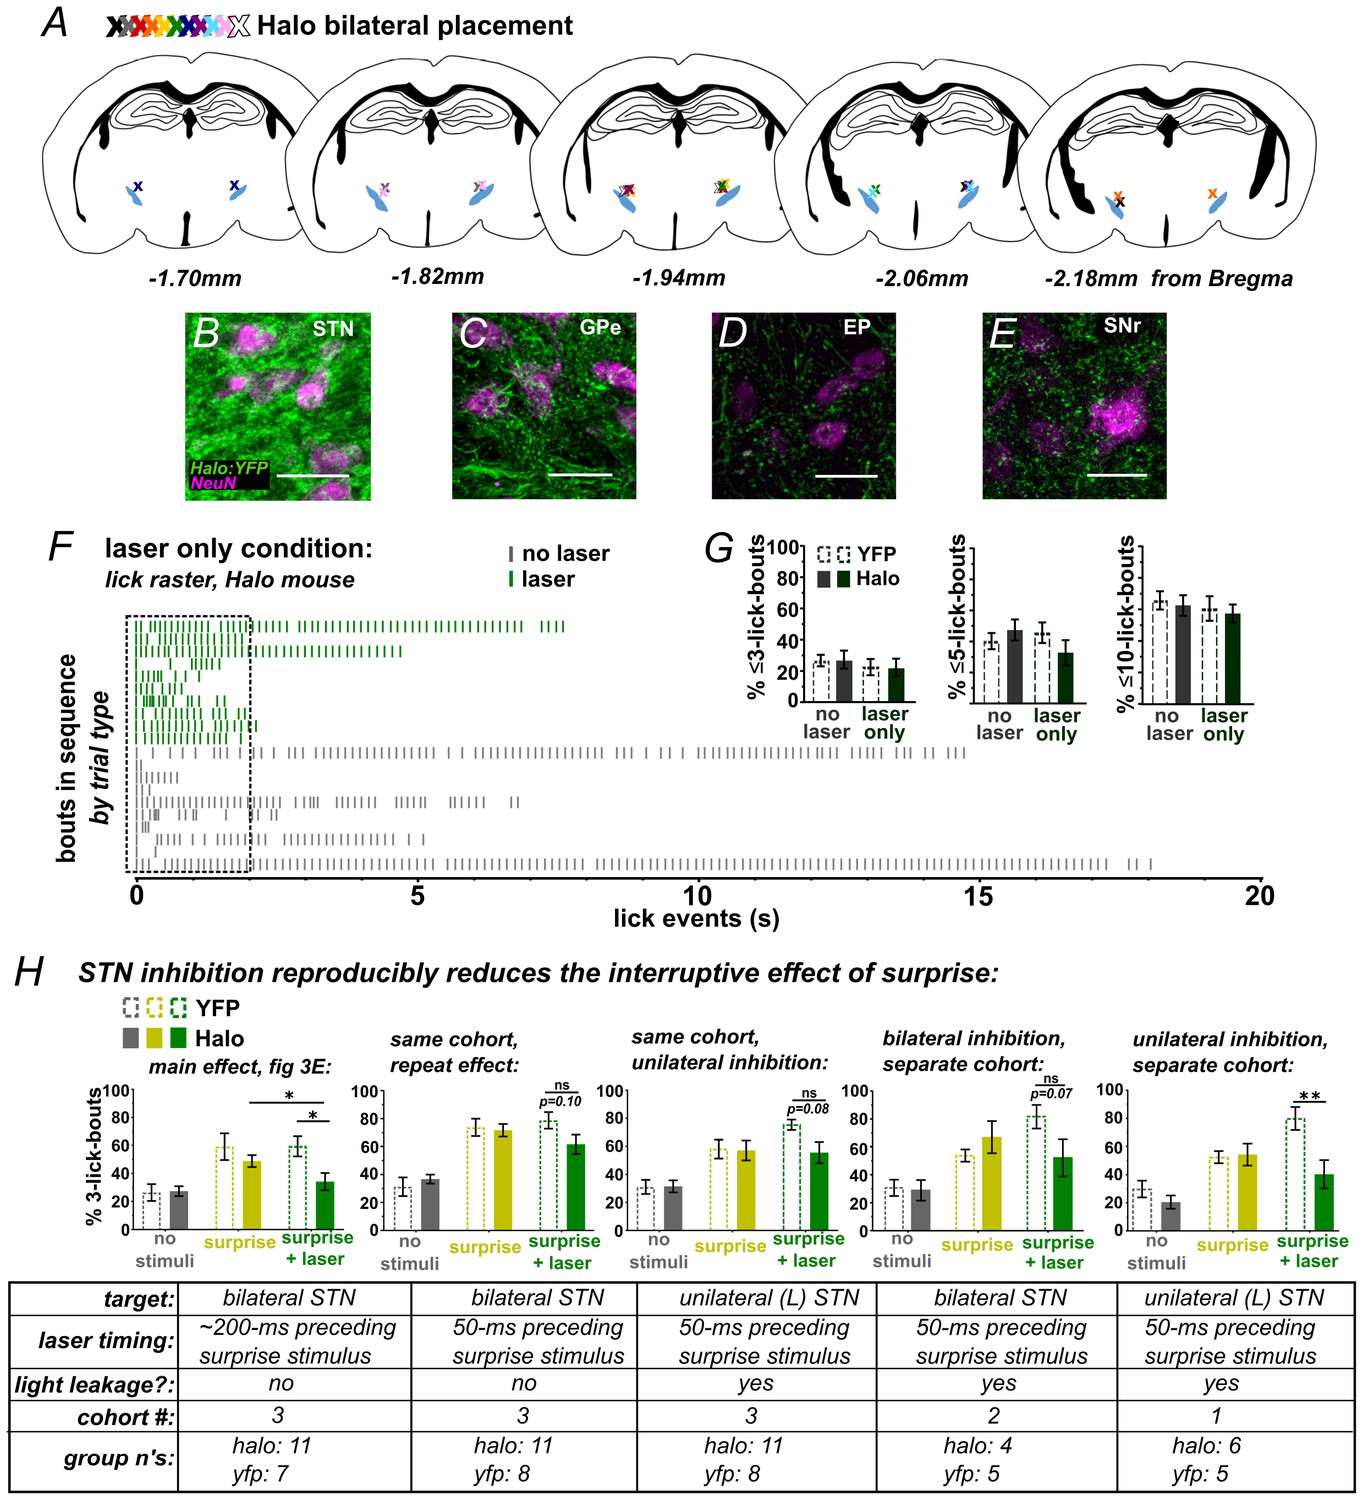
Optic fiber placements and effect of STN inhibition on licking.
(A) Schematic illustrating location of bilateral optic fiber placements in STN of Halo:YFP-expressing mice. (B) High-magnification images of native Halo:YFP fluorescence in the STN, (C) GPe, (D) EP, and (E) SNr; scale 20 μ. (F) Example lick raster from a Halo-expressing mouse illustrating lack of effect of photoinhibition alone on licking. (G) Green laser photoinhibition delivered alone (on 50% of bouts) did not affect licking across a variety of lick-bout lengths in YFP-control or Halo-expressing mice; n = 8 YFP and 11 Halo mice. (H) Iterations of the experiment in Figure 3E reliably reproduce the effect of Halo-mediated STN inhibition on reducing surprise-evoked interruption using varied conditions as noted in the corresponding table. Variables included the onset of laser inhibition, unilateral vs bilateral inhibition, and whether laser light partly escaped from the optic fiber. Note that when laser light was not fully blocked it appeared to add to the interruptive effect of surprise, but the interaction with laser inhibition still held. Laser timing in these experiments involved: 1 s laser pulse is triggered by the second lick in the bout (rather than the first) and surprise is delayed 50 ms (rather than 100 ms) after the second lick. Some experiments were conducted without fully blocking laser light leakage from the junction at the head cap, producing an increased interruptive effect in the surprise+laser conditions in controls. Statistics, from left to right beginning with second graph (see Figure 3 legend for first graph): RM-ANOVA, stimulus effect: F2,34 = 34.6 and p<0.0001, F2,34 = 23.9 and p<0.0001, F2,14 = 15.9 and p<0.001, F2,18 = 22.9 and p<0.0001; RM-ANOVA, treatment x stimulus interaction: F2,34 = 2.4 and p=0.10, F2,34 = 2.5 and p=0.10, F2,14 = 4.7 and p<0.05, F2,18 = 7.7 and p<0.01; Sidak posthoc, **p<0.01; *p<0.05.
Figure 3—figure supplement 2
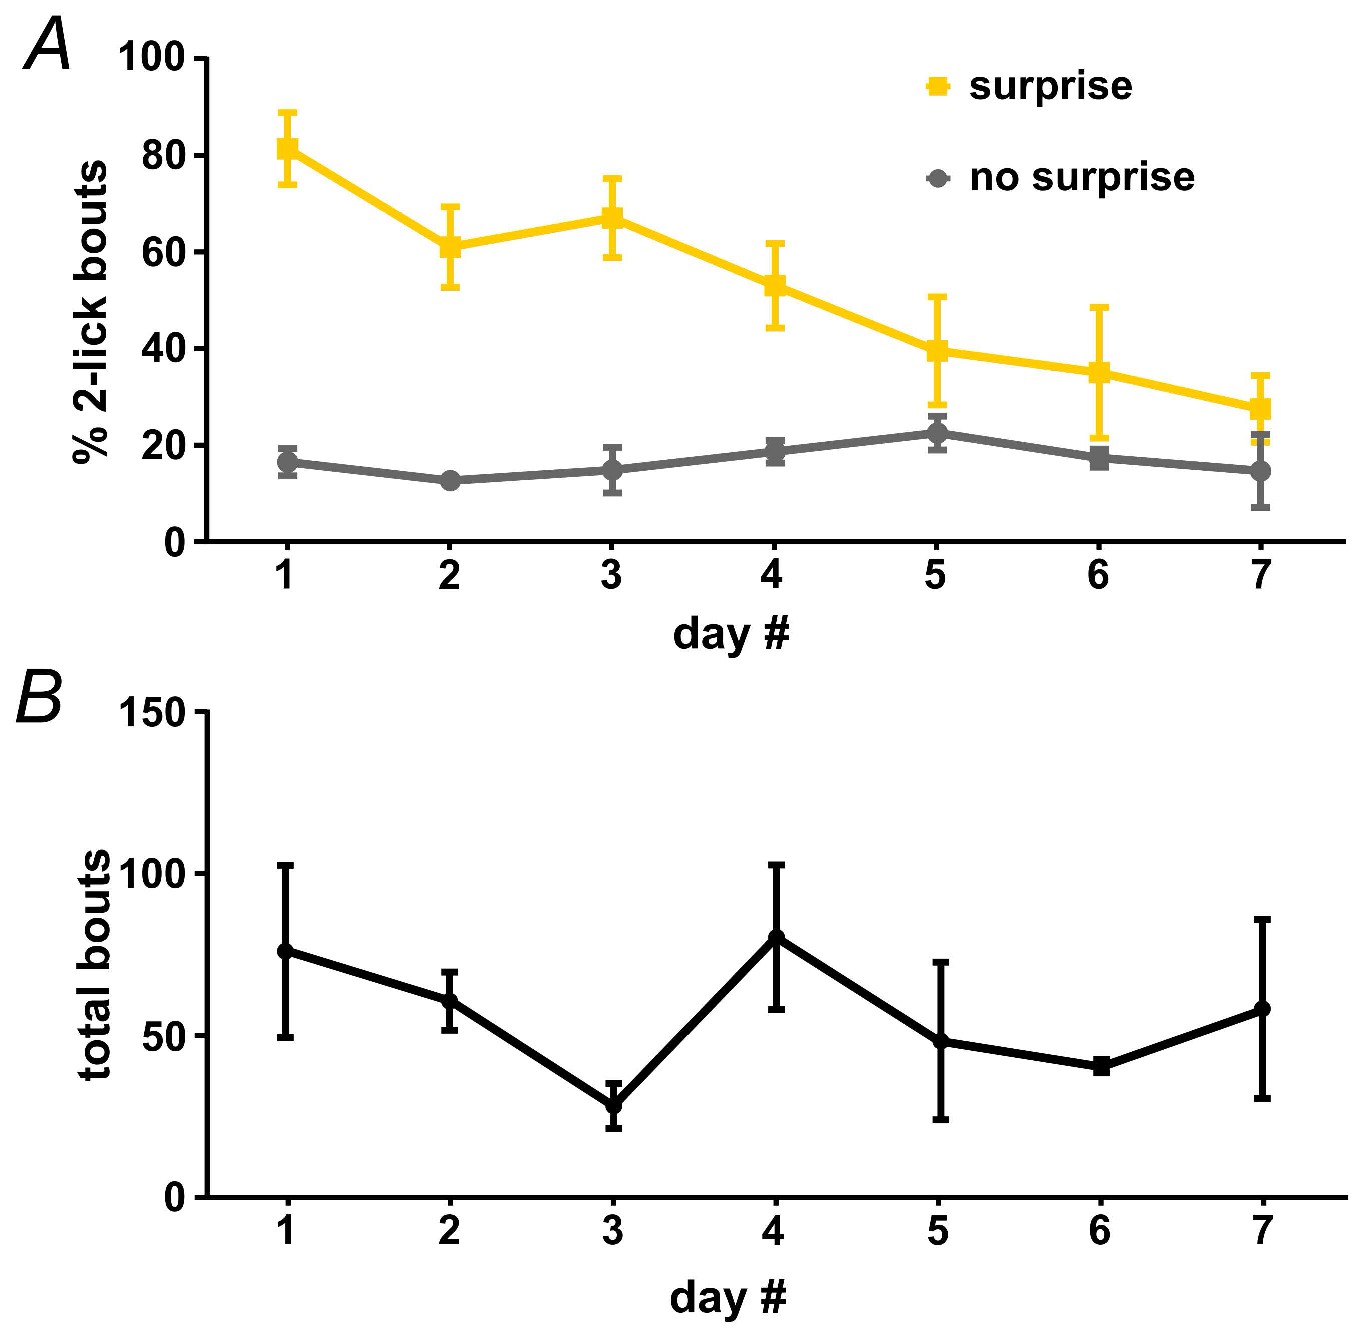
Surprise-induced interruption of licking.
An untreated group of wild-type mice (n = 3) were used to assess the effects of a combined auditory/light surprise stimulus on licking. Surprise was delivered on the second lick in 33.3% of bouts, as in Figure 2A. (A) Surprise led to an increase in the fraction of bouts that ended at two licks, and the interruptive effects of surprise declined across several days; n = 3 mice; RM-ANOVA, surprise F1,2 = 300, p<0.01; surprise x day interaction F6,12 = 4.2, p<0.05. (B) Represents average number of bouts across days.
Author response image 1
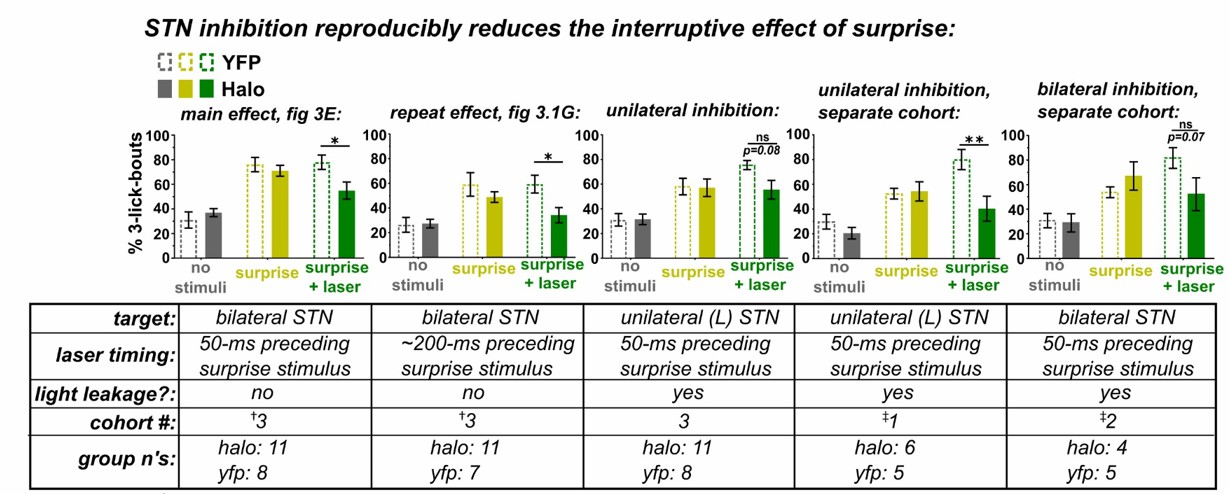
†These data included in the revised manuscript.
(3rd cohort was implanted to eliminate the interruptive effect of laser light leakage from the head cap observed in previous experiments) ‡These data included in previous submission.
Author response image 2
Videos
Video 1
Movie showing example of STN-activation interrupting licking.
Related to Figure 2. Note that light-leakage was blocked during data acquisition, but left unblocked as a visual aid for this example movie.
Video 2
Movie showing example of surprise-induced interruption of licking.
Related to Figure 3.
Video 3
Movie showing example of STN-inhibition blocking surprise-induced interruption of licking.
Related to Figure 3. Note that light-leakage was blocked during data acquisition, but left unblocked as a visual aid for this example movie.
Download links
A two-part list of links to download the article, or parts of the article, in various formats.
Downloads (link to download the article as PDF)
Open citations (links to open the citations from this article in various online reference manager services)
Cite this article (links to download the citations from this article in formats compatible with various reference manager tools)
Causal role for the subthalamic nucleus in interrupting behavior
eLife 6:e27689.
https://doi.org/10.7554/eLife.27689


