Translation repression via modulation of the cytoplasmic poly(A)-binding protein in the inflammatory response
- Mayo Clinic, United States
- University of Central Florida, United States
Figures
Figure 1 with 4 supplements
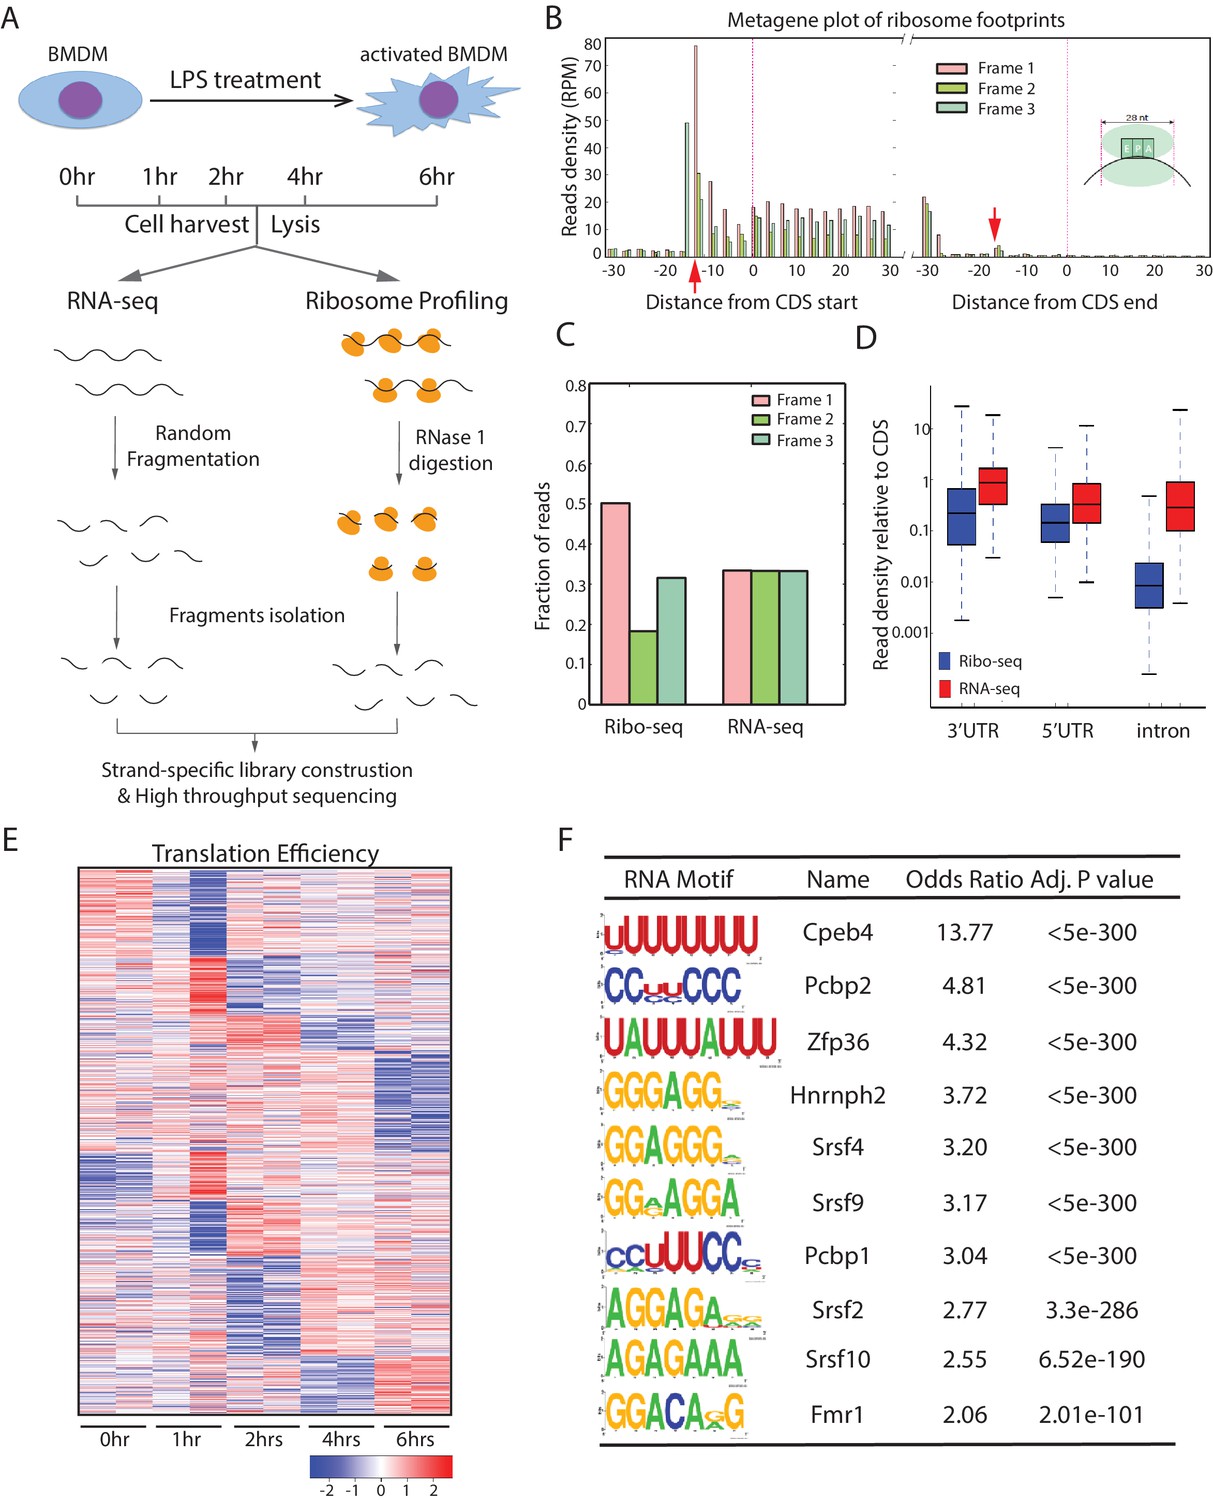
Global translation profiling of mouse primary BMDM-mediated inflammatory response.
(A) Workflow of parallel ribosome and RNA profiling during the BMDM-mediated inflammatory response. (B) Metagene plots show the rise and fall in 28-nt ribosome footprints (RFPs) density (reads per million uniquely mapped reads, RPM) near starts and stops of annotated CDS, respectively. The 12-nt and 15-nt offsets (indicated by the red arrows) from starts and stops reflect distances from RFP 5’ termini to the ribosome P- and A-site codons at translation initiation and termination, respectively. (C) Subcodon resolution of ribosome footprints. Note that 3-nt codon periodicity relative to the known CDSs is seen for 28-nt RFPs but not RNA-seq reads. (D) Ribosome footprints are highly specific to coding regions. Boxplots show density of Ribo-seq and RNA-seq reads at 5’UTRs, 3’UTRs, and introns relative to that of the associated CDSs. (E) Clustering analysis of the translation efficiency (TE) of the 724 genes differentially translated (empirical p<0.05) in the inflammatory response. Heatmap displays mean row-centered log2 TE values at 0, 1, 2, 4, 6 hr post LPS treatment. (F) RNA-binding protein motifs enriched within the 3’UTRs of the 724 translationally regulated genes. The 10 most enriched motifs of macrophage-expressed RBPs are shown along with enrichment statistics.
Figure 1—figure supplement 1
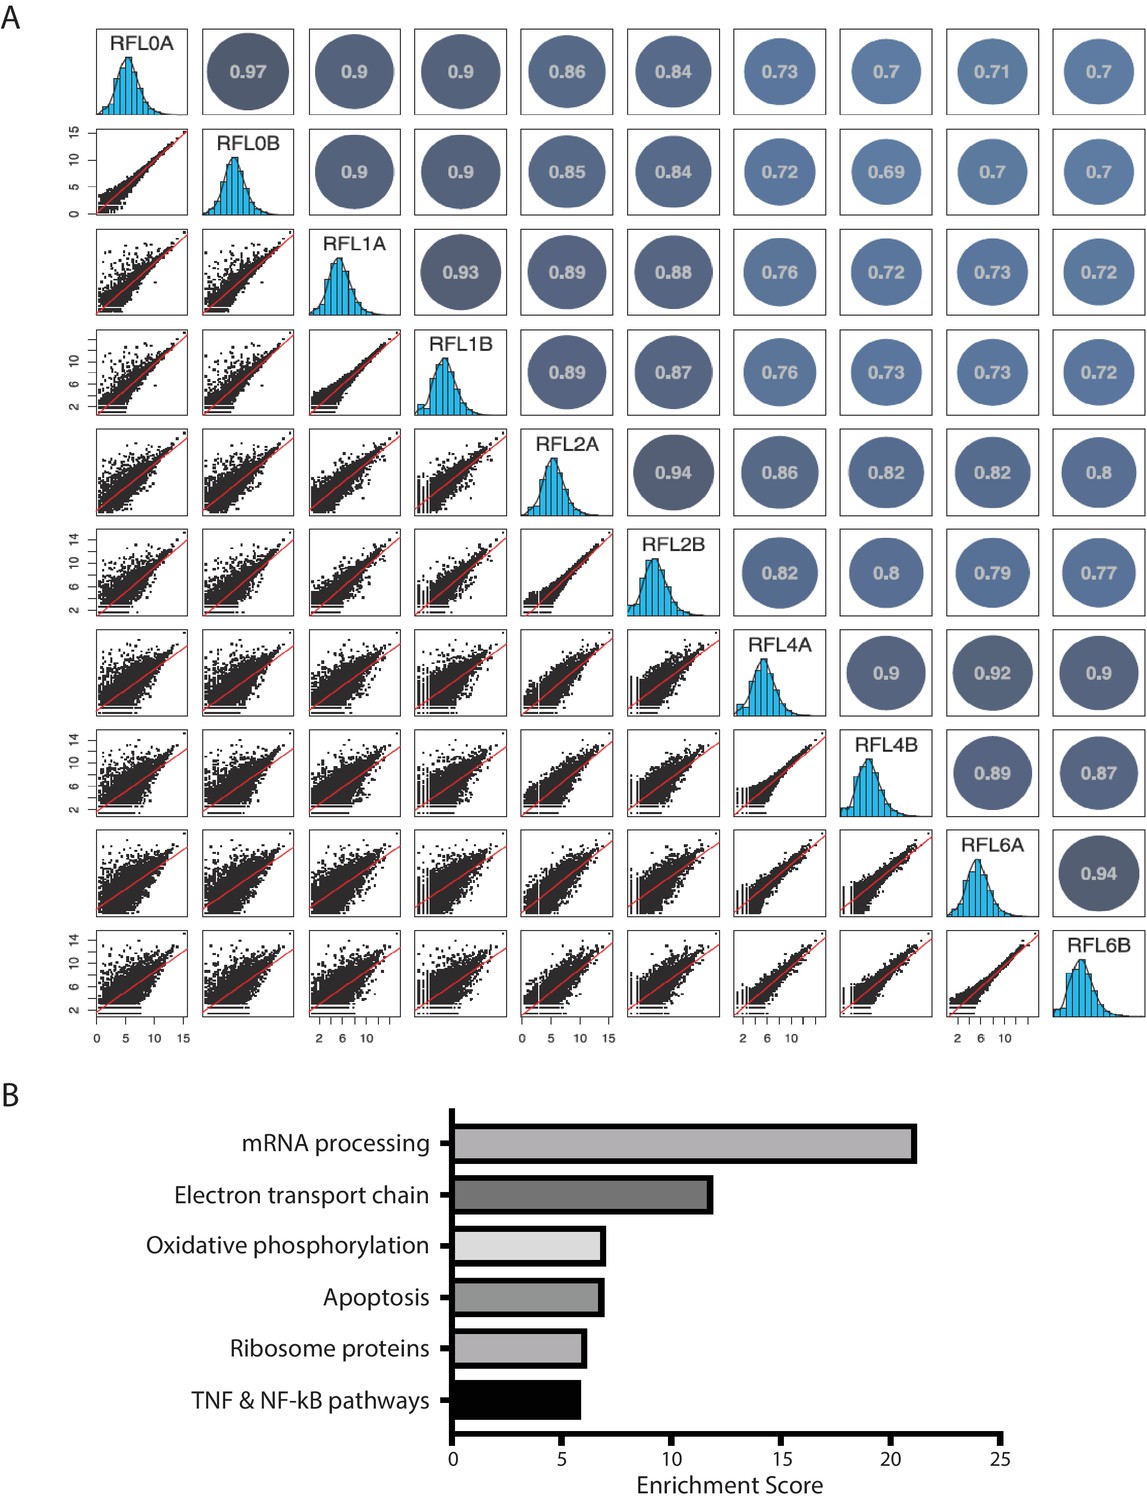
Reproducibility of Ribo-seq and GO analysis of differentially translated mRNAs in the inflammatory response.
(A) The ribosome profiling datasets in BMDM-mediated inflammatory response are highly reproducible. Scatterplots (lower left) show pairwise comparisons of the ribosome footprint (RFP) density estimates (log2 reads per million mapped reads, RPM) for annotated transcripts (>10 reads in every Ribo-seq sample replicate) among samples after 0, 1, 2, 4, and 6 hr post LPS treatment; histograms (middle) show range of values for each sample replicate, and a graphical display of the Pearson’s correlation matrix for pairwise comparisons is shown to the upper right. (B) Gene ontology analysis of the differentially translated mRNAs during the inflammatory response. The 724 differentially translated mRNAs were analyzed by the Enrichr () using the WikiPathways 2016. The resulting top five pathways are listed.
Figure 1—figure supplement 2
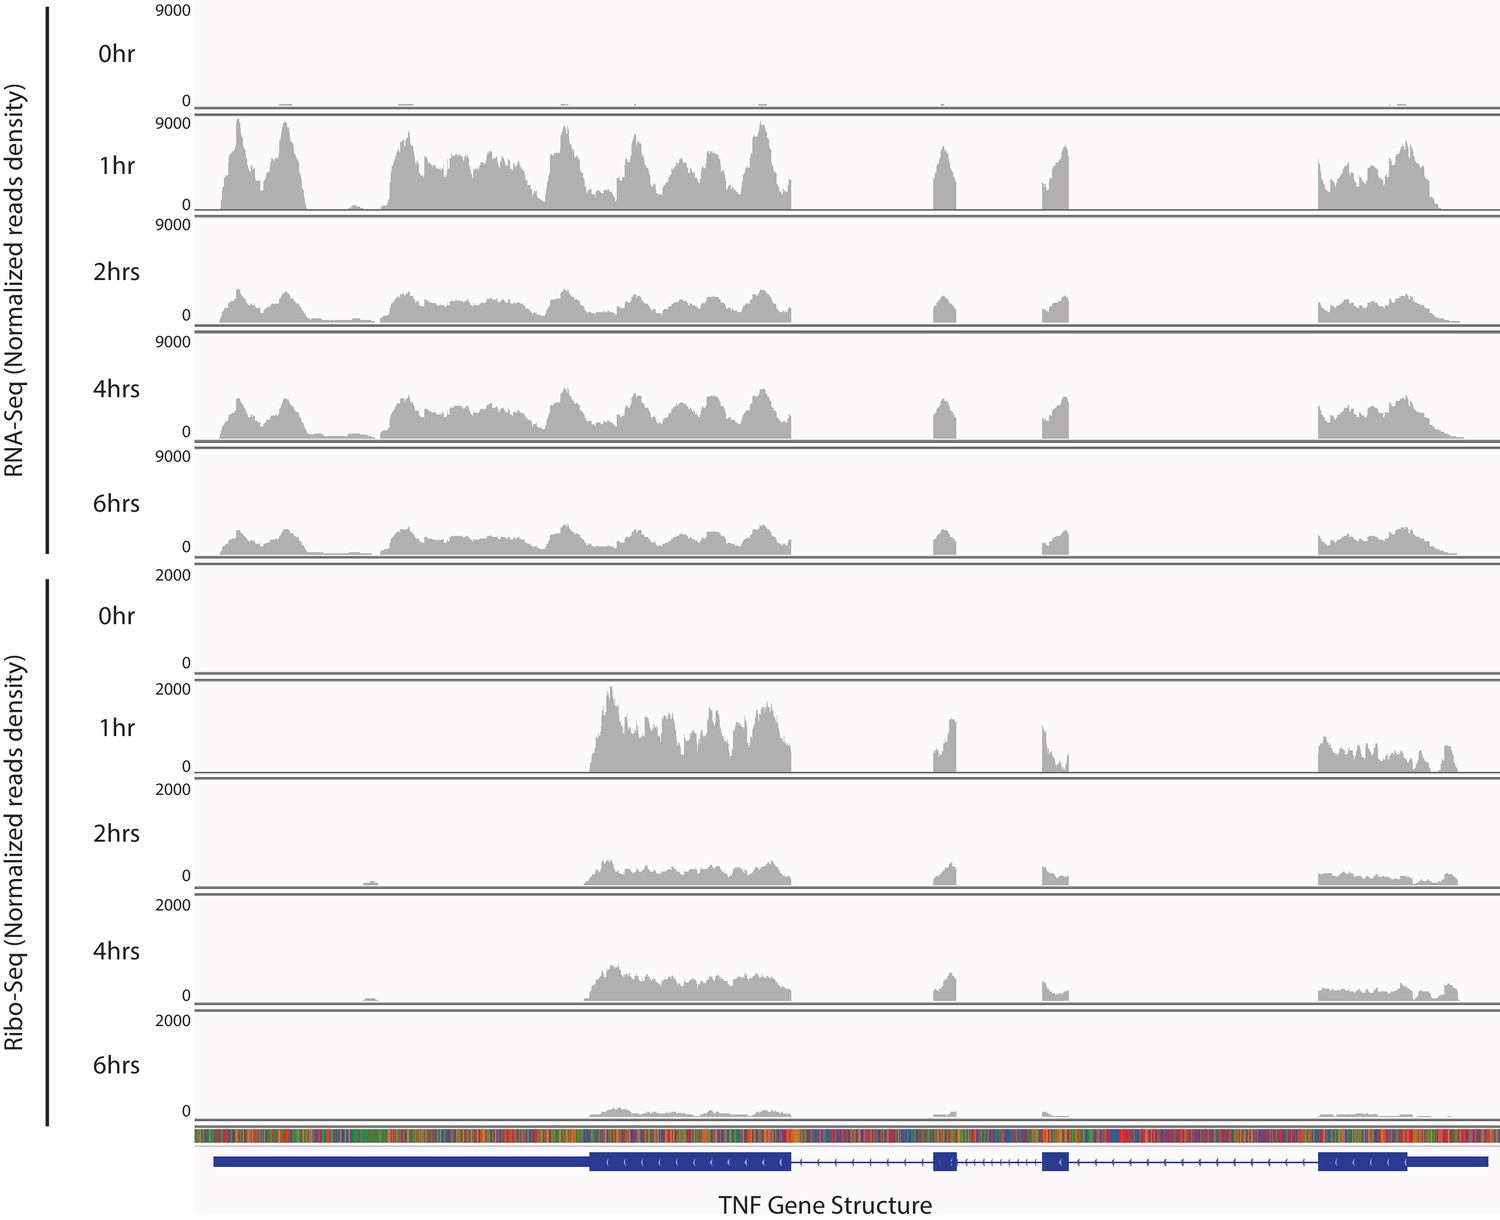
TNF mRNA is translationally repressed during late stages of inflammatory response.
Reads from RNA-seq and Ribo-seq at each time point during the inflammatory response in the TNF locus were displayed.
Figure 1—figure supplement 3
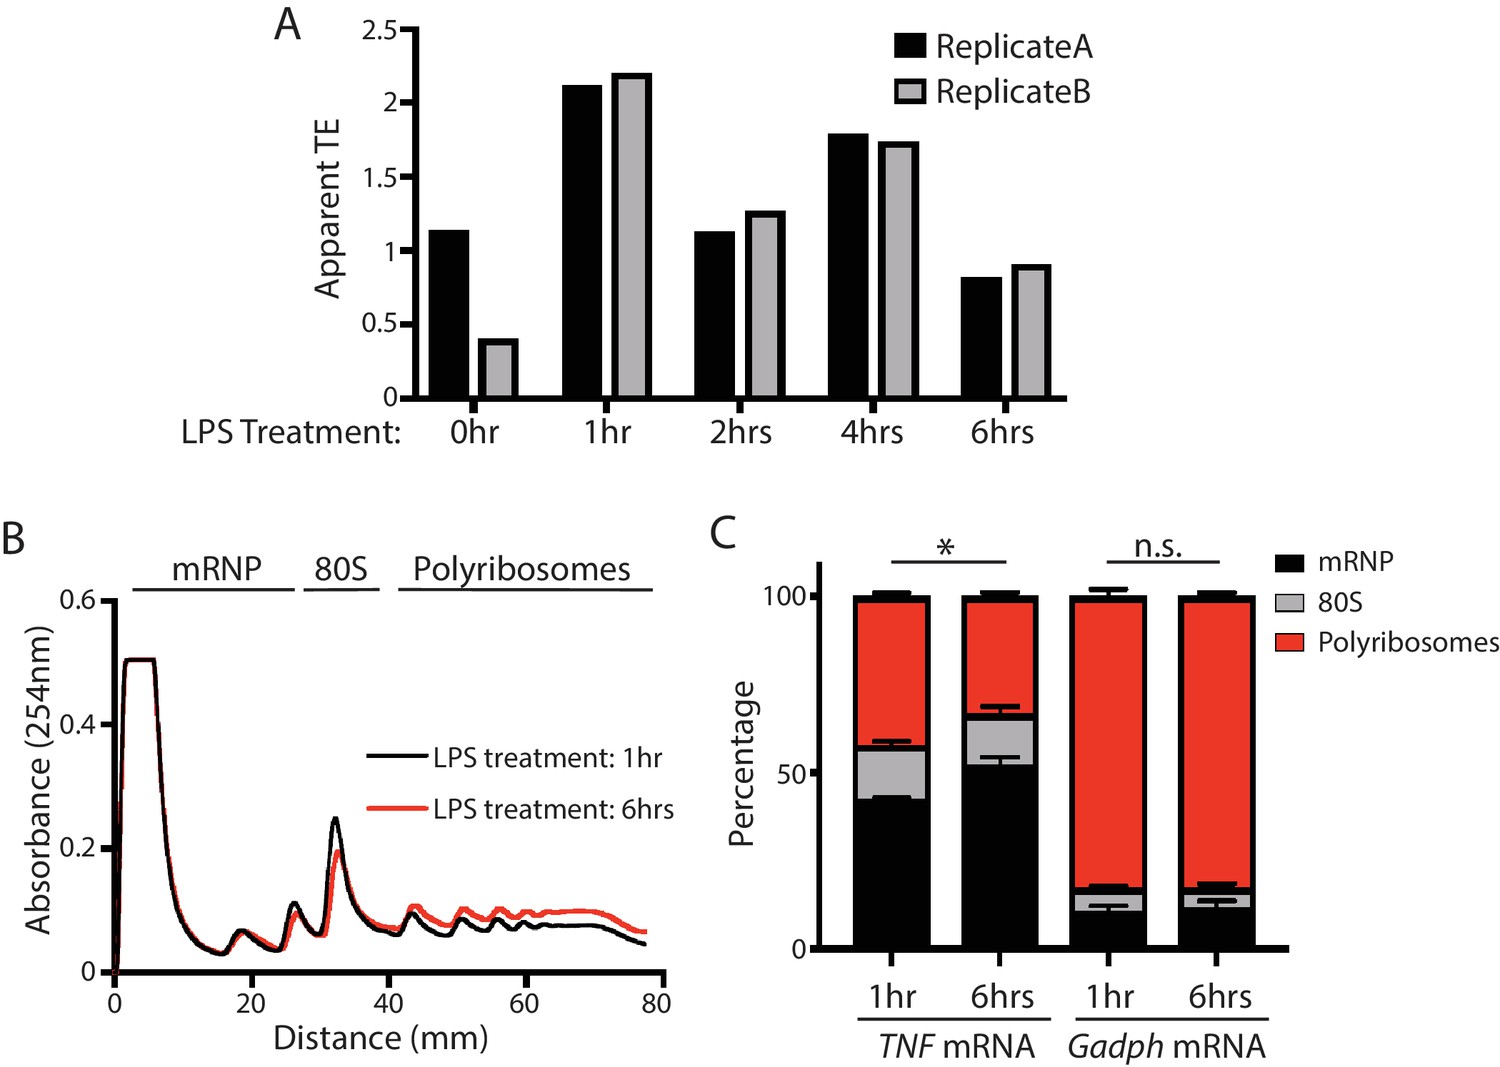
Verification of translational repression of TNF mRNA at late time points in LPS-stimulated BMDMs.
(A) The apparent TEs of TNF mRNA in the BMDMs at 0, 1, 2, 4, 6 hr post LPS stimulation. The variation of the two biological replicates at 0 hr is likely due to low TNF mRNA expression at this time point. (B) Polysome profiles of BMDMs with 1 hr LPS stimulation and BMDMs with 6 hr LPS stimulation. (C) TNF mRNA and Gapdh mRNA distribution across the sucrose gradient. The results represent the means (± SD) of three independent measurements. *p<0.05, n.s. not significant (p>0.05) by the Student’s t-test.
Figure 1—figure supplement 4

Zfp36 is a translational repressor.
The luciferase reporter was co-transfected into 293 T cells with either the lambdaN-Zfp36 expressing plasmid or the lambda-GFP expressing plasmid. The luciferase activity, the FLuc mRNA level, and the translatability (luciferase activity/FLuc mRNA level) were determined at 40 hr post transfection. The results represent the means (± SD) of three independent measurements.
Figure 2 with 1 supplement
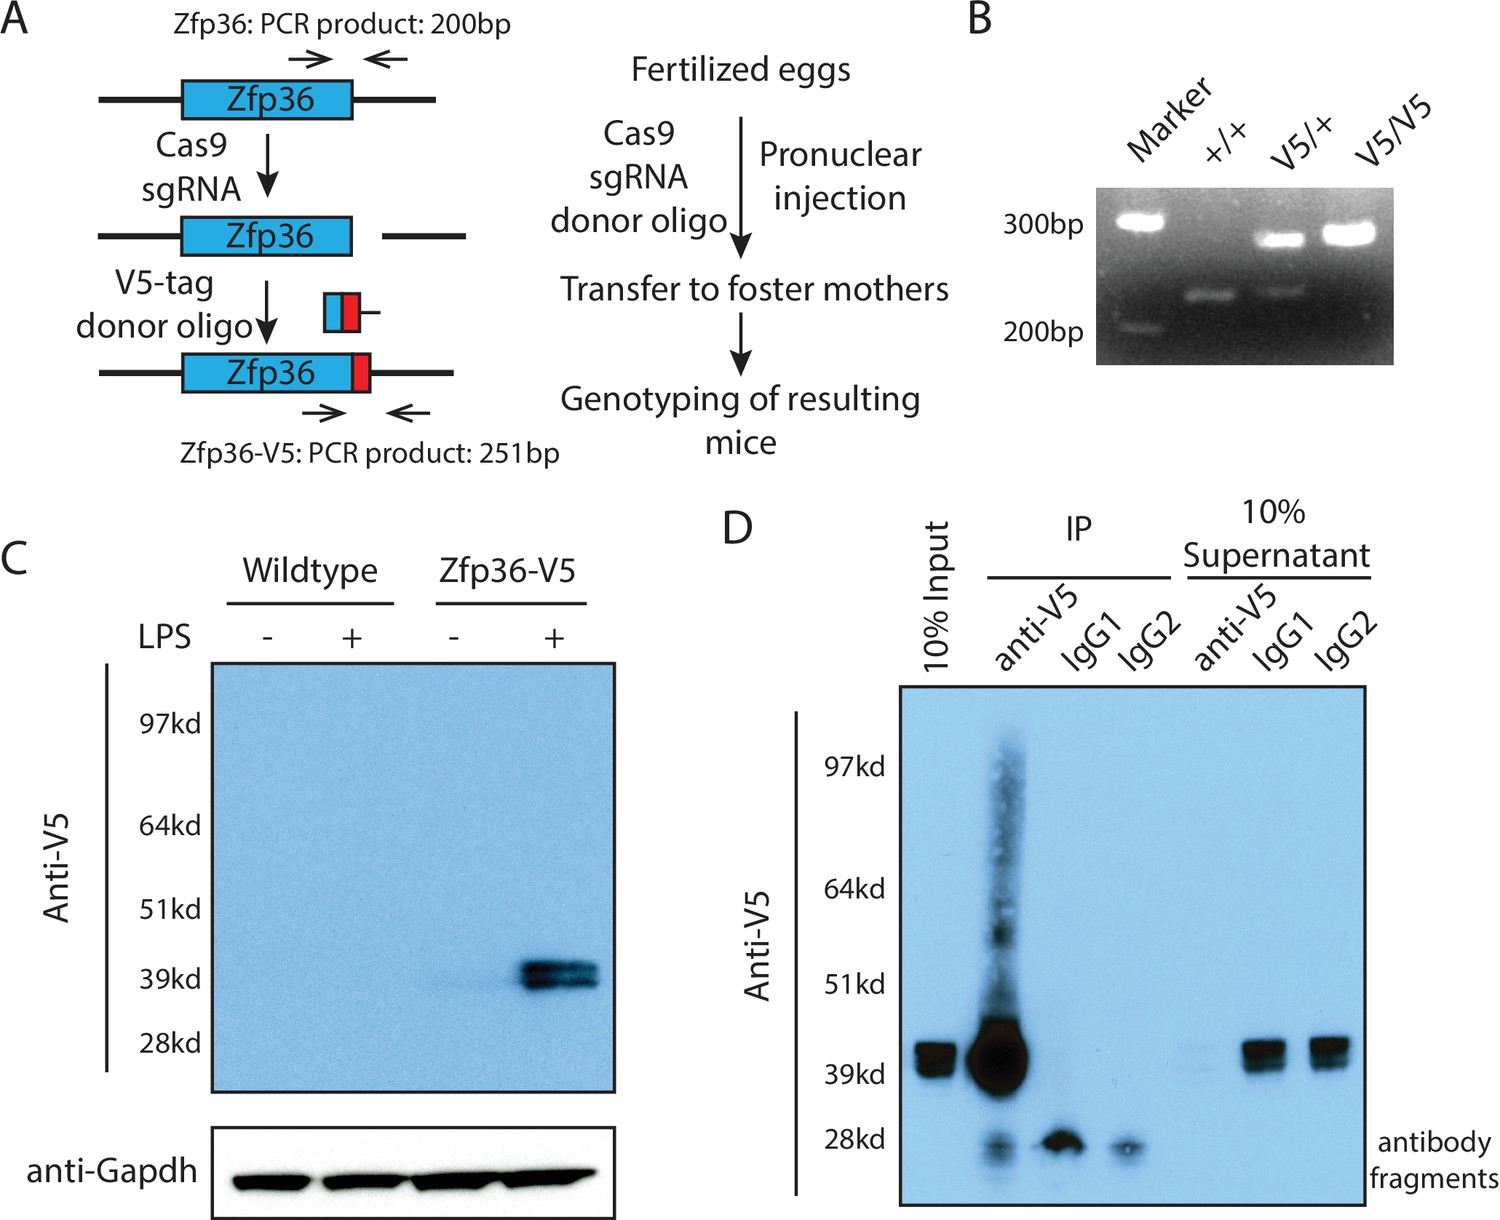
Generation of a Zfp36 V5-epitope tag knock-in mouse for mechanistic studies on the endogenous Zfp36.
(A) Workflow for generating a Zfp36-V5 knock-in mouse via CRISPR/Cas9-mediated genome editing. (B) Genotyping of the Zfp36-V5 knock-in mice using the two primers shown in (A). (C) Specific and unambiguous detection of Zfp36 using the V5-epitope in BMDMs from the Zfp36-V5 mice. BMDMs from wild-type and Zfp36-V5 mice were treated with 100 ng/ml LPS for 4 hr, followed by Western blot using an anti-V5 antibody. The doublet bands of Zfp36 are due to its post-translational modifications. (D) Efficient isolation of endogenous Zfp36 using the V5-epitope in BMDMs from the Zfp36-V5 mice. BMDMs from the Zfp36-V5 mice were stimulated with 100 ng/ml LPS for 4 hr, followed by UV254 crosslinking. An anti-V5 antibody and two different IgGs were used to IP the endogenous Zfp36 from the cell lysates, respectively. The input, IP samples, and supernatants were subjected to SDS-PAGE and Western blot analysis using an anti-V5 antibody. The following figure supplement is available for Figure 2.
Figure 2—figure supplement 1
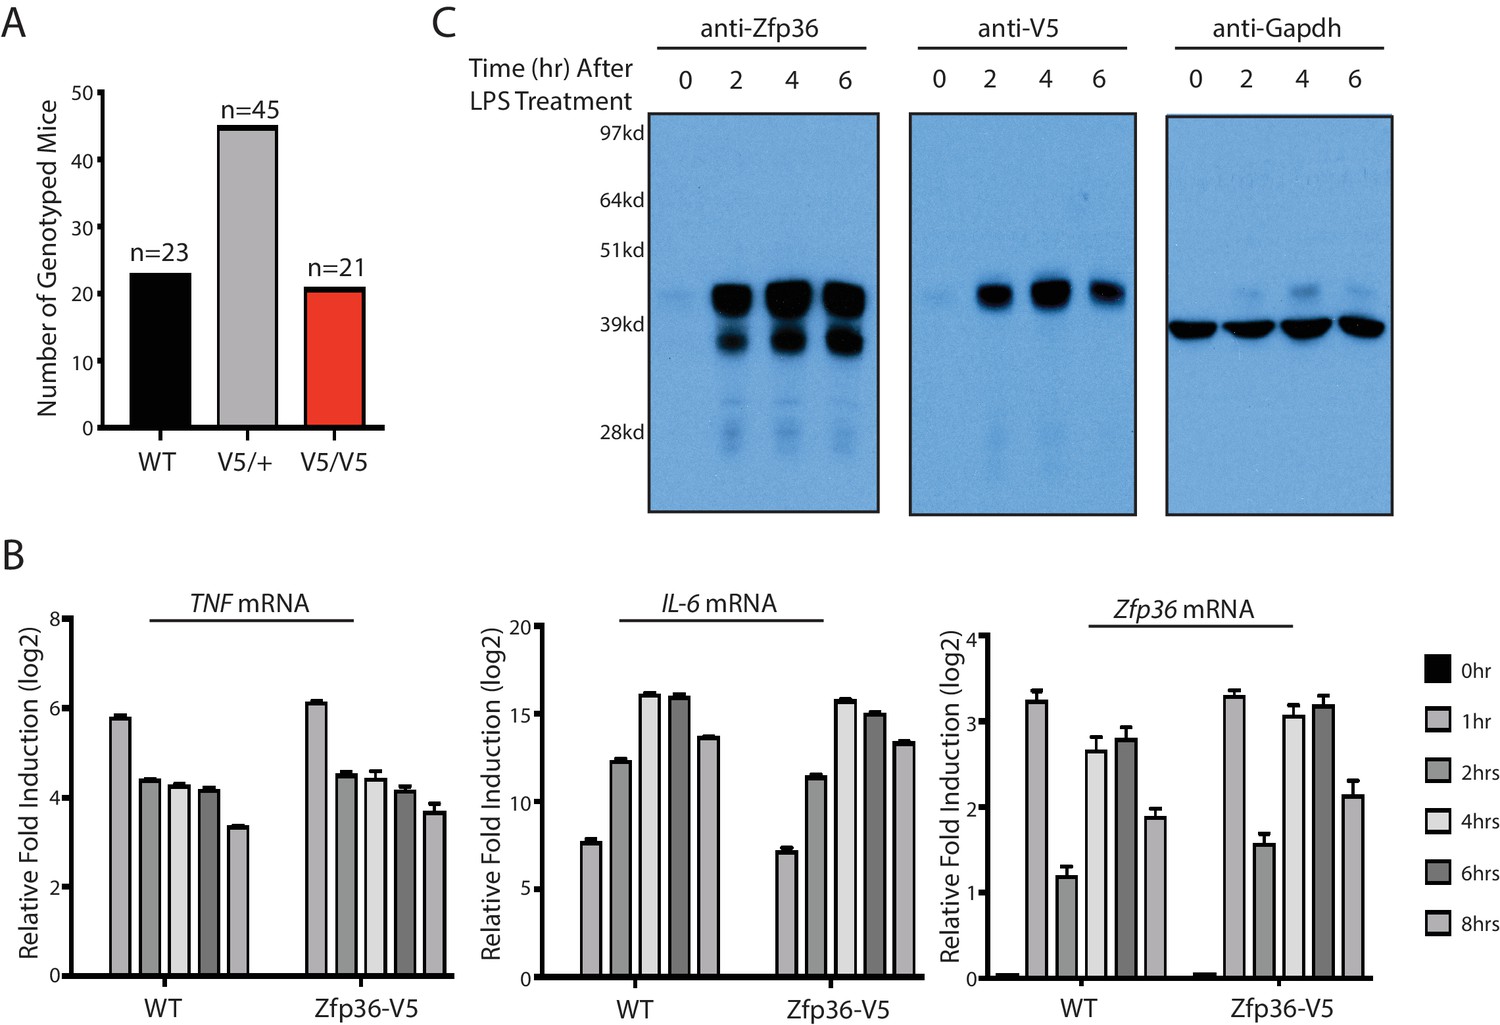
The Zfp36-V5 mouse is normal.
(A) The Zfp36-V5 mice were born in the predicted Mendelian ratio from heterozygous matings. The Zfp36-V5 mice from heterozygous matings were genotyped at 3–4 weeks old. (B) BMDMs from the Zfp36-V5 mice have the normal inflammatory response. BMDMs from the Zfp36-V5 mice and the wild-type mice were treated with 100 ng/ml LPS, and the cells were harvested at 0, 1, 2, 4, 6, 8 hr post LPS treatment. The levels of the indicated mRNAs were quantified by qRT-PCR, and 18S rRNA was used for normalization. The results represent the means (±SD) of three independent experiments. (C) Zfp36 can be unambiguously detected in the Zfp36-V5 mouse. BMDMs from the Zfp36-V5 mice were treated with 100 ng/ml LPS, and cells were harvested at 0, 2, 4, 6 hr post LPS treatment for SDS-PAGE and Western blot using the indicated antibodies.
Figure 3 with 1 supplement
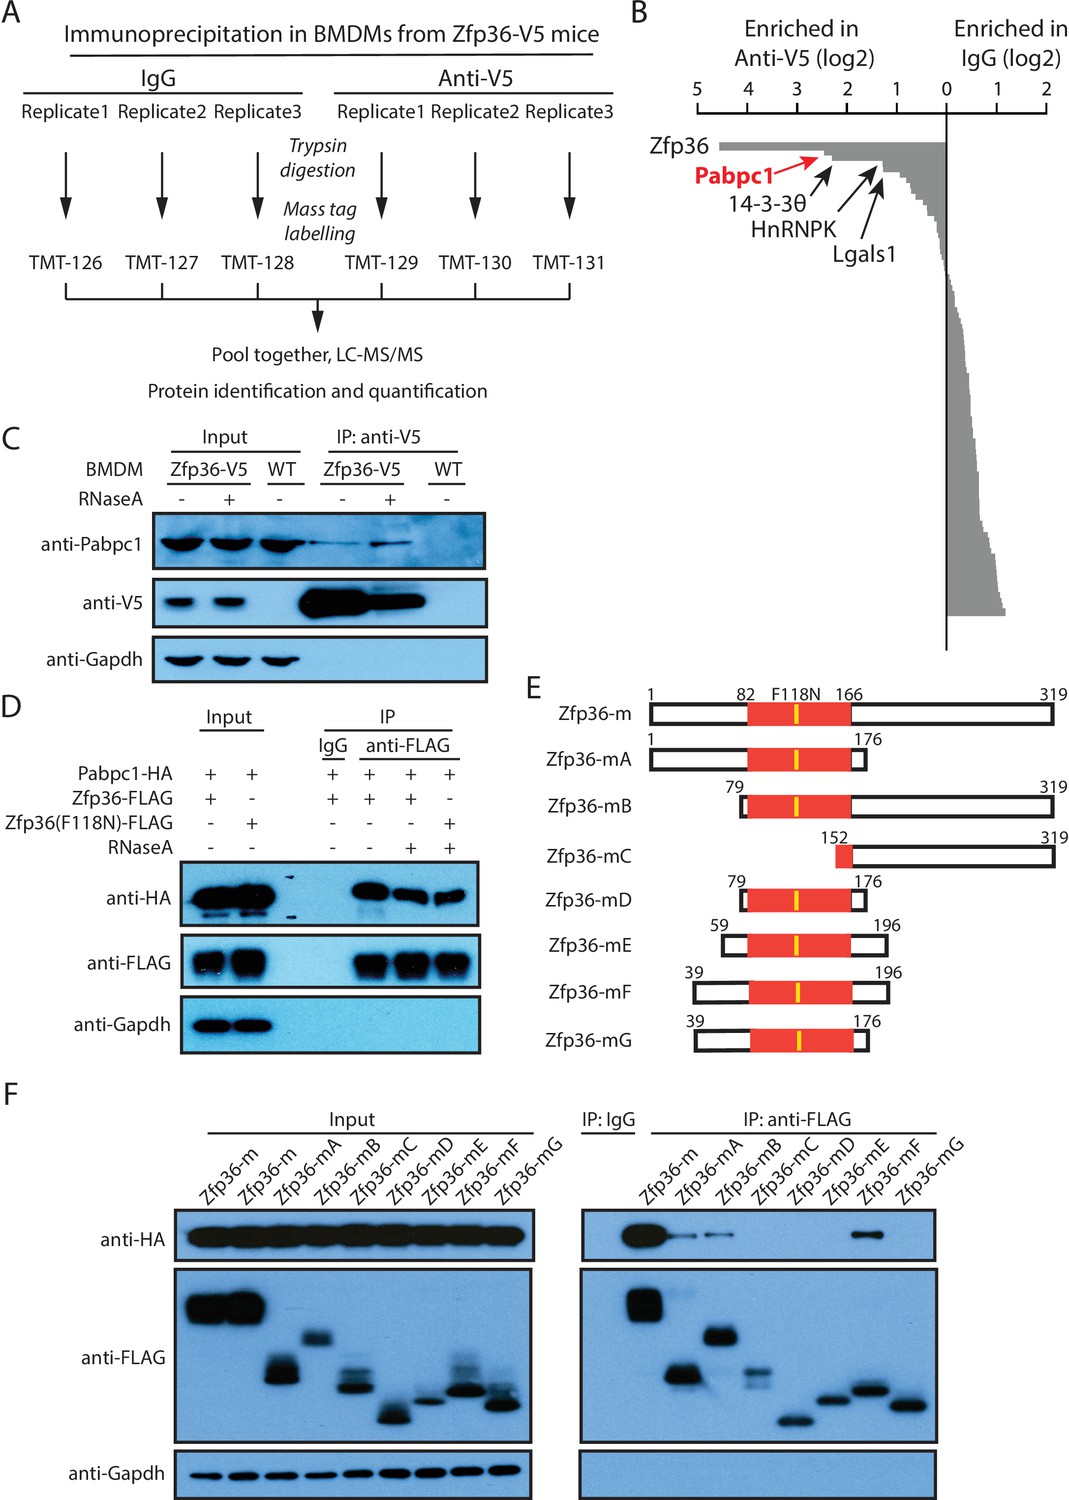
Endogenous Zfp36 interacts with Pabpc1 in LPS-stimulated BMDM.
(A) Workflow for the tandem mass tag (TMT) quantitative proteomics to identify the proteins associated with endogenous Zfp36 in LPS-stimulated BMDMs. (B) Zfp36-associated proteins identified by the TMT quantitative proteomics. (C) Zfp36 interacts with endogenous Pabpc1 in LPS-stimulated BMDMs. BMDMs from the Zfp36-V5 mice or wild-type (WT) mice were treated with 100 ng/ml LPS for 4 hr, followed by IP with (+) or without (-) RNaseA (200 ng/ml) using an anti-V5 antibody. The input (5%) and IP products were subject to SDS-PAGE and Western blot analysis using the indicated antibodies. (D) The Zfp36-Pabpc1 interaction is independent of RNA. The plasmid expressing the FLAG-tagged wild-type Zfp36 or a mutant, Zfp36(F118N), was co-transfected with a plasmid expressing the HA-tagged Pabpc1 into 293 T cells, respectively. IP was performed with (+) or without (-) RNaseA (200 ng/ul) using either an anti-FLAG antibody or an IgG. SDS-PAGE and Western blot were used to analyze the indicated proteins in the input and IP samples. (E) Schematic presentation of Zfp36 truncations for mapping the region interacting with Pabpc1. (F) Identification of the region on Zfp36 that binds Pabpc1. The plasmids expressing FLAG-tagged Zfp36 truncations shown in (E) were co-transfected with a plasmid expressing the HA-tagged Pabpc1 into 293 T cells, respectively. IP was performed with RNaseA (200 ng/ml) using an anti-FLAG antibody or an IgG. SDS-PAGE and Western blot were used to analyze the indicated proteins in the input and IP samples. The following figure supplement is available for Figure 3.
Figure 3—figure supplement 1
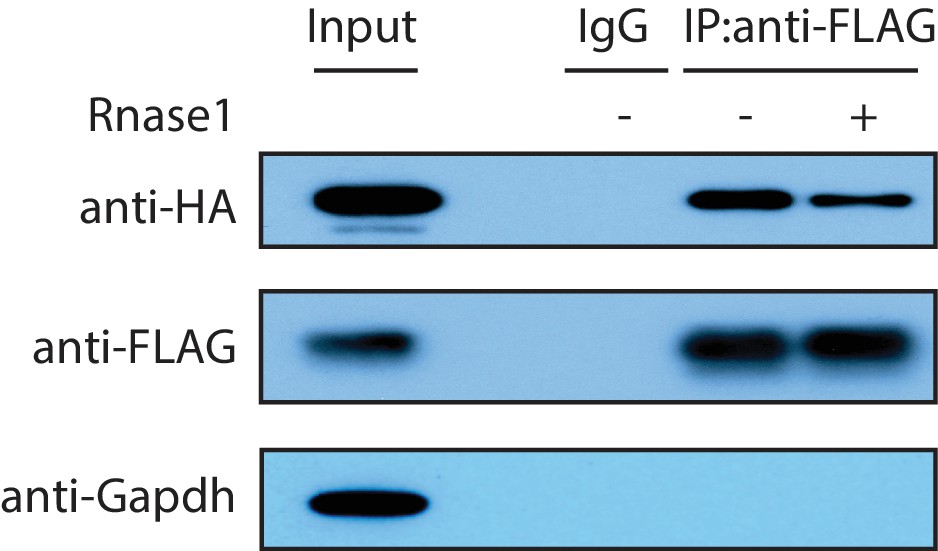
The Zfp36-Pabpc1 interaction is independent of RNA.
A HA-Pabpc1 expressing plasmid was co-transfected into 293 T cells with a Zfp36-FLAG expressing plasmid. IP was performed using either an IgG control or an anti-FLAG antibody in the presence (+) or absence (-) of RNase1(0.5 U/ul). Western blot was used to examine the indicated proteins in the input and IP samples.
Figure 4 with 1 supplement
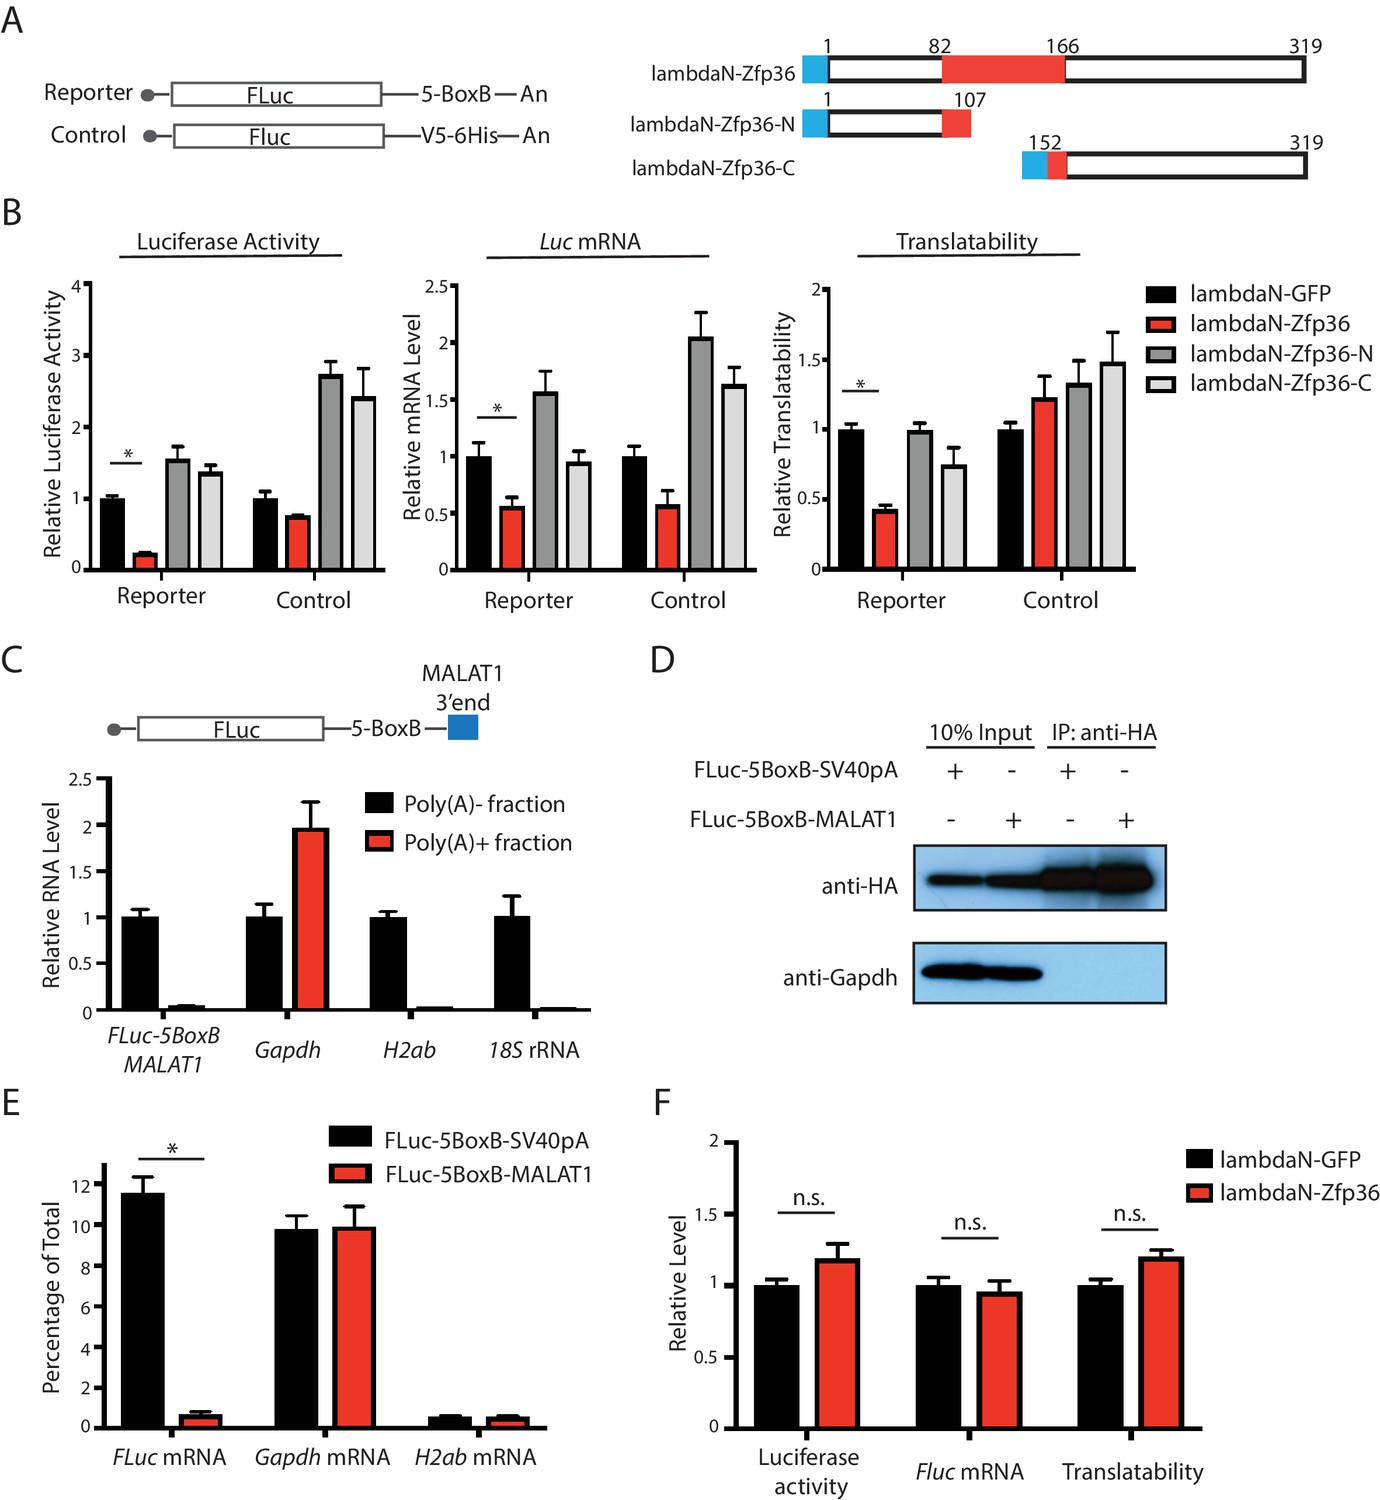
The Zfp36-Pabpc1 interaction is required for Zfp36-mediated translational repression.
(A) Luciferase reporters and Zfp36 and its truncations used in the tethering experiment. The blue box represents the λN polypeptide. (B) Luciferase activity, the FLuc mRNA, and translatability determined in the tethering experiment. The FLuc-5BoxB reporter plasmid or the control plasmid was co-transfected with either the λN-GFP plasmid or plasmids expressing λN-Zfp36 and its truncations shown in (A) into 293 T cells, respectively. The luciferase assay and the mRNA measurement were performed at 24–30 hr post-transfection. The translatability was calculated as the luciferase activity normalized by the FLuc mRNA level. The luciferase activity, FLuc mRNA, and the translatability from the λN-GFP expressing cells were set as 1 for relative quantification, respectively. (C) The FLuc-5BoxB-MALAT1 reporter mRNA is a poly(A)- transcript. Total RNA from the 293 T cells transfected with the FLuc-5BoxB-MALAT1 reporter plasmid were fractionated by oligod(T)25 magnetic beads. RNAs were quantified by qRT-PCR in the poly(A)+ and poly(A)-fractions. The RNA level in the poly(A)- fraction was set as 1 for relative RNA level calculation. (D) IP of HA-Pabpc1 in 293 T cells. A HA-Pabpc1 expressing plasmid was co-transfected into 293 T cells with either the FLuc-5BoxB-SV40pA reporter or the FLuc-5BoxB-MALAT1 reporter. IP was performed using an anti-HA antibody, and Western blot was used to examine the indicated proteins in the input and IP samples. (E) Pabpc1 does not bind the FLuc-5BoxB-MALAT1 reporter mRNA. qRT-PCR was performed on indicated mRNAs from the total RNA isolated from the input and IP samples of (D). (F) Zfp36 cannot repress the translation of the FLuc-5BoxB-MALAT1 mRNA. The luciferase, mRNA level, and translatability of the FLuc-5BoxB-MALAT1 mRNA were determined in the tethering experiment as described in (B). All results represent the means (± SD) of three independent experiments. *p<0.05, n.s. not significant (p>0.05) by the Student’s t-test. The following figure supplement is available for Figure 4.
Figure 4—figure supplement 1
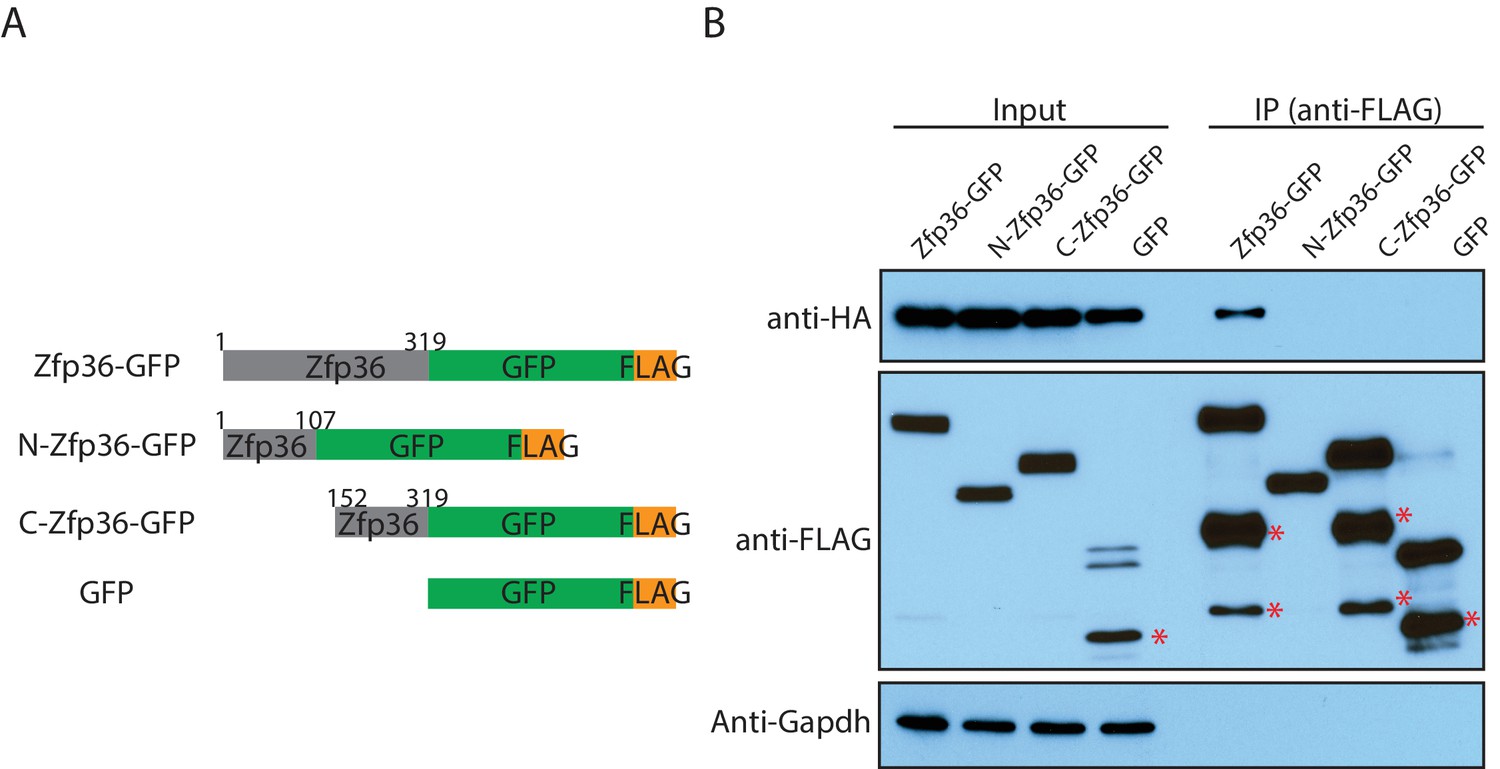
The Zfp36 N-terminus and C-terminus fragments do not interact with Pabpc1.
(A) Schematic presentation of Zfp36 full length, the Zfp36 N-terminus fragment, and the Zfp36 C-terminus fragment for the CoIP experiment. (B) The Zfp36 N-terminus and C-terminus fragments do not interact with Pabpc1. The Zfp36 full length and fragments shown in (A) were transfected into 293 T cells with a plasmid expressing Pabpc1-HA, respectively. Then IP was performed using an anti-FLAG antibody with RNaseA, followed by SDS-PAGE and Western blot to detect the indicated proteins. The bands labeled with * are likely to be protein degradation products.
Figure 5
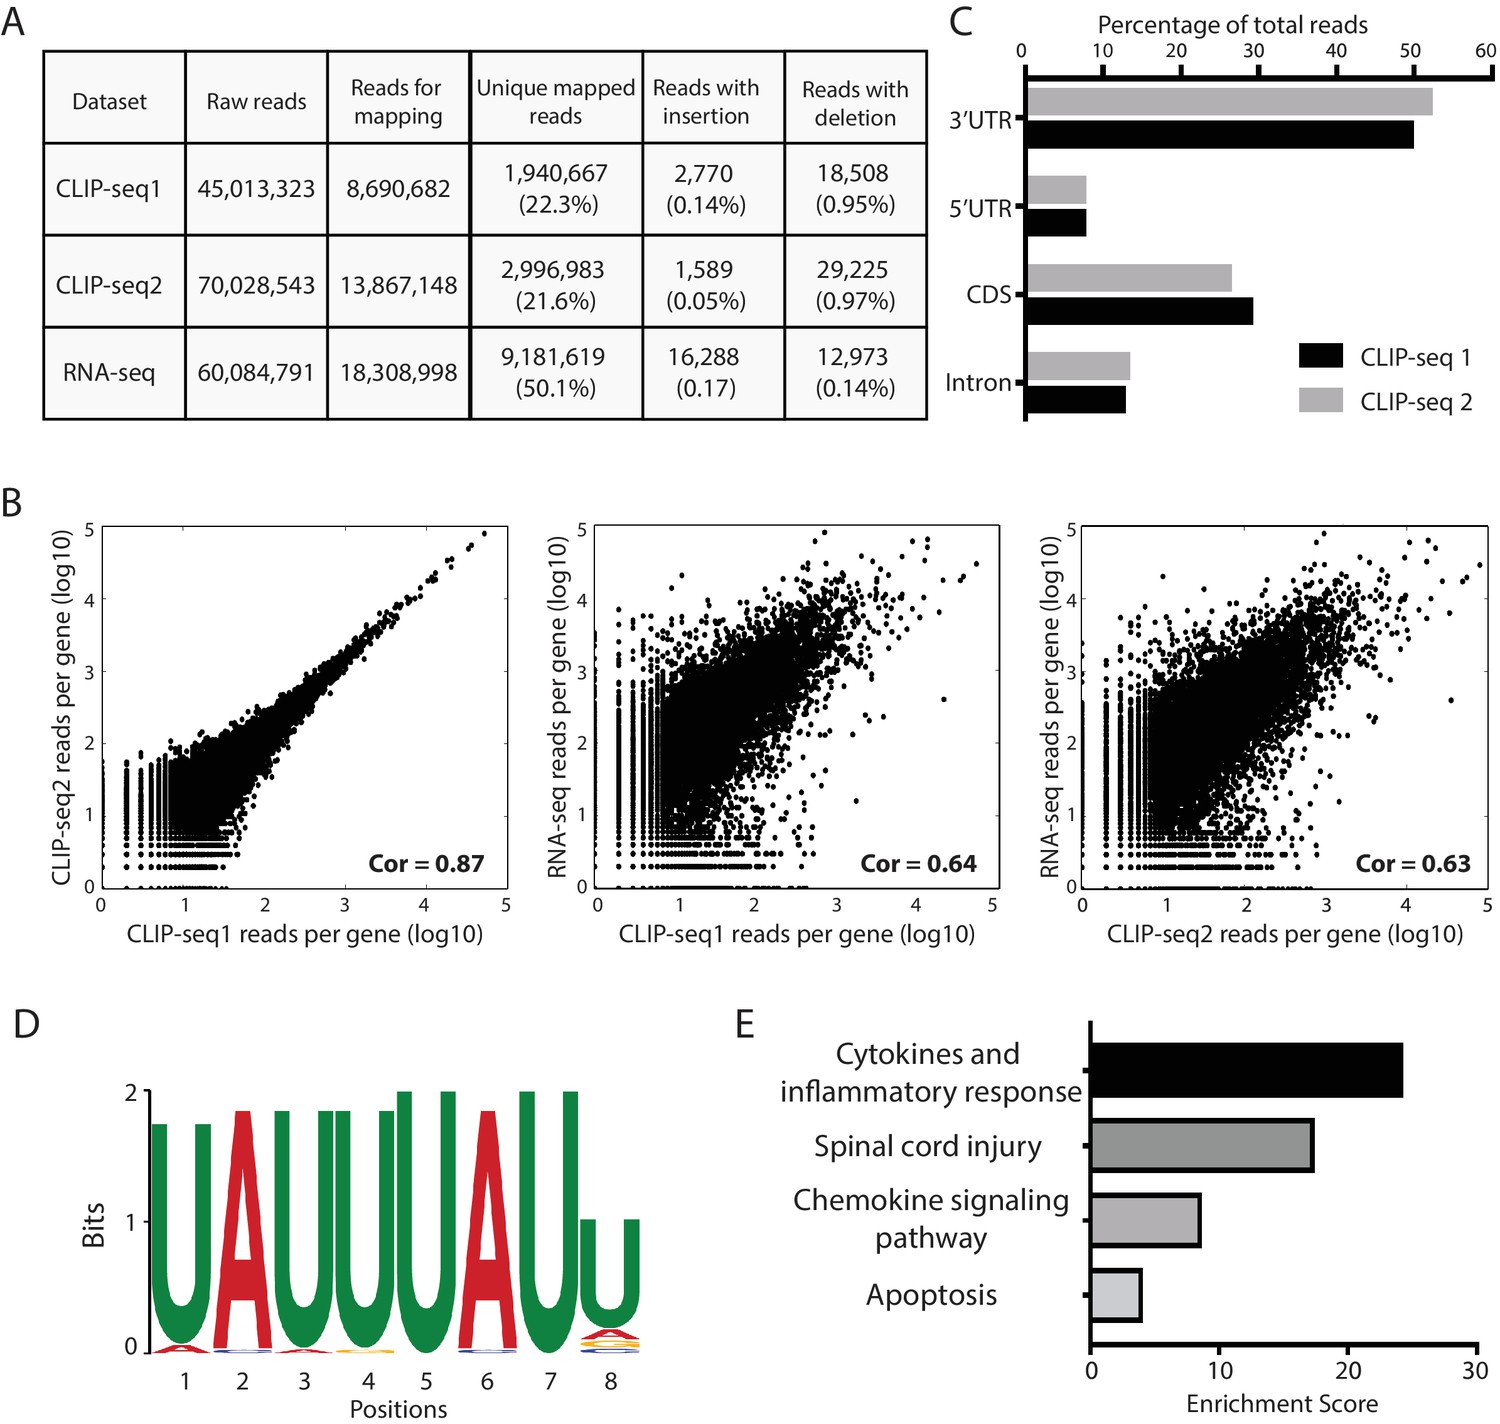
Transcriptome-wide identification of Zfp36 target mRNAs using CLIP-seq.
(A) A Table summarizing the number of uniquely mapped reads to the mouse genome for the CLIP-seq duplicates and RNA-seq. (B) Log plots of the number of uniquely mapped reads per gene from the CLIP-seq duplicates and the mRNA-seq. Each dot represents a gene. Pearson’s correlation coefficients (Cor) are indicated. (C) CLIP-seq reads distribution within protein coding genes. For the CLIP-seq reads uniquely mapped to mRNAs, their percentages in the 3’UTR, 5’UTR, CDS, and intron regions are shown. (D) Over-represented Zfp36-binding motifs identified by CLIP-seq. The motif was identified by MEME analysis on the Zfp36 binding clusters within mRNAs. The E-value is 1.6e-22. (E) Gene ontology analysis of the Zfp36 target mRNAs in activated BMDMs.
Figure 6
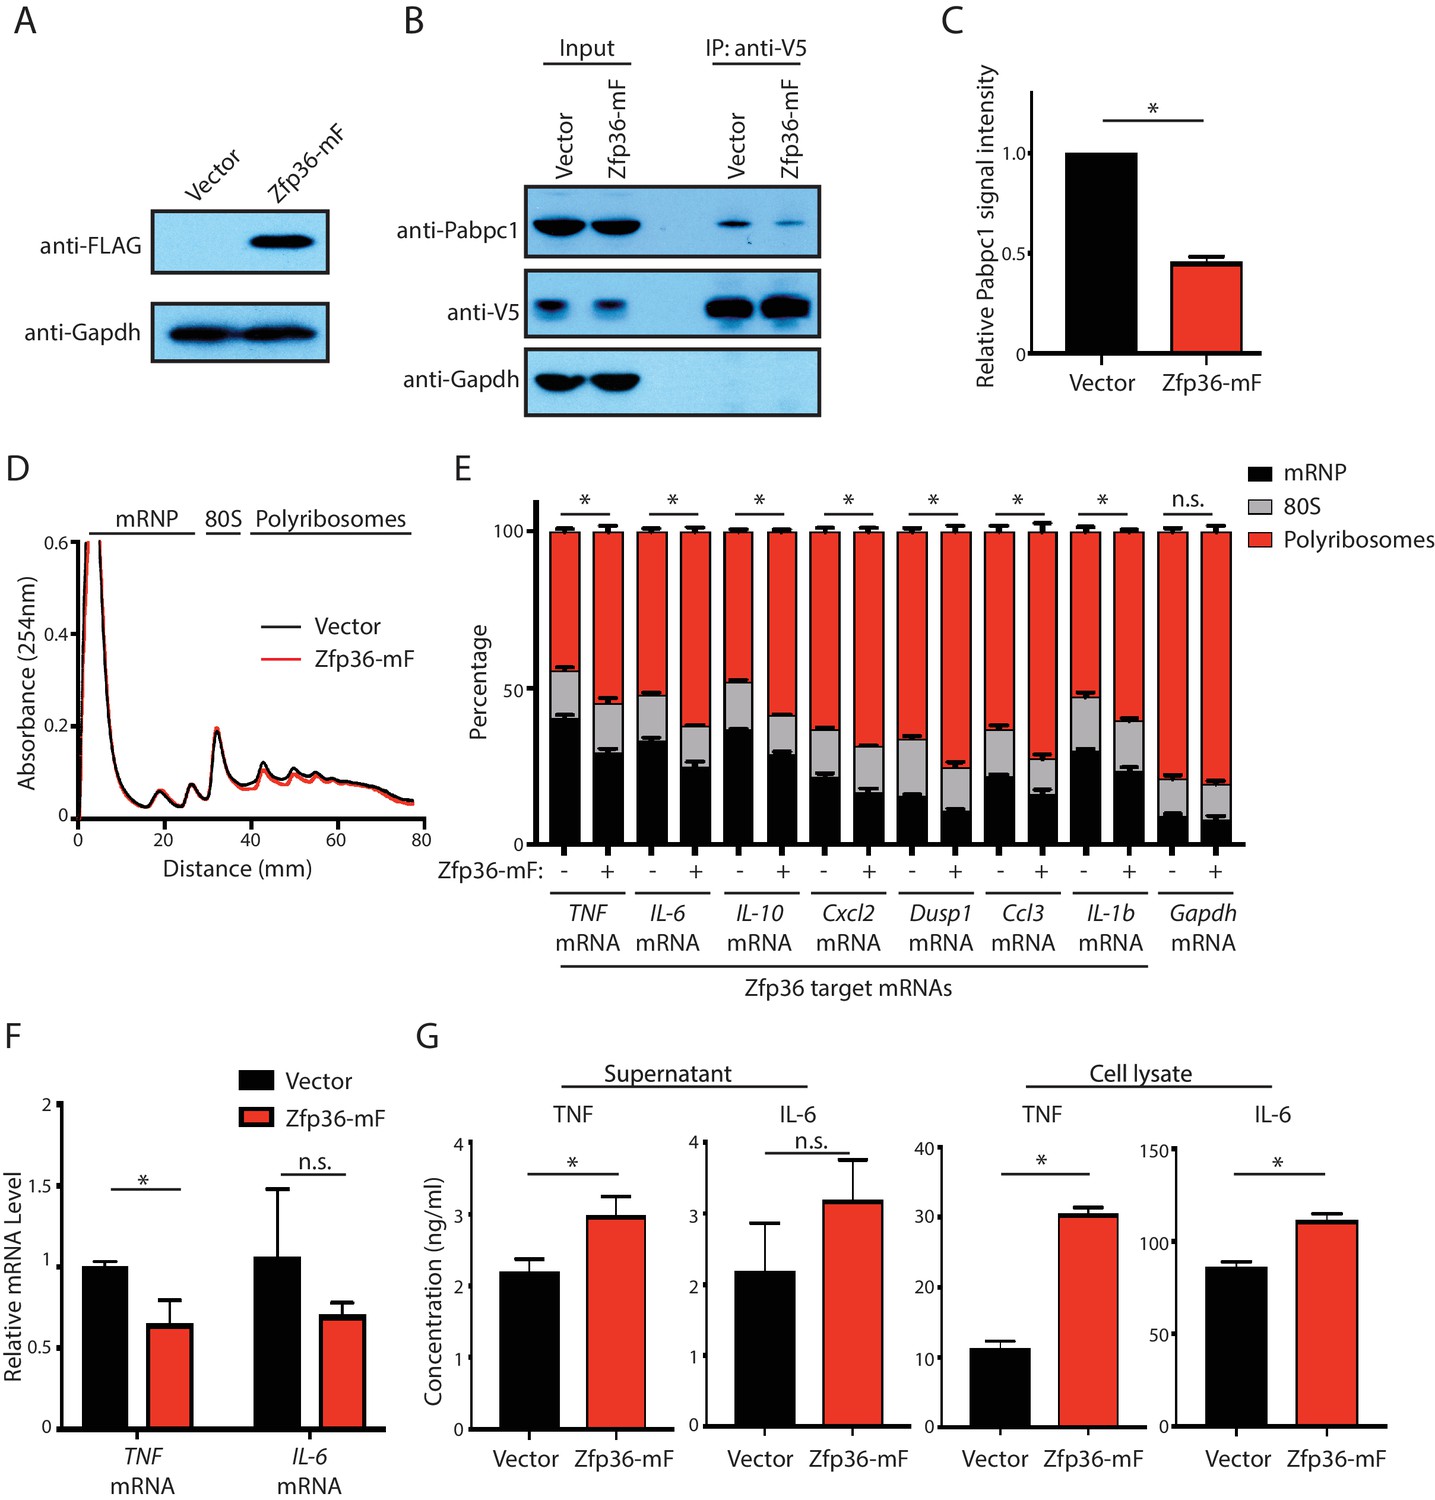
The Zfp36-Pabpc1 interaction is important for Zfp36-mediated translational repression in LPS-stimulated BMDM.
(A) Expression of the Zfp36-mF fragment in LPS-stimulated BMDMs. BMDMs from the Zfp36-V5 mice were transduced with either an empty retroviral vector or a retroviral vector expressing the Zfp36-mF fragment (Figure 3E). The transduced BMDMs were treated with LPS for 4 hr, and the expression level of the Zfp36-mF was monitored by Western blot using the indicated antibodies. (B) Zfp36-mF attenuates the endogenous Zfp36-Pabpc1 interaction in activated BMDMs. The Zfp36 was IPed with RNaseA (200 ng/ml) from the cell lysates of the LPS-stimulated transduced BMDMs in (A) using an anti-V5 antibody. SDS-PAGE and Western blot were used to analyze the indicated proteins in the input and IP samples. (C) Quantification of the Zfp36-Pabpc1 interaction. The IPed endogenous Pabpc1 were quantified by the ImageJ, and the Pabpc1 intensity from the BMDMs expressing the empty vector was set as 1 for relative quantification. (D) Polysome analysis of Zfp36-mF expressing primary BMDMs. (E) Zfp36 target mRNAs are translationally up-regulated in Zfp36-mF expressing BMDMs. The mRNA distribution in the mRNP, the 80S, and the polyribosome fractions (shown in D) were quantified by qRT-PCR in the activated BMDMs expressing either Zfp36-mF (+) or an empty retroviral vector (-), respectively. (F) Zfp36 target mRNA levels were not dramatically changed in Zfp36-mF expressing BMDMs. TNF and IL-6 mRNAs were quantified by qRT-PCR in the activated BMDMs expressing either Zfp36-mF or an empty vector, respectively. 18S rRNA was used for normalization. (G) Proteins from Zfp36 target mRNAs are increased upon attenuating the Zfp36-Pabpc1 interaction. TNF and IL-6 proteins were quantified by ELISA in the cell lysate and supernatant of the Zfp36-mF expressing BMDMs and the control BMDMs, respectively. The results represent the means (± SD) of three independent experiments. *p<0.05, and n.s. not significant by the Student’s t-test.
Figure 7
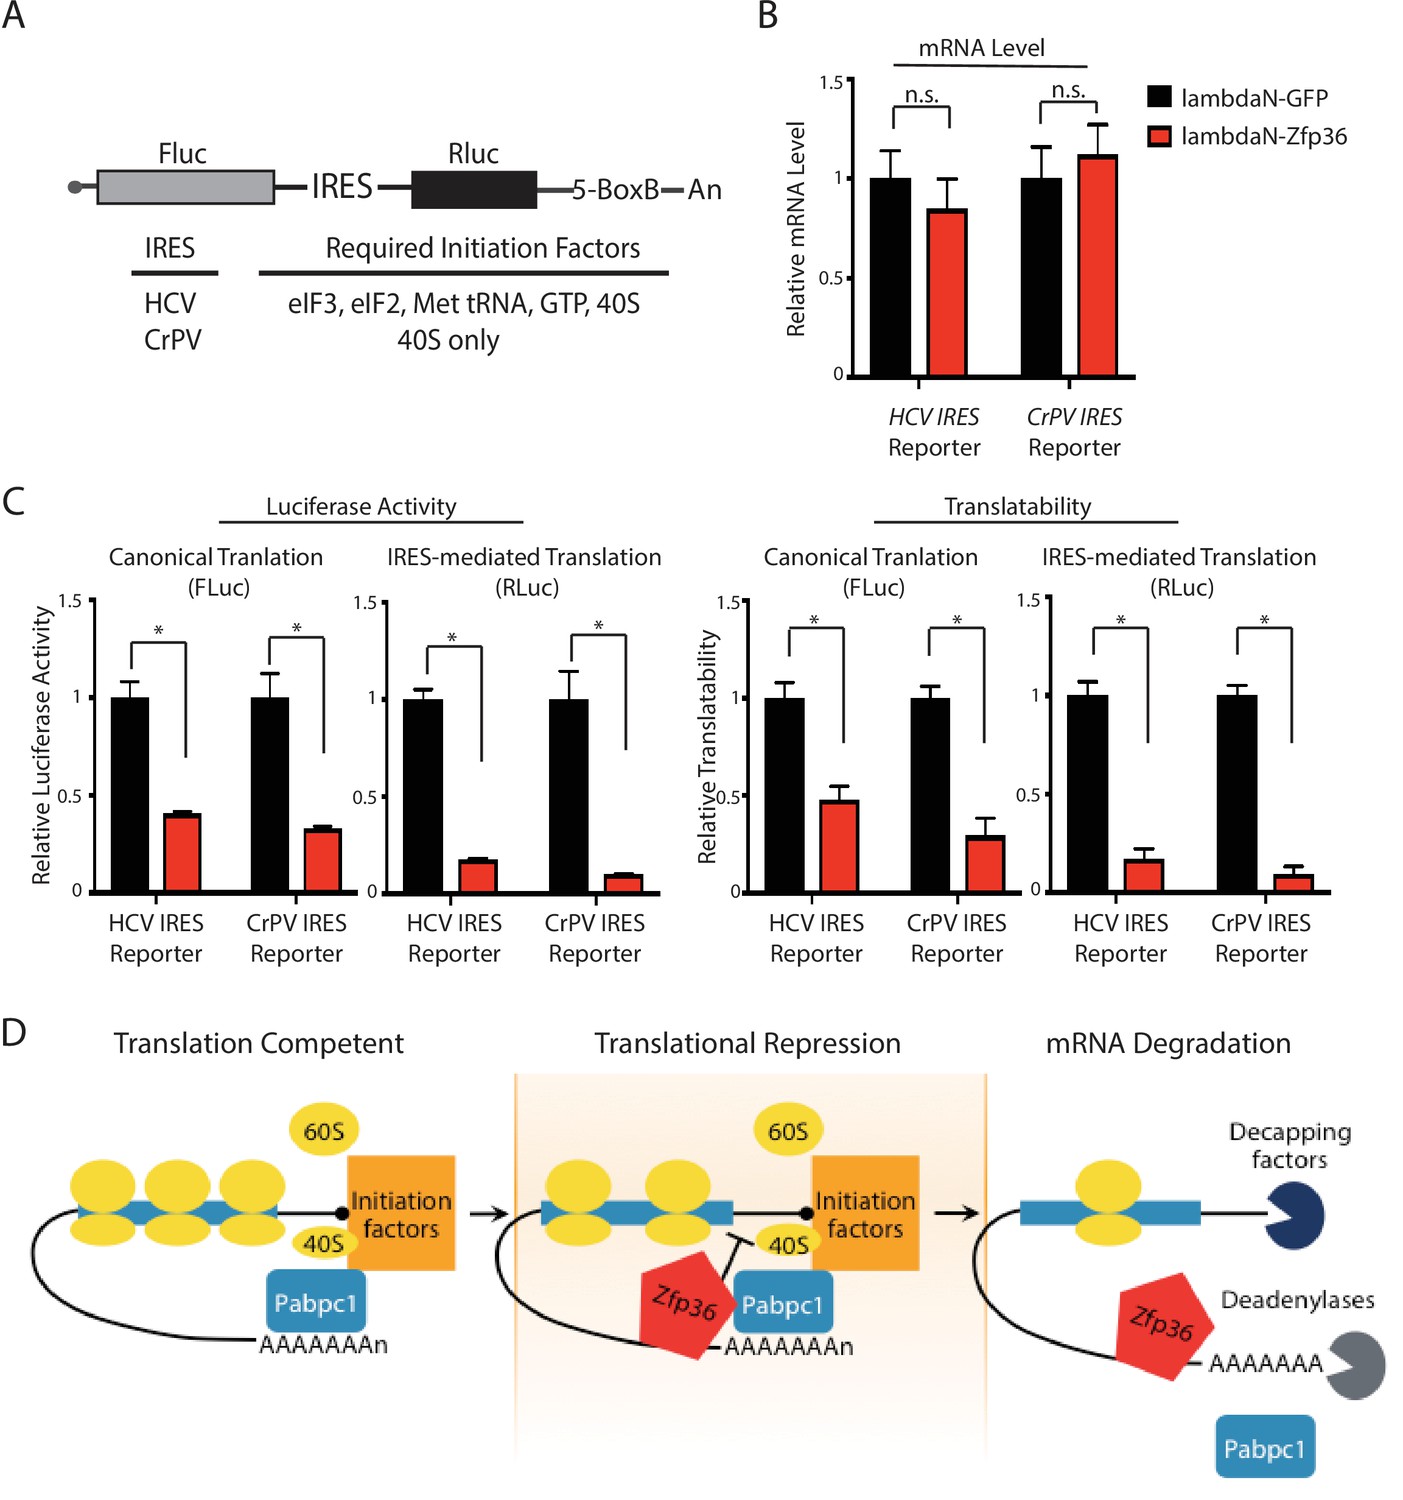
Zfp36 represses translation at similar steps as Pabpc1 regulates translation.
(A) Schematic presentation of the bicistronic luciferase reporter system for dissecting how Zfp36 represses translation. (B) Tethering Zfp36 does not change the mRNA levels of the bicistronic reporters. The bicistronic reporter plasmid (either the HCV reporter or the CrPV reporter) was co-transfected with the λN-GFP plasmid or the λN-Zfp36 plasmid into 293 T cells, respectively. The reporter mRNA levels from the transfected 293 T cells were quantified by qRT-PCR, and 18S rRNA was used for normalization. (C) Zfp36 inhibits both canonical translation and IRES-mediated translation. The bicistronic reporter plasmid was co-transfected with either the λN-GFP plasmid or the λN-Zfp36 plasmid into 293 T cells, respectively. The firefly (FLuc) and renilla (RLuc) luciferase activities were measured at 24–30 hr post-transfection. The translatability is calculated as the luciferase activity normalized by the reporter mRNA level. (D) A model for Zfp36-mediated regulation of gene expression in activated BMDMs. All the quantification results represent the means (± SD) of three independent experiments. *p<0.05, and n.s. not significantly different by the Student’s t-test.
Additional files
-
Supplementary file 1
TEs of mRNAs during the BMDM-mediated inflammatory response.
The first tab listed the TEs of the differentially translated mRNAs during the inflammatory response. The second tab listed the TEs of all the mRNAs during the inflammatory response.
- https://doi.org/10.7554/eLife.27786.017
-
Supplementary file 2
Proteins identified by the TMT proteomic analysis.
- https://doi.org/10.7554/eLife.27786.018
-
Supplementary file 3
Target mRNAs of the endogenous Zfp36 in activated BMDMs.
- https://doi.org/10.7554/eLife.27786.019
-
Supplementary file 4
Plasmids, antibodies, chemicals, and oligoes used in this study.
- https://doi.org/10.7554/eLife.27786.020
Download links
A two-part list of links to download the article, or parts of the article, in various formats.
Downloads (link to download the article as PDF)
Open citations (links to open the citations from this article in various online reference manager services)
Cite this article (links to download the citations from this article in formats compatible with various reference manager tools)
Translation repression via modulation of the cytoplasmic poly(A)-binding protein in the inflammatory response
eLife 6:e27786.
https://doi.org/10.7554/eLife.27786


