Deconstruction of the Ras switching cycle through saturation mutagenesis
- University of California, Berkeley, United States
- Howard Hughes Medical Institute, University of California, Berkeley, United States
- Ragon Institute of MGH, MIT and Harvard, United States
- Massachusetts Institute of Technology, United States
- University of California, San Francisco, United States
- University of Texas Southwestern Medical Center, United States
- Lawrence Berkeley National Laboratory, United States
Figures
Figure 1 with 5 supplements

The Ras switching cycle and the bacterial two-hybrid system.
(A) Ras cycles between an active, GTP-bound state and an inactive, GDP-bound state. Ras•GTP binds to effector proteins, such as Raf kinase, which binds to Switch I. The intrinsic hydrolysis of GTP is slow, unless catalyzed by a GTPase activating protein (GAP) which binds to Switch I. Intrinsic GDP release is also a slow process, unless facilitated by a guanine nucleotide exchange factor (GEF) which binds to both Switch I and Switch II. (B) Structure of Ras, highlighting secondary structure elements. (C) The bacterial two-hybrid system couples the Ras•GTP:Raf-RBD interaction to the production of an antibiotic resistance factor. The Ras variant library, the Raf-RBD, and the antibiotic resistance factor are encoded on three inducible plasmids. The GAP and GEF can also be co-expressed in the bacterial two-hybrid system. After protein expression, a fraction of the cells is removed and the plasmids encoding the Ras variant library are isolated and deep sequenced to count the frequency of each variant before antibiotic selection. The remainder of cells are subject to antibiotic selection with chloramphenicol and the plasmids encoding the Ras variant library are isolated and deep sequenced to count the frequency of each variant after antibiotic selection. The counts of each variant before and after selection are used to calculate the enrichment of each Ras variant. (D) In vitro validation of the bacterial two-hybrid system. The enrichment of individual Ras variants is approximately proportional to the change in Ras•GTP:Raf-RBD binding free energy upon mutation. Binding free energy of individual Ras mutants was measured by isothermal titration calorimetry, where error bars represent the standard deviation from three experiments, and relative enrichment values () are derived from wild-type Ras binding to Raf-RBD in the unregulated-Ras experiment.
Figure 1—figure supplement 1
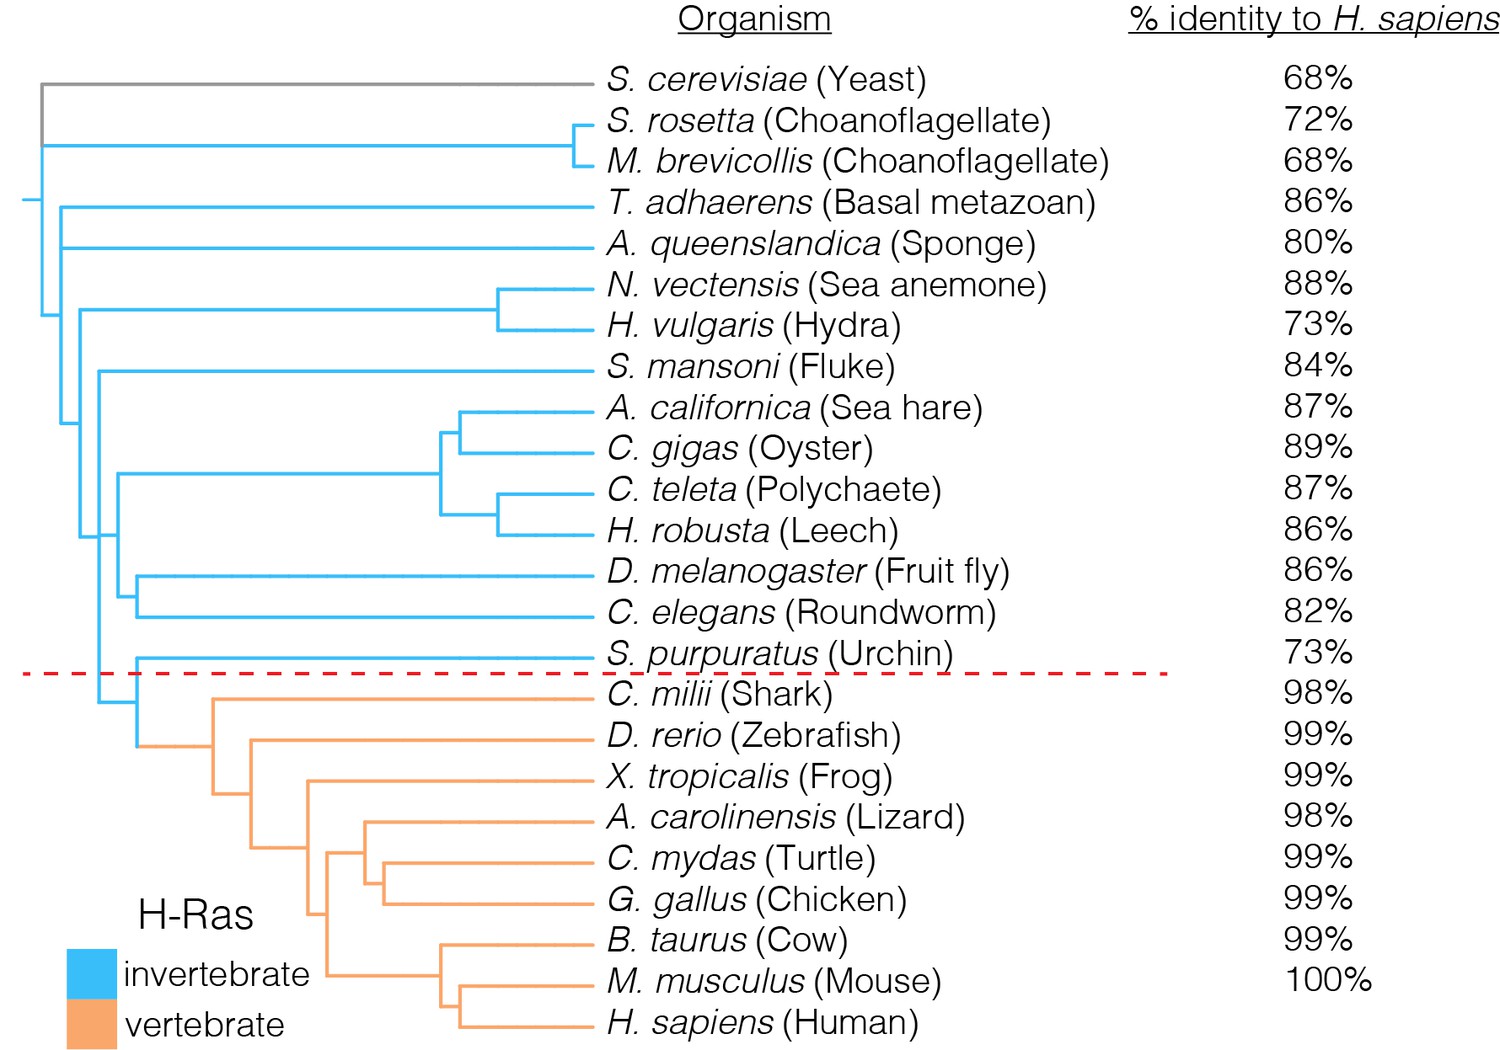
Conservation of the GTPase domains of H-Ras.
H-Ras displays a high level of sequence conservation in metazoans. Sequences of H-Ras orthologs that were most similar to human H-Ras were used in this analysis. Invertebrate Ras sequences, such as those from a choanoflagellate or a sponge, are greater than ~70% identical to human H-Ras. The H-Ras sequence is nearly invariant in vertebrates, where greater than 98% sequence identity to human H-Ras is observed. Yeast Ras is an outgroup in the phylogenetic analysis, and plays a different functional role in comparison to metazoan H-Ras.
Figure 1—figure supplement 2
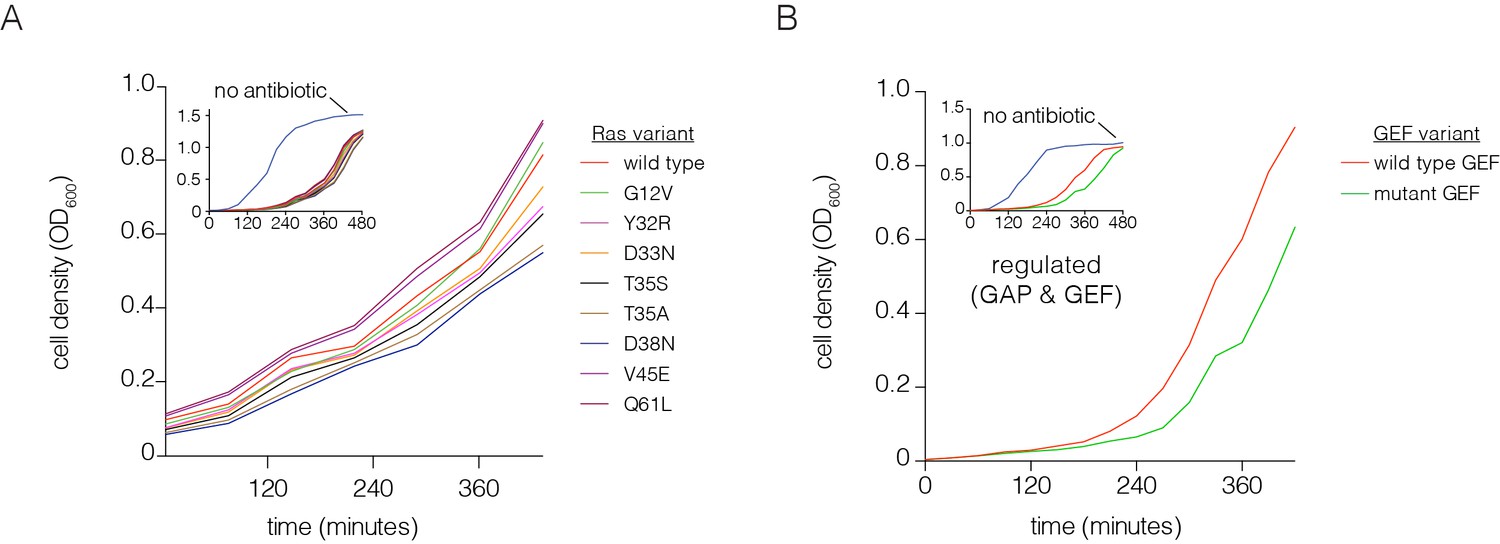
Optimization of the bacterial two-hybrid system.
(A) Growth rate differences are observed for Ras variants that perturb Raf-RBD binding affinity in the presence of chloramphenicol. Cells rapidly grow to high density when no chloramphenicol is added. Oncogenic mutations exhibit faster growth due to increased CAT production (G12V, Q61L). The other mutations shown here weaken Ras•GTP:Raf-RBD binding affinity and lead to decreased growth rates. These growth curves were measured without a GAP or GEF. (B) Growth rate differences are observed with co-expressed p120 RasGAP (GAP) and RasGRP1 (GEF). Cells grow to high density without chloramphenicol. In the presence of an antibiotic and co-expression of GAP and GEF, a mutation in the GEF (F929A) that impairs binding to Ras reduces the growth rate.
Figure 1—figure supplement 3
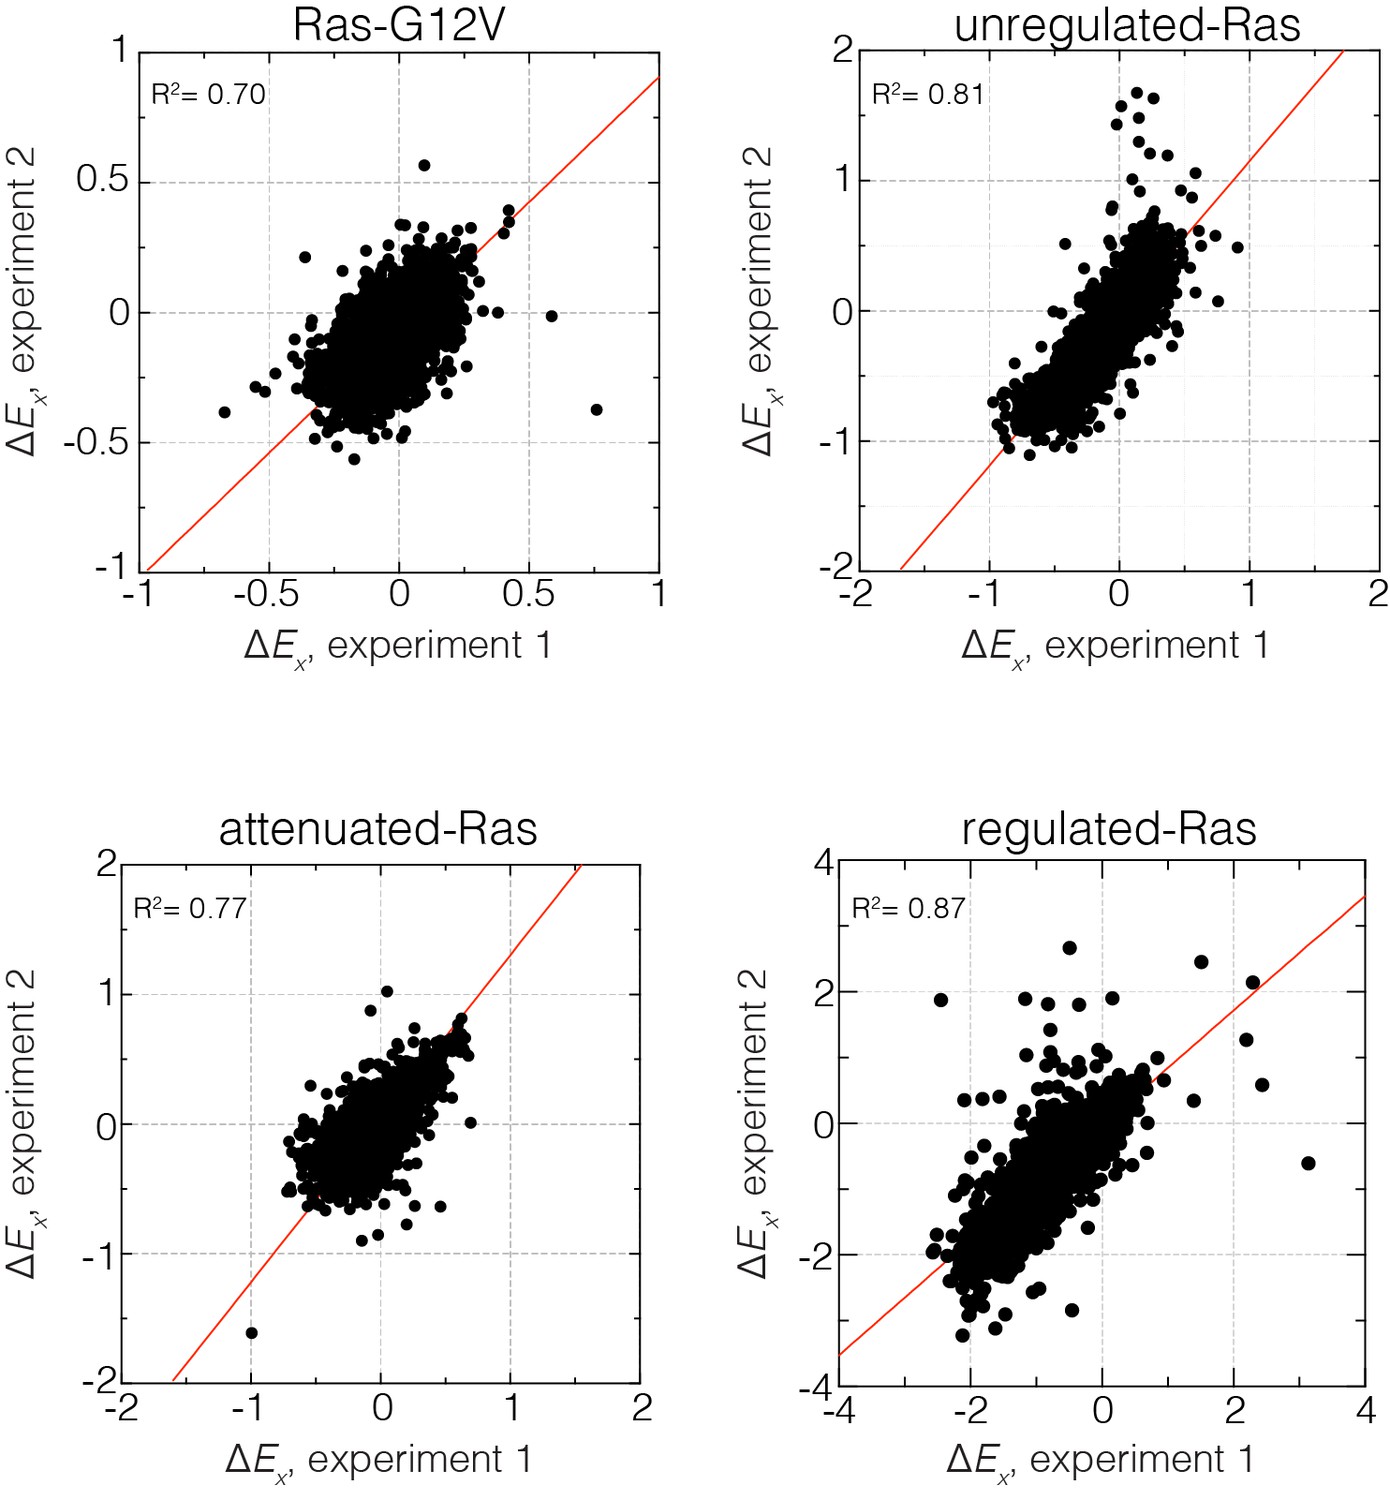
Reproducibility of the bacterial two-hybrid system.
Correlation of relative enrichment values () for all four conditions in the presence and absence of regulation for two independent experiments. Reported values are averaged over both experiments.
Figure 1—figure supplement 4
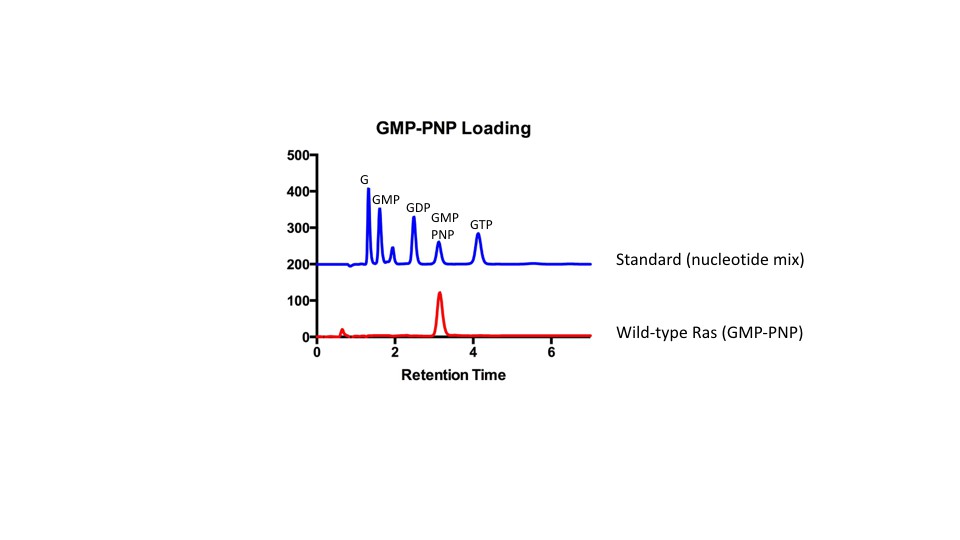
HPLC analysis of GMP-PNP loaded Ras.
HPLC was used to confirm GMP-PNP loading of Ras variants according to Eberth and Ahmadian (Eberth and Ahmadian, 2009). A mix of nucleotides (GMP, GDP, GMP-PNP, and GTP) was first injected as a reference to assess retention times of each nucleotide. Next, GMP-PNP loaded Ras was injected to confirm that the peak to the bound nucleotide corresponded to the peak obtained from the reference.
Figure 1—figure supplement 5
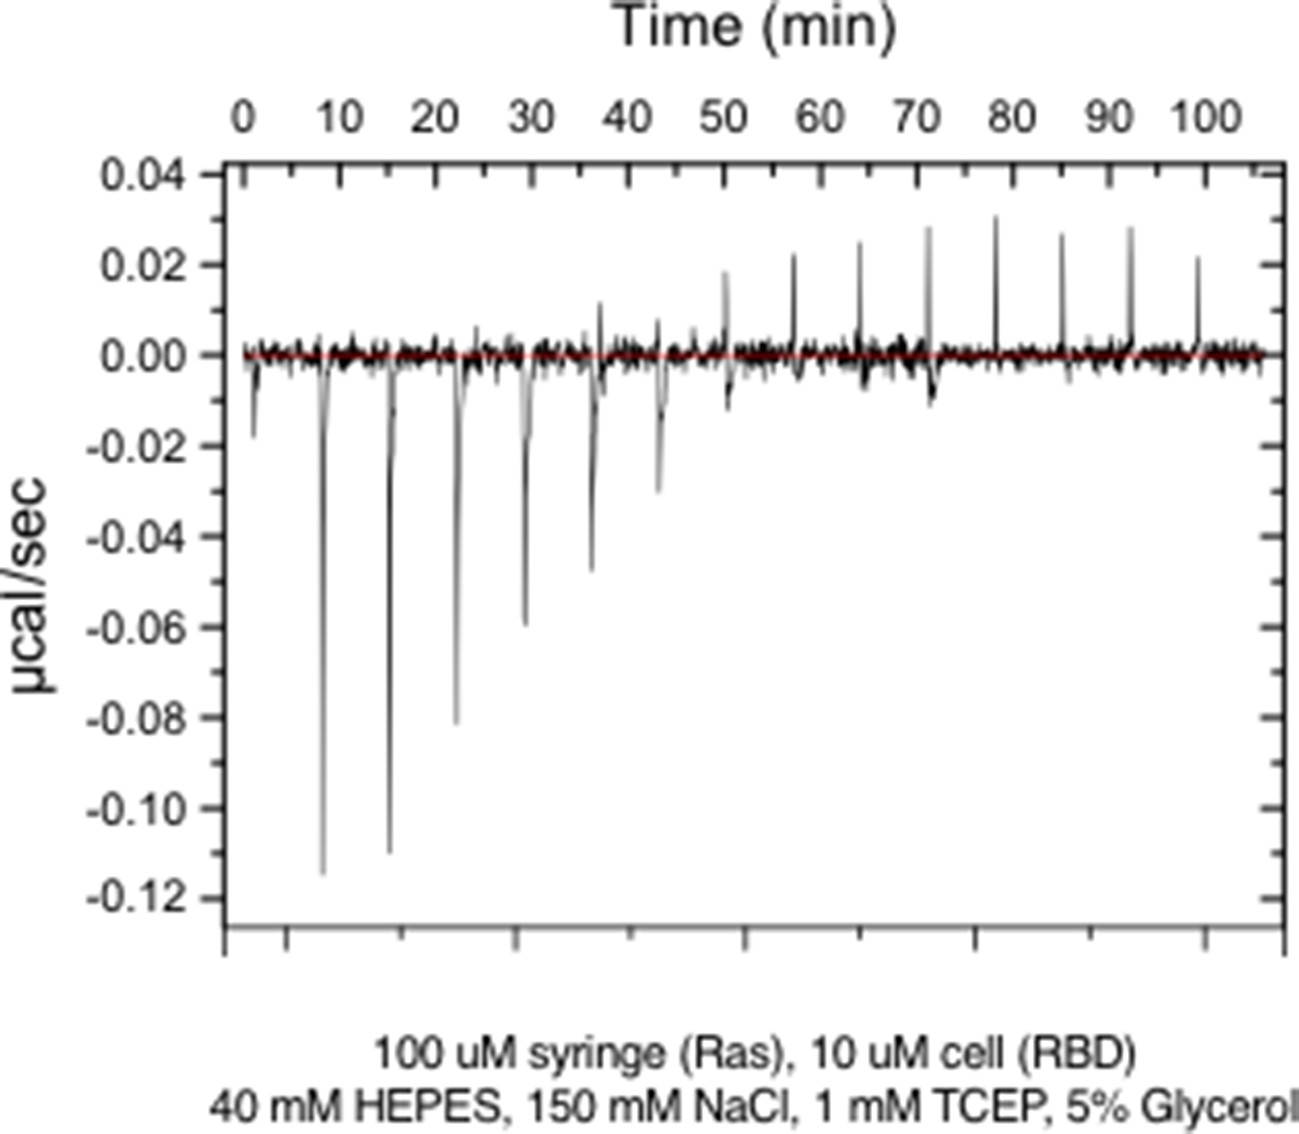
Raw ITC data for wild-type Ras.
https://doi.org/10.7554/eLife.27810.007
Figure 2 with 2 supplements
Mutational tolerance of Ras in the regulated-Ras experiment.
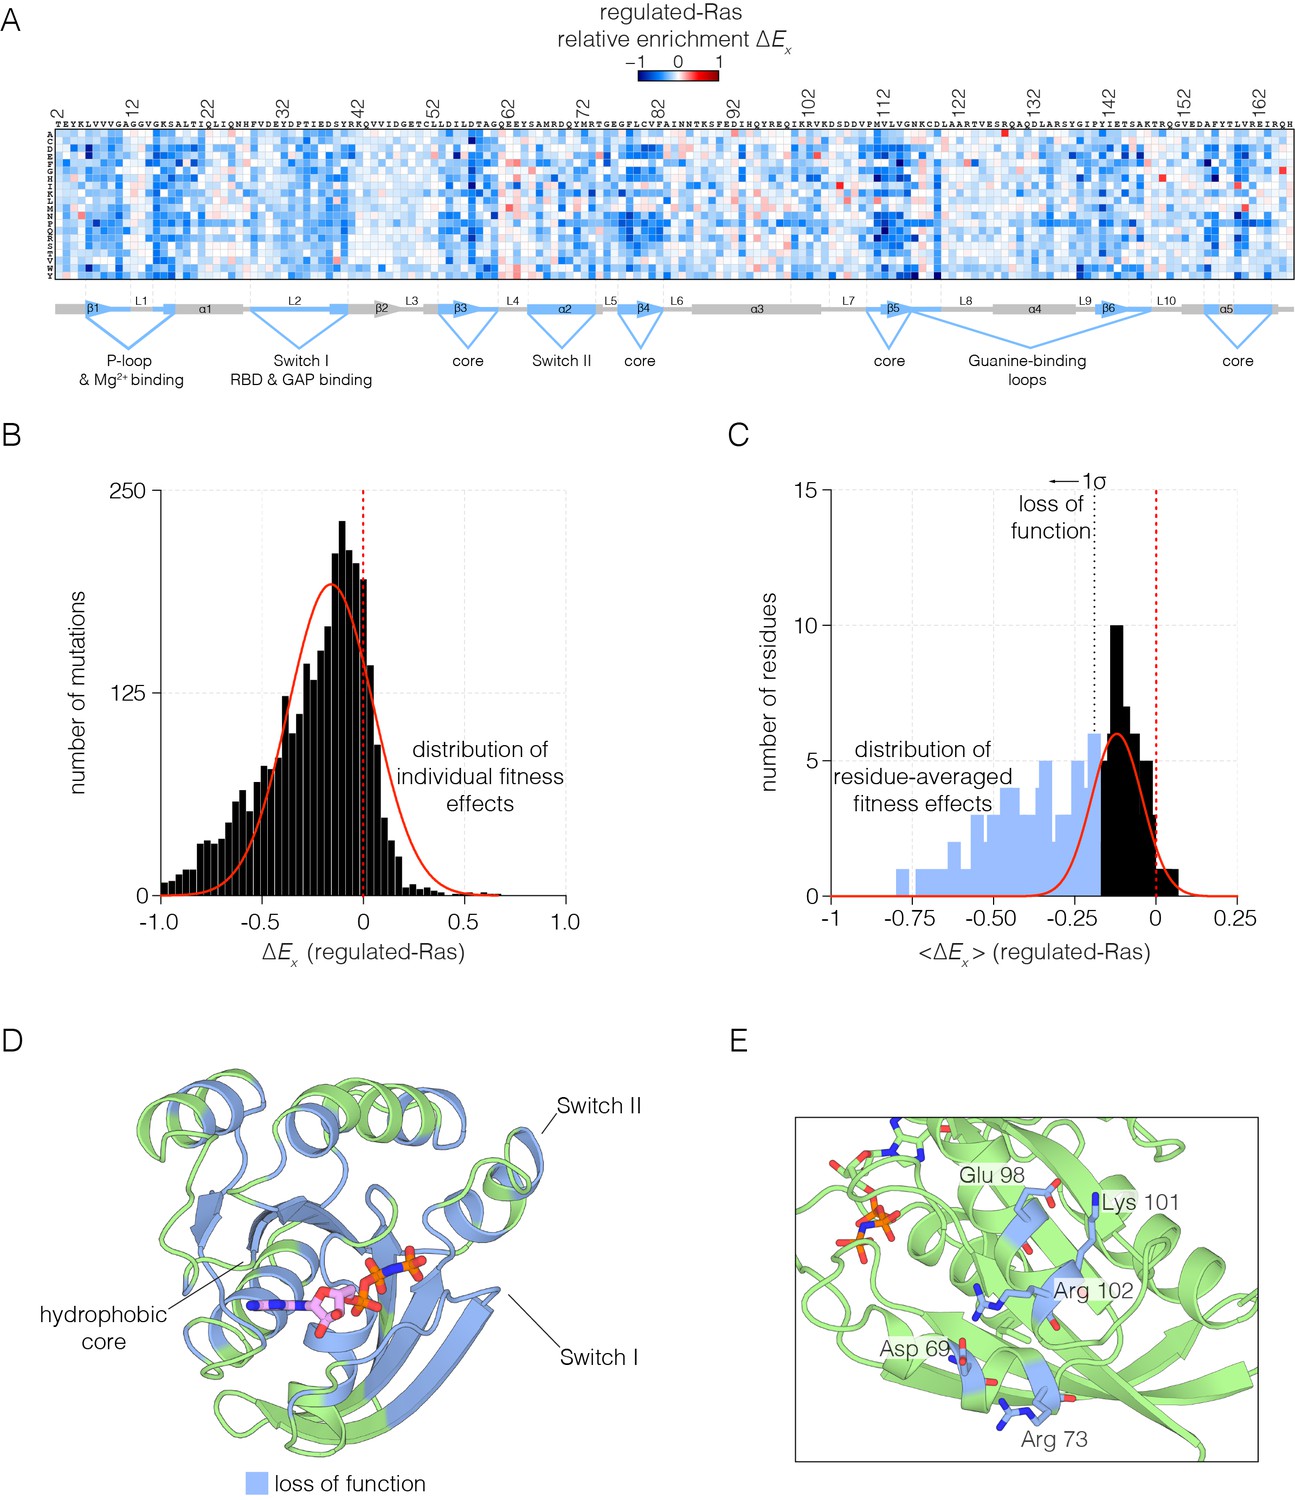
(A) The results of the regulated-Ras experiment are shown in the form of a 165 × 20 matrix. Each row of the matrix represents one of the 20 amino acids, and each column shows one of the residues of Ras, from 2 to 166. Each entry in the matrix represents, in color-coded form, the value of the relative enrichment for the corresponding mutation (). All data are normalized to the wild type Ras reference sequence, which has a relative enrichment value of zero. The numerical values of are provided in the supplementary data. (B–C) Distribution of individual fitness effects (; left) and residue-averaged fitness effects (<>; right). Residues with a significant loss of function effect on Ras (<> < 1σ from the mean) are indicated on the residue-averaged histogram. (D) Mapping the residues that lead to a significant loss of function onto the tertiary structure of Ras. These positions include the hydrophobic core, as well as residues involved in GDP/GTP and Raf-RBD binding. (E) Additional sites of mutational sensitivity include surface residues involved in ion-pairing networks that stabilize the GTPase fold.
-
Figure 2—source data 1
Raw data for GAP- and GEF- stimulated nucleotide hydrolysis and exchange rates.
- https://doi.org/10.7554/eLife.27810.009
Figure 2—figure supplement 1
Mutational sensitivity of structural elements involved in nucleotide and effector binding.
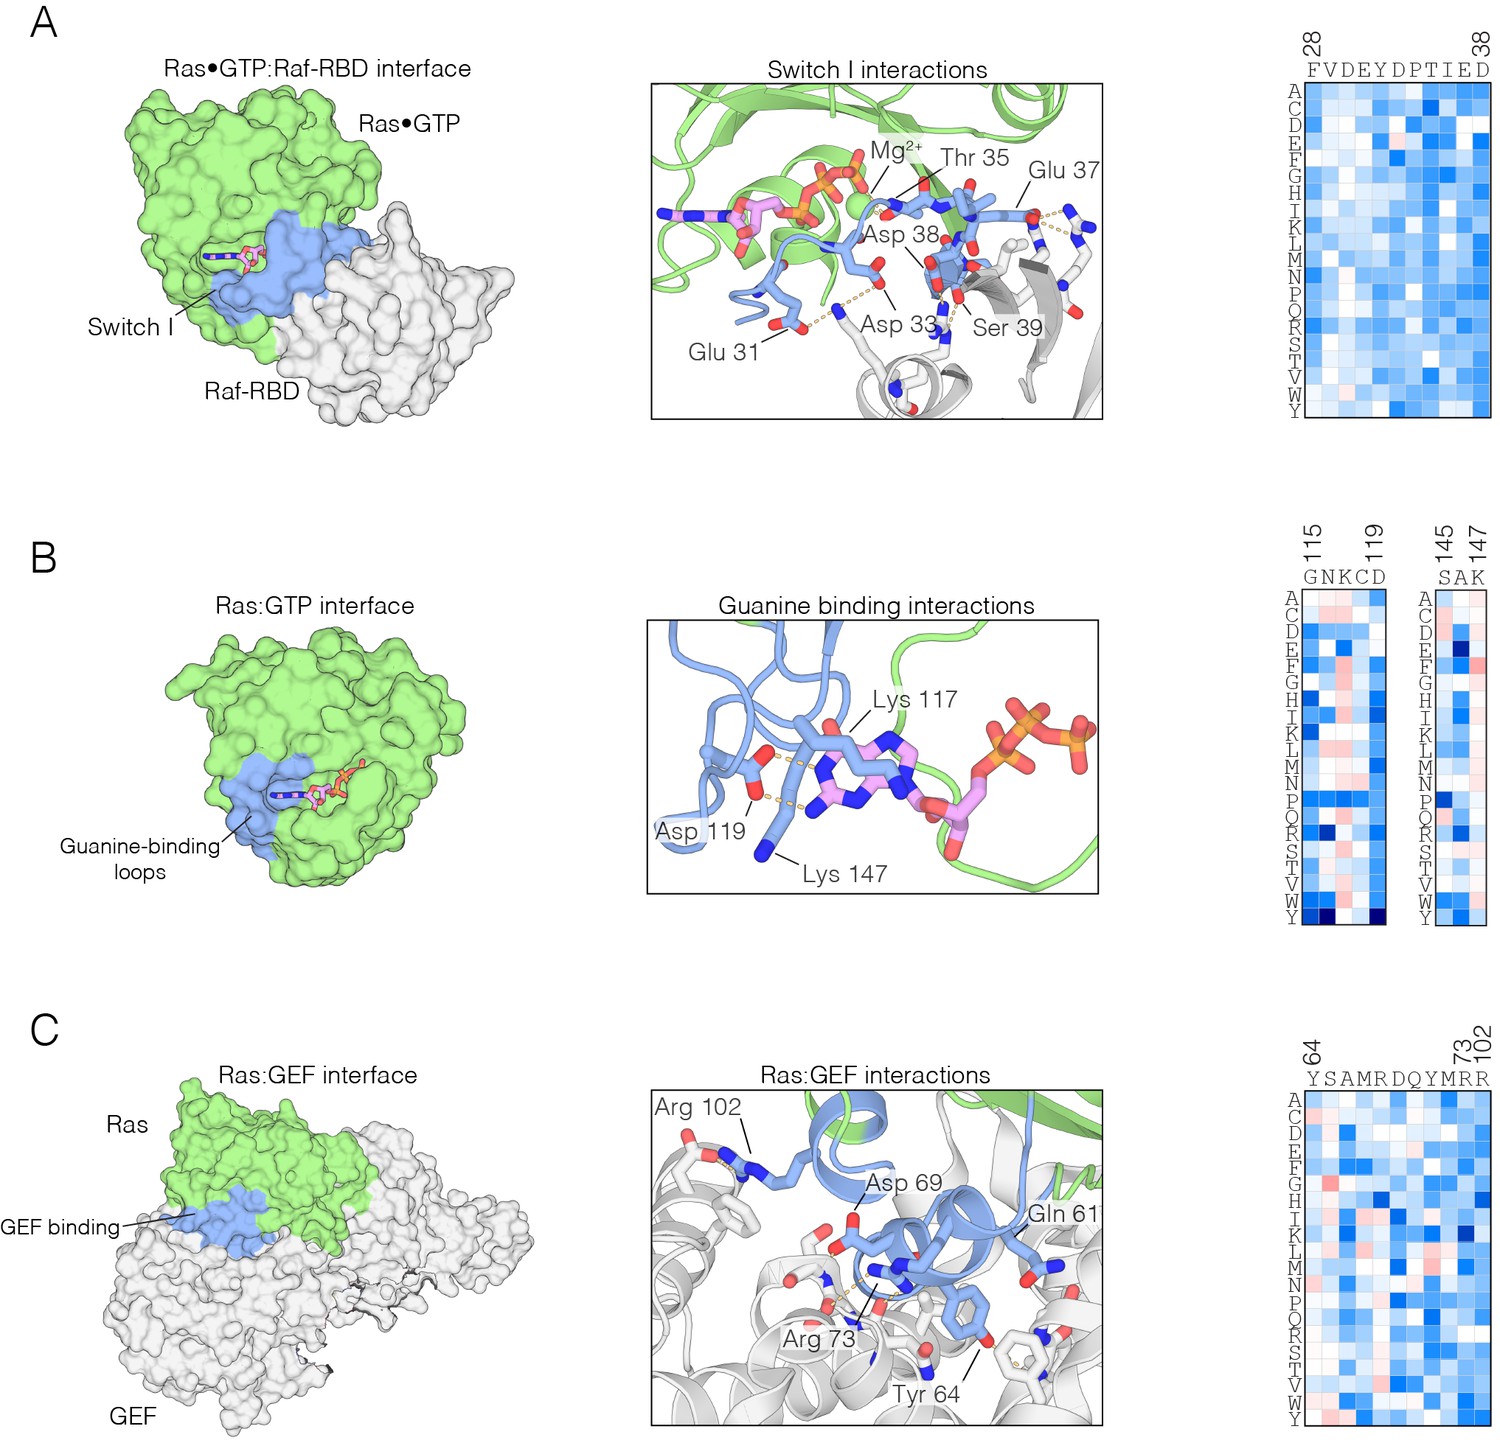
(A) The Ras•GTP:Raf-RBD complex. Mutations to Ras that affect Raf-RBD binding result in a loss-of-function. Critical interactions at the interface (blue) involving residues Glu 31, Asp 33, Thr 35, Glu 37, Asp 38, and Ser 39 are sensitive to mutation, where nearly every possible substitution is disfavored. Loss-of-function mutations at Thr 35 impact Mg2+ binding. The mutational data shown in this and the other two panels are for the regulated-Ras experiment (B) The Ras:GTP complex. Mutations to Ras that affect nucleotide binding result in a loss-of-function. Asp 119 is sensitive to mutation and critical for recognition of the guanine base, whereas Lys 117 and Lys 147 are auxiliary residues that are less sensitive to mutation. (C) The Ras:GEF complex. Mutations to Ras that perturb GEF binding result in a loss of function, since Ras is predominantly in the GDP-bound form in the bacterial two-hybrid system when a GAP is co-expressed. Critical interactions at the interface (blue) are sensitive to mutation, although some residues, such as Tyr 64, display a complex pattern of mutational sensitivity due proximity to Gln 61 which is responsible for GTP hydrolysis.
Figure 2—figure supplement 2
Validation of mutational effects through in vitro biochemical measurements of GAP- and GEF- stimulated nucleotide hydrolysis and exchange rates and a yeast growth assay.
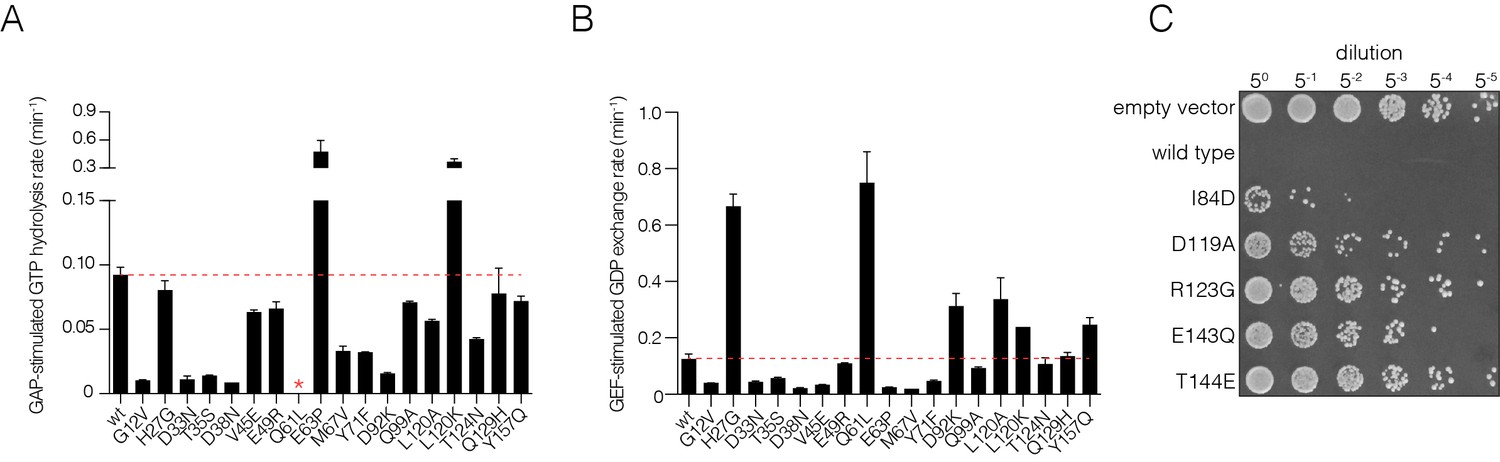
(A) GAP-stimulated GTP hydrolysis rates for a panel of Ras mutants, as measured by a fluorescent sensor for inorganic phosphate release upon hydrolysis of GTP to GDP. Mutations in Switch I (residues 28–40) directly affect GAP binding and lead to reduced GTP hydrolysis rate. (B) GEF-stimulated GDP exchange rates for a panel of Ras mutants, as measured by fluorescent-nucleotide release. Mutants in Switch II (residues 59–76) directly affect GEF binding and lead to reduced GDP release rates. (C) S. cerevisiae Ras assay for mutations that result in a loss-of-function in the bacterial two-hybrid system. Yeast cells are transformed with human Ras mutants and are assayed for growth after heat shock. Colony growth is measured upon plating five-fold serial dilutions of yeast cultures after heat shock for various Ras mutants. Wild-type human Ras renders the yeast cells highly sensitive to heat shock. Mutants that destabilize Ras by impairing nucleotide binding lessens sensitivity to heat shock and result in increased cell growth.
Figure 3
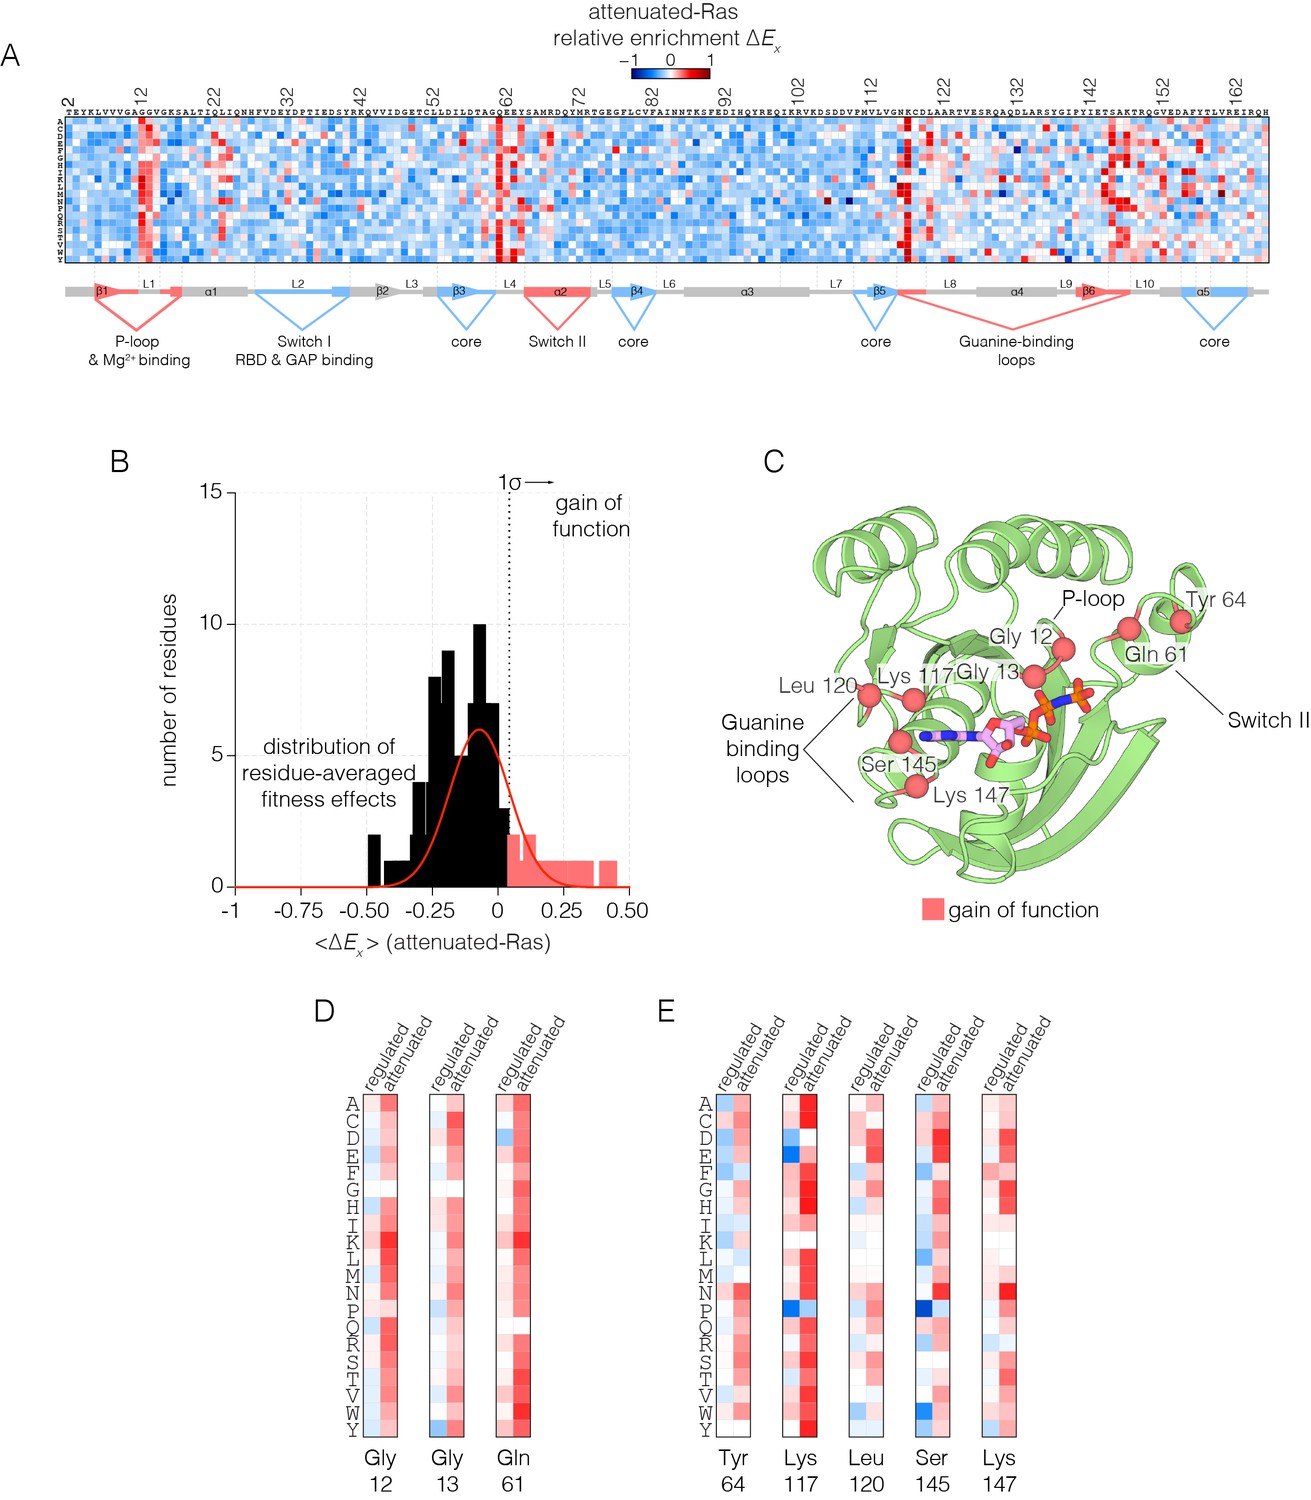
Mutational tolerance of Ras in the attenuated-Ras experiment.
(A) Relative enrichment values are shown in matrix form as in Figure 2A, for the attenuated-Ras experiment. Mutations at residues known to be mutated in human cancer (e.g. Gly 12, Gly 13, Gln 61, Lys 117) show a strong gain of function in this context. (B) Distribution of residue-averaged relative enrichment values. Residues with a significant gain of function effect on Ras (>1σ from the mean) are indicated on the histogram. (C) Mapping the residues that lead to a gain of function onto the tertiary structure of Ras. These positions span the P-loop, Switch II, and guanine binding loops of Ras and are directly involved in nucleotide coordination and hydrolysis. (D–E) Comparison of relative enrichment values for mutations at selected residues in the regulated-Ras and attenuated-Ras experiments. Substitutions at residues that are commonly mutated in cancer, such as Gly 12, Gly 13, and Gln 61, are exclusively gain-of-function in the attenuated-Ras experiment.
Figure 4 with 1 supplement
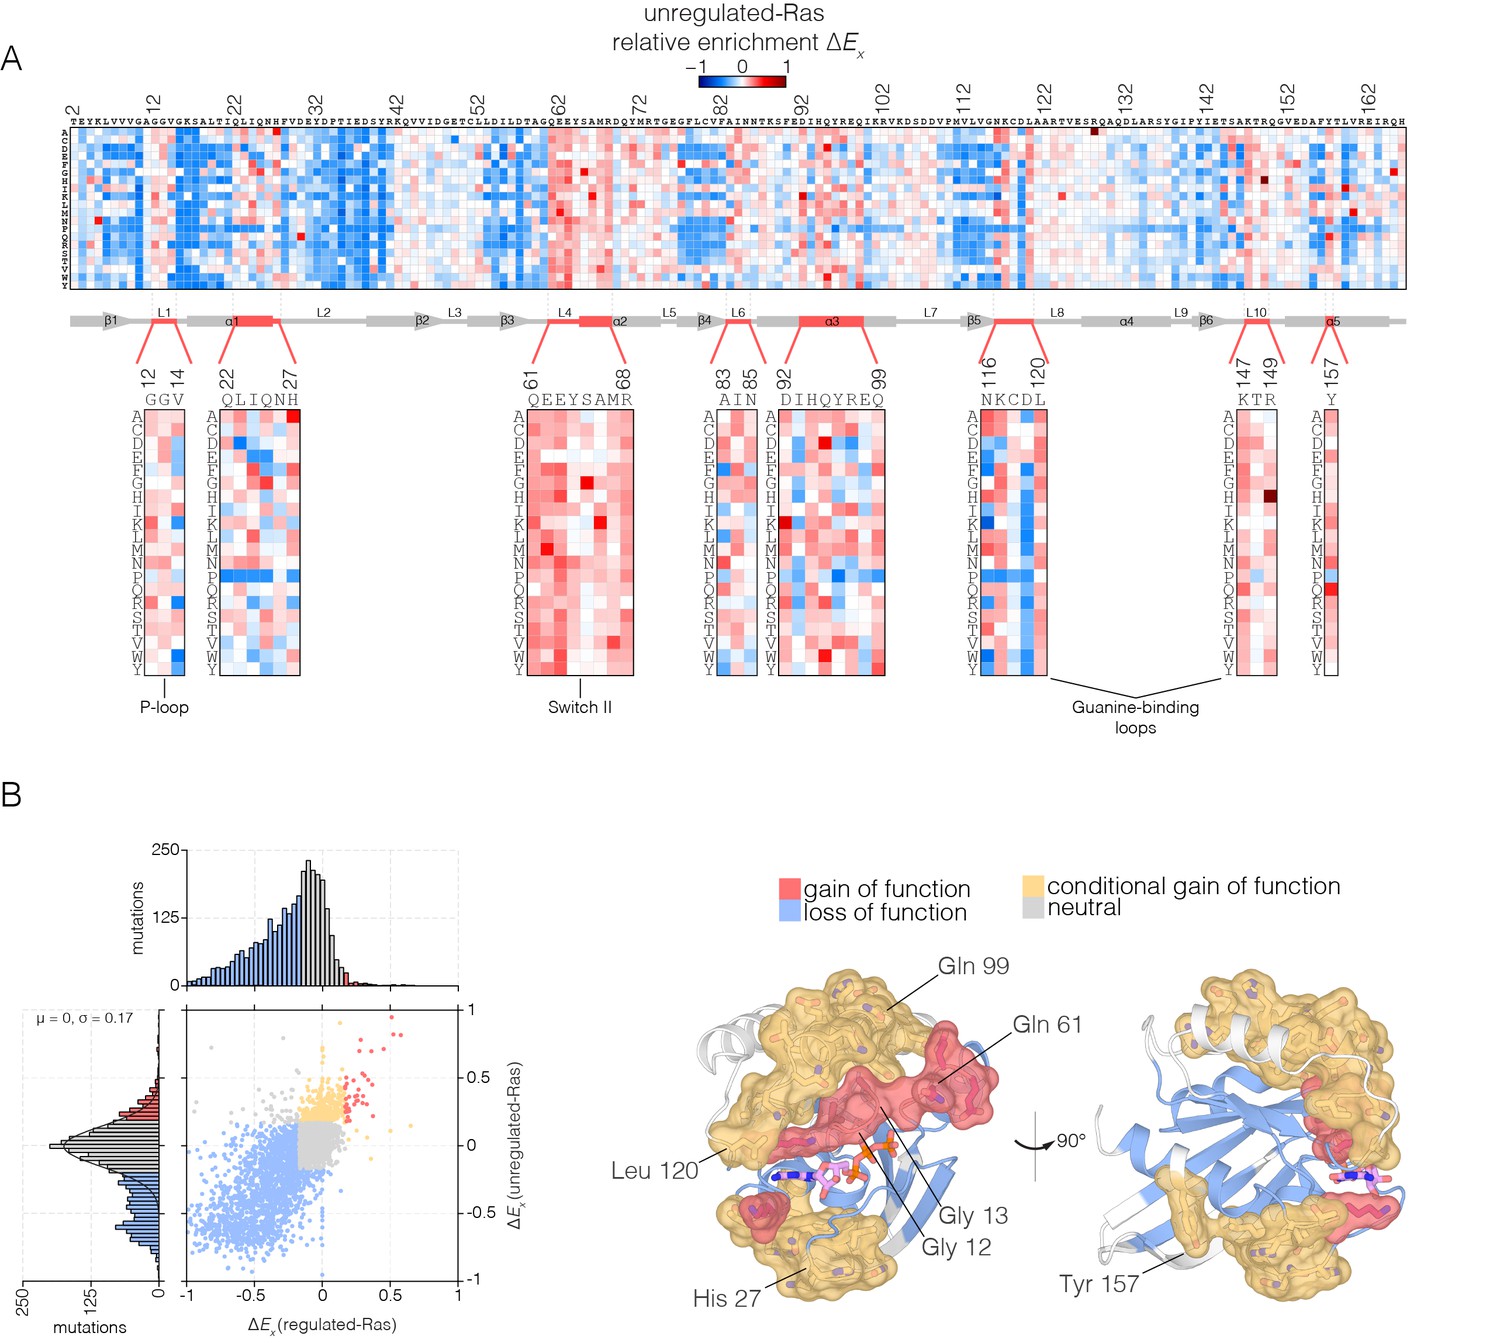
Mutational tolerance of Ras in the unregulated-Ras experiment.
(A) Relative enrichment values are shown in matrix form as in Figure 2A, for the unregulated-Ras experiment. In this experiment, Ras is expressed without the GAP and the GEF, and hotspots of activating mutations are revealed. Mutations at residues known to be mutated in human cancer (e.g. Gly 12, Gly 13, Gln 61, Lys 117) show a strong gain of function in this context. (B) (Left) A scatter plot of relative enrichment values for the regulated-Ras and unregulated-Ras experiments. The distribution of relative enrichment values for each experiment are also shown. Loss-of-function mutations are shown in blue, and neutral mutations are shown in grey. Gain-of-function mutations in both experiments are shown in red, and mutations that are only gain-of-function in the unregulated-Ras experiment, but are neutral in the regulated-Ras experiment, are shown in yellow (conditional gain of function). (Right) The spatial distribution of gain-of-function (red) and conditional gain-of-function (yellow) mutations on the three-dimensional structure of Ras. Residues that contain a majority of gain-of-function mutations from the scatter plot in (b) are colored red, and residues that contain a majority of conditional gain-of-function mutations are colored in yellow.
Figure 4—figure supplement 1
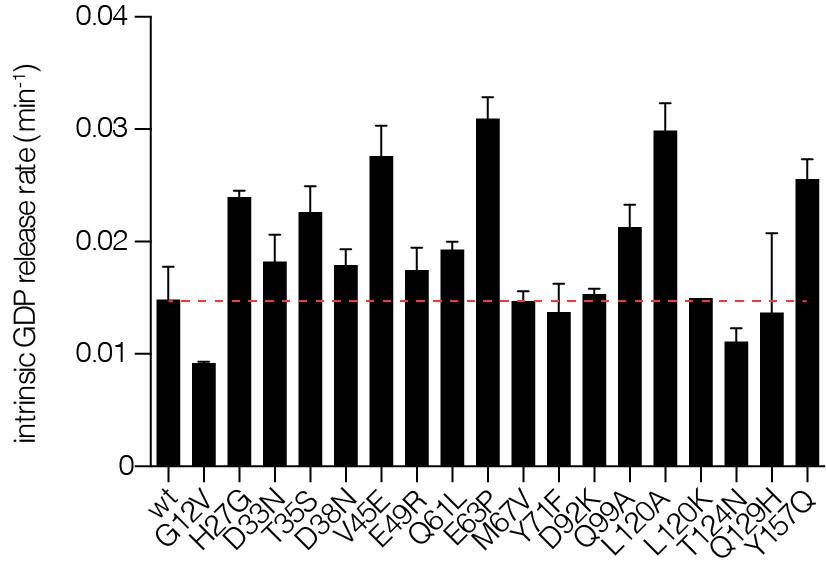
Intrinsic nucleotide release rates.
Intrinsic GDP release rates for a panel of Ras mutants, as measured by fluorescent nucleotide release. H27G, L120A, and Y157A mutants lead to increased GDP release rates.
Figure 5
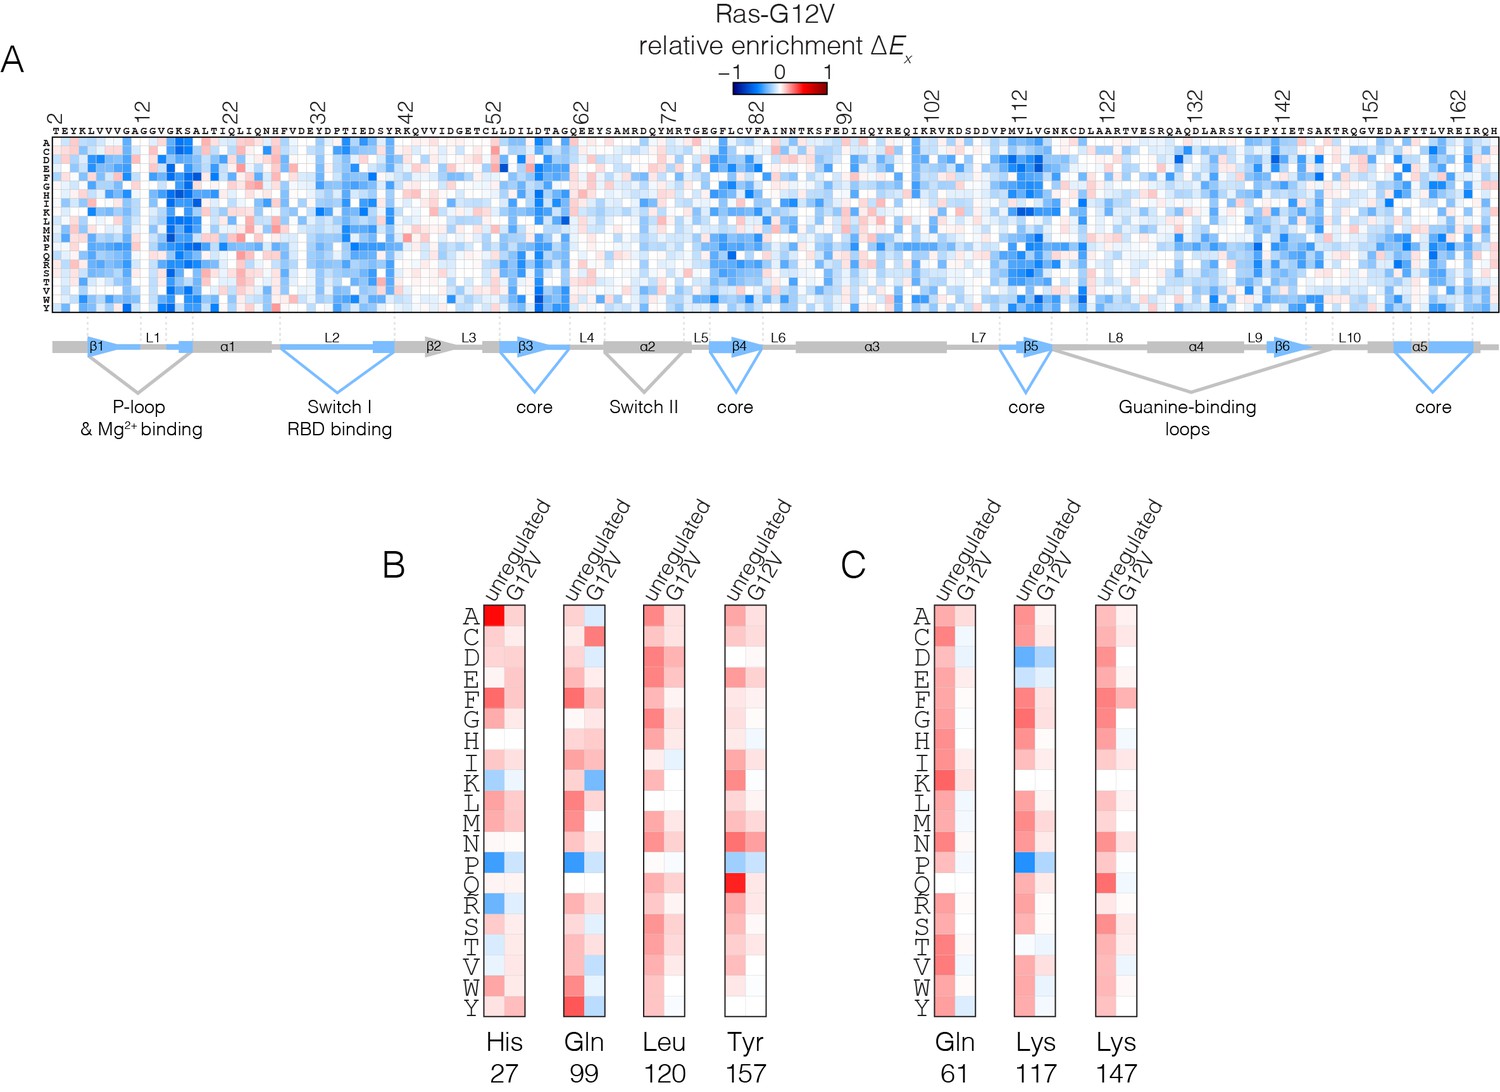
Mutational tolerance of Ras in the Ras-G12V experiment.
(A) Relative enrichment values are shown in matrix form as in Figure 2A, for the Ras-G12V experiment, in the absence of the GAP and the GEF. In this experiment, Ras shows a muted pattern of mutational sensitivity when compared to the wild-type unregulated-Ras experiment. Mutations at residues known to be mutated in human cancer (e.g. Gly 13, Gln 61, Lys 117) do not show a strong gain of function in this context. Mutations at Gly 12 are not included in the data. (B–C) Comparison of relative enrichment values for mutations at selected residues in the unregulated-Ras and Ras-G12V experiments. Substitutions at hotspot residues and residues that are commonly mutated in cancer, such as Gln 61, Lys 117, and Lys 147, result in a gain of function in the unregulated-Ras experiment, but have an attenuated effect in the Ras-G12V experiment.
Figure 6 with 2 supplements
Superposition of structures from molecular dynamics simulations of GTP-bound forms of Ras.
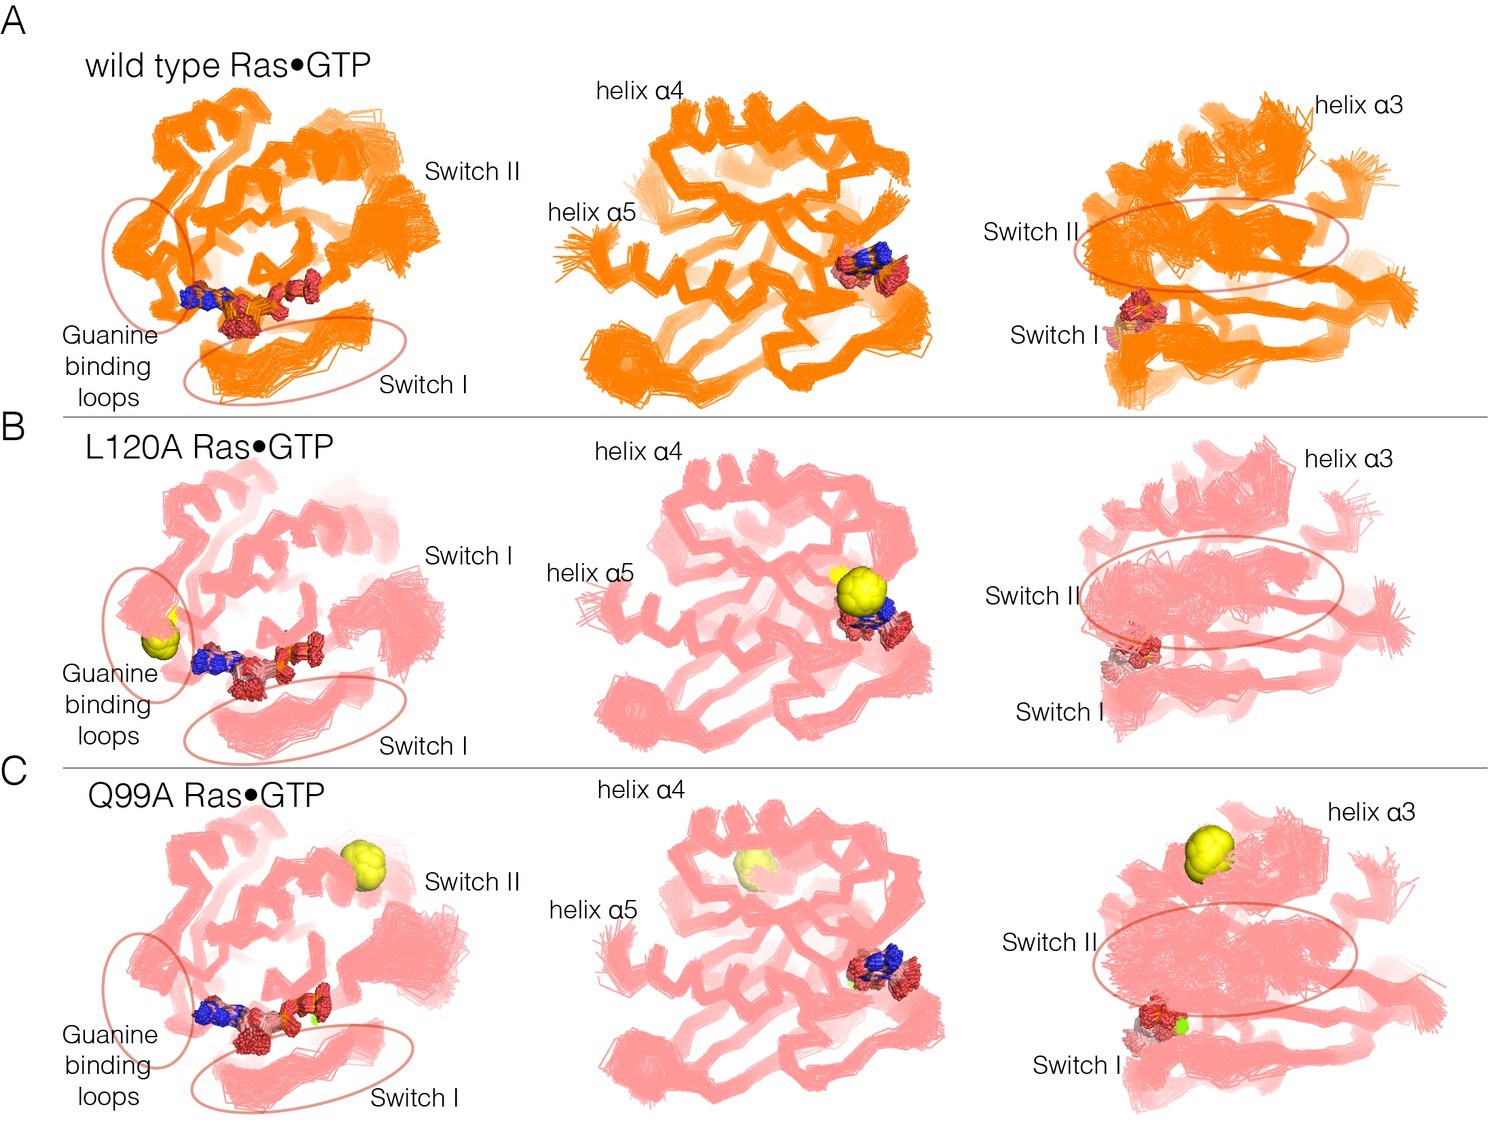
(A) Wild-type Ras•GTP. The diagrams show the superposition of 30 structures sampled evenly from two 300 ns trajectories. The diagram on the left shows a canonical view of Ras•GTP. The two other diagrams show two orthogonal views. (B) As in (A), for Ras•GTP L120A, shown as yellow spheres. (C) As in (A), for Ras•GTP Q99A, shown as yellow spheres.
Figure 6—figure supplement 1
Superposition of structures from GTP-bound simulations of wild type, H27A, and Y157A mutants.
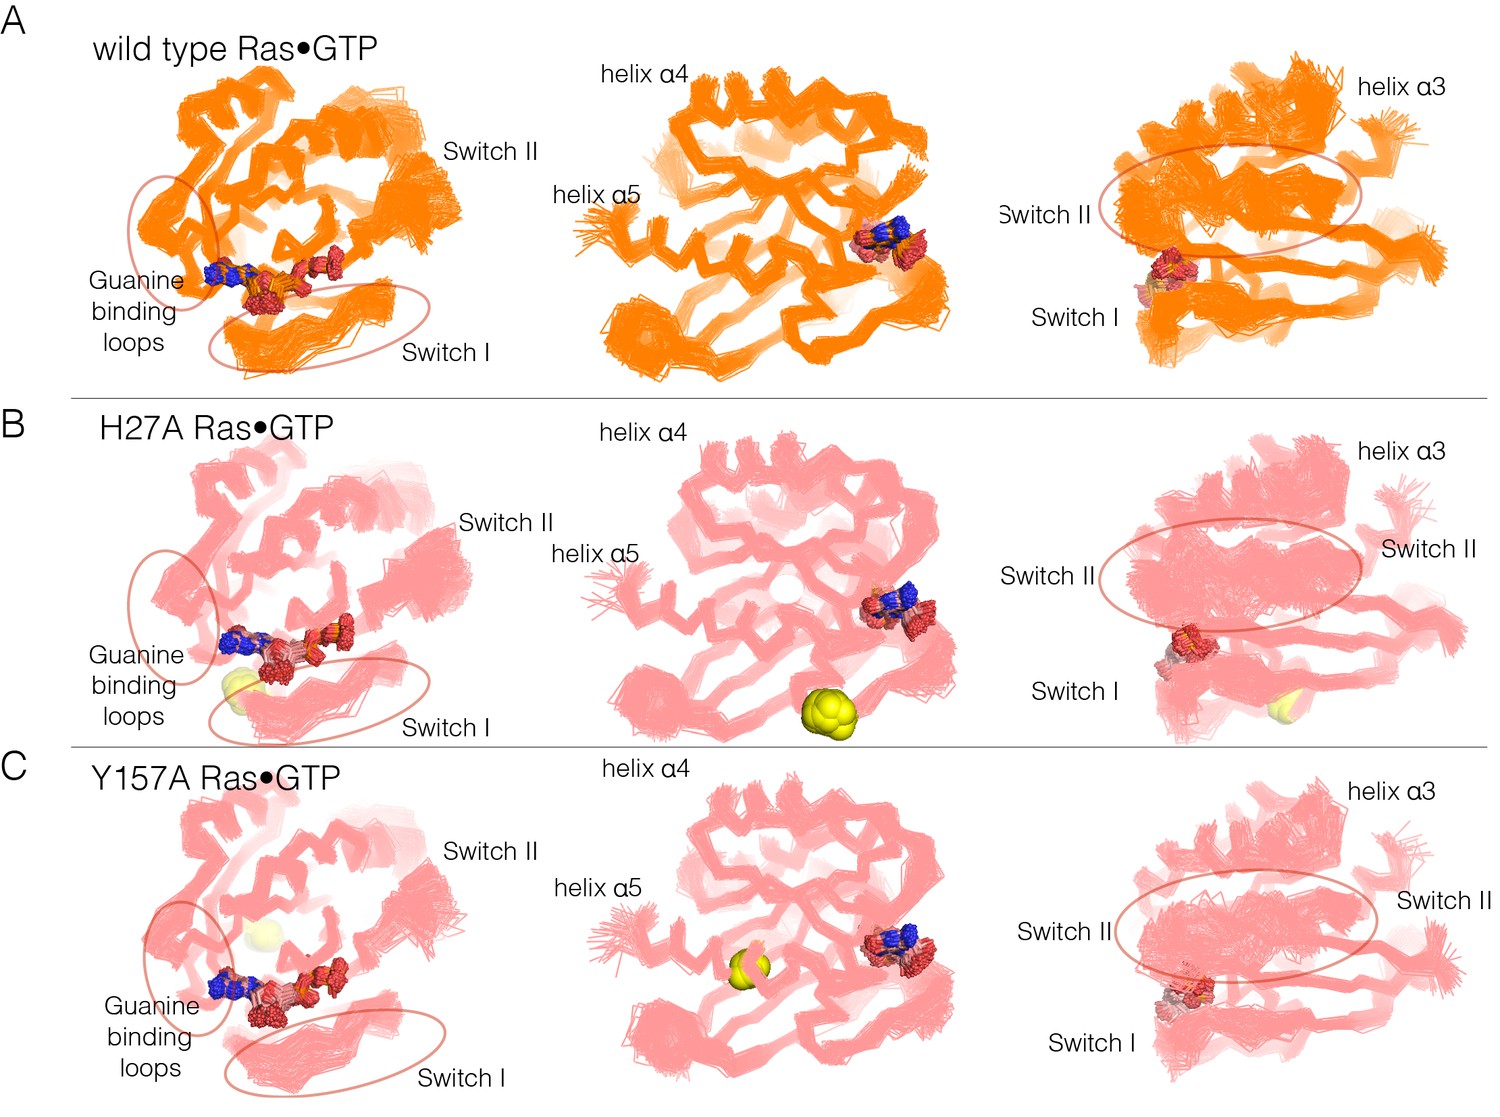
(A) Wild-type Ras. The diagrams show the superposition of 300 structures sampled evenly from two 300 ns trajectories. The diagram on the left shows a canonical view of Ras•GTP. The two other diagrams show two orthogonal views. (B) As in (A), for Ras H27A, shown as yellow spheres. (C) As in (A), for Ras Y157A, shown as yellow spheres.
Figure 6—figure supplement 2
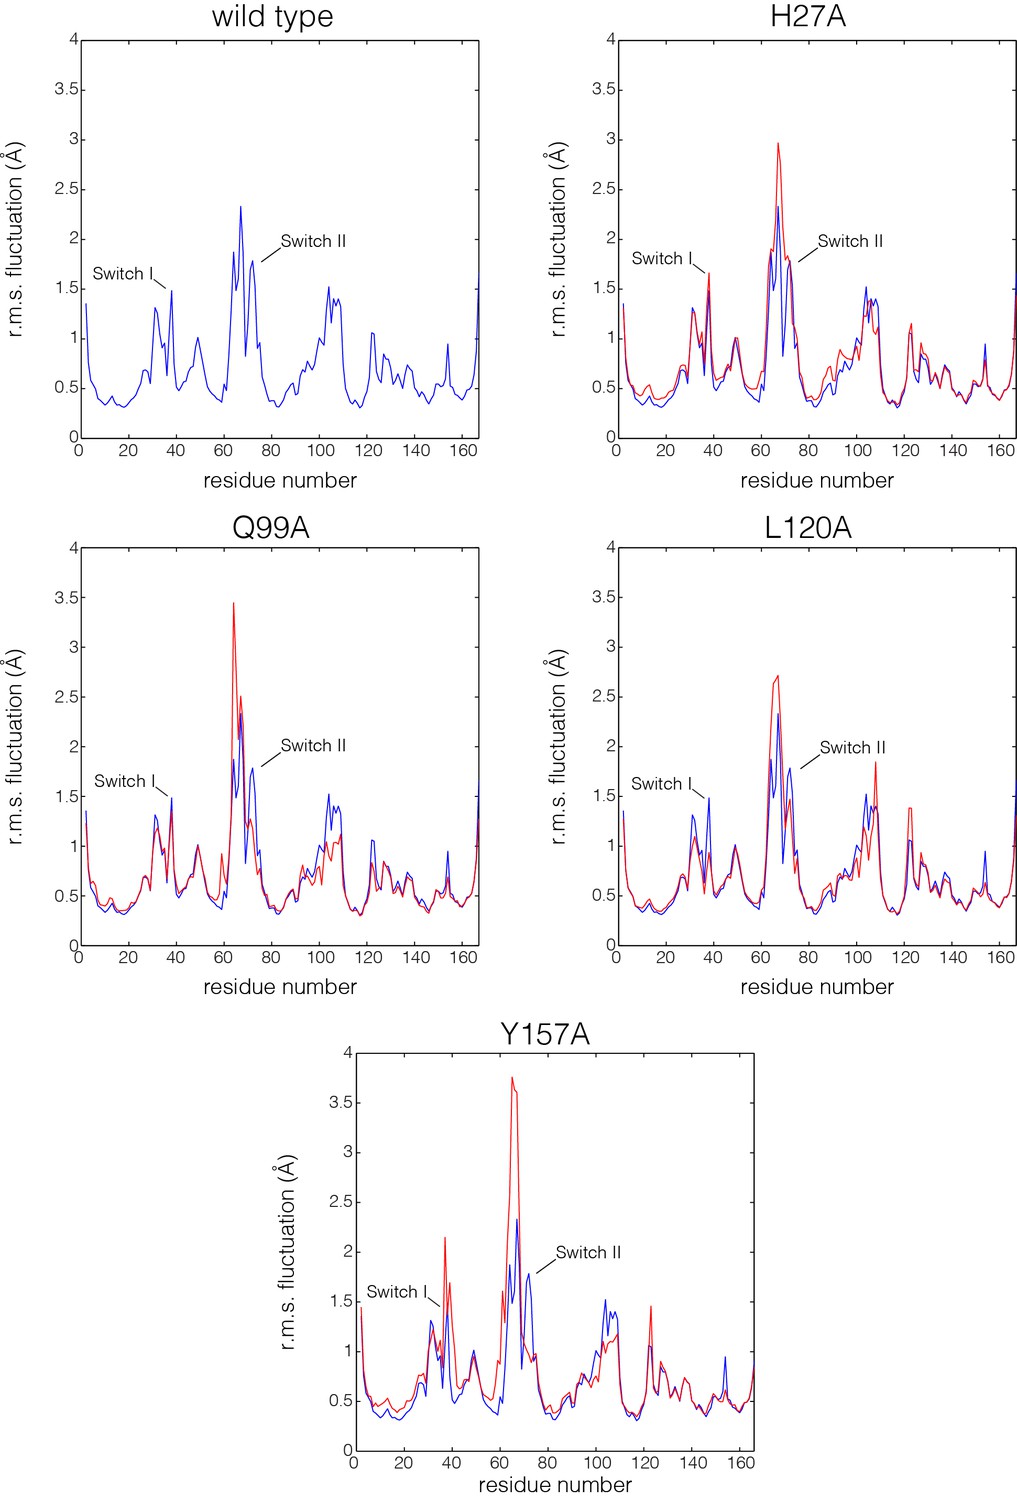
Flexibility in Ras measured by root mean squared fluctuations of Cα atoms.
Fluctuations in Ras are measured by the root mean square (r.m.s.) fluctuations of Cα atoms in Ras over the course of the 600 ns molecular dynamics trajectories. The r.m.s. fluctuations for wild-type Ras are depicted in blue, and each Ras mutant is depicted in red. Switch II shows greater mobility in every mutant simulation in comparison to wild-type Ras.
Figure 7 with 1 supplement
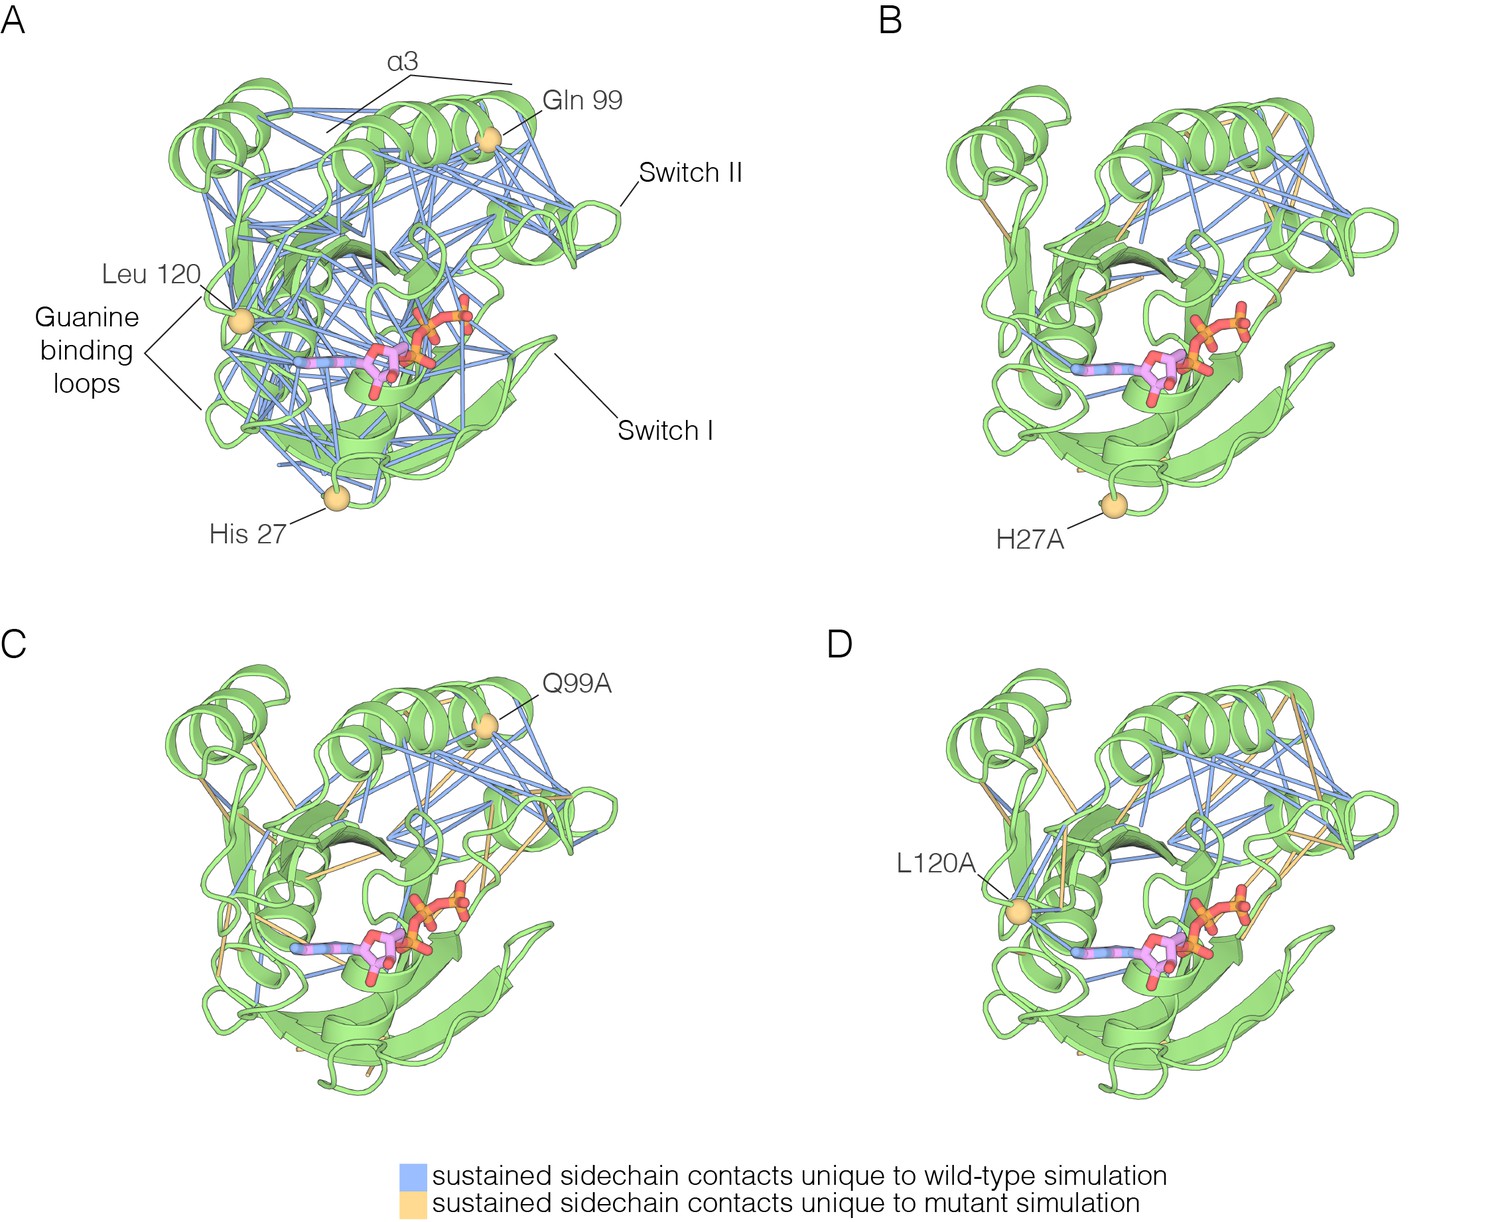
The impact of hotspot mutations on structural flexibility in Ras.
(A) Sustained sidechain-sidechain contacts in the simulation of wild-type Ras•GTP. We used the network analysis tool of Vishveshwara and co-workers (Bhattacharyya et al., 2013) to analyze the molecular dynamics trajectories for Ras. Strong interactions between sidechains, as defined by Bhattacharyya et al. (2013), that are present in more than a threshold fraction of 50% of the instantaneous structures in the trajectory are identified by blue lines. These lines are drawn between the Cα atoms of the corresponding residues. (B) For simulations of Ras•GTP H27A, strong interactions are shown by blue and yellow lines. The blue lines indicate contacts that are also present in the wild-type simulation. The yellow lines indicate contacts that are unique to the mutant simulation. (C). As in (B), for Ras•GTP Q99A. (D) As in (B), for Ras•GTP L120A.
Figure 7—figure supplement 1
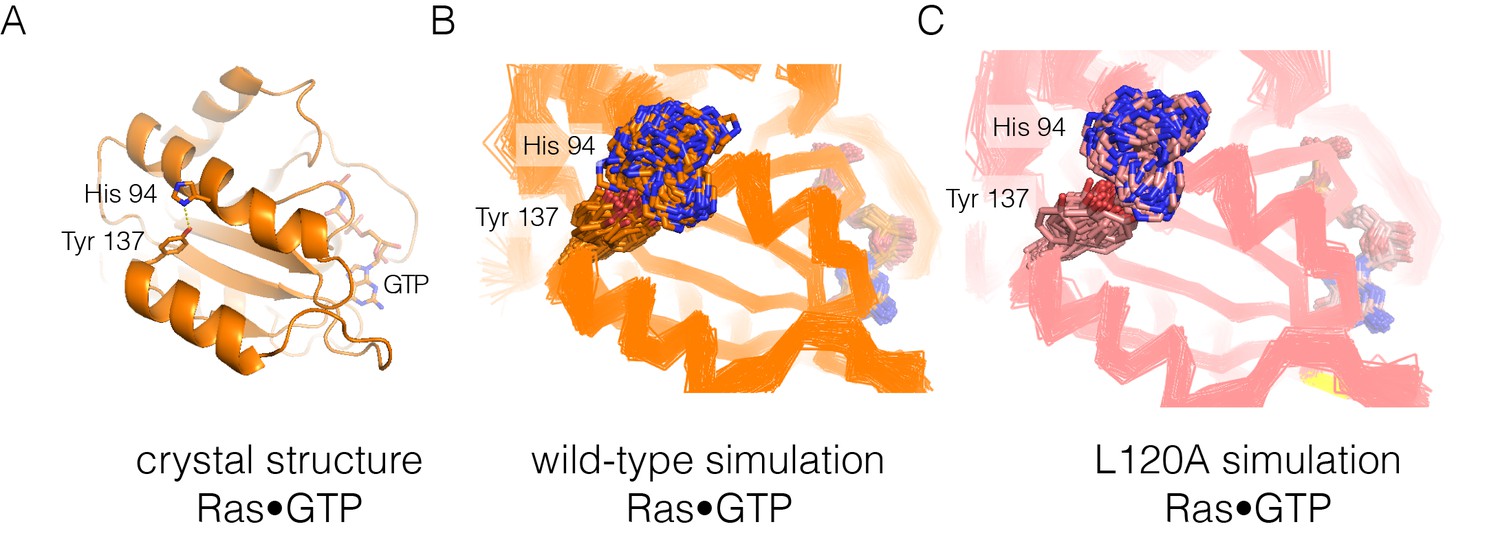
Residue contacts in Ras.
(A) The crystal structure of wild-type Ras•GTP with the sidechains of His 94 and Tyr 137 shown as sticks. (B–C) Shown here are 30 structures sampled from two 600 ns simulations, one for wild-type Ras (B) and one for the L120A mutant (C). The sidechains of His 94 and Tyr 137 are shown as sticks, with the Cα trace of the protein shown as a thin line.
Figure 8 with 1 supplement
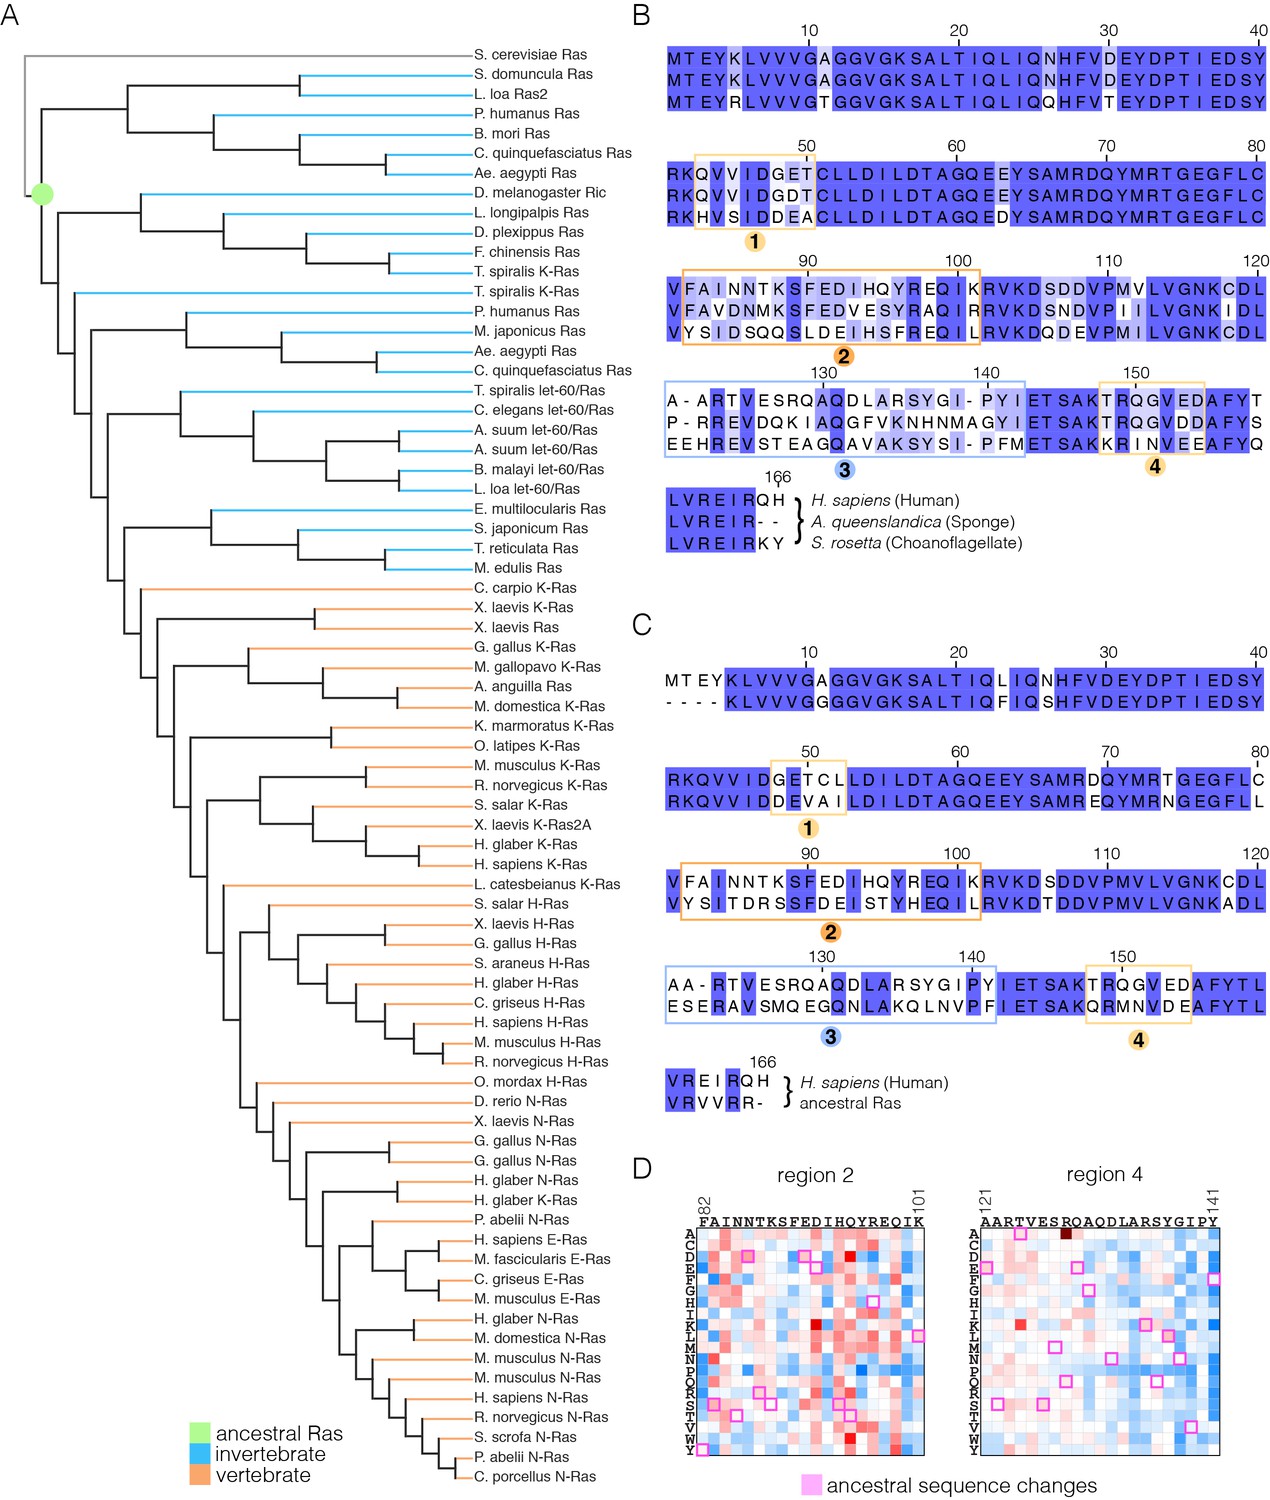
Sequence variation in Ras.
(A) An evolutionary tree from an alignment of 72 extant Ras sequences from invertebrates (blue) and vertebrates (orange). The hypothetical ancestral sequence at the base of the tree is highlighted in green. (B) Sequences of Ras from choanoflagellate (S. rosetta) and sponge (A. queenslandica) are 72% and 80% identical to human H-Ras, respectively. While the sequences are largely identical, there are four principal regions of sequence divergence. These regions correspond to residues 45–50, helix α3, helix α4, and residues 148–154 in human H-Ras. (C) Comparison of the sequence of human H-Ras to the ancestral sequence from the base of the metazoan lineage reveals similar regions of sequence variation. S. rosetta Ras was not used in the alignment of Ras sequences to generate the tree shown in (A). (D) The substitutions in human H-Ras that are present in the ancestral sequence are compared to the mutational data from the unregulated-Ras experiment. There are 48 differences between the sequences of the hypothetical ancestral protein and human H-Ras. Of these, 30 represent residues that would activate unregulated human H-Ras if the wild-type residue were replaced by the residue in the ancestral sequence. Eight differences correspond to neutral substitutions, and nine substitutions would decrease function if introduced into human H-Ras.
Figure 8—figure supplement 1
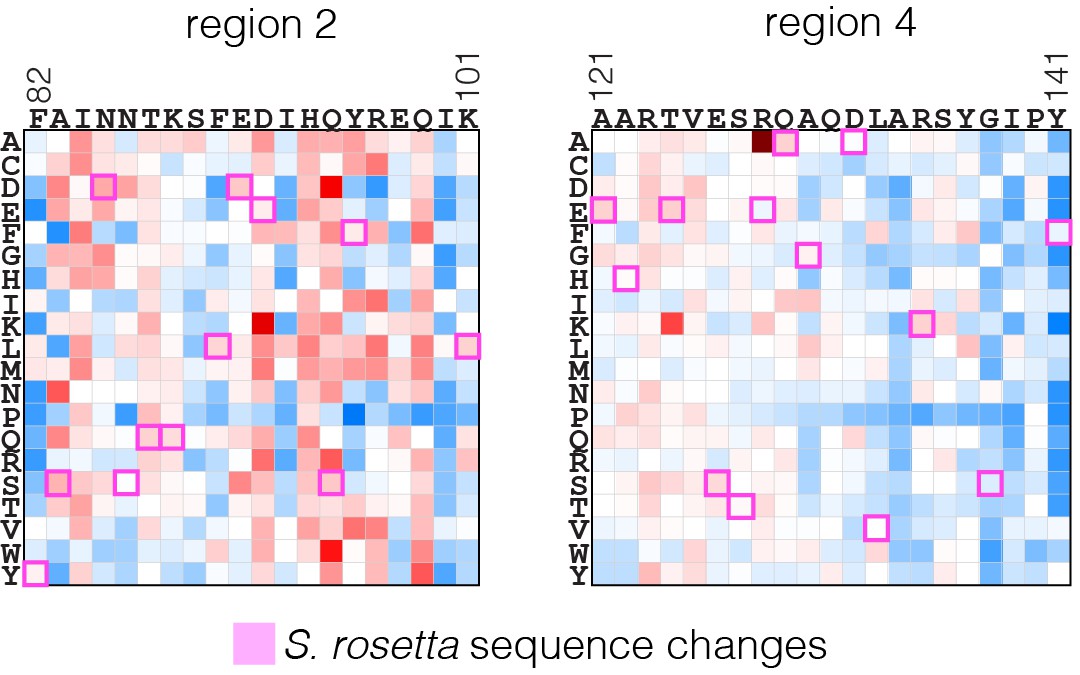
Effect of substitutions in human H-Ras that are present in S. rosetta Ras.
The substitutions in human H-Ras that are present in the S. rosetta Ras sequence are compared to the mutational data from the unregulated-Ras experiment.
Figure 9 with 1 supplement
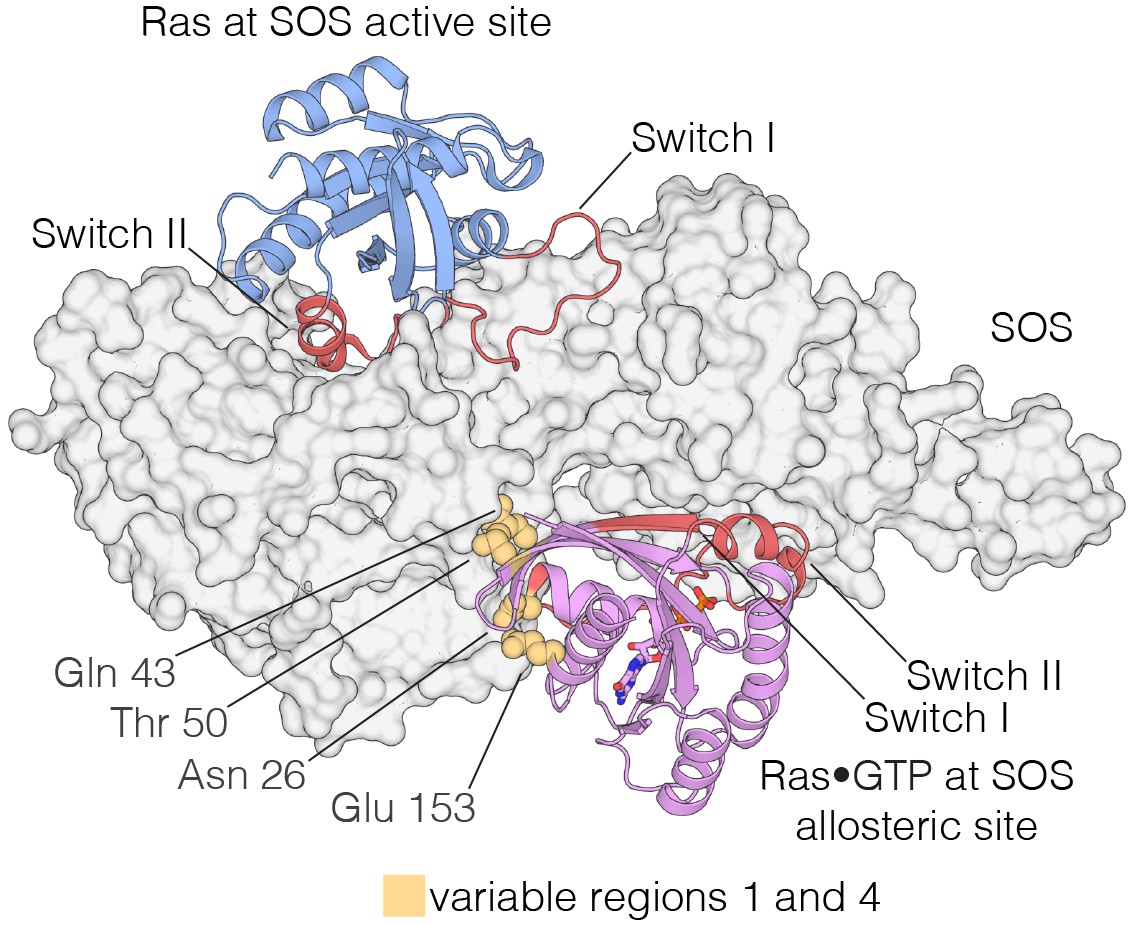
Interaction of Ras with the two Ras-binding sites of SOS.
Structure of the Ras:SOS complex (PDB code: 1NVV). Two molecules of H-Ras are bound to the allosteric and active site of SOS. The allosteric site of SOS is bound by Ras•GTP, whereas the active site of SOS is bound by nucleotide-free Ras. Switch I and Switch II of Ras (red) are responsible for engaging both sites in SOS. Additionally, residues in variable regions 1 and 4 are involved in the binding of Ras to the allosteric site of SOS, including Asn 26, Gln 43, Thr 50, and Glu 153 (yellow).
Figure 9—figure supplement 1
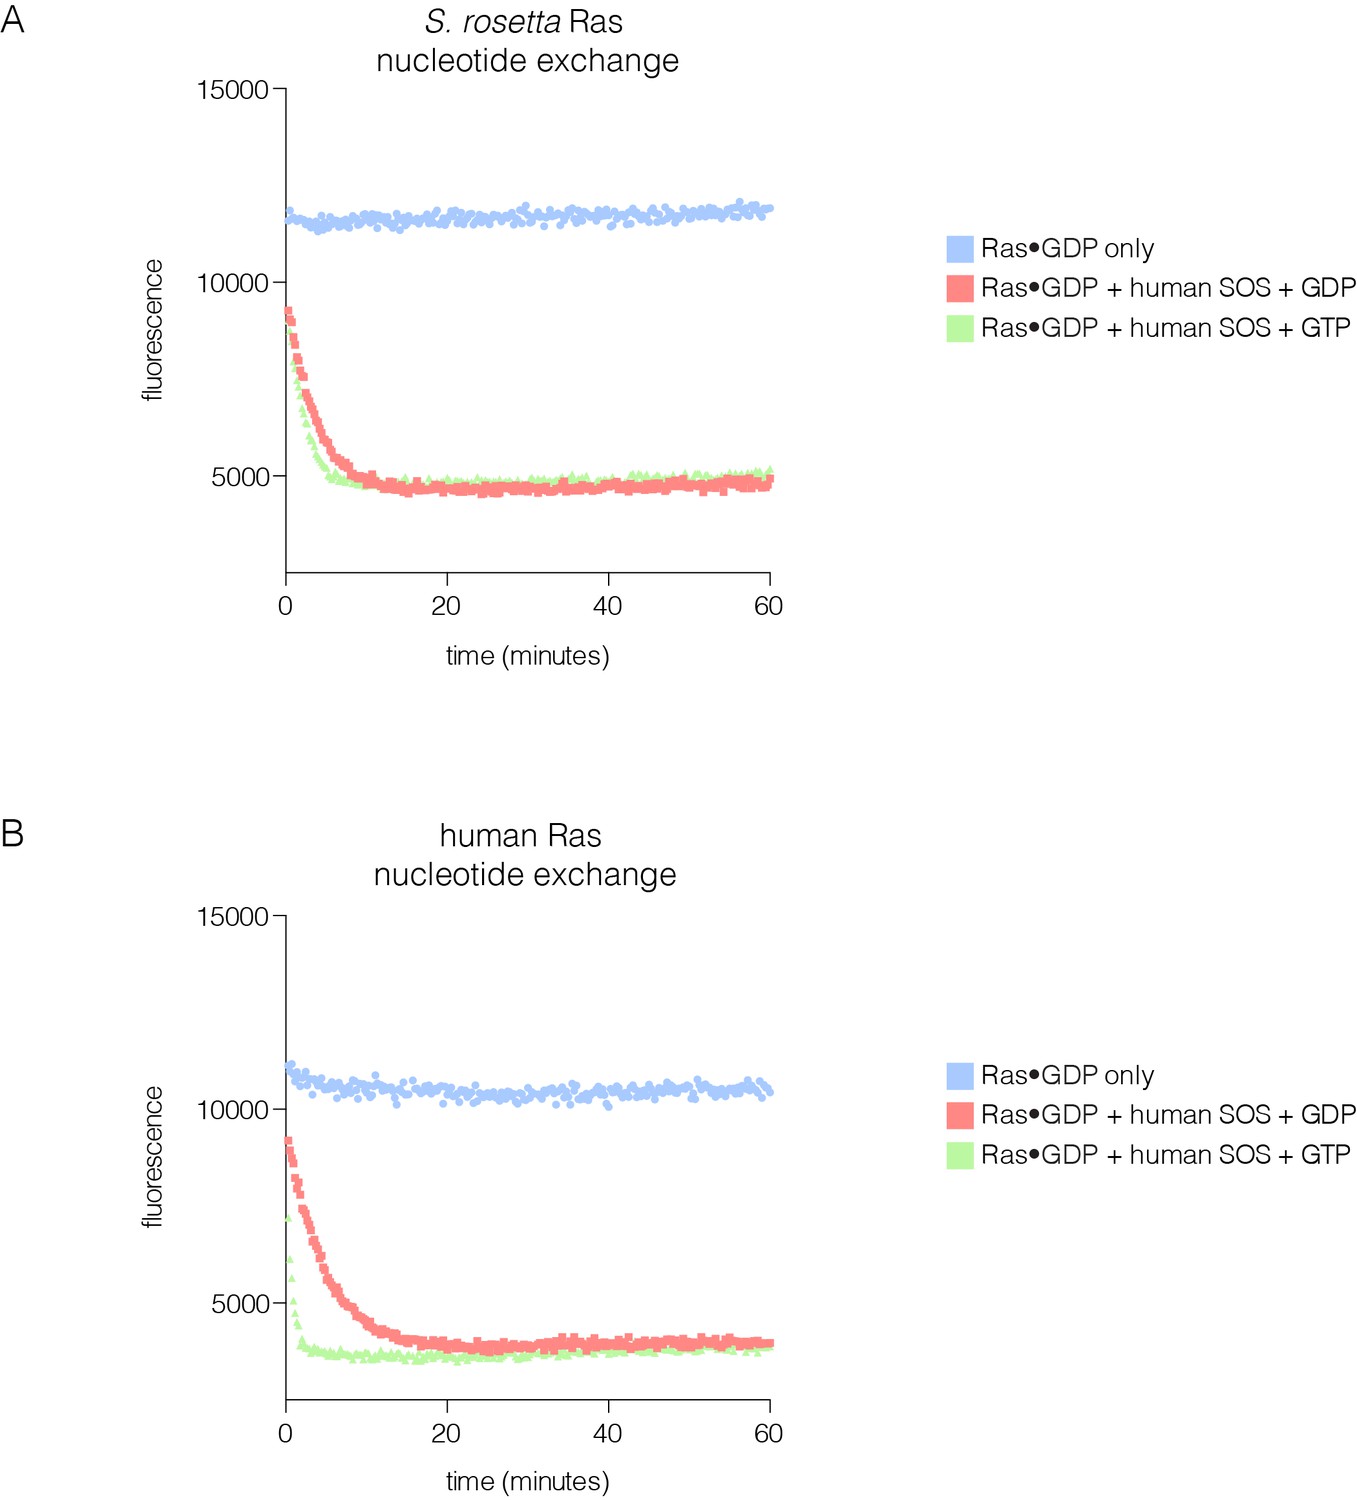
SOS-stimulated nucleotide exchange of S. rosetta and human Ras.
(A) Human SOS stimulates nucleotide exchange for S. rosetta Ras•GDP in the presence of excess GDP in solution, however, no increase in exchange rate is observed for S. rosetta Ras•GDP in the presence of excess GTP in solution (red and green curves, respectively). Intrinsic nucleotide release rate for S. rosetta Ras•GDP is shown in blue. (B) Human SOS stimulates nucleotide exchange for human Ras•GDP in the presence of excess GDP in solution and an increase in exchange rate is observed for human Ras•GDP in the presence of excess GTP in solution (red and green curves, respectively). This increase in exchange rate is indicative of human SOS activation by binding of Ras•GTP to the allosteric site. Intrinsic nucleotide release rate for human Ras•GDP is shown in blue.
Figure 10 with 1 supplement

Comparison of the R and T states in Ras.
(A) Variable Regions 2 and 3 highlighted on the structure of Ras•GTP. Variable Region 2 comprises helix α3 and the preceding loop, and Variable Region 3 comprises helix α4 and the preceding loop that is partially involved in guanine binding. (B) Room-temperature crystal structure of wild-type Ras adopts the R state as defined by Mattos and colleagues (Buhrman et al., 2010; Holzapfel et al., 2012), where the sidechain of Tyr 71 is buried in the hydrophobic core of the protein. Crystal structure of the L120A mutant shows a rotation of Tyr 71, whereby the sidechain is exposed. Additionally, the interface between helix α3 and Switch II undergoes a conformational change. (C) Schematic of the conformational transition between the R state and T state as defined by Mattos and colleagues (Buhrman et al., 2010; Holzapfel et al., 2012). Helix α3 and the C-terminal helix of Switch II shift downwards in the transition from the R state to the T state, leading to a rotation of Tyr 71 from a buried to an exposed conformation. The blue circles indicate binding sites for calcium acetate (Buhrman et al., 2010) and small molecule inhibitors. (D) Comparison of the choanoflagellate S. rosetta crystal structure to the L120A structure. S. rosetta Ras adopts the T state, similar to L120A, where Tyr 71 is rotated outwards and exposed.
Figure 10—figure supplement 1

R and T states of Ras bound to SOS.
(A) Ras in the T state bound to the active site of SOS (left). Many sidechain contacts are present between the Switch II helix (red) and SOS (grey), including the sidechain of Tyr 71. Ras in the R state is incompatible with binding to the active site of SOS (right), and the sidechain of Tyr 71, in addition to others, does not form hydrogen bonding necessary for SOS binding. (B) Ras in the R state bound to the allosteric site of SOS (left). The Switch II helix conformation is compatible with allosteric SOS binding. Ras in the T state is incompatible with binding to the allosteric site of SOS (right), and the sidechain of Tyr 71 clashes with SOS, thus leading to an incompatible binding interface.
Additional files
-
Supplementary file 1
Raw fitness data from bacterial two-hybrid screen.
- https://doi.org/10.7554/eLife.27810.027
-
Supplementary file 2
Crystallographic data collection and refinement statistics.
- https://doi.org/10.7554/eLife.27810.028
Download links
A two-part list of links to download the article, or parts of the article, in various formats.
Downloads (link to download the article as PDF)
Open citations (links to open the citations from this article in various online reference manager services)
Cite this article (links to download the citations from this article in formats compatible with various reference manager tools)
Deconstruction of the Ras switching cycle through saturation mutagenesis
eLife 6:e27810.
https://doi.org/10.7554/eLife.27810


