Increasing suppression of saccade-related transients along the human visual hierarchy
- The Hebrew University of Jerusalem, Israel
- New York University, United States
- Weizmann Institute of Science, Israel
- Hofstra Northwell School of Medicine, United States
- The Feinstein Institute for Medical Research, United States
- The Krembil Neuroscience Centre, Canada
- Max Planck Institute for Brain Research, Germany
- Columbia University College of Physicians and Surgeons, United States
- Nathan Kline Institute, United States
Figures
Figure 1 with 1 supplement
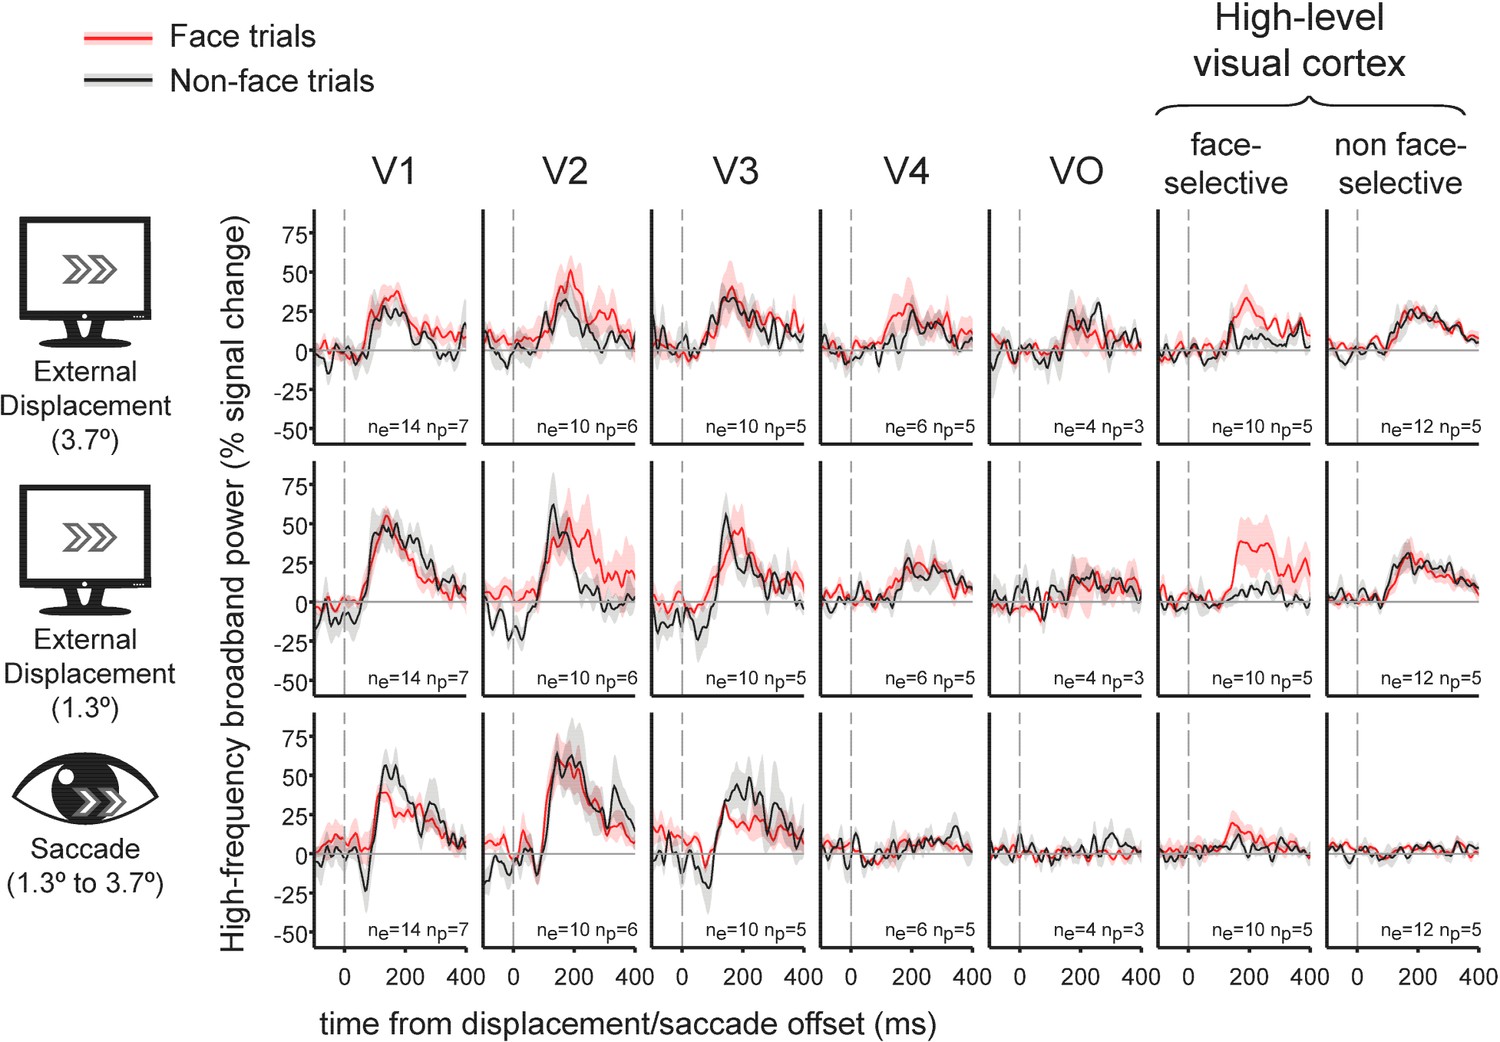
Grand-average traces of the contribution of external stimulus displacements (larger and smaller) and saccades to high-frequency broadband activity in seven regions of interest.
Shading around the grand average waveforms denotes ±1 standard error (between-subjects error variability). ne denotes the number of electrodes per trace and np denotes the number of subjects per trace. Note the similar HFB activity increase following both saccades and external displacements in V1 to V3. In contrast, V4, VO, face-selective electrodes and non-face selective high-level electrodes all showed highly divergent responses to displacements and saccades. See Figure 1—figure supplement 1 for latencies and magnitudes of the underlying displacement and saccade events.
Figure 1—figure supplement 1
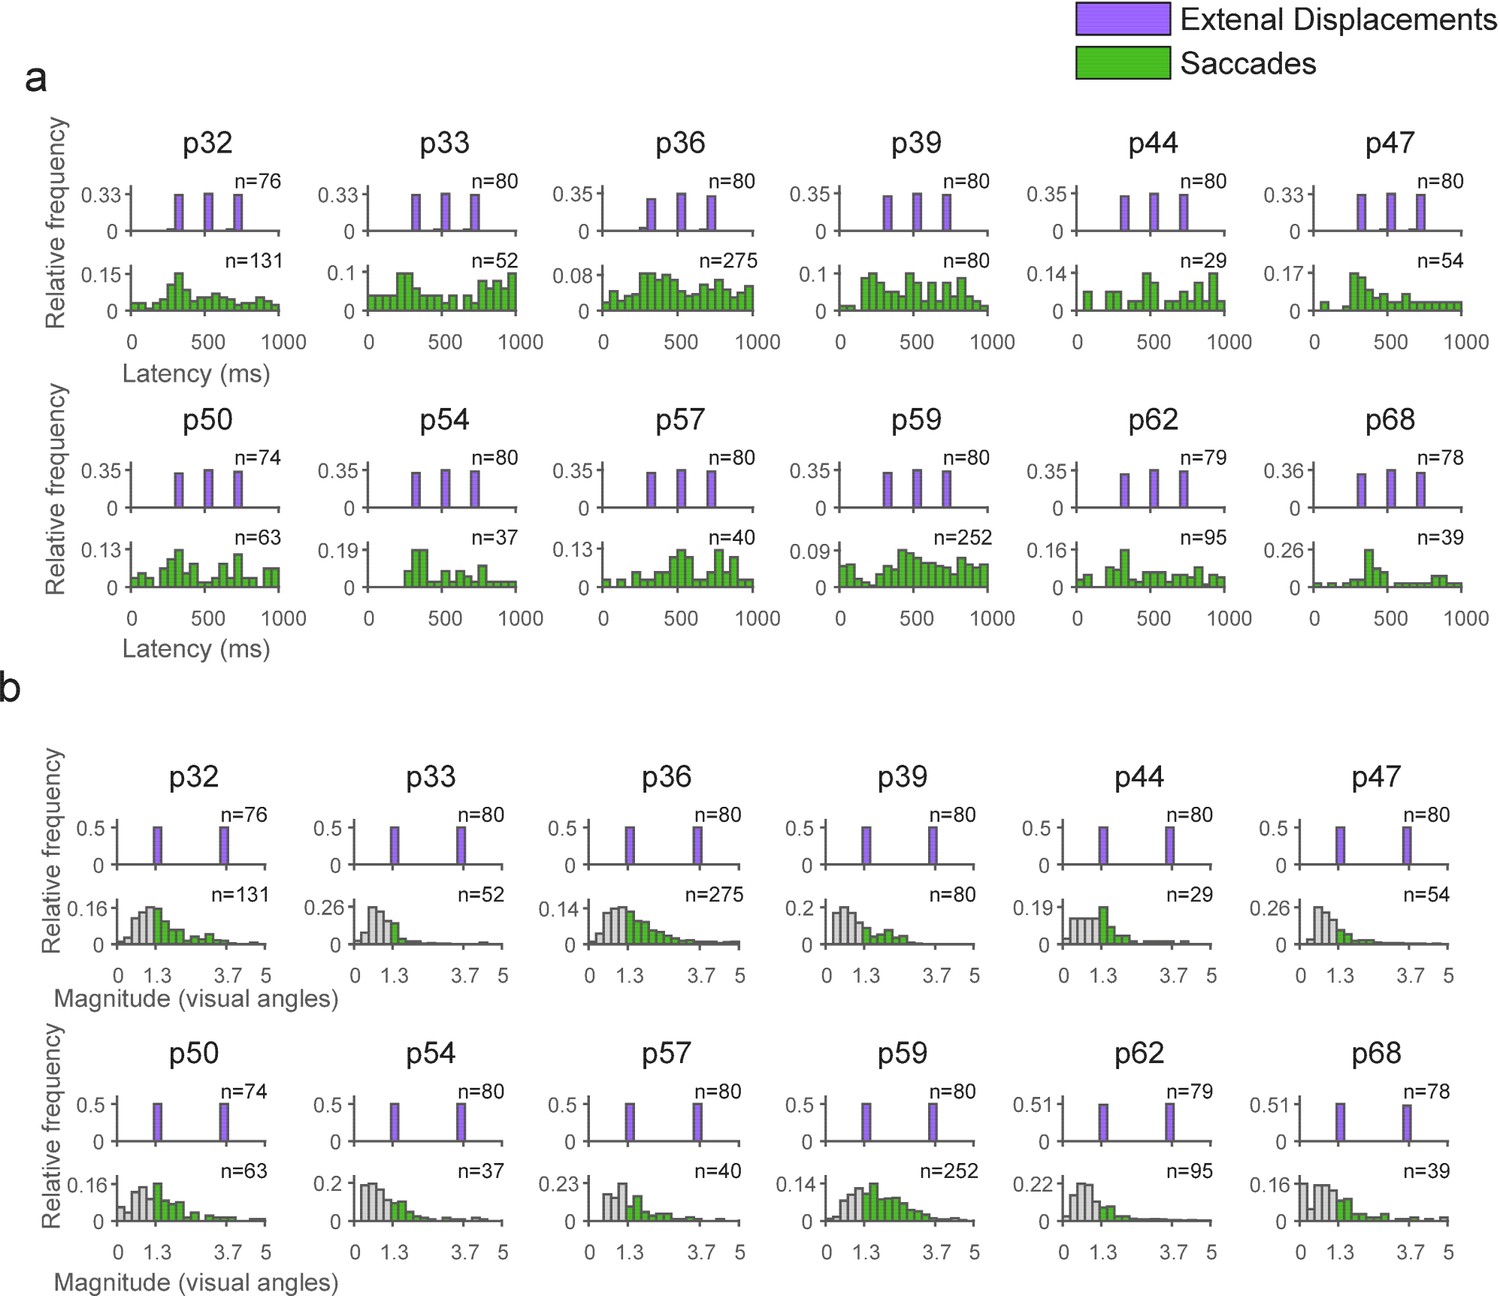
Latencies and magnitudes of external stimulus displacements and saccades.
Each pair of histograms presents data from an individual patient. (a) The latencies of external Displacements (purple) and saccades (green), relative to trial onset. For saccades, the moment of saccade offset (i.e. fixation onset) is depicted. (b) External displacements and saccades magnitudes (in visual angles). The grayed bars represent recorded saccades falling outside the magnitude range we selected for comparison with external displacements (1.3° to 3.7°), and hence, excluded from the analyses.
Figure 2 with 3 supplements
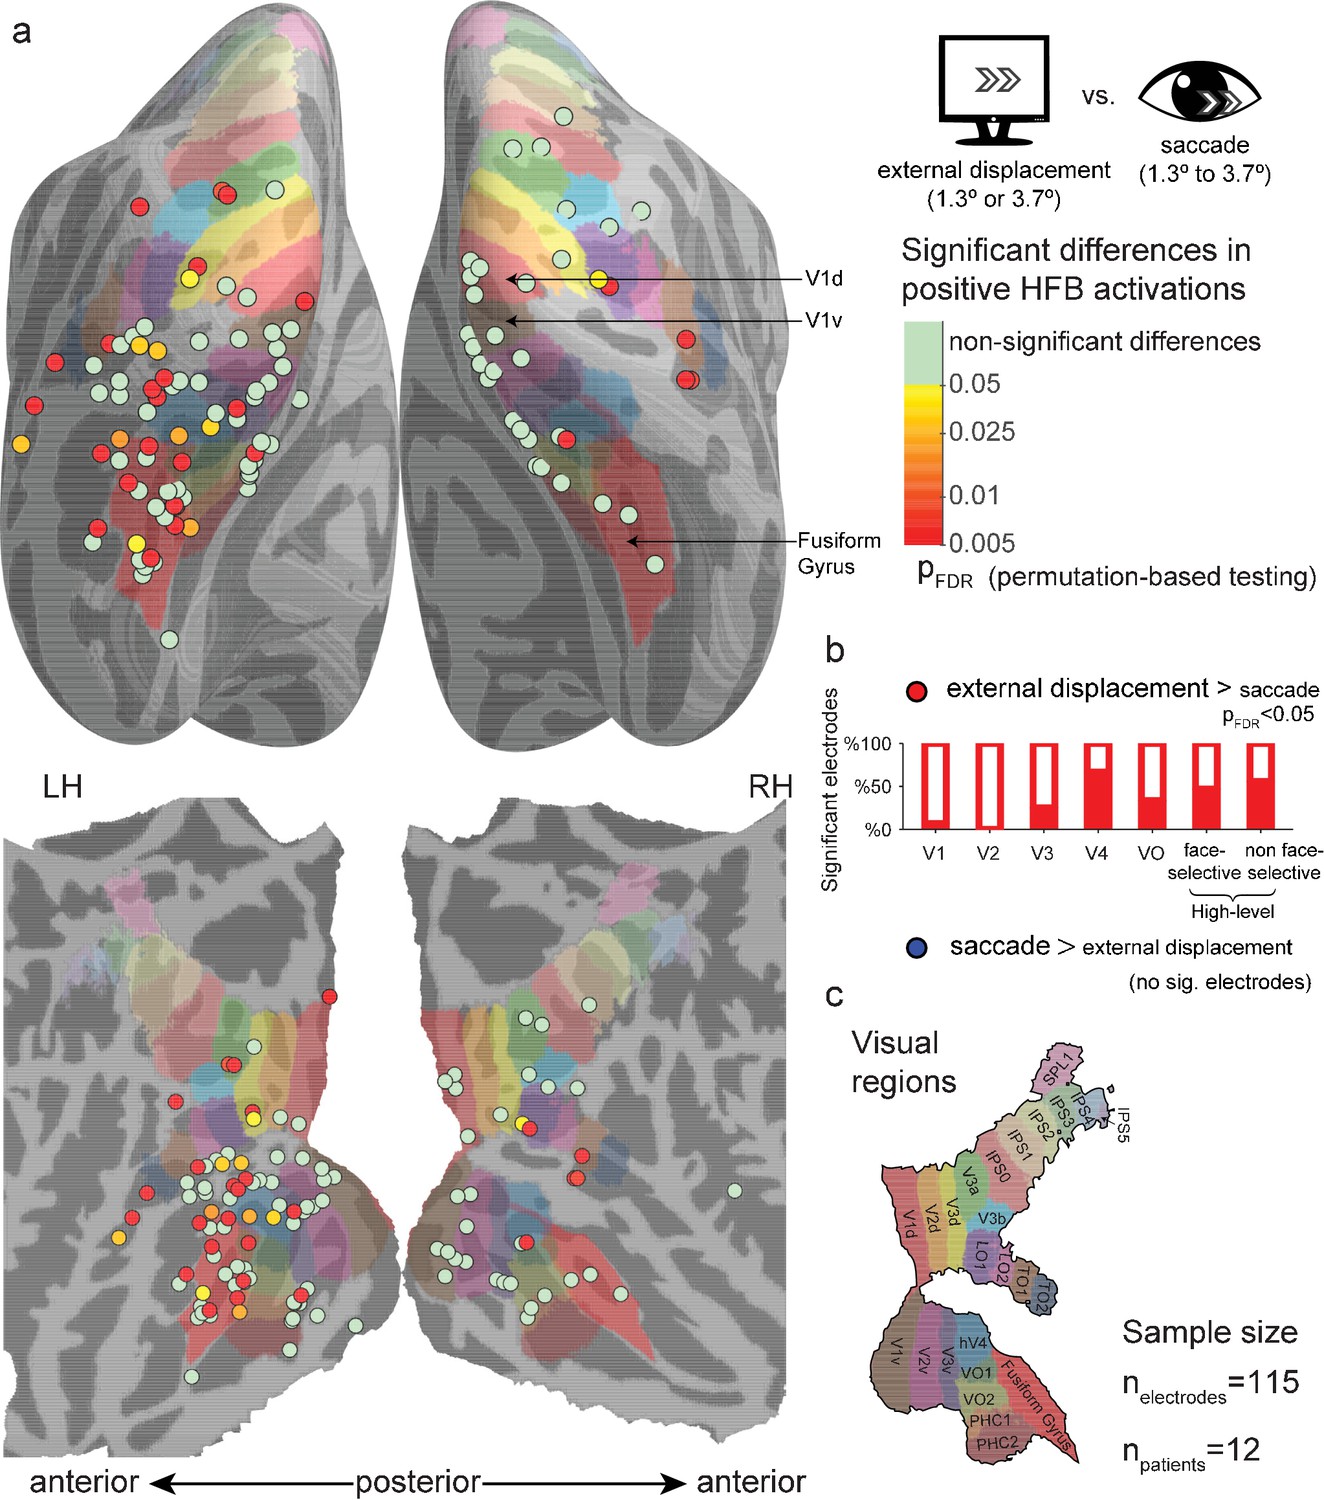
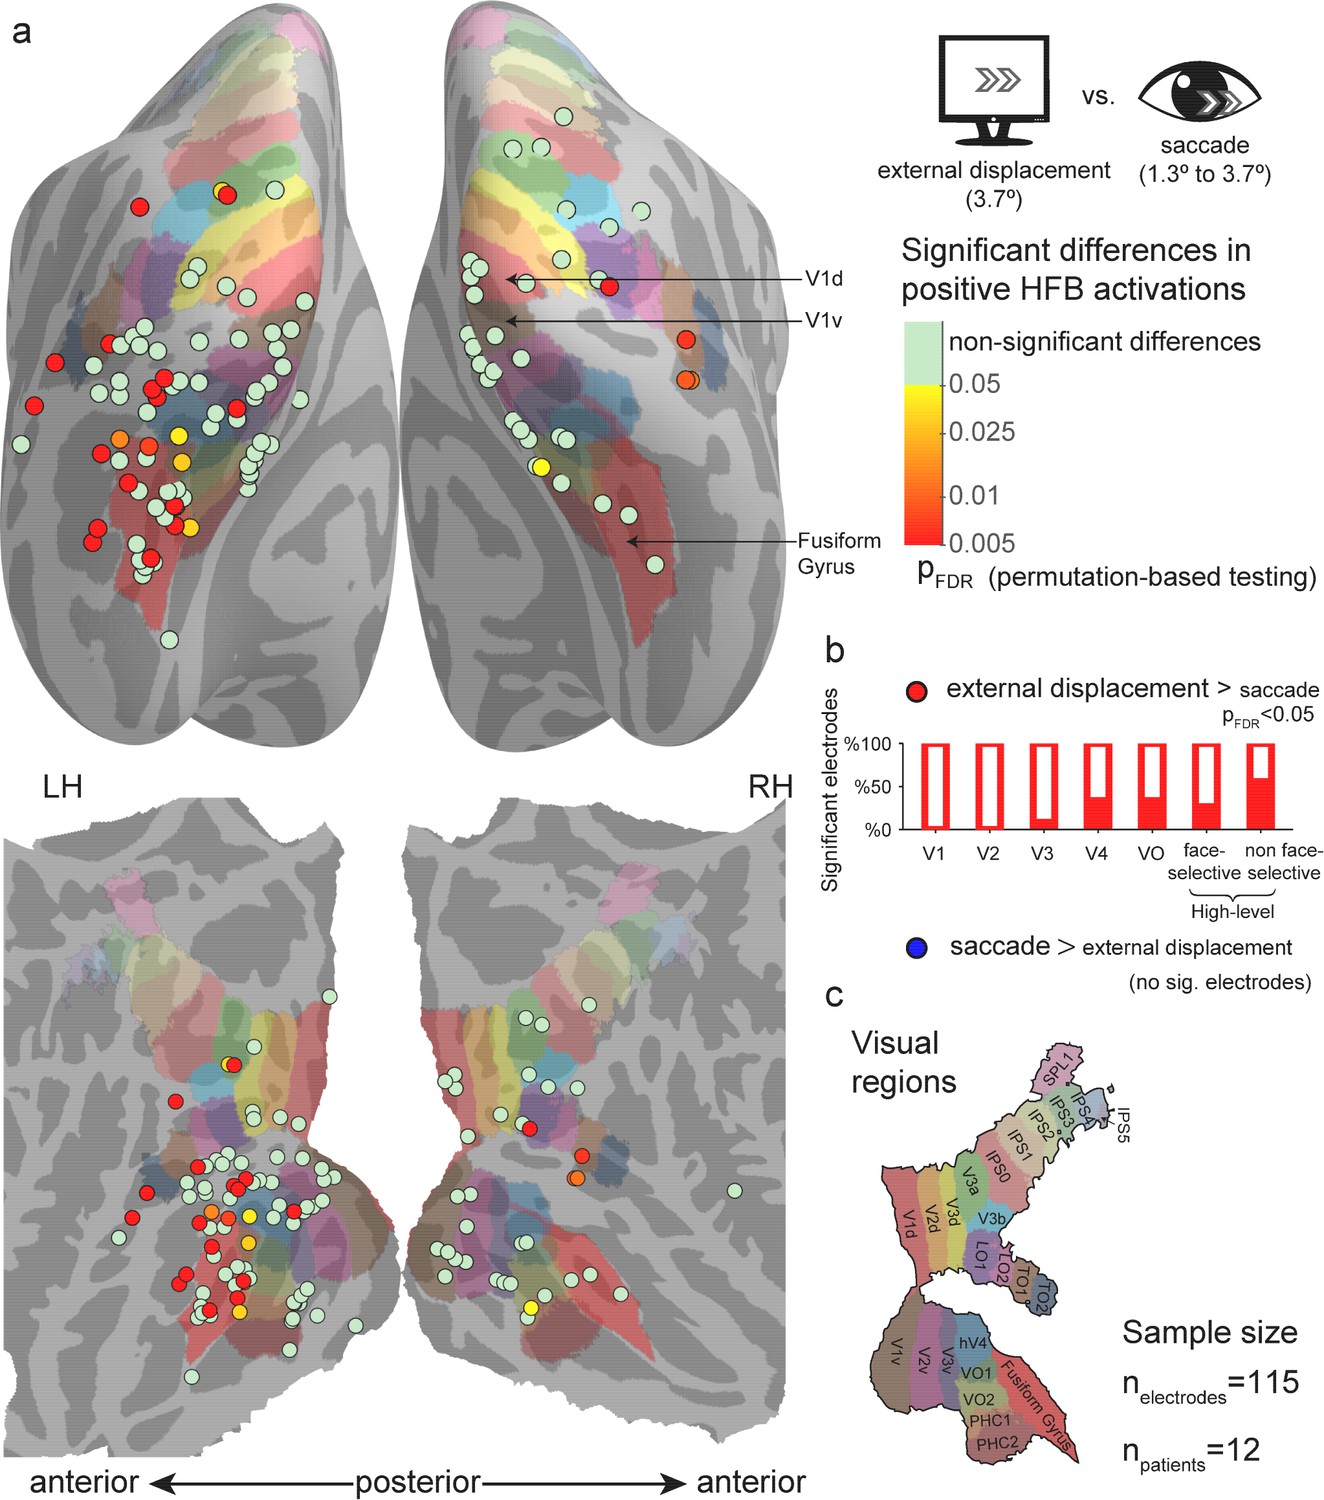
Significant differences between positive high-frequency broadband (HFB) activity increase following external stimulus displacements (either 1.3° or 3.7°) and positive HFB activity increase following saccades (1.3° to 3.7°).
See Figure 2—figure supplement 1 for the same analysis using only saccades whose onsets were in the range of 300–700 ms post trial-onset. See Figure 2—figure supplements 2 and 3 for a comparison of the saccades with only smaller (1.3°) or larger (3.7°) external displacements. (a) Electrode-level statistical map across subjects. Each circle marks the location of one electrode on a common cortical template, either inflated (top) or flatten (bottom). The color code represents FDR-corrected p values for electrodes showing significantly greater positive responses to external displacements compared with saccades. None of the visually responsive sites showed significantly greater HFB response increases to saccades compared with external displacements. (b) The partially filled bars present the percentage of electrodes showing a significantly greater activity increase following external displacements compared with saccades within each region of interest. (c) The colored areas on the cortical surface were derived from a surface-based atlas of retinotopic areas (Wang et al., 2015) and Destrieux Atlas (Destrieux et al., 2010) as implemented in FreeSurfer 5.3 (Fusiform Gyrus, in red).
-
Figure 2—source data 1
Individual electrode data for Figure 2.
Each row describes an electrode, with its SUMA standardized mesh nearest vertex (index, hemisphere and MNI coordinates), region of interest (if assigned), FDR-corrected p value for external displacements greater than saccades, and FDR-corrected p value for saccades greater than external displacements.
- https://doi.org/10.7554/eLife.27819.008
Figure 2—figure supplement 1

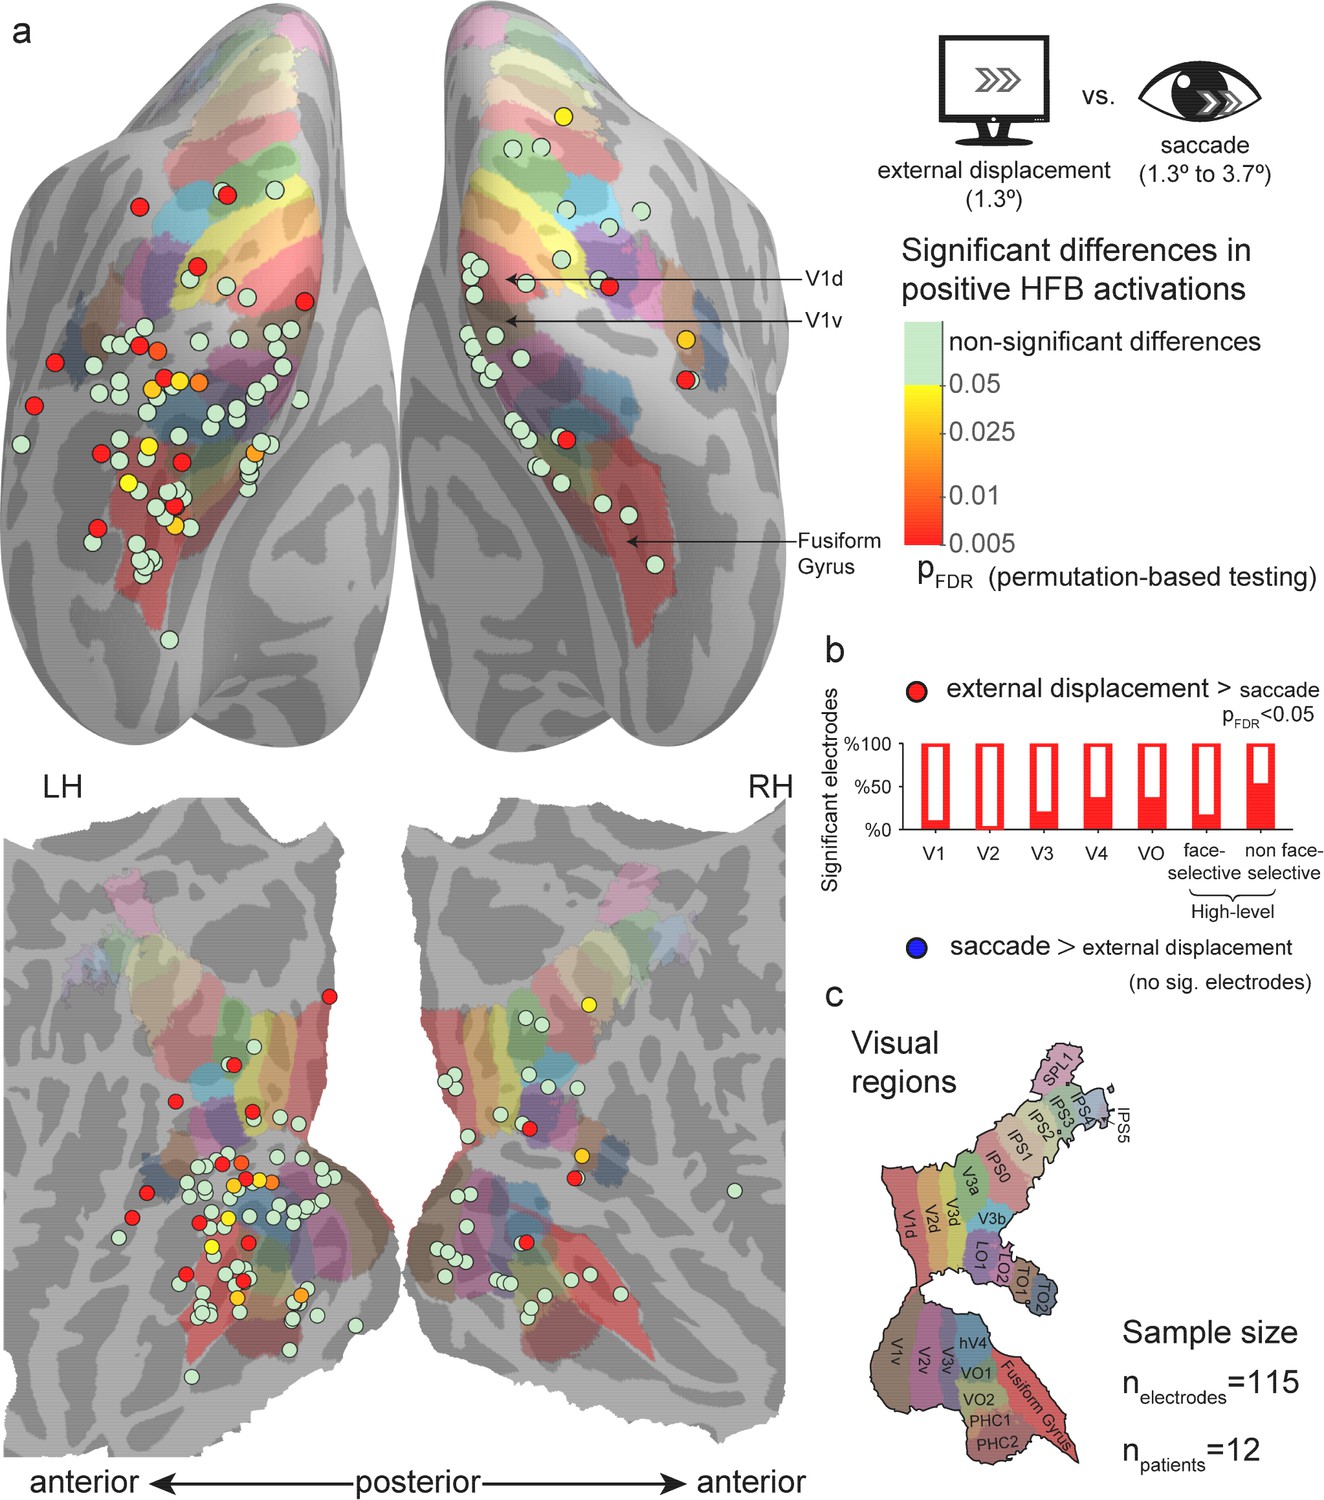
Significant differences between positive high-frequency broadband (HFB) activity increase following external stimulus displacements (either 1.3° or 3.7°) and positive HFB activity increase following saccades (1.3° to 3.7°), using only saccades whose onsets were in the range of 300–700 ms post trial-onset.
https://doi.org/10.7554/eLife.27819.005
Figure 2—figure supplement 2
Significant differences between positive high-frequency broadband (HFB) activity increase following small external stimulus displacements (1.3°) and positive HFB activity increase following saccades (1.3° to 3.7°).
https://doi.org/10.7554/eLife.27819.006
Figure 2—figure supplement 3
Significant differences between positive high-frequency broadband (HFB) activity increase following large external stimulus displacements (3.7°) and positive HFB activity increase following saccades (1.3° to 3.7°).
https://doi.org/10.7554/eLife.27819.007
Figure 3
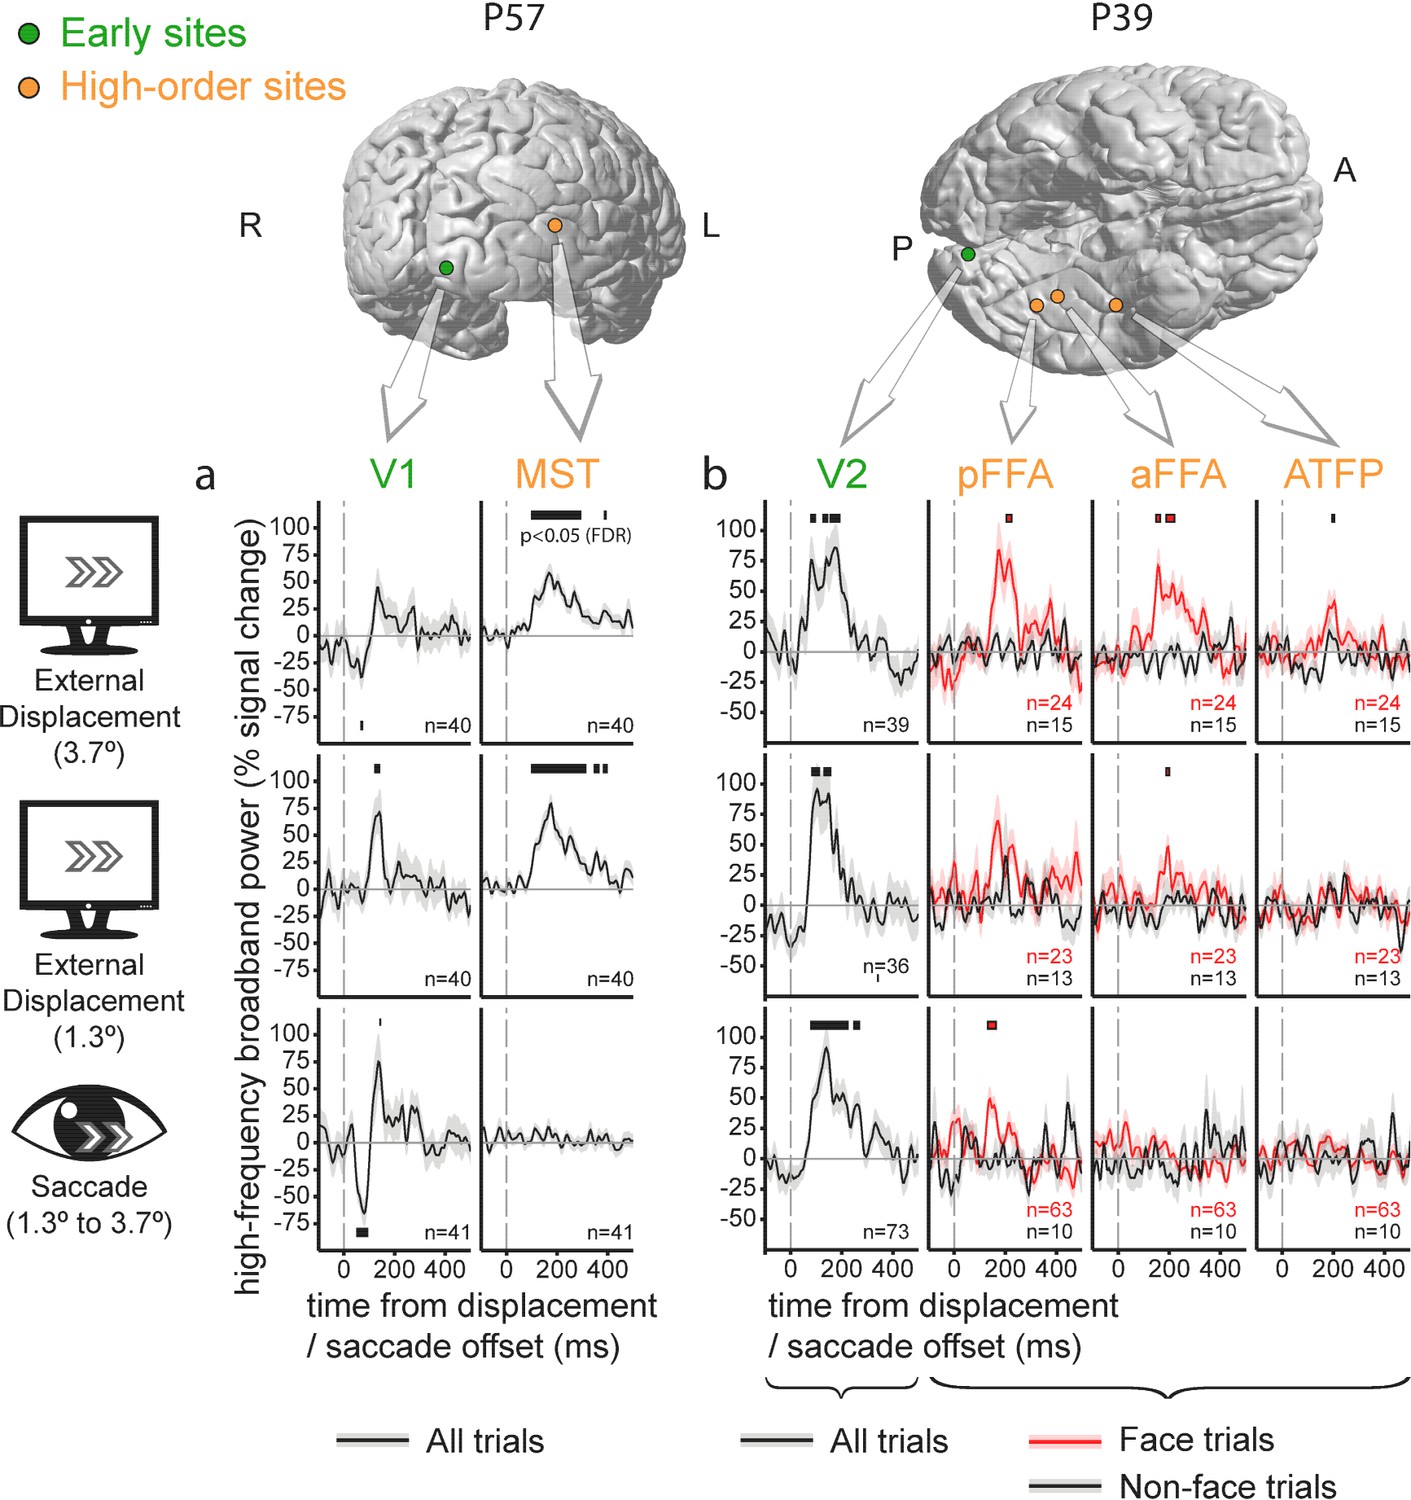
Individual electrode traces of the contribution of external stimulus displacements and saccades to the High-Frequency Broadband activity in low vs. high-level sites, sampled in two individual subjects.
Shading around the waveforms denotes ±1 standard error of the regression coefficients (between-trials error variability). Horizontal bars mark response timepoints significantly different from zero (p<0.05, FDR-corrected within-participant). The number of event occurrences is denoted by n. Electrode locations are marked on the subjects' individual FreeSurfer-reconstructed cortices. (a) V1 versus MST. Note the insensitivity of the MST site to saccades. (b) V2 versus three face-selective sites. Note that saccade-sensitivity decreases first along the hierarchy, followed by a decrease in displacement sensitivity at more anterior sites.
Figure 4
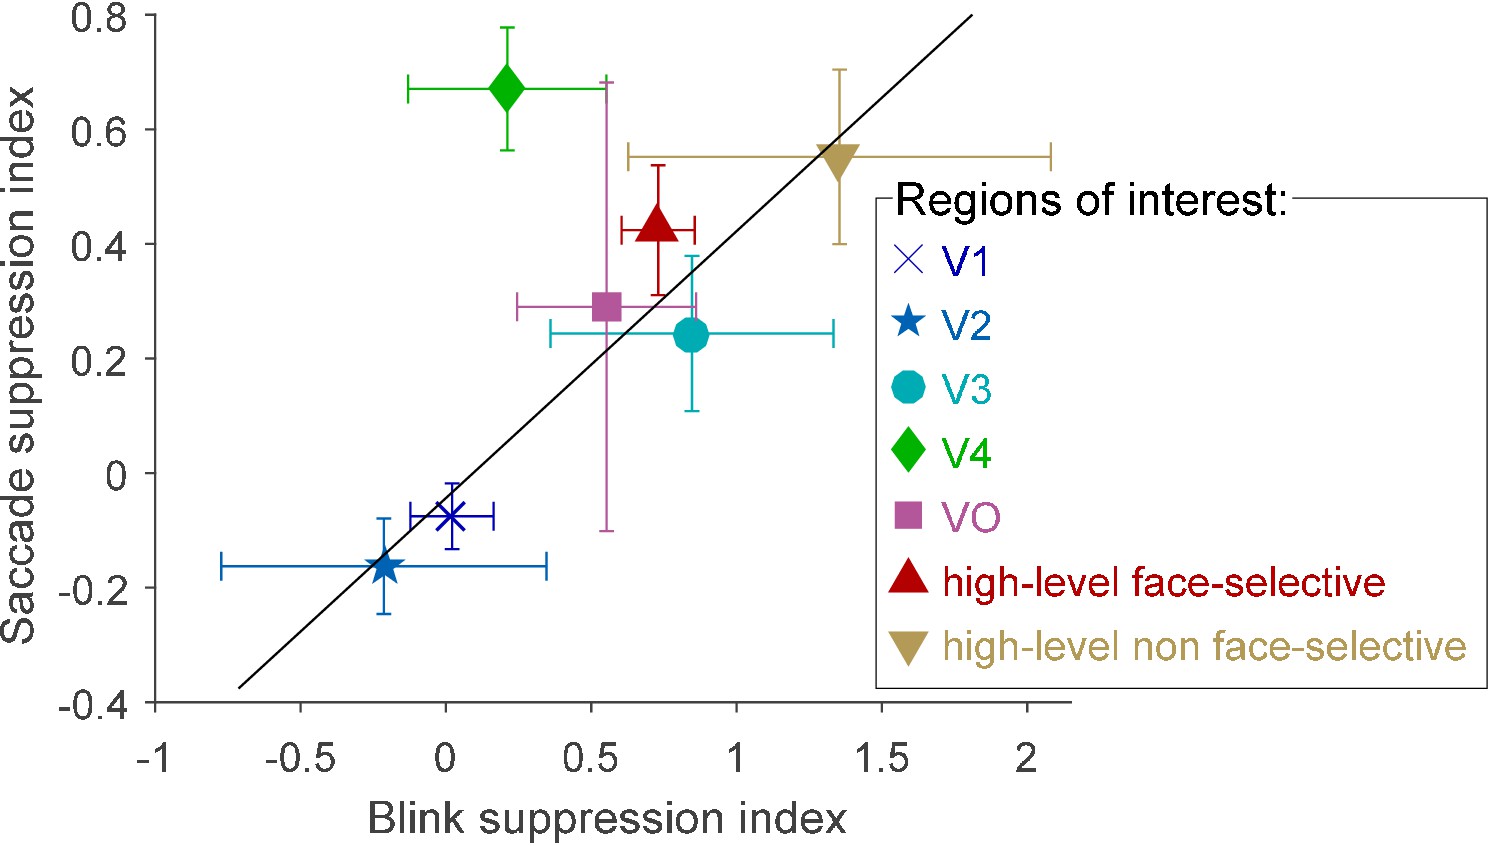
Blink suppression index versus saccade suppression index across seven visual regions of interest.
The circles depict the ROIs' means and the error bars depict the standard errors of the means. Values greater than 1 were possible since some electrodes registered negative blink- (or saccade-) related responses. The trend line (in black, r = 0.95) was fit to all regions except V4 (see text for bias-corrected testing of this fit).
-
Figure 4—source data 1
Individual electrode data for Figure 4.
Each row describes an electrode, with its SUMA standardized mesh nearest vertex (index, hemisphere and MNI coordinates), region of interest (only electrodes with assigned ROIs participated in this analysis), blink suppression index and saccade suppression index.
- https://doi.org/10.7554/eLife.27819.011
Additional files
-
Transparent reporting form
- https://doi.org/10.7554/eLife.27819.012
Download links
A two-part list of links to download the article, or parts of the article, in various formats.
Downloads (link to download the article as PDF)
Open citations (links to open the citations from this article in various online reference manager services)
Cite this article (links to download the citations from this article in formats compatible with various reference manager tools)
Increasing suppression of saccade-related transients along the human visual hierarchy
eLife 6:e27819.
https://doi.org/10.7554/eLife.27819


