Regulation of the glucocorticoid receptor via a BET-dependent enhancer drives antiandrogen resistance in prostate cancer
- Memorial Sloan Kettering Cancer Center, United States
- Albert Einstein College of Medicine, United States
- Massachusetts General Hospital and Harvard Medical School, United States
- Dana-Farber Cancer Institute and Harvard Medical School, United States
- Washington University School of Medicine, United States
- Howard Hughes Medical Institute, Memorial Sloan Kettering Cancer Center, United States
Figures
Figure 1 with 1 supplement
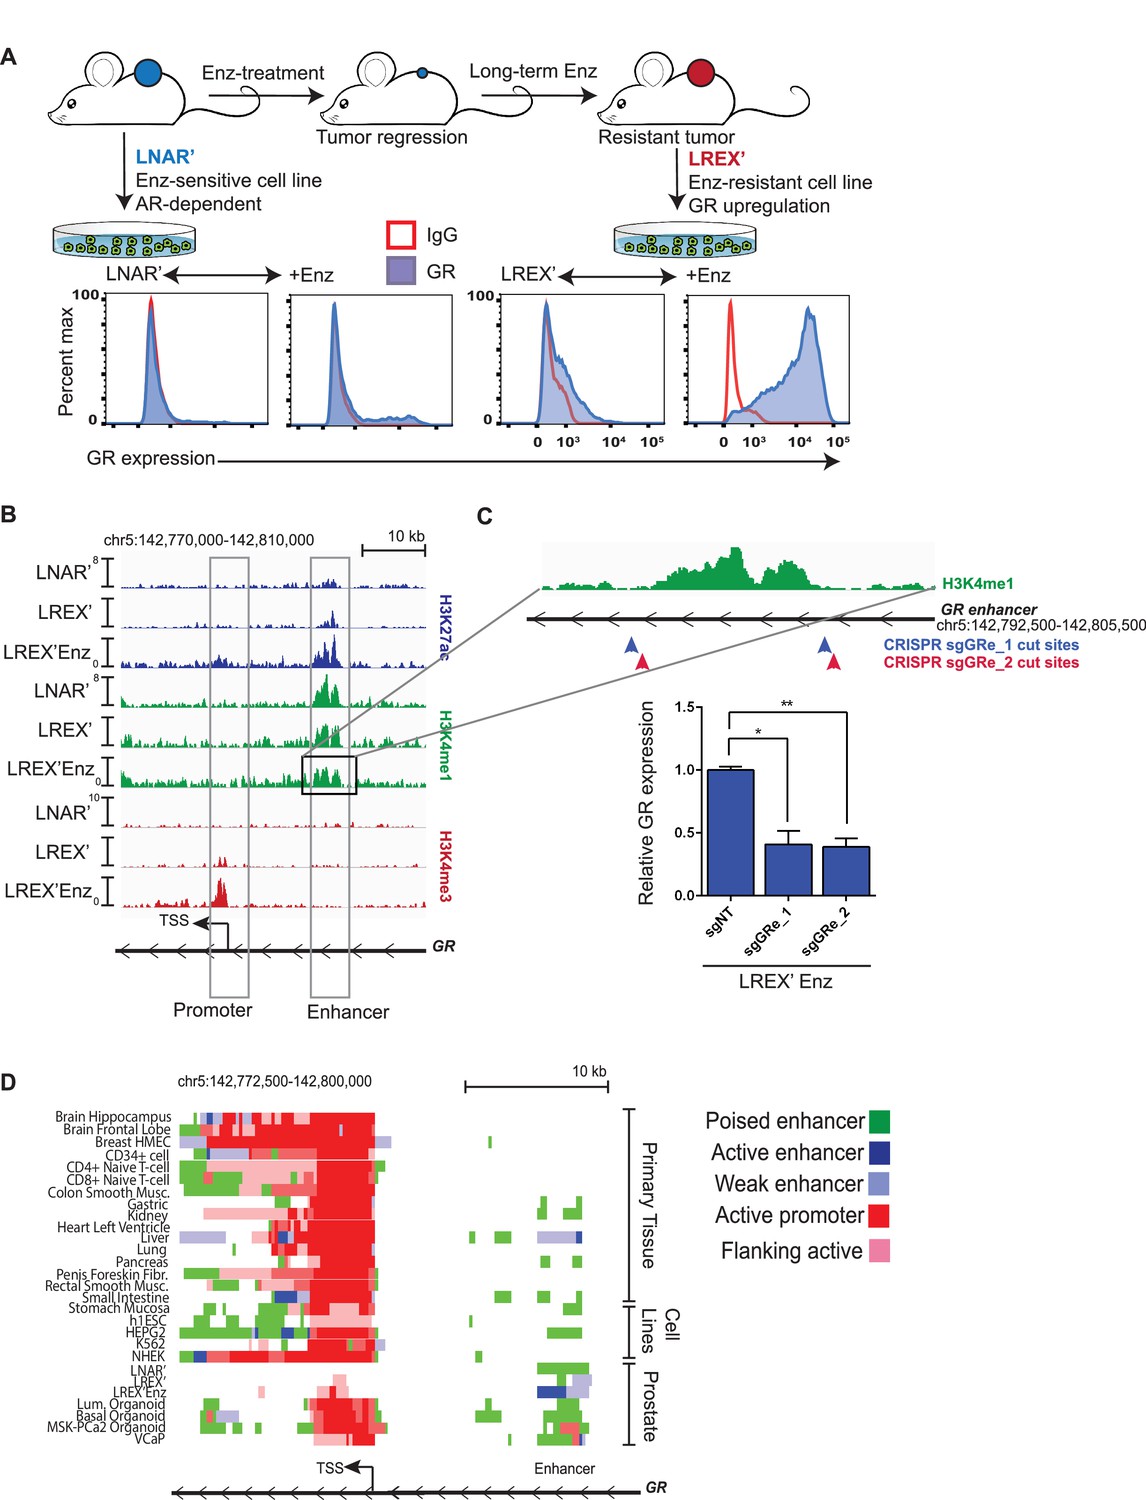
Characterization of a tissue-specific GR (NR3C1) enhancer in prostate cells and Enz-resistant prostate cancer.
(A) Top - LNAR' Enz-sensitive and LREX' Enz-resistant cell lines were derived from in vivo xenograft experiments. Bottom - Flow cytometry on LNAR' and LREX' cell lines for GR expression in the presence and absence of Enz (1 uM). (B) ChIP-seq tracks for H3K27ac (blue), H3K4me1 (green), H3K4me3 (red) at the GR (NR3C1) locus for LNAR', LREX' and LREX'Enz cell lines define the promoter and enhancer regions. Normalized ChIP-seq read counts at GR enhancer/promoter region (LNAR', LREX', LREX'Enz; **=Z score>2): H3K27ac (20.86, 30.57, 72.46**); H3K4me1 (59.62, 36.69, 42.61); H3K4me3 (7.97, 24.54, 94.91**). (C) Top - Experimental design depicting two CRISPR guide pairs (sgGRe_1 and sgGRe_2) flanking the GR (NR3C1) enhancer to excise the entire enhancer region. Bottom - RT-qPCR for GR expression from sorted cells transfected with two different CRISPR guide pairs (sgGRe_1 and sgGRe_2) and a non-targeting (sgNT) control. (D) ChromHMM prediction of promoter and enhancer regulatory elements at the GR (NR3C1) locus using ChIP-seq data for H3K27ac, H3K4me1, H3K4me3 across multiple tissue types (from Roadmap Epigenomics Project), cell lines (from ENCODE database), and prostate cell and organoid lines.
Figure 1—figure supplement 1

Further characterization of GR expression and regulation in prostate cell and organoid models.
(A) Flow cytometry of GR expression in different Enz-resistant clones in the presence or absence of Enz exposure: GR-high (927L) and GR-low (915R) clones show consistent GR-dependent expression on Enz-exposure; GR-negative (920L) resistant clone shows no GR induction. (B,C) MSK-PCa2 organoid lines treated with Enz (1 uM) or Dex (100 nM) over 4 days. B: relative organoid growth as measured by Cell-Titer Glo assay. C: RT-qPCR for FKBP5 as a readout of AR/GR target gene activation, normalized to veh treated samples. (D) Sequencing alignments across the GR (NR3C1) locus for different CRISPR guide pairs excising out the GR enhancer region. sgRNA cut sites in red arrows; PCR primers in blue arrows; sequencing alignments as black bars. (E) DNA agarose gel of PCR products spanning the GR (NR3C1) locus for two different CRISPR guide pairs (sgGRe_1 and sgGRe_2) and a non-targeting control (sgNT). Top band is the intact enhancer PCR product; bottom band is the cut enhancer PCR product. (F) Table of different prostate cell and organoid lines in ChromHMM analysis, describing source of cells and culture conditions. (G) ChromHMM emissions weighted output of different histone modification marks used in ChromHMM regulatory elements prediction software. Intensity of blue color correlates to importance of the specific histone modification in predicting different regulatory elements.
Figure 2 with 2 supplements
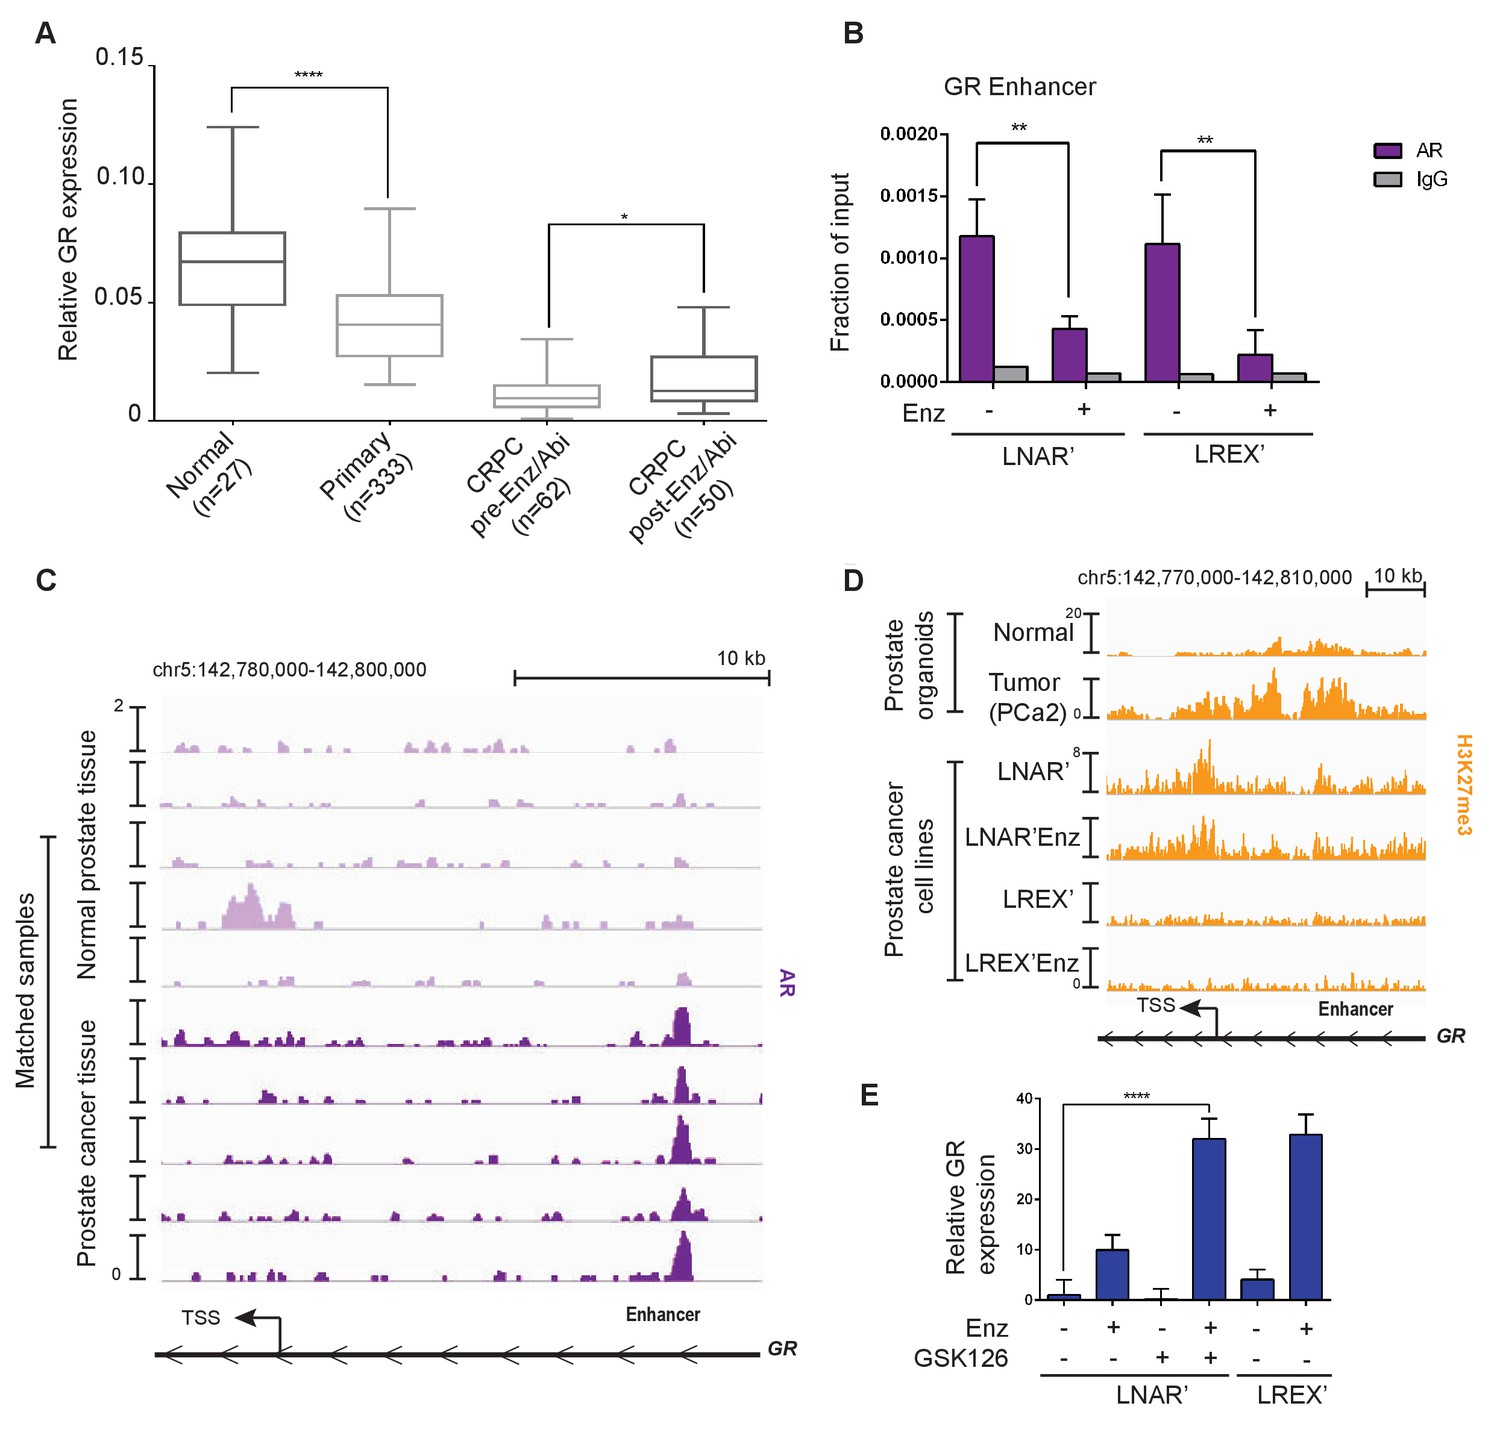
Regulation of GR expression in prostate cancer disease progression at the GR (NR3C1) locus via AR binding and polycomb-mediated H3K27me3 repression.
(A) Combination of TCGA (normal prostate [n = 27] and primary prostate cancer [n = 333]) and SU2C (CRPC pre-Enz/Abi [n = 62] and CRPC post-Enz/Abi [n = 50]) gene expression datasets showing GR expression in prostate cancer disease progression. GR levels across datasets normalized to UBC housekeeping gene. Boxplot shows median GR expression with 5–95 percentile bars. (B) ChIP-qPCR for AR at the GR (NR3C1) enhancer for LNAR' and LREX' cell lines maintained on and off Enz. (C) ChIP-seq tracks for AR at the GR (NR3C1) locus in patient-matched normal prostate tissue and primary prostate cancer tissue samples. (D) ChIP-seq tracks for H3K27me3 at the GR (NR3C1) locus in normal luminal prostate organoids and advanced prostate cancer (MSK-PCa2) organoids (top), and LNAR' and LREX' cell lines maintained on and off Enz (1 uM) (bottom). Normalized ChIP-seq read counts at GR enhancer/promoter region (LNAR', LNAR'Enz, LREX', LREX'Enz; **=Z score>2): H3K27me3 (65.44**, 56.99**, 17.97, 8.53). (E) RT-qPCR for GR expression in LNAR' cells treated for 2 weeks with different combinations of Enz (1 uM) and GSK126 (3 uM), and LREX' cells treated with and without Enz (1 uM).
Figure 2—figure supplement 1
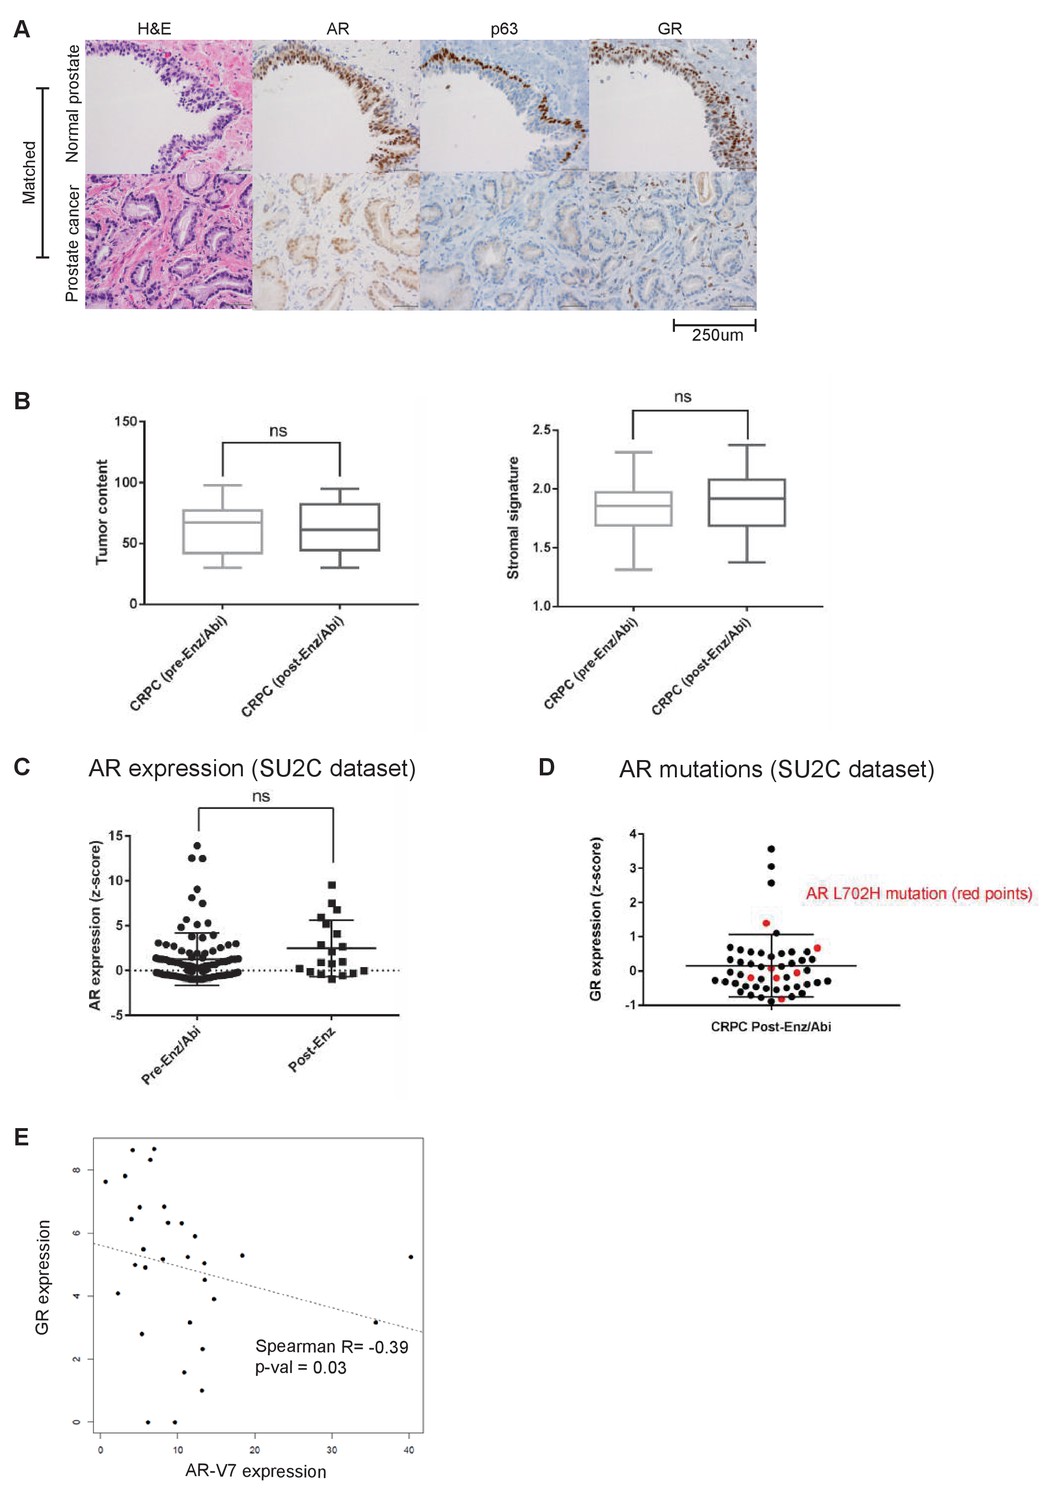
Analysis of GR expression in multiple datasets and primary patient samples.
(A) Hematoxylin and eosin stain and immunohistochemistry for AR, p63, and GR in a paraffin-embedded patient-matched normal prostate and prostate tumor samples. This figure is representative of five matched normal-tumor pairs, which show the same pattern of staining. (B) Computational tumor purity metrics using the ABSOLUTE method and a stromal signature score (explained further in methods). (C) AR expression in SU2C dataset (Karthaus et al., 2014) in CRPC pre-Enz/Abi [n = 62] and CRPC post-Enz [n = 19] samples. (D) GR expression in individual post-Enz/Abi CRPC tumors. Red dots indicate tumors with AR L702H mutation. (E) Correlation between GR expression and AR-V7 expression in post-Enz/Abi patient samples. AR-V7 expression measured by normalized RNA-seq read counts across splice junction.
Figure 2—figure supplement 2
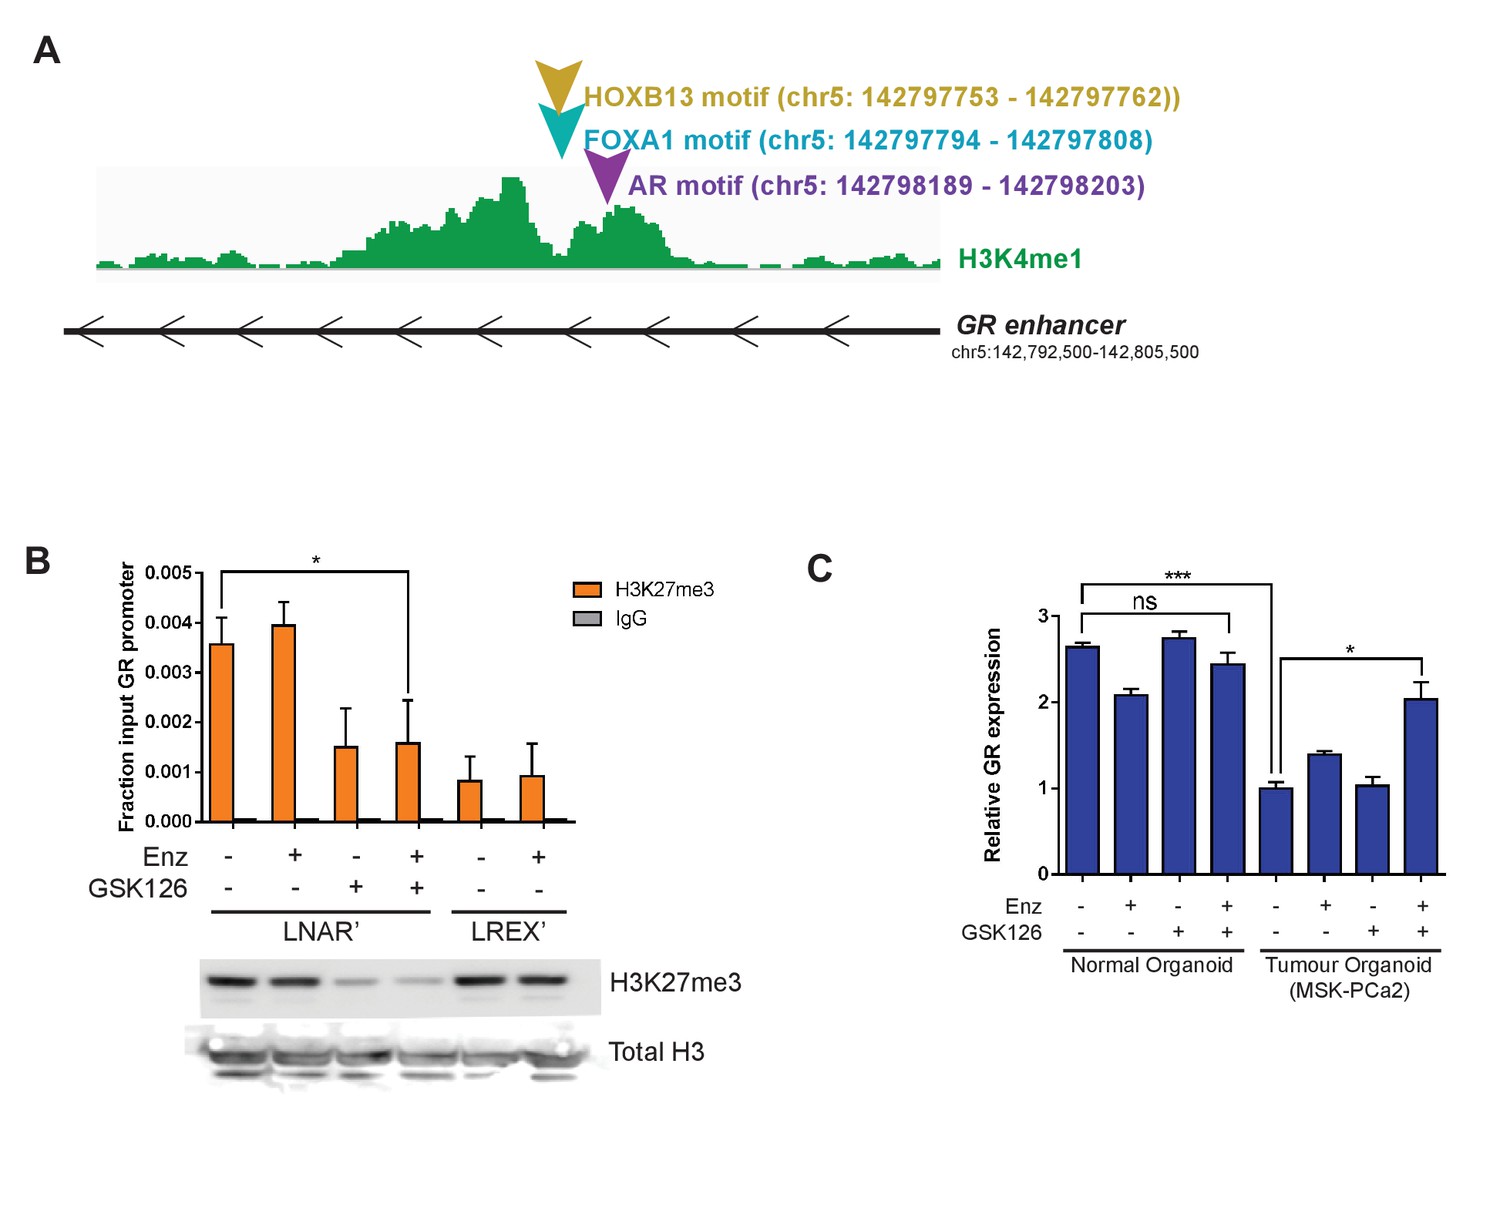
Regulation of GR expression at the GR (NR3C1) locus.
(A) Transcription factor motif scanning across the GR (NR3C1) locus for HOXB13, FOXA1, and AR. (B) Top - ChIP-PCR for H3K27me3 at the GR (NR3C1) locus on LNAR' and LREX' cells with different combinations of Enz (1 uM) and GSK126 (3 uM) over 2 weeks of treatment. Bottom - Western blot for H3K27me3 on LNAR' and LREX' cells with different combinations of Enz (1 uM) and GSK126 (3 uM) over 2 weeks of treatment. (C) RT-qPCR for GR expression in normal luminal prostate organoid and advanced prostate cancer organoid (PCa2) lines treated with different combinations of Enz (1 uM) and GSK126 (3 uM) over 5 days of treatment.
Figure 3 with 1 supplement
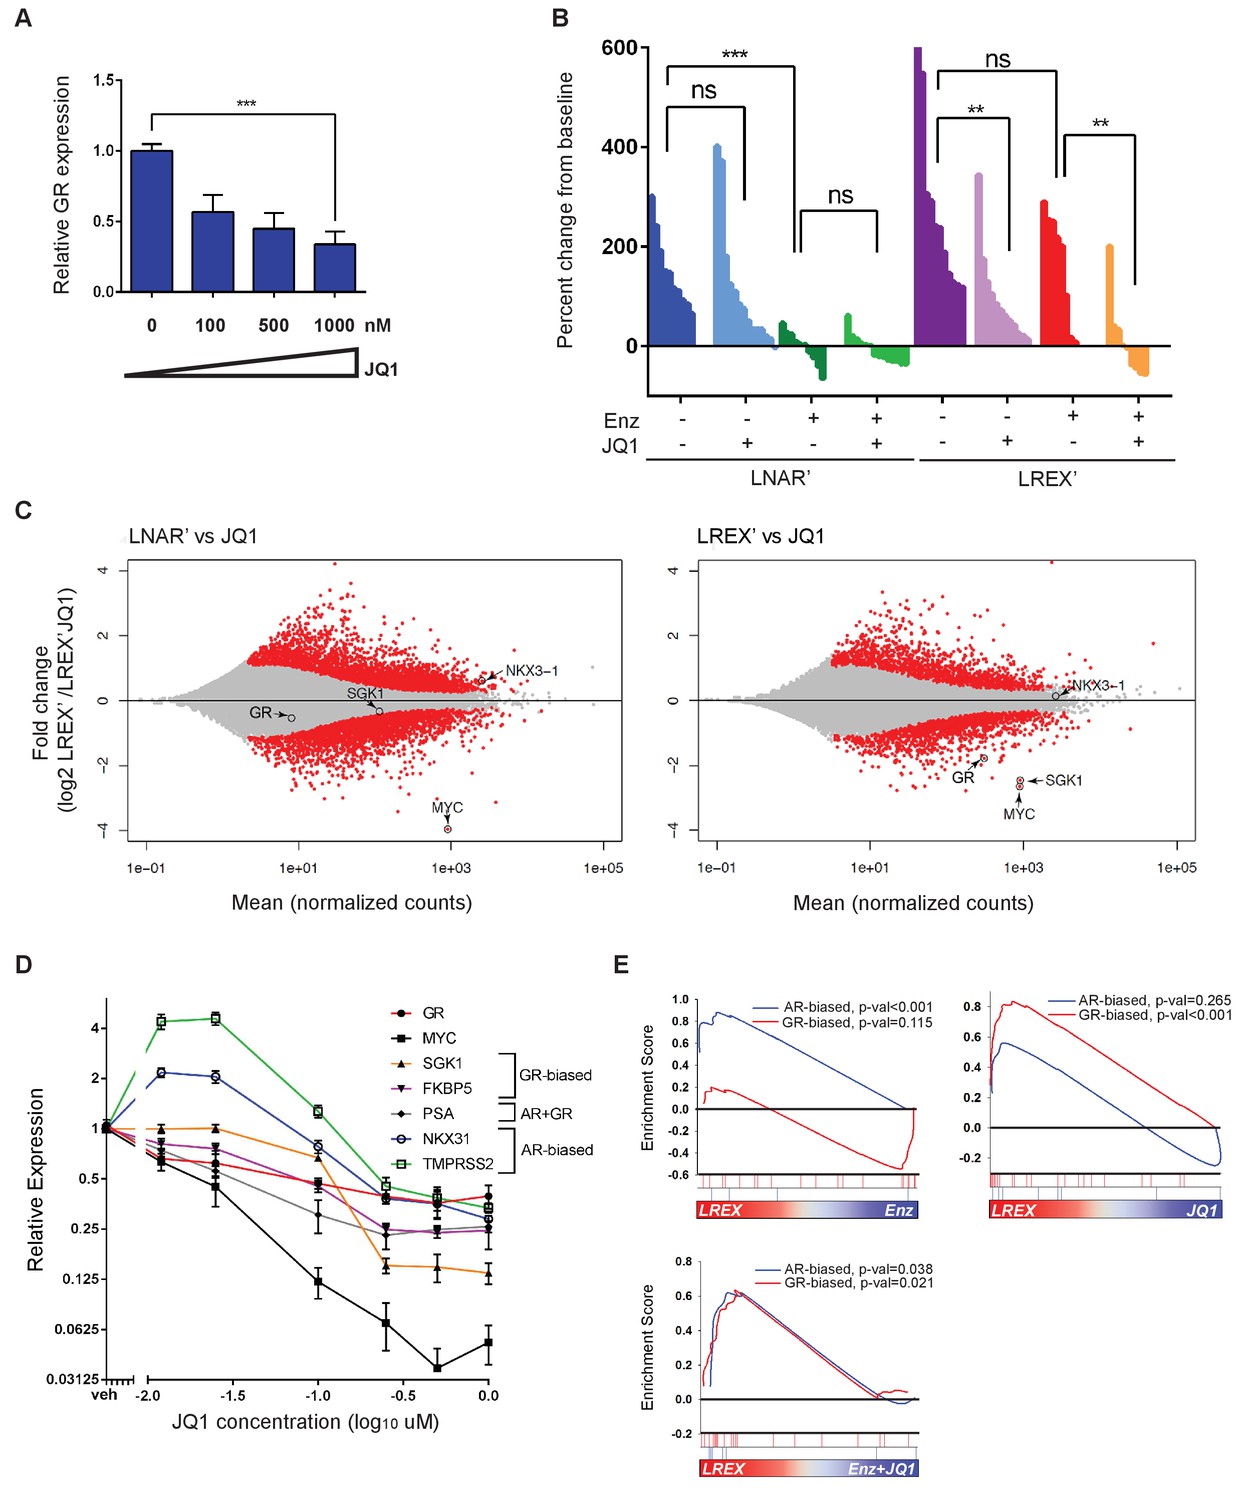
Sensitivity of LREX' resistant tumors to BET inhibition by modulation of GR expression.
(A) RT-qPCR for GR expression in LREX'Enz cells treated in vitro with increasing doses of JQ1 for 24 hr. (B) Waterfall plot showing in vivo LNAR' and LREX' xenograft tumor growth, treated with different combinations of Enz (10 mg/kg daily) and JQ1(50 mg/kg daily) for 4 weeks after tumors are established. (C) MA plot showing differential gene expression analysis from RNA-seq data of in vivo LNAR’ (left) and LREX' tumors (right) treated with JQ1 (50 mg/kg) after 4 weeks of treatment. Red points are differentially expressed genes (DEGs) that have an adjusted p-val <0.05. MYC, GR, NKX3.1 (AR target) and SGK1 (GR target) genes are shown on plot. (D) JQ1 treatment dose-response curve in LREX'Enz cells for 48 hr, measuring gene expression changes normalized to veh treatment for GR (NR3C1), MYC, SGK1, FKBP5, PSA (KLK3), NKX3.1, TMPRSS2. Error bars represent standard error. (E) Gene set enrichment analysis (GSEA) using AR-biased and GR-biased gene sets on LREX' tumors treated with Enz (10 mg/kg), JQ1(50 mg/kg), or a combination of Enz +JQ1 after 4 weeks of treatment.
Figure 3—figure supplement 1

Effects of JQ1 treatment on histone marks at GR (NR3C1) locus.
(A) Histone ChIP-PCR for H3K4me1, H3K27ac, and H3K27me3 at GR locus for LREX' cells ± Enz (1 uM)±JQ1 (1 uM for 48 hr). (B) Histone ChIP-PCR for AR at GR locus for LREX' cells ± Enz (1 uM)±JQ1 (1 uM for 48 hr).
Figure 4 with 1 supplement

Mechanism of JQ1 drug action in LREX' resistant tumors.
Chem-Seq tracks for bioJQ1 (light tracks) and ChIP-seq tracks for BRD4 (dark track) in LNAR' and LREX' cell lines treated with and without Enz (1 uM), showing the MYC locus (A) and GR gene (NR3C1) locus (B). Normalized Chem-seq/ChIP-seq read counts at MYC promoter region: (LNAR', LNAR'Enz, LREX', LREX'Enz; **=Z score>2): bio-JQ1 (36.53, 48.50, 37.10, 38.49); BRD4 (31.56**). GR enhancer: bio-JQ1 (45.98, 45.46, 33.85, 91.68**); BRD4 (16.49). (C) Differential peak analysis of bio-JQ1 Chem-Seq between LREX'Enz and LNAR'Enz. Colored points have mean log2 normalized reads >4; blue points are bio-JQ1 peaks higher in LNAR'Enz cells, red points are bio-JQ1 peaks higher in LREX'Enz cells. Differential GR and MYC peaks are shown on plot. (D) Top - Waterfall plot showing in vivo LREX' xenograft tumor growth with doxycycline-inducible GR over-expression (pCW-GR) or empty vector (pCW-EV) control. Tumors treated with Enz (10 mg/kg), JQ1 (50 mg/kg), and doxycycline for 4 weeks once tumors are established. Bottom - experimental design for GR overexpression rescue experiment over the course of 68 days. (E) Model for GR regulation in prostate cancer disease progression.
Figure 4—figure supplement 1

Further analysis of JQ1 anti-tumor activity and GR selectivity.
(A) Correlation of fold change of H3K27ac peaks (between LREX'Enz/LNAR) to fold change of bio-JQ1 peaks. GR and MYC pointed out on plot. (B) Immunohistochemistry for GR in paraffin-embedded LREX' tumors treated with Enz (10 mg/kg), JQ1 (50 mg/kg), and doxycycline for 4 weeks, and either an empty vector (pCW-EV) control or doxycycline-inducible GR (pCW-GR) over-expression construct. (C) RT-qPCR for GR and SGK1 in LREX' tumors treated with Enz (10 mg/kg) and JQ1 (50 mg/kg) over 4 weeks, with either an empty vector (pCW-EV) control or doxycycline-inducible GR (pCW-GR) over-expression construct.
Author response image 1
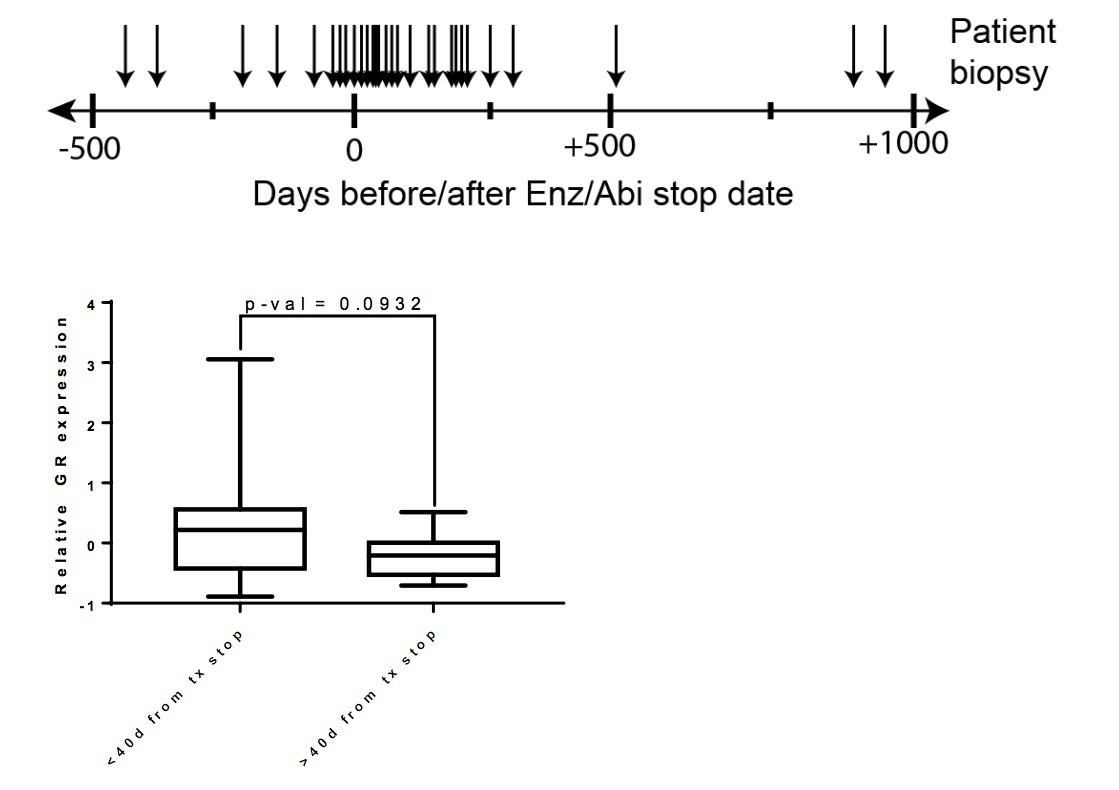
Top – Clinical data for post Enz/Abi patients.
Arrows indicate the time at which the biopsy was taken for sequencing (number of days before/after Enz/Abi stop date). Bottom – Patients whose biopsies were taken while off drug for less than 40 days had a trend for higher GR expression when compared to patients who were off drug for greater than 40 days (p-val=0.0932).
Author response image 2
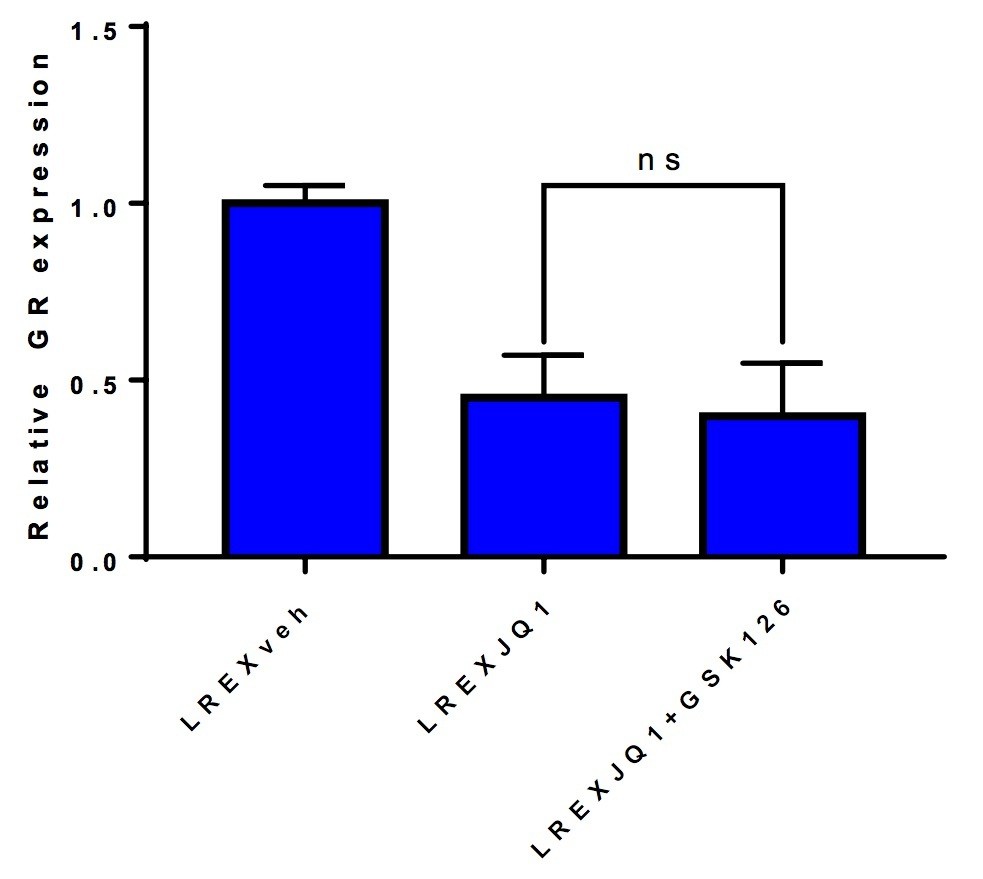
LREX' cells treated with different combinations of 1uM JQ1 and 3uM GSK126 for 72h.
Combination of JQ1+GSK126 does not rescue GR expression.
Author response image 3
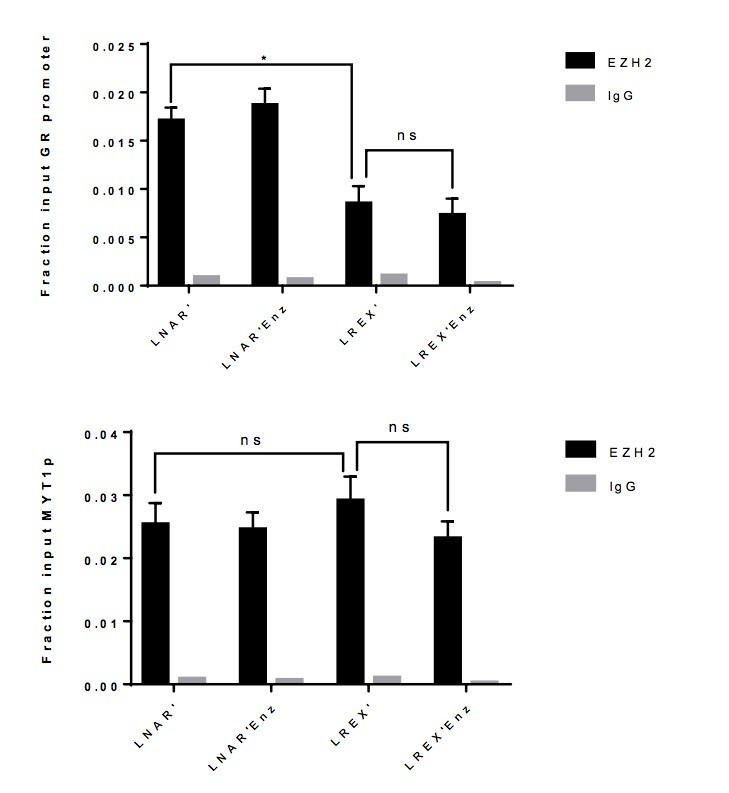
EZH2 ChIP-PCR performed in LNAR' and LREX' cells with or without Enz treatment at GR promoter (top), and MYT1 promoter (bottom) used as a positive control.
Author response image 4
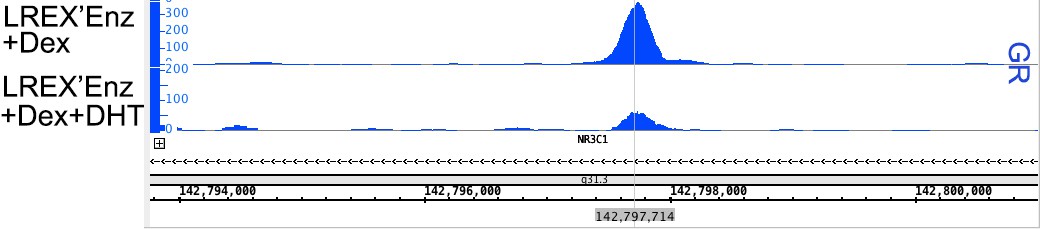
GR ChIP-seq peaks at NR3C1 locus for LREX'Enz samples.
Cells were treated with either Dex (100nM 24h – top track) or Dex + DHT (1nM 24h – bottom track). Acute treatment with DHT is able to significantly decrease the peak height of GR at this binding site.
Additional files
-
Transparent reporting form
- https://doi.org/10.7554/eLife.27861.011
Download links
A two-part list of links to download the article, or parts of the article, in various formats.
Downloads (link to download the article as PDF)
Open citations (links to open the citations from this article in various online reference manager services)
Cite this article (links to download the citations from this article in formats compatible with various reference manager tools)
Regulation of the glucocorticoid receptor via a BET-dependent enhancer drives antiandrogen resistance in prostate cancer
eLife 6:e27861.
https://doi.org/10.7554/eLife.27861


