Parvalbumin-positive interneurons mediate neocortical-hippocampal interactions that are necessary for memory consolidation
- University of Toronto, Canada
- University Avenue, Canada
- University of Toronto Scarborough, Canada
Figures
Figure 1 with 3 supplements
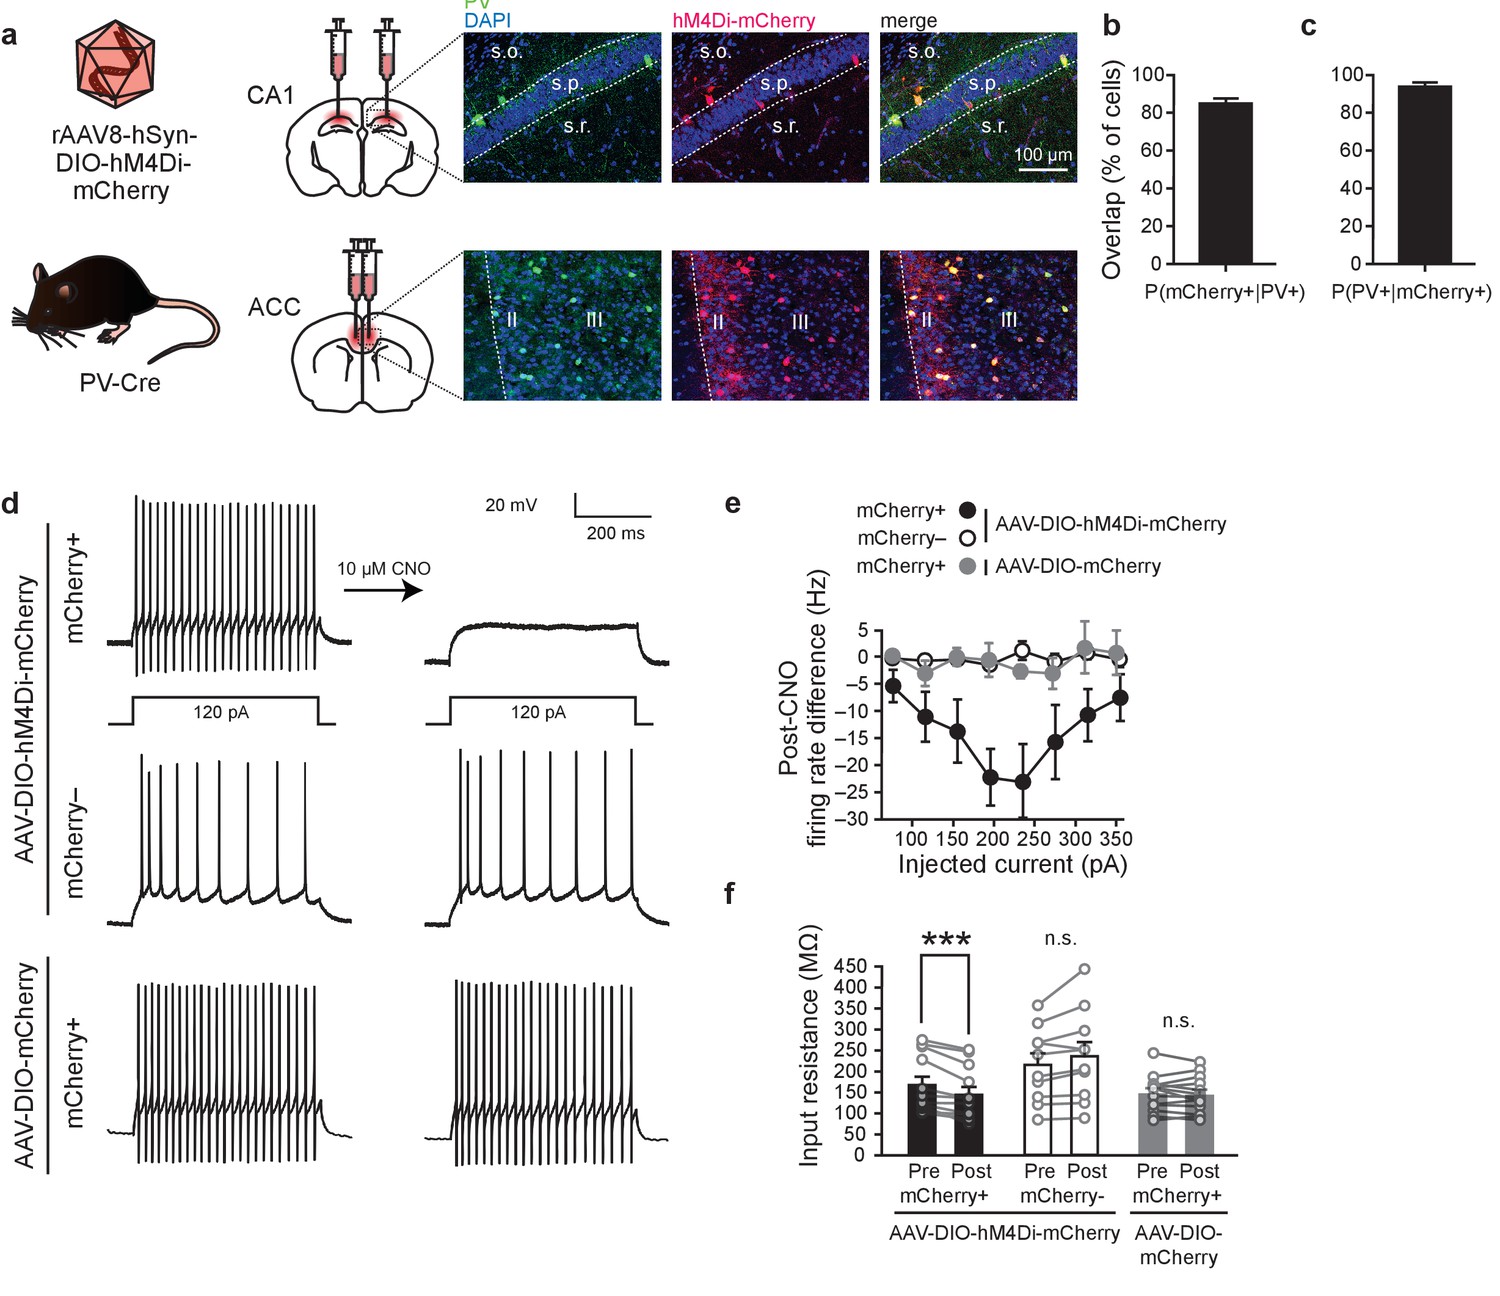
Chemogenetic inhibition of PV+cells.
(a) Representative images showing co-localization of hM4Di-mCherry+ and PV+ cells in PV-Cre mice infused with AAV-DIO-hM4Di-mCherry virus in CA1 or ACC. (b) High overlap of PV+ cells that are mCherry+ (n = 10). (c) High overlap of mCherry+ cells that are PV+ cells (n = 10). (d) Representative current clamp traces in hM4Di-mCherry+ cells and mCherry- cells in AAV-DIO-hM4Di-mCherry-infused mice, and mCherry+ cells in AAV-DIO-mCherry-infused mice before and after bath application of CNO (hM4Di-mCherry+ n = 12, hM4Di-mCherry-n=10, mCherry+ n = 13, mixed-model permutation test, 1000 permutations, [hM4Di-mCherry+ versus hM4Di-mCherry- versus mCherry+]: p=0.001). (e,f) Bath application of CNO (e) decreases firing rate (post-CNO − pre-CNO) in hM4Di-mCherry+ cells (but not mCherry- cells, or mCherry+ cells in AAV-DIO-mCherry-infused mice), (mixed-model permutation test, 1000 permutations, [hM4Di-mCherry+ versus hM4Di-mCherry- versus mCherry+] x [pre-CNO versus post-CNO]: p=0.001), and (f) decreases input resistance in hM4Di-mCherry+ cells (but not mCherry- cells, or mCherry+ cells in AAV-DIO-mCherry-infused mice), (−80 pA current injection, two-way ANOVA, [hM4Di-mCherry+ versus hM4Di-mCherry- versus mCherry+] x [pre-CNO versus post-CNO]: F32,1 = 13.14, p=6.8×10⁻⁵, post hoc paired t-test with Bonferroni correction hM4Di-mCherry+ [pre-CNO versus post-CNO], t11 = 4.9, p=0.001, hM4Di-mCherry- [pre-CNO versus post-CNO], t9 = −2.3, p=0.12, mCherry+ [pre-CNO versus post-CNO], t12 = 0.67, p=1.0). Data are mean ±s.e.m., or individual mouse. (***p<0.001, n.s.: not significant).
Figure 1—figure supplement 1
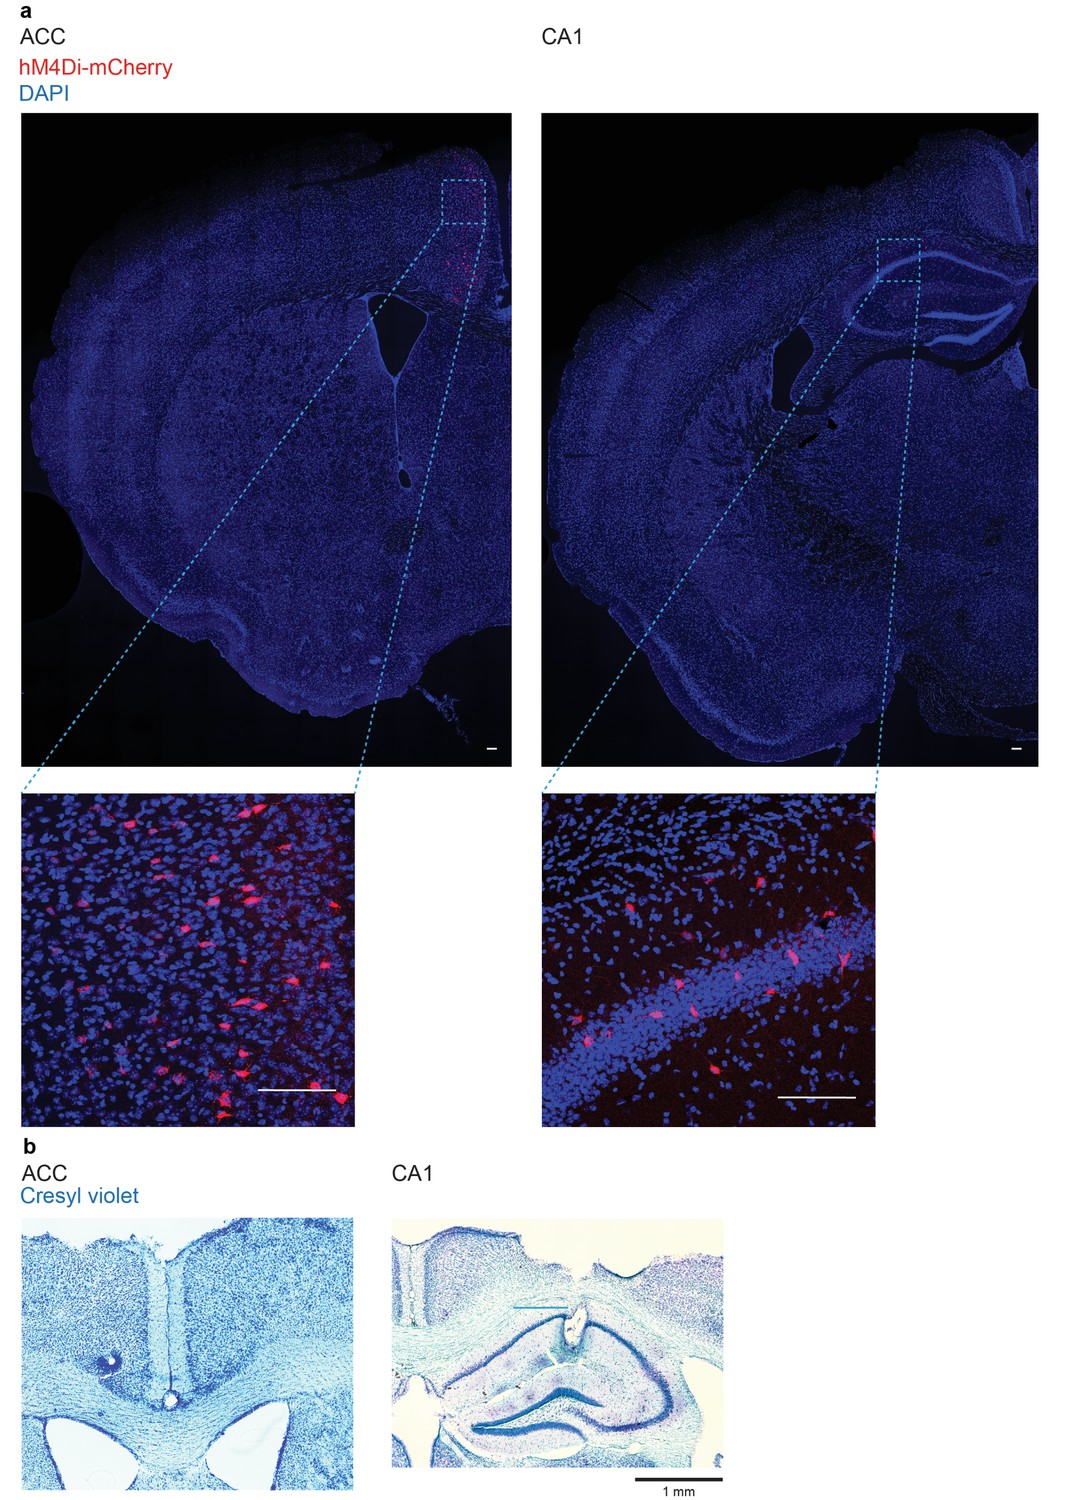
Representative hM4Di-mCherry expression and LFP electrode locations in PV-Cre mice.
(a) hM4Di-mCherry expression in PV-Cre mice micro-infused with AAV8-hSyn-DIO-hM4Di-mCherry in ACC (left) or dorsal CA1 (right) (scale bar = 100 μm), and (b) cresyl-violet stained sections from one mouse showing electrode placements in the ACC (left) and dorsal CA1 (right).
Figure 1—figure supplement 2
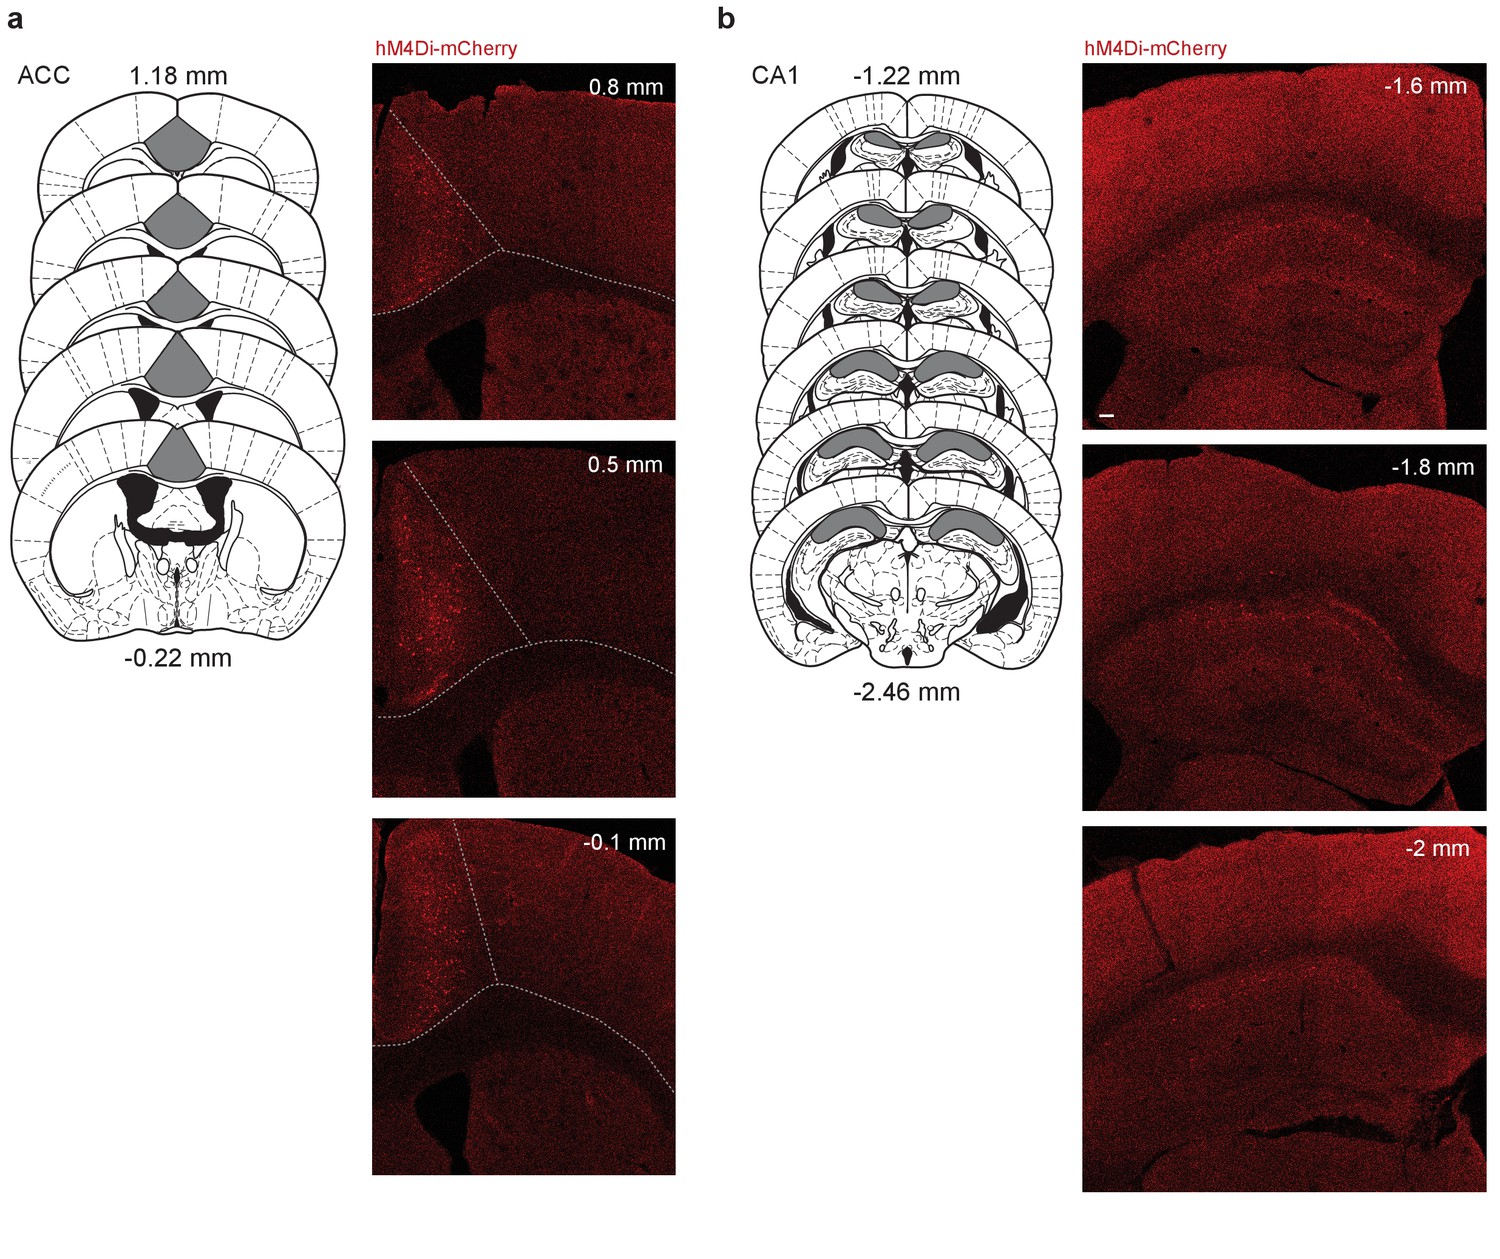
Representative spread of hM4Di-mCherry infection in ACC and CA1.
(a) Schematics showing estimates of hM4Di-mCherry expression, and additional representative images of infection in PV-Cre mice micro-infused with AAV8-hSyn-DIO-hM4Di-mCherry in ACC, or (b) dorsal CA1 (scale bar = 100 μm).
Figure 1—figure supplement 3
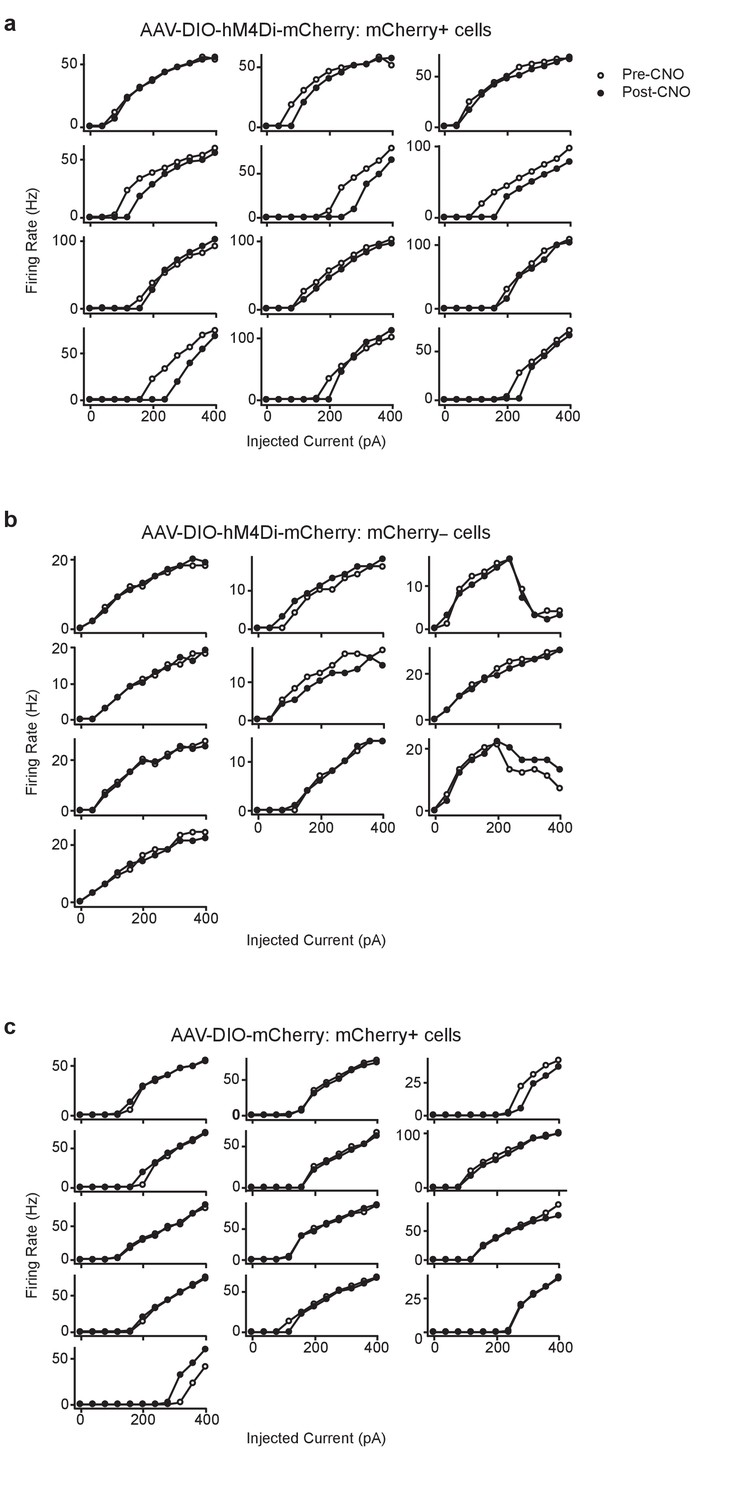
Decrease in firing rate was observed Post-CNO in (a) hM4Di-mCherry+cells (n = 12), but not in (b) hM4Di-mCherry- cells (n = 10), or (c) mCherry+cells (n = 13).
Traces are firing rates over current steps of all individual cells included in the summary data shown in Figure 1e.
Figure 2 with 1 supplement
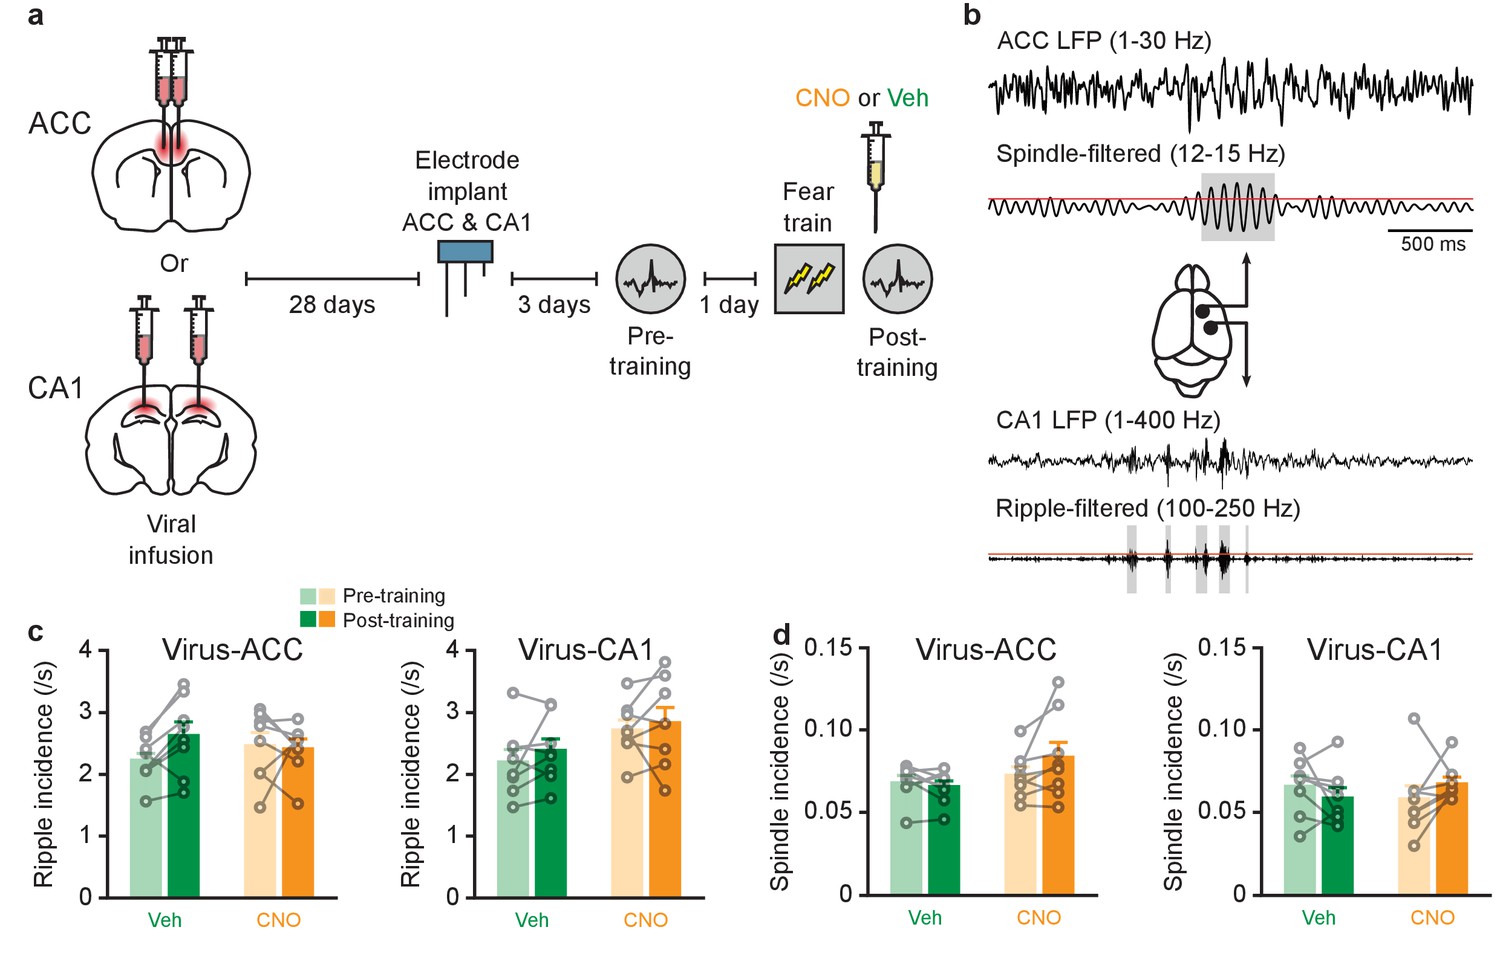
Inhibition of PV+cell in ACC or CA1 does not alter ripple or spindle incidence.
(a) Experimental design. (b) Example traces of LFPs recorded in ACC (top two traces, low-pass filtered, and spindle-band filtered) and CA1 (bottom two traces, low-pass filtered, and ripple-band filtered), during a typical sleep session in one animal. Grey regions indicate spindles (top) and ripples (bottom) detected in ACC and CA1 LFPs, respectively. Red lines denote amplitude threshold used. Grey boxes denote ripple or spindle windows that passed detection threshold. (c,d) No change (c) in ripple incidence in mice micro-infused with virus in ACC (n = 8 per group; two-way repeated measures ANOVA pre-training versus post-training x Vehicle (Veh) versus CNO; pre-training versus post-training F1,14 = 1.77, p=0.20; Veh versus CNO F1,14 = 0.0007, p=0.98; interaction F1,14 = 2.91, p=0.11) or CA1 (n = 8 per group; pre-training versus post-training F1,14 = 1.317, p=0.27; Veh versus CNO F1,14 = 3.63, p=0.077; interaction F1,14 = 0.10, p=0.76), or (d) spindle incidence in mice miroinfused with virus in ACC (n = 8 per group; pre-training versus post-training F1,14 = 1.48, p=0.24; Veh versus CNO F1,14 = 2.25, p=0.16; interaction F1,14 = 3.54, p=0.081) or CA1 (n = 8 per group; pre-training versus post-training F1,14 = 0.039, p=0.85; Veh versus CNO F1,14 = 0.002, p=0.96; interaction F1,14 = 2.74, p=0.12). Data are individual mouse, or mean ±s.e.m.
Figure 2—figure supplement 1

Inhibition of PV+cells in ACC or CA1 does not alter ripple or spindle amplitude, induce seizures, or alter sleep architecture, but impairs learning-induced increase in ripple-spindle coupling.
CNO administration (compared to Veh administration) to mice micro-infused with hM4Di-mCherry in ACC or CA1 region of dorsal hippocampus did not alter (a) ripple amplitude (Veh n = 16, ACC-CNO n = 8, CA1-CNO n = 8; two-way repeated measures ANOVA pre-training versus post-training x Veh versus ACC-CNO versus CA1-CNO; pre-training versus post-training F1,29 = 13.42, p=0.001; Veh versus ACC-CNO versus CA1-CNO F2,29 = 0.63, p=0.54; interaction F2,29 = 0.64, p=0.54), or (b) spindle amplitude (Veh n = 16, ACC-CNO n = 8, CA1-CNO n = 8; Kruskal-Wallis test Veh versus ACC-CNO versus CA1-CNO p=0.056; Wilcoxon signed rank test pre-training versus post-training p=0.027). No differences in (c) power spectrum (between 2–200 Hz) before (pre-training) and after (post-training) CNO treatment in mice micro-infused with virus in ACC (left, % total ACC power, n = 8) or CA1 (right, % total CA1 power, n = 8), or (d) % total power (between 1–100 Hz) as quantified from (c), in delta (1–4 Hz), theta (4–12 Hz), alpha (12–20 Hz), beta (20–40 Hz) or gamma (40–100 Hz) frequency bands in mice micro-infused with hM4Di-mCherry virus in ACC (left, two-way repeated measures ANOVA pre-training versus post-training x five frequency bands; pre-training versus post-training F1,7 = 0.47, p=0.52; frequency bands F4,28 = 17.88, p<0.0001; interaction pre-training versus post-training x frequency bands F4,28 = 1.74, p=0.17), or CA1 (right, two-way repeated measures ANOVA pre-training versus post-training x five frequency bands; pre-training versus post-training F1,7 = 0.001, p=0.97; frequency bands F4,28 = 16.30, p<0.0001; interaction F4,28 = 0.64, p=0.64). No differences in Veh- or CNO-treated mice micro-infused with virus in ACC or CA1 in (e) non-REM (NREM) ratio during recording sessions, (ACC, left, n = 8 per group; two-way repeated measures ANOVA pre-training versus post-training x Veh versus CNO; pre-training versus post-training F1,14 = 3.46, p=0.084; Veh versus CNO F1,14 = 1.12, p=0.31; interaction F1,14 = 0.40, p=0.55; CA1, right, n = 8 per group; Mann-Whitney test p=0.84, Wilcoxon signed-rank test Veh pre-training versus post-training p=0.74, CNO pre-training versus post-training p=0.55), or (f) NREM bout duration (ACC, left, n = 8 per group; Mann-Whitney test p=0.15, Wilcoxon signed-rank test Veh pre-training versus post-training p>0.99, CNO pre-training versus post-training p=0.55; CA1, right, n = 8 per group; Mann-Whitney test p=0.75, Wilcoxon signed-rank test Veh pre-training versus post-training p=0.95, CNO pre-training versus post-training p=0.38). (g) Learning-induced increases in cross-correlation between spindle and ripple events in Veh-treated mice micro-infused with hM4Di-mCherry in ACC or CA1 was prevented in CNO-treated mice. (h) Pre-training-normalized peak correlation coefficients in mice micro-infused with virus in ACC (n = 8 per group; Welch’s t-test t8.07 = 2.46, p=0.023; Veh versus one one-sample t-test t7 = 1.93, p=0.095; CNO versus one one-sample t-test t7 = 3.49, p=0.01), or CA1 (n = 8 per group; Welch’s t-test t8.73 = 2.49, p=0.036; Veh versus one one-sample t-test t7 = 2.18, p=0.066; CNO versus one one-sample t-test t7 = 1.29, p=0.24). (i) Pre-training-normalized ripple-spindle joint occurrence rate in mice micro-infused with virus in ACC (n = 8 per group; Welch’s t-test t9.66 = 3.67, p=0.005; Veh versus one one-sample t-test t7 = 2.66, p=0.033; CNO versus one one-sample t-test t7 = 3.05, p=0.020), or CA1 (n = 8 per group; Welch’s t-test t7.88 = 2.35, p=0.047; Veh versus one one-sample t-test t7 = 2.08, p=0.077; CNO versus one one-sample t-test t7 = 1.40, p=0.21). Data are individual mouse, or mean ±s.e.m. (a.u.: arbitrary unit, *p<0.05, **p<0.01).
Figure 3 with 2 supplements
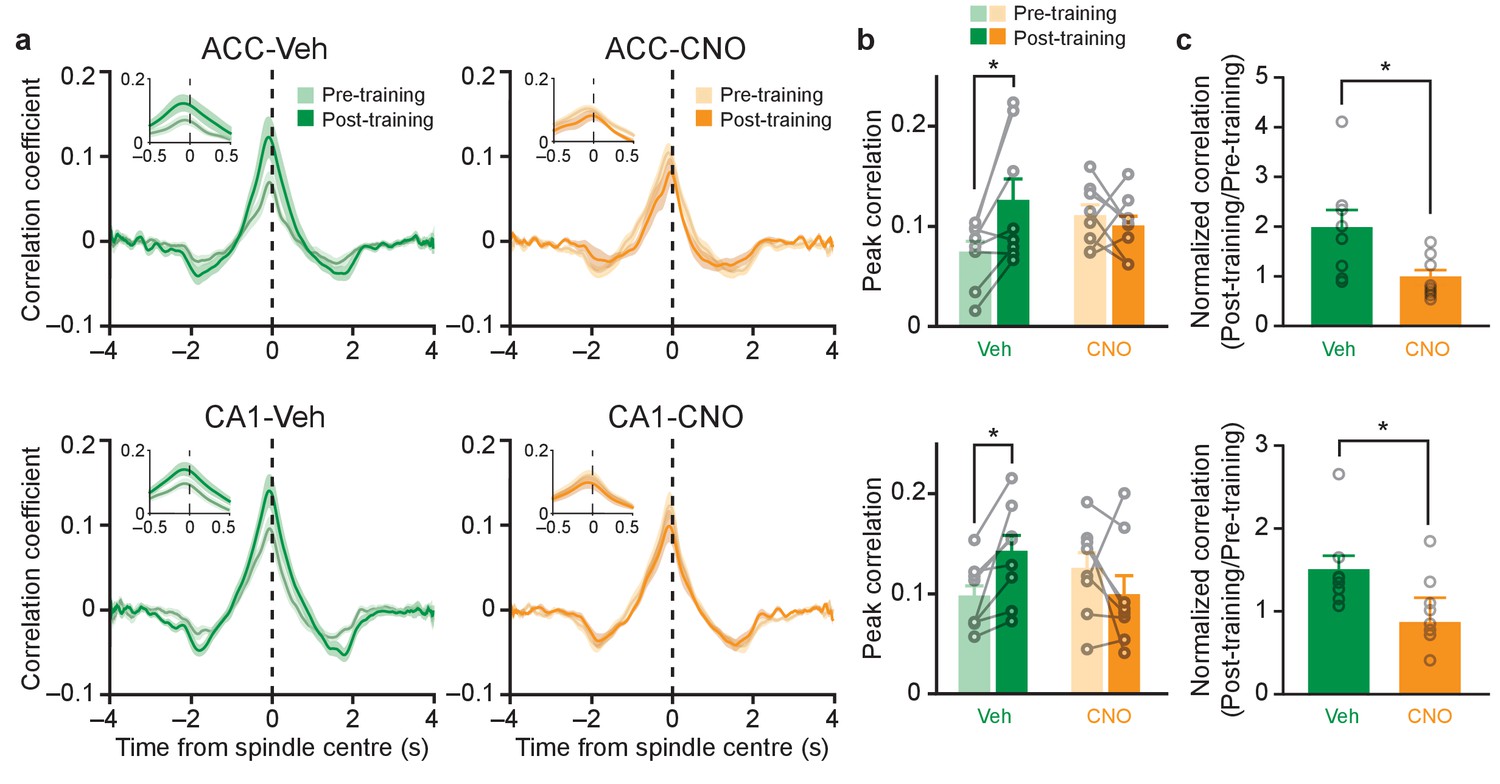
Inhibition of PV+cell in ACC or CA1 eliminates learning-induced increases in ripple-spindle coupling.
(a) Learning-induced increases in cross-correlation between spindle and ripple amplitude in Veh-treated mice are prevented in CNO-treated mice micro-infused with hM4Di-mCherry in ACC or CA1. Insets show correlation within ±0.5 s of spindle centre. (b) Peak cross-correlation coefficients quantified from (a), in mice micro-infused with virus in ACC (top; n = 8 per group; pre-training versus post-training F1,14 = 2.88, p=0.11; Veh versus CNO F1,14 = 0.15, p=0.70; interaction F1,14 = 6.68, p=0.022; post hoc Bonferroni’s test, Veh pre-training versus Veh post-training p=0.018, CNO pre-training versus CNO post-training p>0.999), or CA1 (bottom; n = 8 per group; pre-training versus post-training F1,14 = 0.46, p=0.51; Veh versus CNO F1,14 = 0.09, p=0.77; interaction F1,14 = 8.42, p=0.012; post hoc Bonferroni’s test, Veh pre-training versus Veh post-training p=0.048, CNO pre-training versus CNO post-training p=0.28). (c) Pre-training-normalized peak correlation coefficients in mice micro-infused with virus in ACC (n = 8 per group; Welch’s t-test t9.24 = 2.46, p=0.035; Veh versus one one-sample t-test t7 = 2.59, p=0.036; CNO versus one one-sample t-test t7 = 0.17, p=0.87), or CA1 (Pre-training-normalized peak correlation coefficients, n = 8 per group; Mann-Whitney p=0.015; Veh versus one one-sample Wilcoxon signed rank test, p=0.008; CNO versus one one-sample Wilcoxon signed rank test, p=0.31). Data are individual mouse, or mean ±s.e.m. (*p<0.05).
Figure 3—figure supplement 1
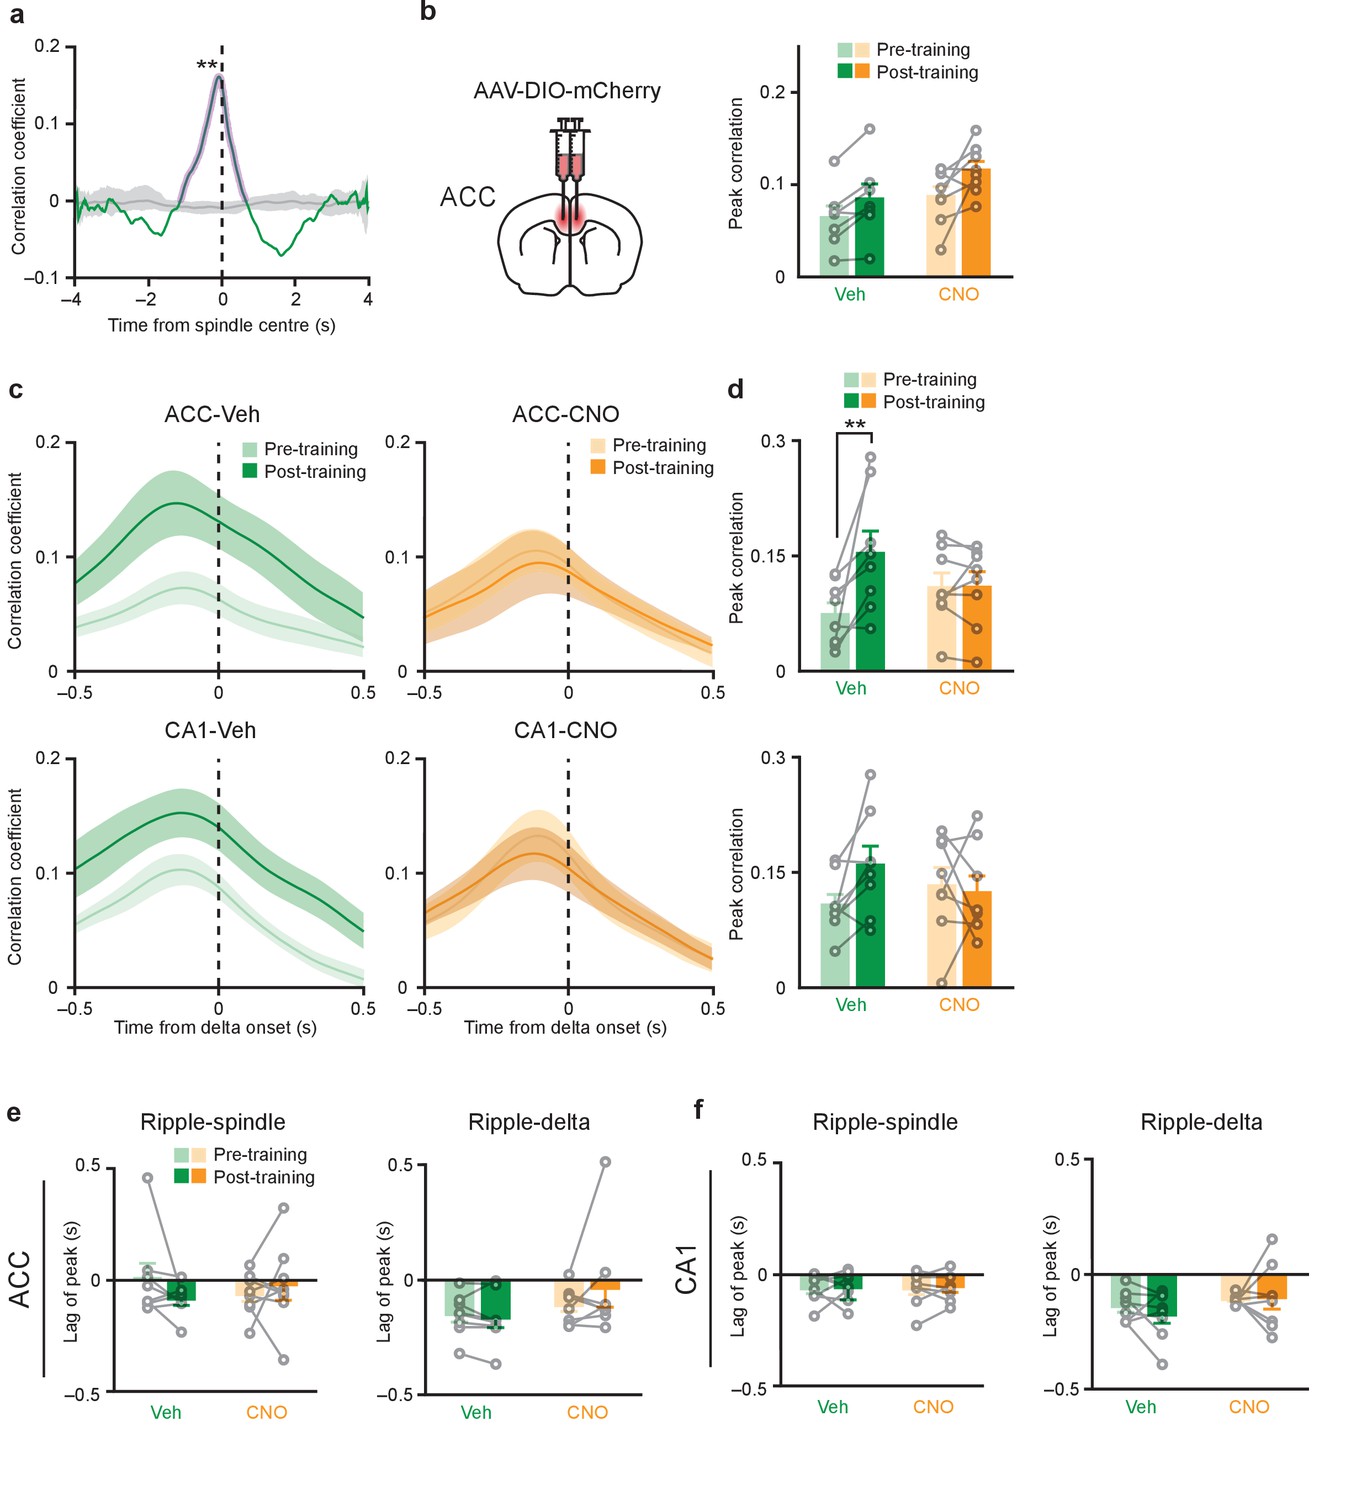
Probability of ripple-spindle coupling is significantly greater than chance; and learning-induced increase in ripple-spindle coupling is not prevented by CNO in mice infused with the control virus; similar to the effect on ripple-spindle coupling, inhibition of PV+cell in the ACC or CA1 eliminates learning-induced increases in ripple-delta coupling, without changing the time lag between baseline ripple and spindle or delta oscillations.
(a) A representative example of original vs. shuffled correlation in one mouse infused with AAV-DIO-hM4Di-mCherry in CA1 and recorded during the Pre-training session, showing that ripple-spindle coupling at baseline was significantly higher than chance (grey shaded line/region: shuffled correlation mean, and 1st/99th percentile of 100 shuffles; green line: original correlation; purple shaded region: statistically significant original versus shuffled correlation, permutation test, 100 permutations, p=0.01). (b) Ripple-spindle coupling was assessed in mice infused with AAV-DIO-mCherry virus in ACC. In these mice, learning-induced increases in cross-correlation between ripple and spindle amplitude were observed in both Veh- and CNO-treated groups (peak cross-correlation coefficients: DMSO n = 7, CNO n = 8; two-way repeated measures ANOVA pre-training versus post-training x Veh versus CNO; pre-training versus post-training F1,13 = 12.2, p=0.004; Veh versus CNO F1,13 = 2.98, p=0.11; interaction F1,13 = 0.34, p=0.57). (c) Learning-induced increases in cross-correlation between delta and ripple amplitude in Veh-treated mice were prevented in mice micro-infused with hM4Di-mCherry in ACC or CA1 by CNO treatment. (d) Peak cross-correlation coefficients quantified from (a), in mice micro-infused with virus in ACC (top; n = 8 per group; two-way repeated measures ANOVA pre-training versus post-training x Veh versus CNO; pre-training versus post-training F1,14 = 7.80, p=0.014; Veh versus CNO F1,14 = 0.03, p=0.86; interaction F1,14 = 7.52, p=0.016; post hoc Bonferroni’s test, Veh pre-training versus Veh post-training p=0.003, CNO pre-training versus CNO post-training p>0.99), or CA1 (bottom; n = 8 per group; two-way repeated measures ANOVA pre-training versus post-training x Veh versus CNO; pre-training versus post-training F1,14 = 1.52, p=0.24; Veh versus CNO F1,14 = 0.05, p=0.83; interaction F1,14 = 3.08, p=0.10). (c) No change in lag between ripples and spindles in Veh- or CNO-treated mice micro-infused with virus in ACC (top; n = 8 per group; Mann-Whitney test p=0.48; Wilcoxon signed-rank test Veh pre-training versus post-training p=0.20, CNO pre-training versus post-training p=0.64), or CA1 (bottom; n = 8 per group; two-way repeated measures ANOVA pre-training versus post-training x Veh versus CNO; pre-training versus post-training F1,14 = 0.14, p=0.71; Veh versus CNO F1,14 = 0.03, p=0.87; interaction F1,14 = 0.02, p=0.88). (e) No change in lag between ripple and delta oscillations, in mice micro-infused with virus in ACC (top; n = 8 per group; Mann-Whitney test p=0.39, Wilcoxon signed-rank test Veh pre-training versus post-training p=0.69, CNO pre-training versus post-training p=0.64), or (f) CA1 (bottom; n = 8 per group; two-way repeated measures ANOVA pre-training versus post-training x Veh versus CNO; pre-training versus post-training F1,14 = 0.49, p=0.50; Veh versus CNO F1,14 = 0.39, p=0.54; interaction F1,14 = 0.06, p=0.80).
Figure 3—figure supplement 2
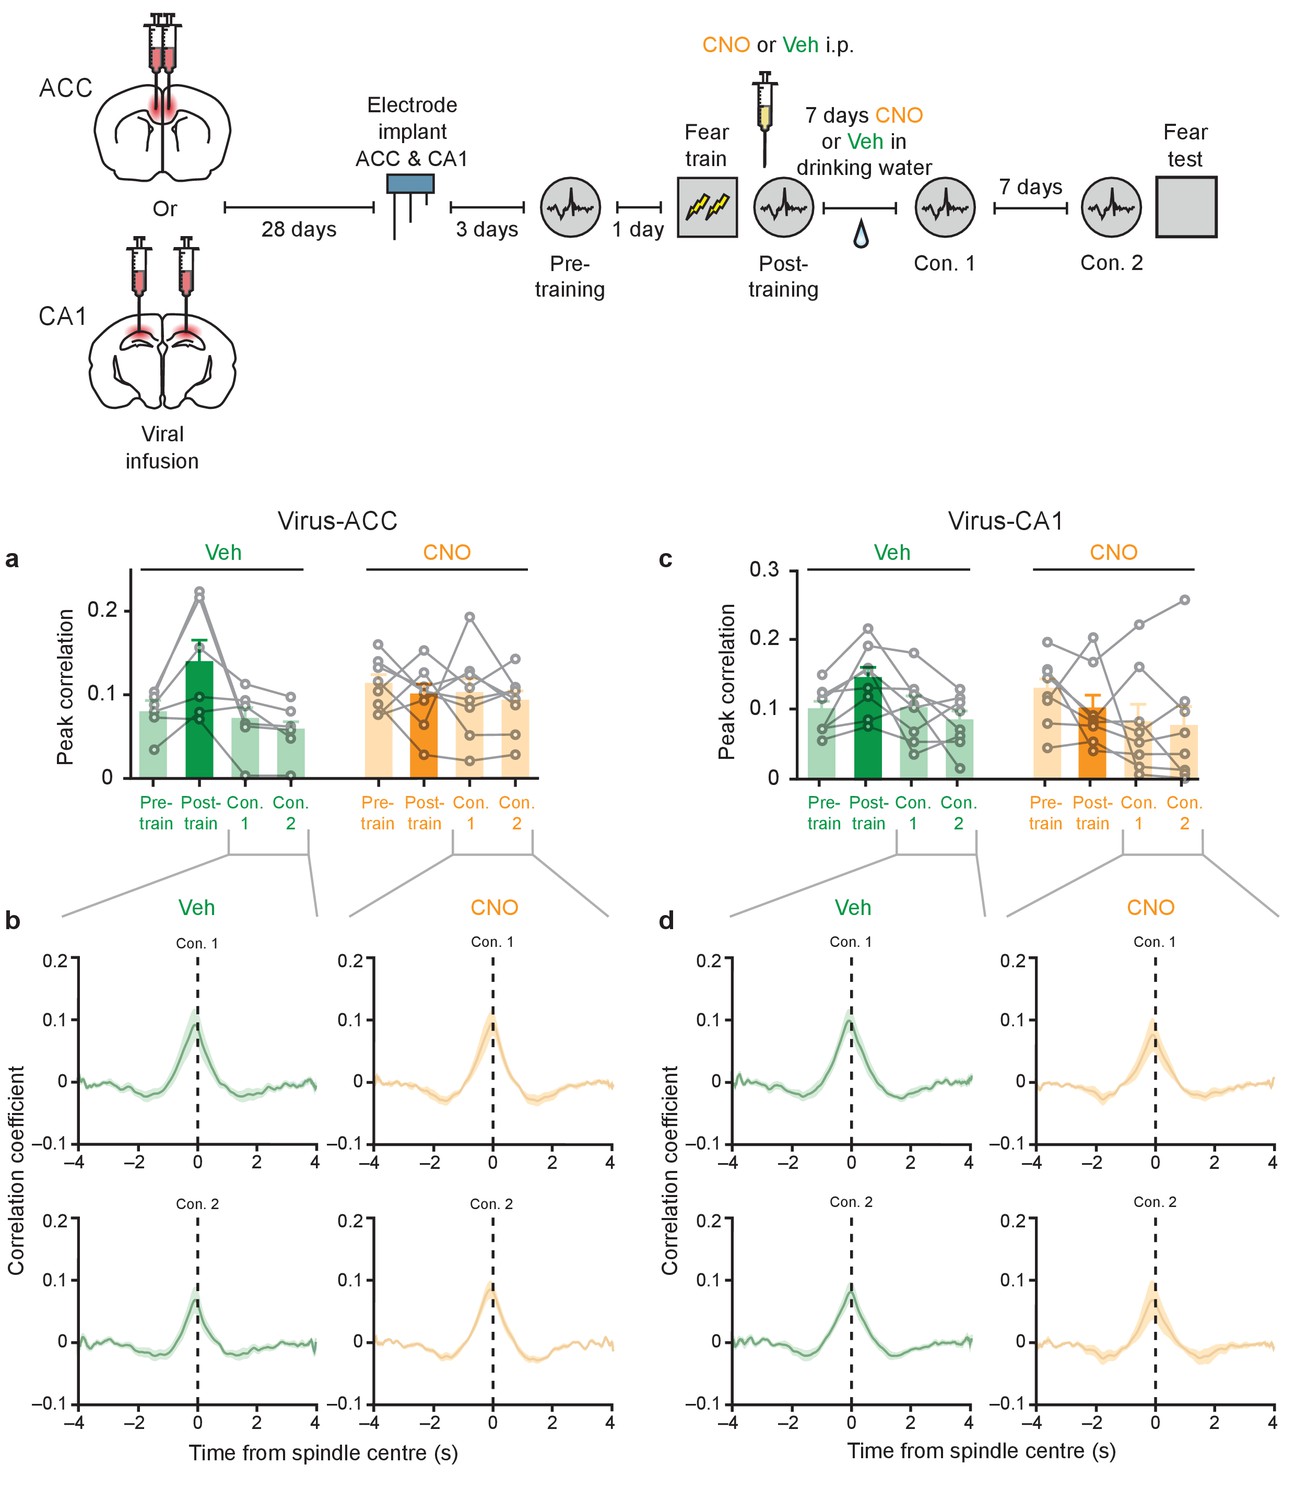
The learning-induced increase in ripple-spindle coupling is transient.
Learning-induced increases in ripple-spindle coupling was only observed during immediate post-training recording session, but not at more remote time points (Con. 1, Con. 2; 7 and 14 d post-training, respectively), in mice micro-infused with virus in (a–b) ACC (Veh n = 6, one-way repeated measures ANOVA for conditioning sessions F1.49,7.44 = 6.41, p=0.029; post hoc Bonferroni’s test, Veh pre-training versus Veh Con. 1 P>0.99, Veh pre-training versus Veh Con. 2 P=0.57; CNO n = 8, one-way repeated measures ANOVA for conditioning sessions F2.05,14.37 = 0.58, p=0.58), or (c–d) CA1 (Veh n = 8, one-way repeated measures ANOVA for conditioning sessions F2.55,17.86 = 5.07, p=0.013; post hoc Bonferroni’s test, Veh pre-training versus Veh Con. 1 P>0.99, Veh pre-training versus Veh Con. 2 P>0.99; CNO n = 8, Friedman test p=0.14). Peak correlation values are plotted in a and c, with corresponding cross-correlation time graphs of Con. one and Con.2 sessions plotted in b and d. Data are mean ±s.e.m., or individual mouse. (**p<0.01).
Figure 4 with 2 supplements
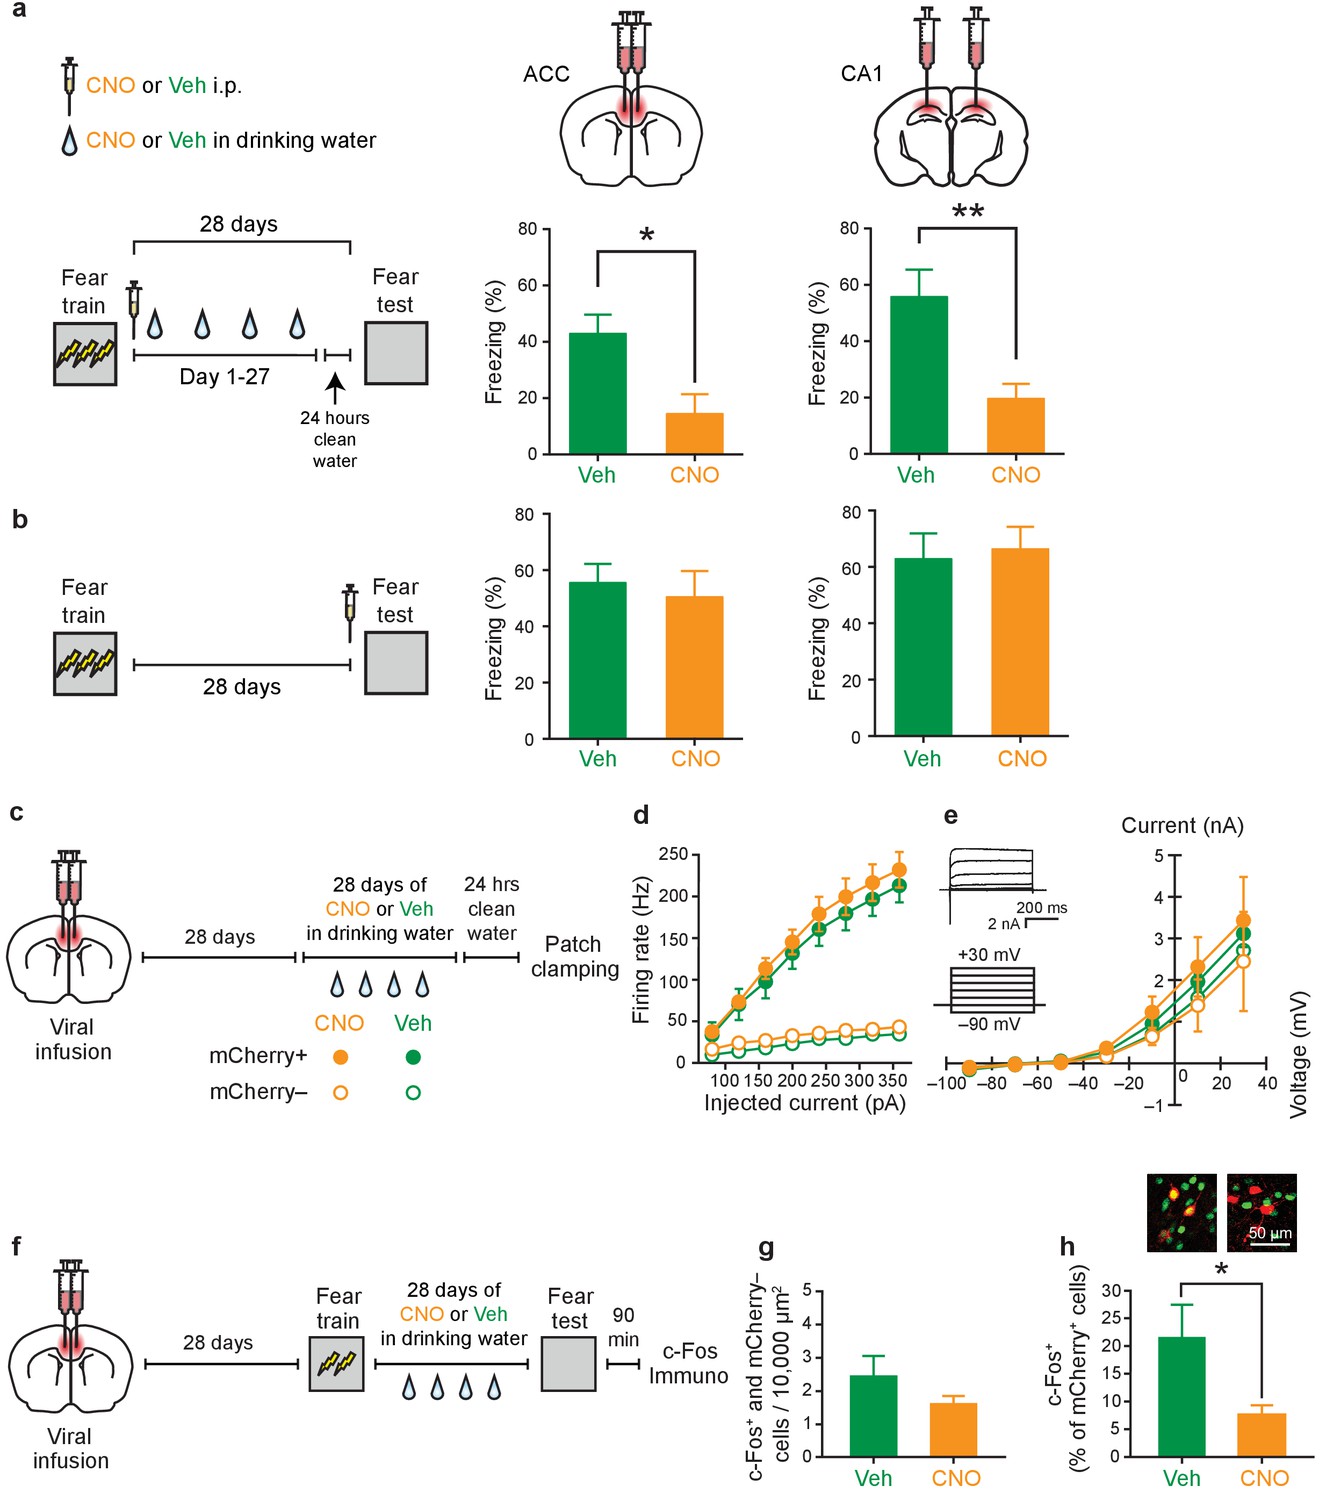
Inhibition of PV+cell in ACC or CA1 during the retention delay prevents fear memory consolidation.
(a) Decreased freezing during fear memory test (28 d following training) in mice micro-infused with hM4Di-mCherry virus in ACC or CA1 and treated with CNO versus Veh post-training (i.p. systemic injection post-training followed by drug delivery (CNO or Veh) in water for days 1–27 and 1 d clean-water washout) (ACC: Veh n = 6, CNO n = 8, Mann-Whitney test p=0.028; CA1: Veh n = 7, CNO n = 9, t-test t14 = 3.42, p=0.004). (b) No disruption in freezing during fear memory test (28 d following training) in mice micro-infused with hM4Di-mCherry virus in ACC or CA1 and treated with CNO versus Veh (i.p. injection) prior to retrieval test on the 28th day (ACC: Veh n = 9, CNO n = 8, t-test t15 = 0.44, p=0.66; CA1: Veh n = 6, CNO n = 5, t-test t9 = 0.28, p=0.78). (c) Design for ex vivo experiments to assess effects of chronic CNO or Veh treatment on neuronal excitability in hM4Di-mCherry-infected and non-infected cells. (d) No effect of chronic CNO on firing rates (mCherry+ Veh n=14, CNO n = 20, mCherry- Veh n = 14, CNO n = 15, mixed-model permutation test, 1000 permutations, CNO versus Veh: p=0.77), or (e) potassium currents (mCherry+ Veh n=14, CNO n = 20, mCherry- Veh n = 14, CNO n = 15, voltage clamp, mixed-model permutation test, 1000 permutations, CNO versus Veh: p=0.88) in mCherry+ or mCherry- cells. (f) Design for in vivo experiments to assess the effect of chronic CNO treatment on retrieval-induced neuronal activation. (g) Levels of retrieval-induced c-Fos expression in ACC mCherry- cells (number of co-localized mCherry- and c-Fos+/10,000 μm2) were not different between groups receiving chronic CNO versus Veh. (Veh n = 4, CNO n = 5, t-test t7 = 1.37, p=0.21), but (h) CNO reduced activation of hM4Di-mCherry+ neurons (number of co-localized mCherry+ and c-Fos+ cells/total number of mCherry+ cells x 100), as expected (Veh n = 4, CNO n = 5, t-test t7 = 2.54, p=0.039). Data are mean ±s.e.m. (*p<0.05, **p<0.01).
Figure 4—figure supplement 1
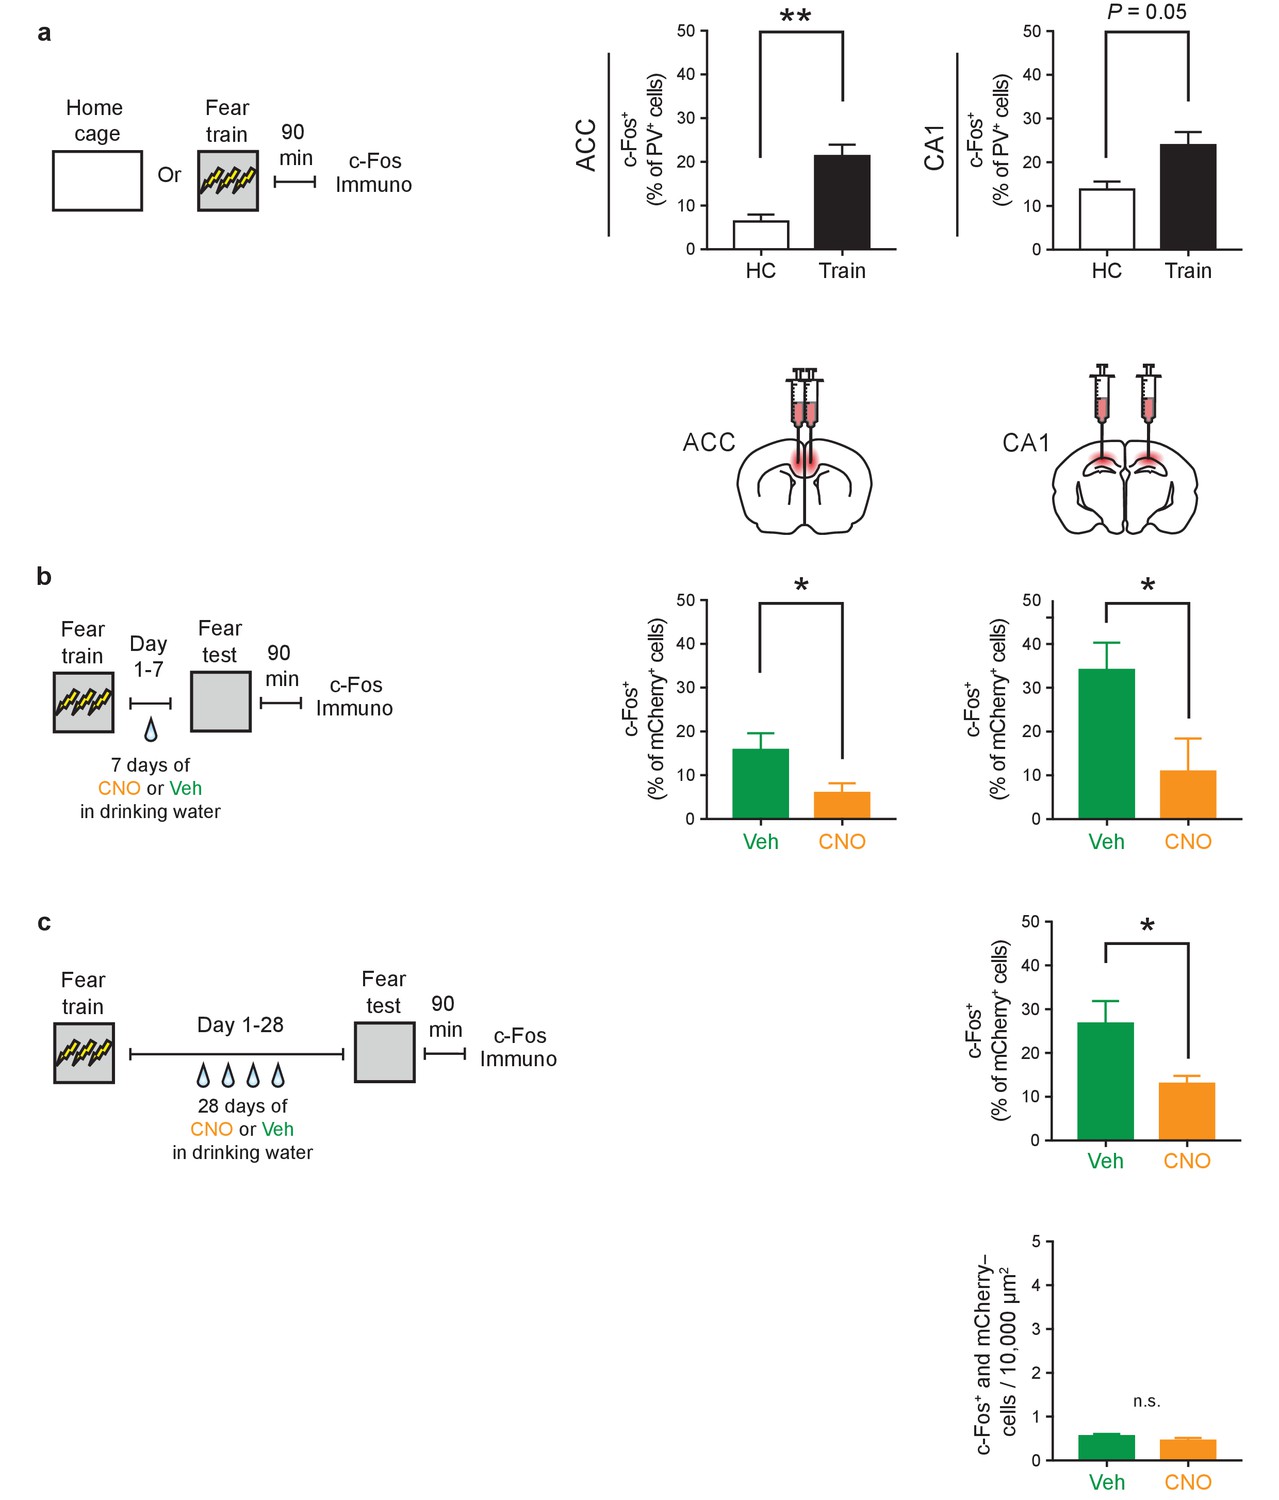
Fear learning strongly activates PV+cells in both ACC and CA1; 7- or 28 day treatment of CNO reduces their activity.
(a) Fear training activates PV+ cells in both ACC and CA1 (number of co-localized c-Fos+ and PV+ cells/total number of PV+ cells x 100) (ACC: Home Cage [HC] n = 3, Train n = 5, t-test t6 = 4.05, p=0.007; CA1: HC n = 3, Train n = 5, t-test t6 = 2.40, p=0.05). (b) Reduced level of retrieval-induced c-Fos expression in ACC and CA1 mCherry+ cells in mice infused with AAV-DIO-hM4Di in ACC or CA1, respectively, and treated with CNO versus Veh (i.p. systemic injection post-training followed by drug delivery (CNO or Veh) in water for days 1–7, and tested on day 7) (number of co-localized mCherry+ and c-Fos+ cells/total number of mCherry+ cells x 100; ACC: Veh n = 5, CNO n = 6, t-test t9 = 2.31, p=0.047; CA1: Veh n = 5, CNO n = 4, t-test t7 = 2.39, p=0.048). (c) Similar to observed in ACC (Figure 4g–h), CA1 shows reduced level of retrieval-induced c-Fos expression in mCherry+ cells in mice infused with AAV-DIO-hM4Di in CA1 and treated with CNO versus Veh (i.p. systemic injection post-training followed by drug delivery (CNO or Veh) in water for days 1–28, and tested on day 28) (number of co-localized mCherry+ and c-Fos+ cells/total number of mCherry+ cells x 100; Veh n = 4, CNO n = 6, t-test t8 = 2.95, p=0.018), but no change in levels of activation in mCherry- cells (number of co-localized mCherry- and c-Fos+ cells/10,000 μm2; Veh n = 4, CNO n = 6, Mann-Whitney test, p=0.17). Data are mean ±s.e.m. (*p<0.05, **p<0.01, n.s.: not significant).
Figure 4—figure supplement 2

Chronic inhibition of PV+cells does not alter anxiety level or locomotion, or alter subsequent learning or retrieval, or affect post-shock sensitivity to pain.
During an open field test, mice infused with virus in ACC and treated with Veh or CNO did not show differences in (a) time spent in different zones (outer, Zone 1; middle, Zone 2; or inner, Zone 3; Veh n = 8, CNO n = 10; Friedman test zones p<0.0001; Mann-Whitney test, zone 1 Veh versus CNO p=0.083, zone 2 Veh versus CNO p=0.17, zone 2 Veh versus CNO p=0.083), or (b) total distance (cm) traveled (t-test t16 = 0.54, p=0.60). (c) No disruption in freezing during fear memory test (1 d following training) in mice micro-infused with hM4Di-mCherry virus in ACC and treated with CNO versus Veh prior to fear conditioning (drug delivery (CNO or Veh) in water for 27 days and 1 d clean-water washout) (Veh n = 10, CNO n = 4, t-test t12 = 0.15, p=0.88). (d) To assess the effect of CNO treatment on tone fear memory, mice infused with the AAV-DIO-hM4Di virus in ACC were trained in tone fear conditioning. Increased freezing to tone during test on day 28 in both CNO- or Veh-treated groups (i.p. systemic injection post-training followed by drug delivery (CNO or Veh) in water for days 1–7) (30 s pre-tone-onset freezing versus 30 s post-tone-onset freezing; DMSO n = 8, CNO n = 7; two-way repeated measures ANOVA pre-tone-onset versus post-tone-onset x Veh versus CNO; pre-tone-onset versus post-tone-onset F1,13 = 16.8, p=0.001; Veh versus CNO F1,13 = 0.38, p=0.55; interaction F1,13 = 0.03, p=0.86). Data are mean ±s.e.m.
Figure 5 with 1 supplement
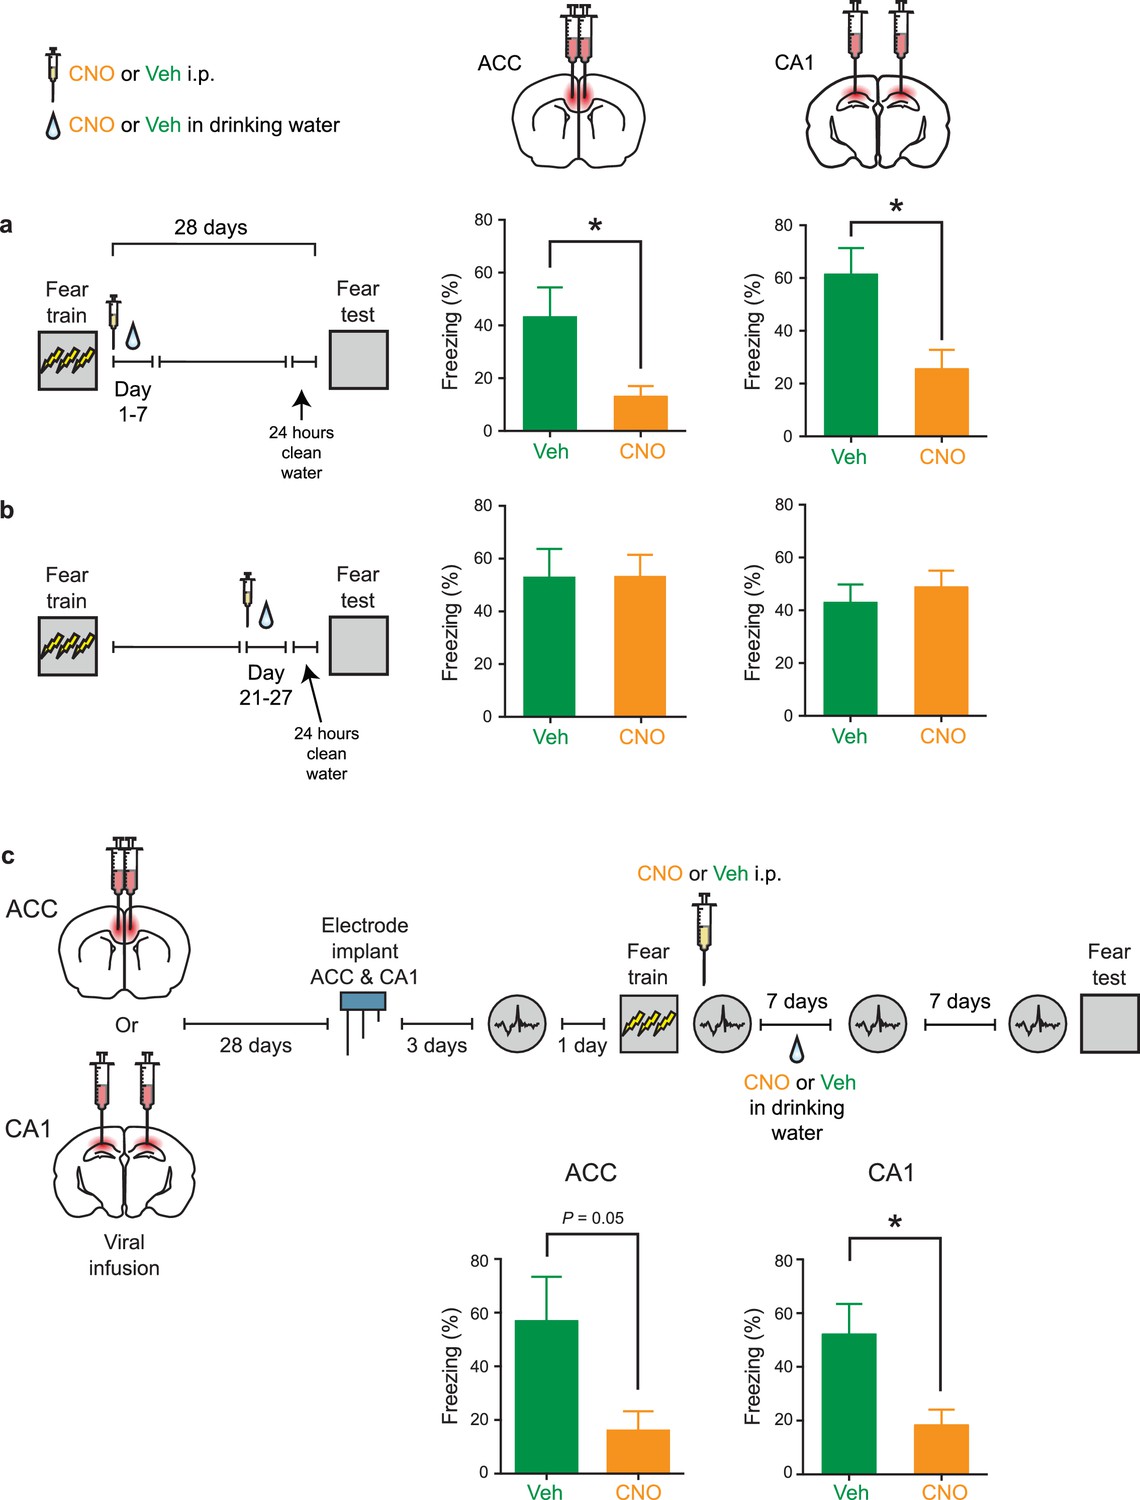
Inhibition of PV+cell in ACC or CA1 during first, but not fourth, post-training week prevents fear memory consolidation.
(a) Decreased freezing during fear memory test (28 d following training) in mice micro-infused with hM4Di-mCherry virus in ACC or CA1 and treated with CNO versus Veh post-training (i.p. systemic injection post-training followed by drug delivery (CNO or Veh) in water for days 1–7) (ACC: Veh n = 7, CNO n = 6, Welch’s t-test t7.48 = 2.51, p=0.038; CA1: Veh n = 9, CNO n = 9, t-test t16 = 2.87, p=0.011). (b) No disruption in freezing during fear memory test (28 d following training) in mice micro-infused with hM4Di-mCherry virus in ACC or CA1 and treated with CNO versus Veh post-training (drug delivery (CNO or Veh) in water for days 21–27 and 1 d clean-water washout) (ACC: Veh n = 7, CNO n = 7, Mann-Whitney test p=0.90; CA1: Veh n = 8, CNO n = 9, t-test t15 = 0.62, p=0.55). (c) Decreased freezing during fear memory test (14 d following training) in mice micro-infused with hM4Di-mCherry virus in ACC or CA1, implanted with LFP recording electrode and treated with CNO versus Veh post-training (i.p. systemic injection post-training followed by drug delivery (CNO or Veh) in water for days 1–7) (ACC: Veh n = 8, CNO n = 8, Mann-Whitney test p=0.05; CA1: Veh n = 8, CNO n = 8, t-test t14 = 2.64, p=0.020). Data are mean ±s.e.m. (*p<0.05).
Figure 5—figure supplement 1
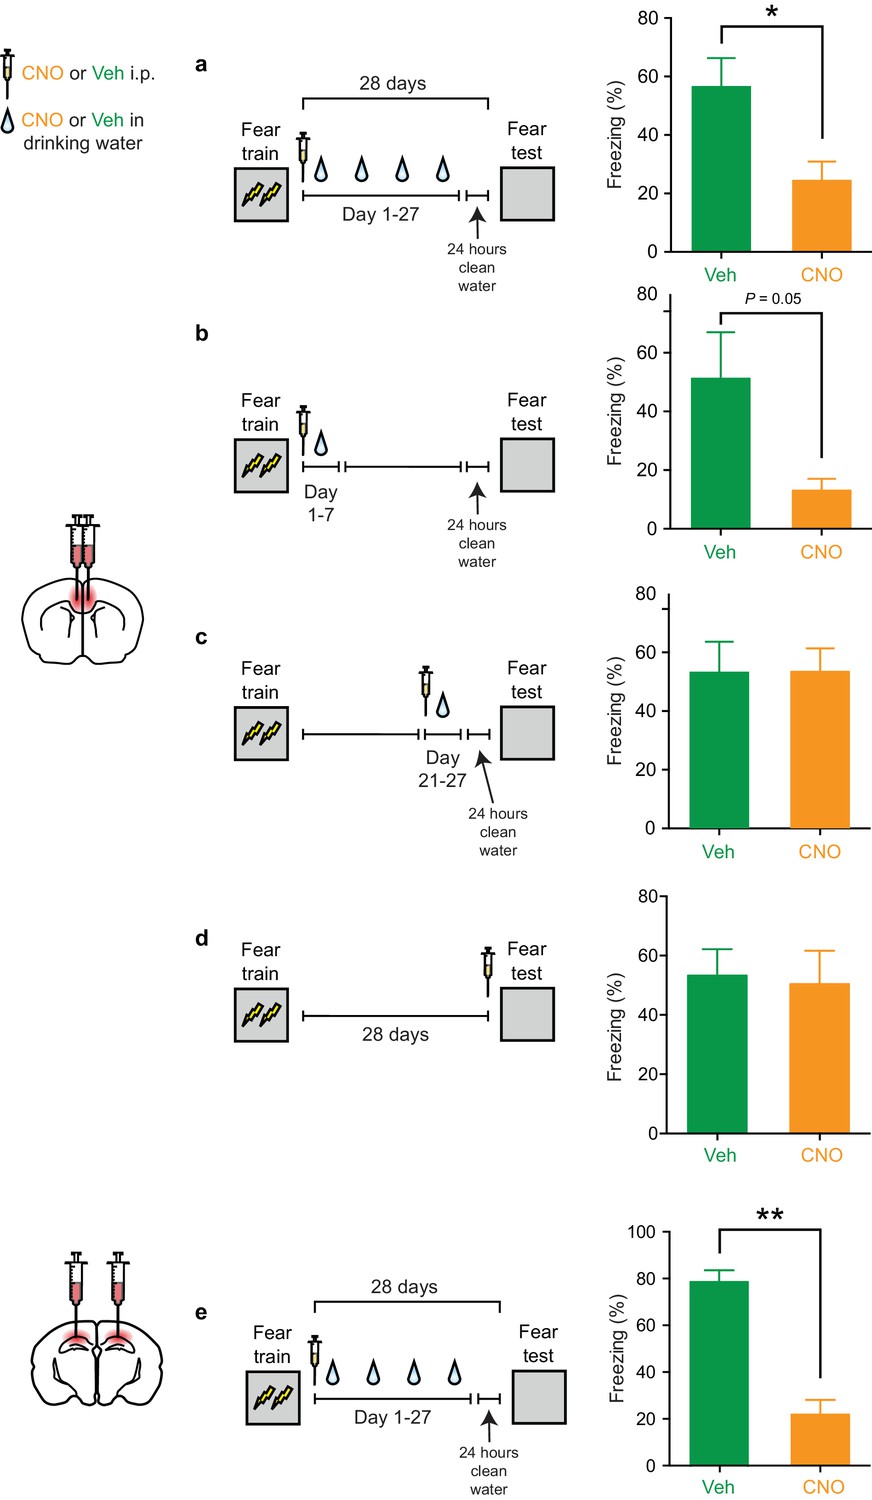
Inhibition of PV+cells in the ACC or CA1 during retention delay also impairs memory consolidation using a weaker 2-shock fear conditioning protocol.
(a) Decreased freezing during fear memory test (28 d following training) in mice micro-infused with hM4Di-mCherry virus in ACC and treated with CNO versus Veh post-training (i.p. systemic injection post-training followed by drug delivery (CNO or Veh) in water for days 1–27 and 1 d clean-water washout) (Veh n = 9, CNO n = 12, t-test t19 = 2.788, p=0.012). (b) Decreased freezing during fear memory test (28 d following training) in mice micro-infused with hM4Di-mCherry virus in ACC and treated with CNO versus Veh post-training (i.p. systemic injection post-training followed by drug delivery (CNO or Veh) in water for days 1–7) (Veh n = 7, CNO n = 8, Welch’s t-test t7.32 = 2.32, p=0.05). (c) No disruption in freezing during fear memory test (28 d following training) in mice micro-infused with hM4Di-mCherry virus in ACC and treated with CNO versus Veh post-training (drug delivery (CNO or Veh) in water for days 21–27 and 1 d clean-water washout) (Veh n = 5, CNO n = 7, t-test t10 = 0.32, p=0.76). (d) No disruption in freezing during fear memory test (28 d following training) in mice micro-infused with hM4Di-mCherry virus in ACC and treated with CNO versus Veh (i.p. injection) prior to retrieval test on the 28th day (Veh n = 6, CNO n = 6, t-test t10 = 0.20, p=0.85). (e) Decreased freezing during fear memory test (28 d following training) in mice micro-infused with hM4Di-mCherry virus in CA1 and treated with CNO versus Veh post-training (i.p. systemic injection post-training followed by drug delivery (CNO or Veh) in water for days 1–27 and 1 d clean-water washout) (Veh n = 4, CNO n = 3, t-test t5 = 6.79, p=0.001). Similar results are shown in Figure 3 of main paper, obtained using stronger training protocol (3-shock). Data are mean ±s.e.m. (*p<0.05, **p<0.01).
Figure 6
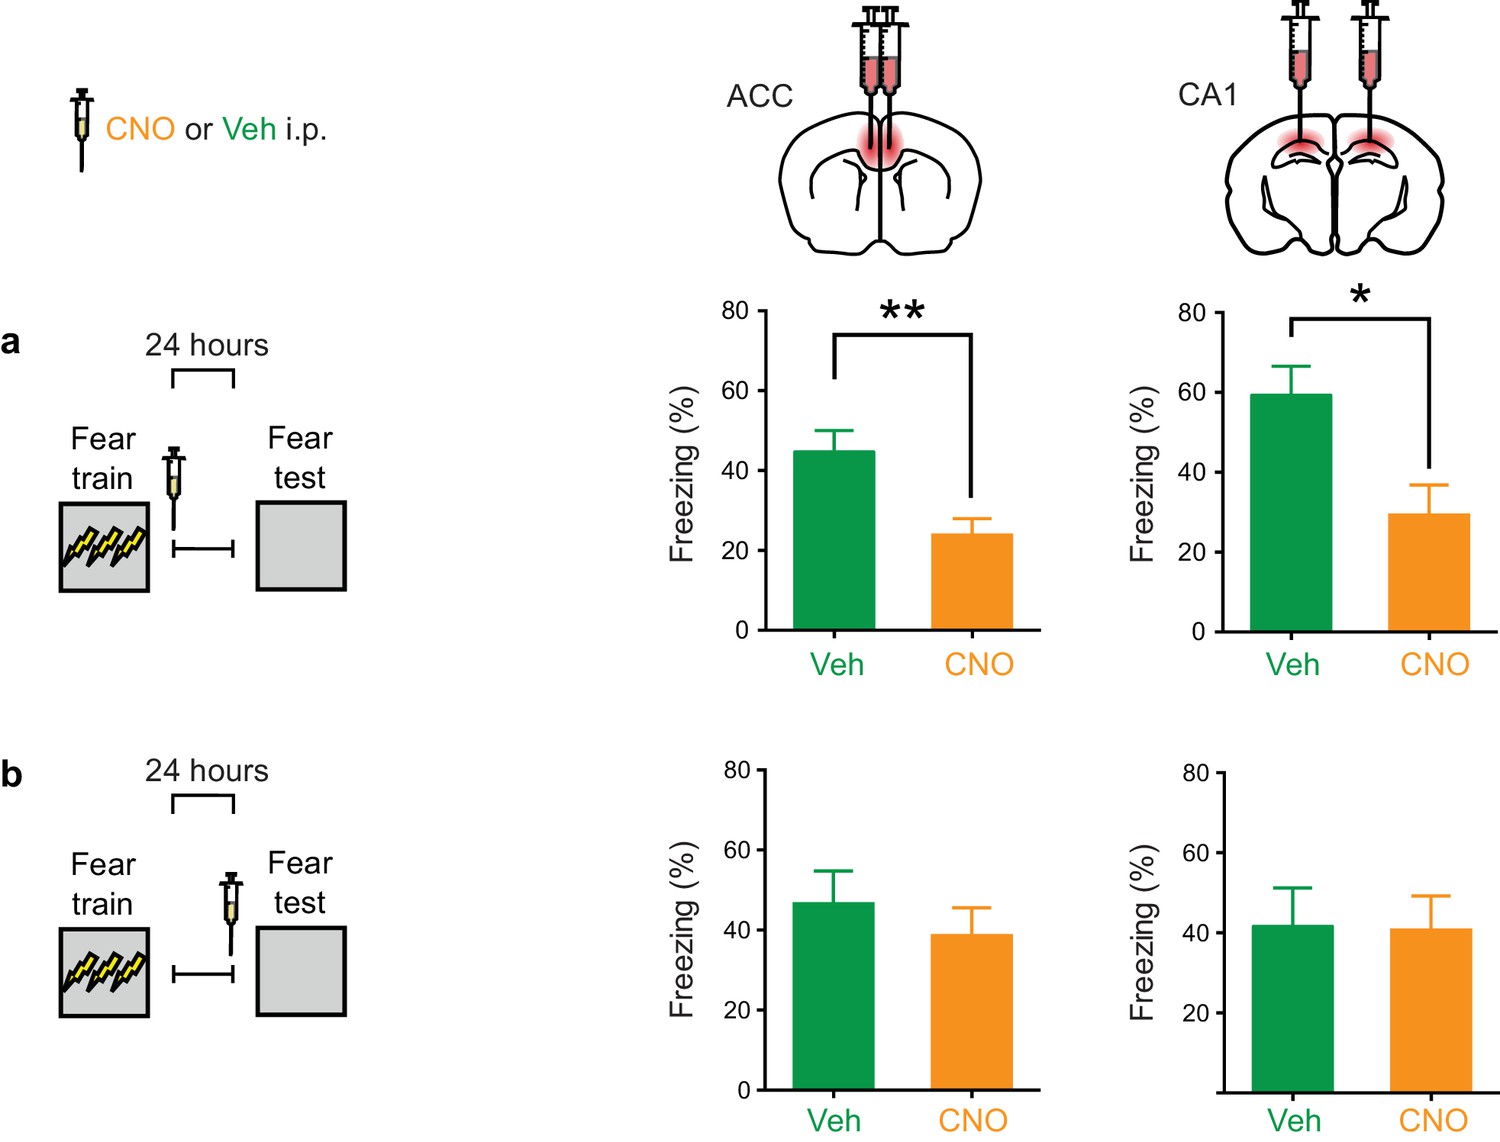
Inhibition of PV+cell in ACC or CA1 immediately post-training, but not during retrieval, impairs fear memory recall at 1 day.
(a) Decreased freezing during fear memory test (1 d following training) in mice micro-infused with hM4Di-mCherry virus in ACC or CA1 and treated with CNO versus Veh post-training (i.p. systemic injection post-training) (ACC: Veh n = 12, CNO n = 16, t-test t26 = 3.10, p=0.0046; CA1: Veh n = 7, CNO n = 10, t-test t15 = 2.75, p=0.015). (b) No disruption in freezing during fear memory test (1 d following training) in mice micro-infused with hM4Di-mCherry virus in ACC or CA1 and treated with CNO versus Veh (i.p. injection) prior to retrieval test on the 1 st day (ACC: Veh n = 7, CNO n = 12, t-test t17 = 0.71, p=0.48; CA1: Veh n = 6, CNO n = 6, t-test t10 = 0.74, p=0.94). Data are mean ± s.e.m. (*p<0.05, **p<0.01).
Additional files
-
Transparent reporting form
- https://doi.org/10.7554/eLife.27868.018
Download links
A two-part list of links to download the article, or parts of the article, in various formats.
Downloads (link to download the article as PDF)
Open citations (links to open the citations from this article in various online reference manager services)
Cite this article (links to download the citations from this article in formats compatible with various reference manager tools)
Parvalbumin-positive interneurons mediate neocortical-hippocampal interactions that are necessary for memory consolidation
eLife 6:e27868.
https://doi.org/10.7554/eLife.27868


