Figures
Figure 1 with 1 supplement
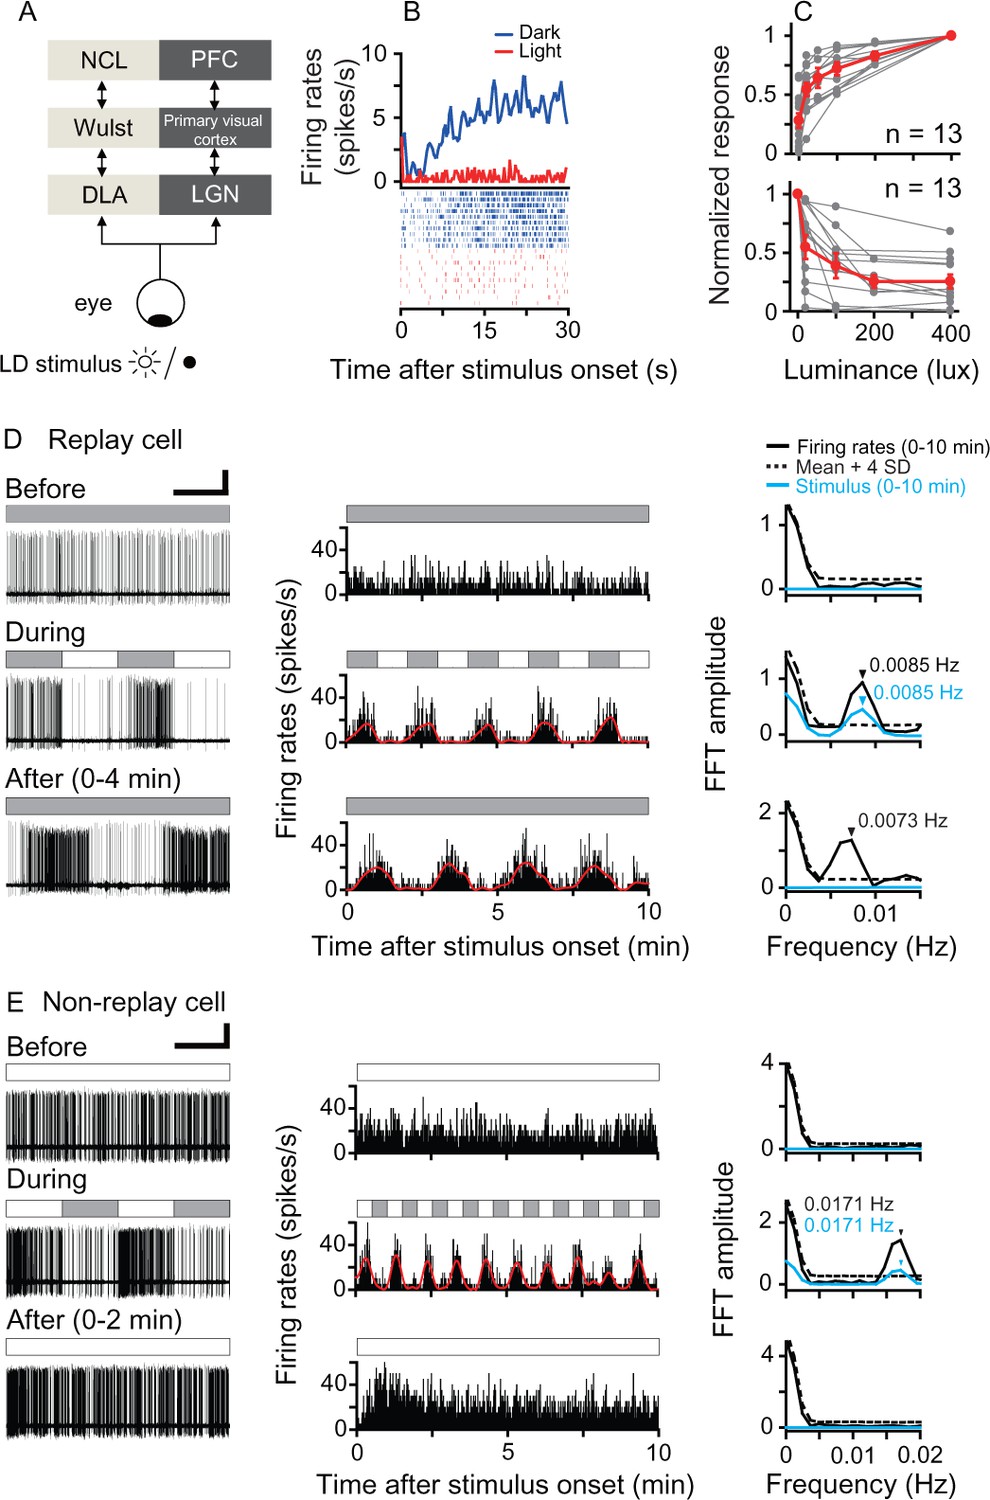
Responses of luminance cells in the pigeon DLA to periodic light/dark (LD) stimuli.
(A) The avian nucleus dorsolateralis anterior thalami (DLA) receives direct retinal inputs and projects to the pallial Wulst, which further projects to the nidopallium caudolaterale (NCL). The DLA, Wulst, and NCL in birds (light gray) are comparable to the lateral geniculate nucleus (LGN), primary visual cortex, and prefrontal cortex (PFC) in mammals (dark gray), respectively. (B) Histogram (top, bin = 0.5 s) and raster (bottom, 10 repeats) showing the response of a light-suppressed cell to the LD stimulus (light: 200 lux; dark: 0 lux). (C) Normalized responses of light-activated cells (top) increased, whereas those of light-suppressed cells (bottom) decreased when the luminance level was raised in steps. The responses of each cell to each luminance level were averaged across 5–10 repeats. The luminance responses of each cell were normalized by the cell's maximal response to all tested luminance levels (gray symbols). Mean values (± SEM) across all cells are presented by red symbols. (D, E) Original recording traces (left column), response histograms (middle column, bin = 0.2 s), and corresponding Fast Fourier Transformation (FFT) analyses (right column) before, during, and after LD stimulation were plotted for a typical DLA replay cell (D) and a non-replay cell (E). Filled and empty blocks in the horizontal bars indicate dark (0 lux) and light (200 lux) photic conditions. For a clear illustration of firing pattern changes, the response histogram of each cell was filtered by a zero-phase, low-pass Butterworth filter. The filtered histogram is marked with a red line. As shown in the right column, the oscillation frequency of the response histogram of the recorded cell (black line) was significant when its FFT amplitude was higher than the mean +4 SDs of the control (dotted line) estimated by 1000 bootstrap re-sampling of the original response histogram. The oscillation frequency of the photic stimulus is marked with a blue line. Black and blue arrows indicate significant oscillation frequencies of the response histograms and photic stimulus, respectively. Scale bars: 60 s, 50 μV and 30 s, 50 μV in left columns of (D) and (E), respectively.
-
Figure 1—source data 1
Luminance responses of DLA cells to periodic photic stimuli.
- https://doi.org/10.7554/eLife.27995.005
Figure 1—figure supplement 1

Histological identification and distribution of recording sites marked with electrolytic lesions.
(A) Recorded cells were marked by electrolytic lesions and identified within the rostral DLA. These histological marks validated the stereotaxic coordinates of the DLA recording sites. Brain section shows a recording site marked with a lesion (arrow) in the DLA at A7.00. (B) Schematic drawings of brain sections show the distributions of recording sites (red cycles) in the DLA (A6.25 to 7.25, L2.80 to 3.80, H7.00 to 8.00) (Karten and Hodos, 1967). Abbreviations: FPL, fasciculus prosencephali lateralis; nRt, nucleus rotundus; TrO, tractus opticus. Scale bars: 0.50 mm in (A) and 0.50 mm in (B).
Figure 2
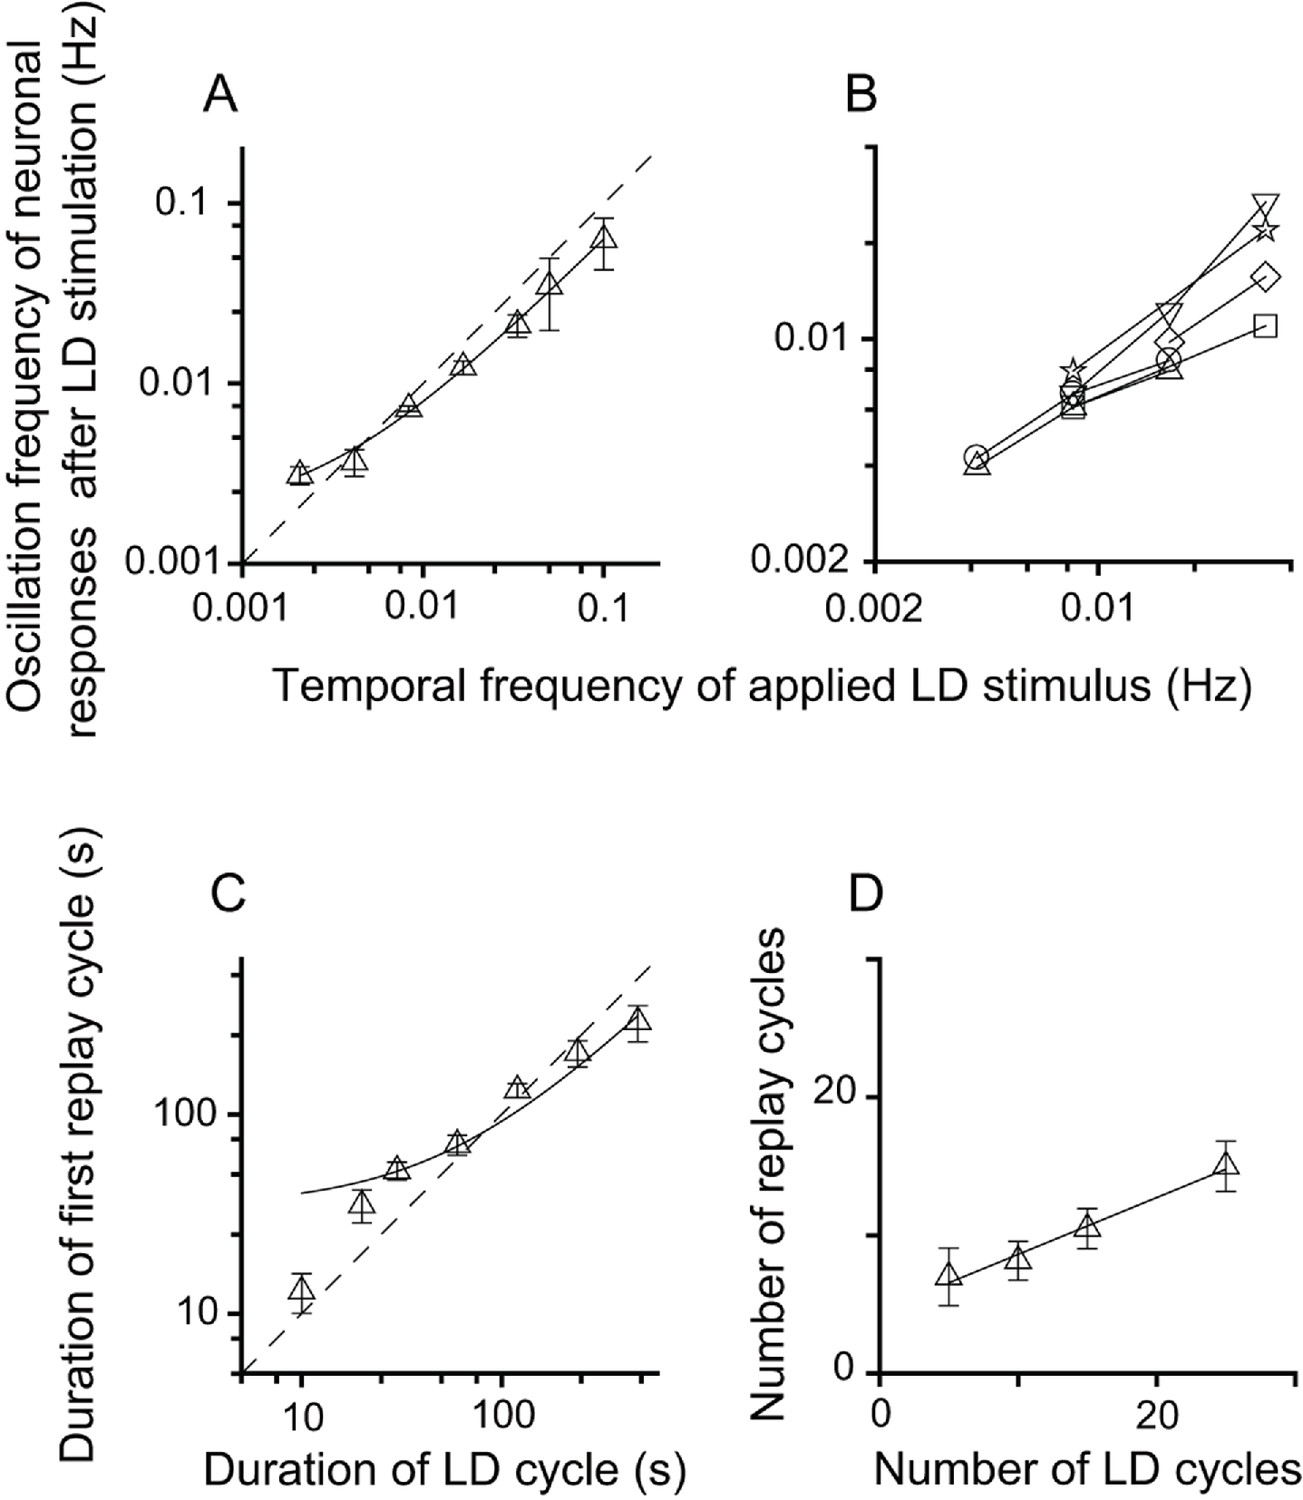
Relationship between parameters of the LD stimulus and neuronal responses of the replay cells after LD stimulation in the DLA.
(A) The oscillation frequencies of the responses of DLA replay cells (mean ± SEM, n = 54 cells) in the first 14 min after LD stimulation were linearly correlated with the temporal frequencies of LD stimuli (log-log scale). (B) Replay cells (n = 6 cells) could be re-entrained by periodic stimuli of different temporal frequencies (log-log scale). Each type of symbol represents a replay cell. (C) Duration of the first replay cycle of replay cells (mean ± SEM, n = 54 cells) was closely related to the duration of the LD cycle during LD stimulation (log-log scale). (D) The number of replay cycles (mean ± SEM, n = 21 cells) monotonically increased when the number of LD cycles (L/D: 30 s/30 s) increased. The dashed lines in (A) and (C) are the diagonal lines. The data in (A), (C), and (D) are fitted by a linear function.
-
Figure 2—source data 1
Oscillatory responses of DLA replay cells after periodic photic stimulation.
- https://doi.org/10.7554/eLife.27995.007
Figure 3
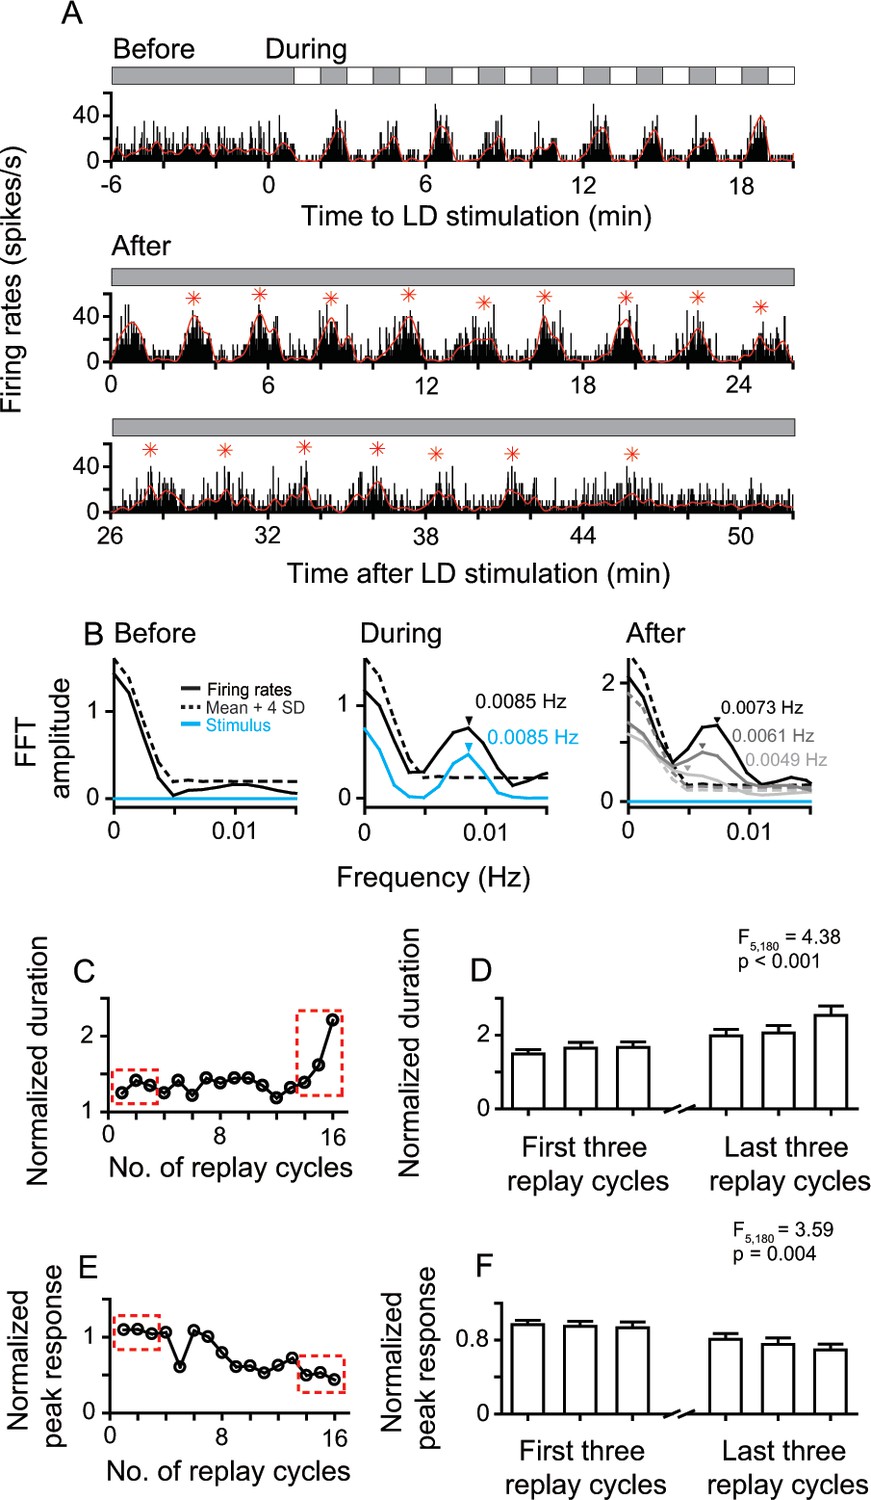
Sustained and attenuated oscillatory activities of replay cells after LD stimulation over time.
(A) A typical replay cell had steady non-oscillatory activity in constant darkness, and synchronized its firing rates with luminance changes during LD stimulation (L/D: 60 s/60 s, 10 cycles, bin = 0.2 s). After LD stimulation, the entrained oscillatory activity of this cell was maintained for ~48 min and then returned to non-oscillatory activity. Red asterisks indicate the peak response time of replay cycles. (B) FFT analyses of response histograms of this cell before, during, and after LD stimulation. In the right panel, black: 0–7 min; dark gray: 19–26 min: light gray 38–45 min after LD stimulation. (C, E) Duration (C) and peak response (E) of each replay cycle of this cell. (D, F) Mean durations (D) and peak responses (F) of 31 replay cells during the first and last three replay cycles. Error bars represent SEM. For other conventions, see Figure 1.
-
Figure 3—source data 1
Sustained and attenuated oscillatory responses of replay cells after periodic stimulation.
- https://doi.org/10.7554/eLife.27995.009
Figure 4 with 3 supplements
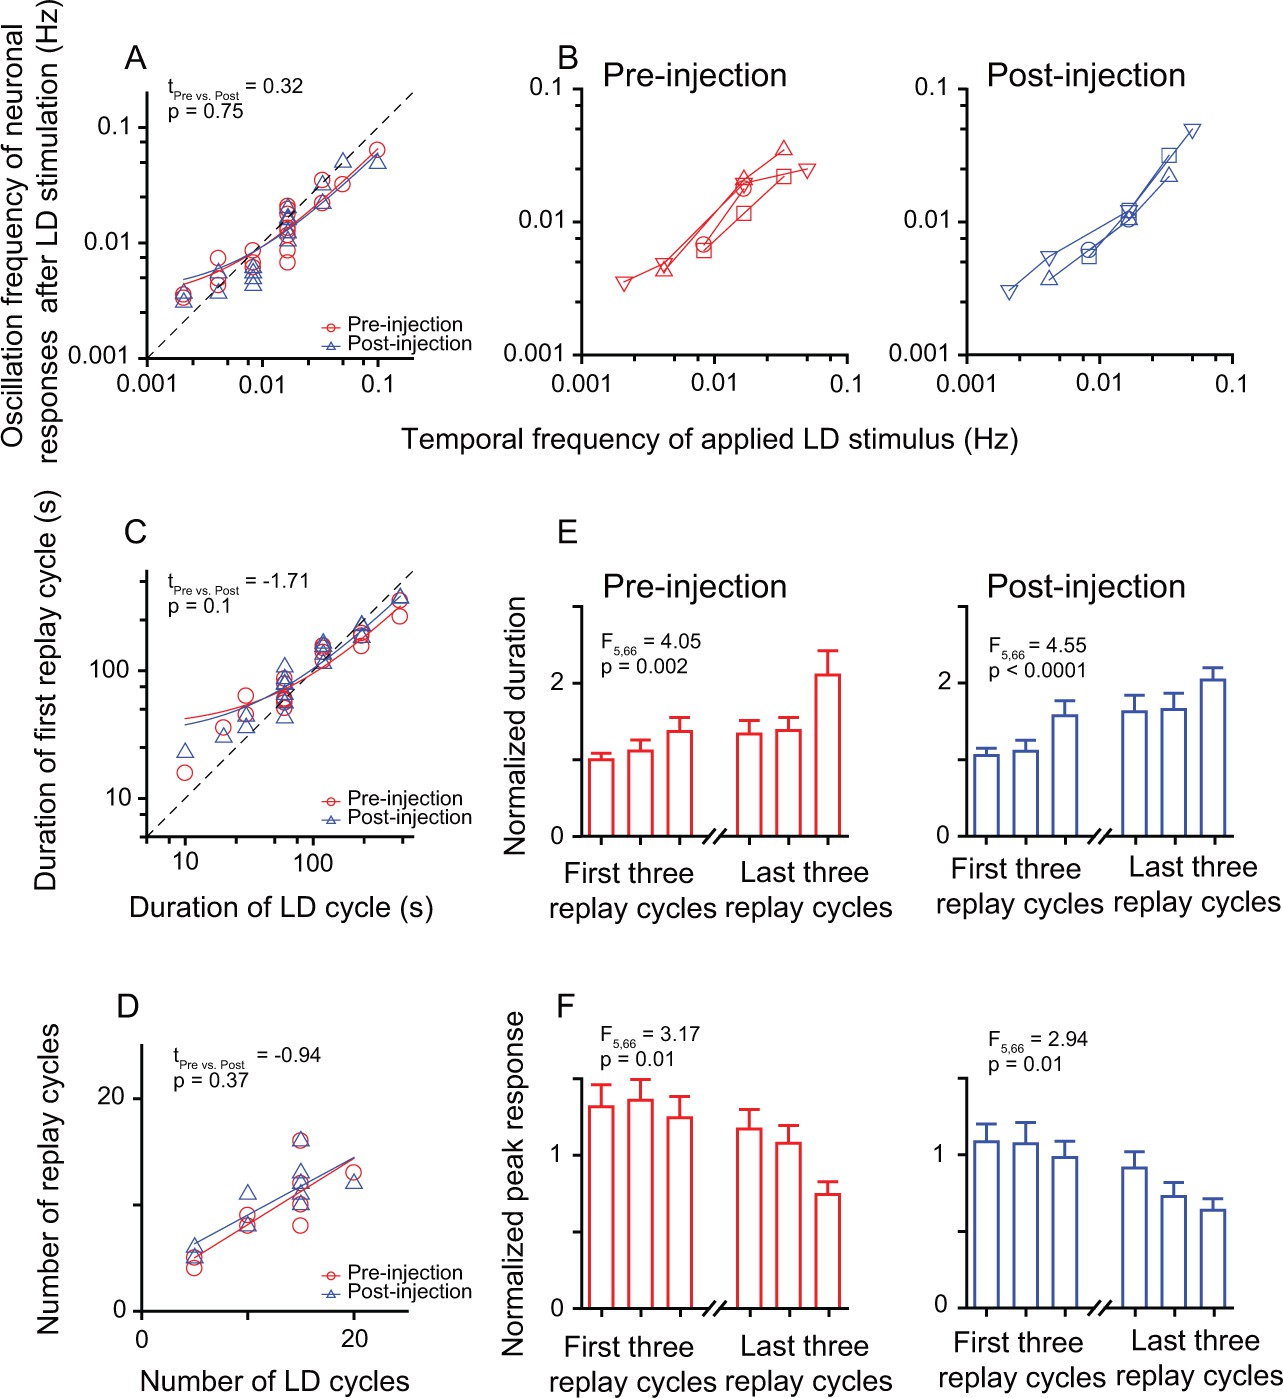
Inactivation of the Wulst had no effect on the entrained oscillatory responses of DLA replay cells after periodic stimulation.
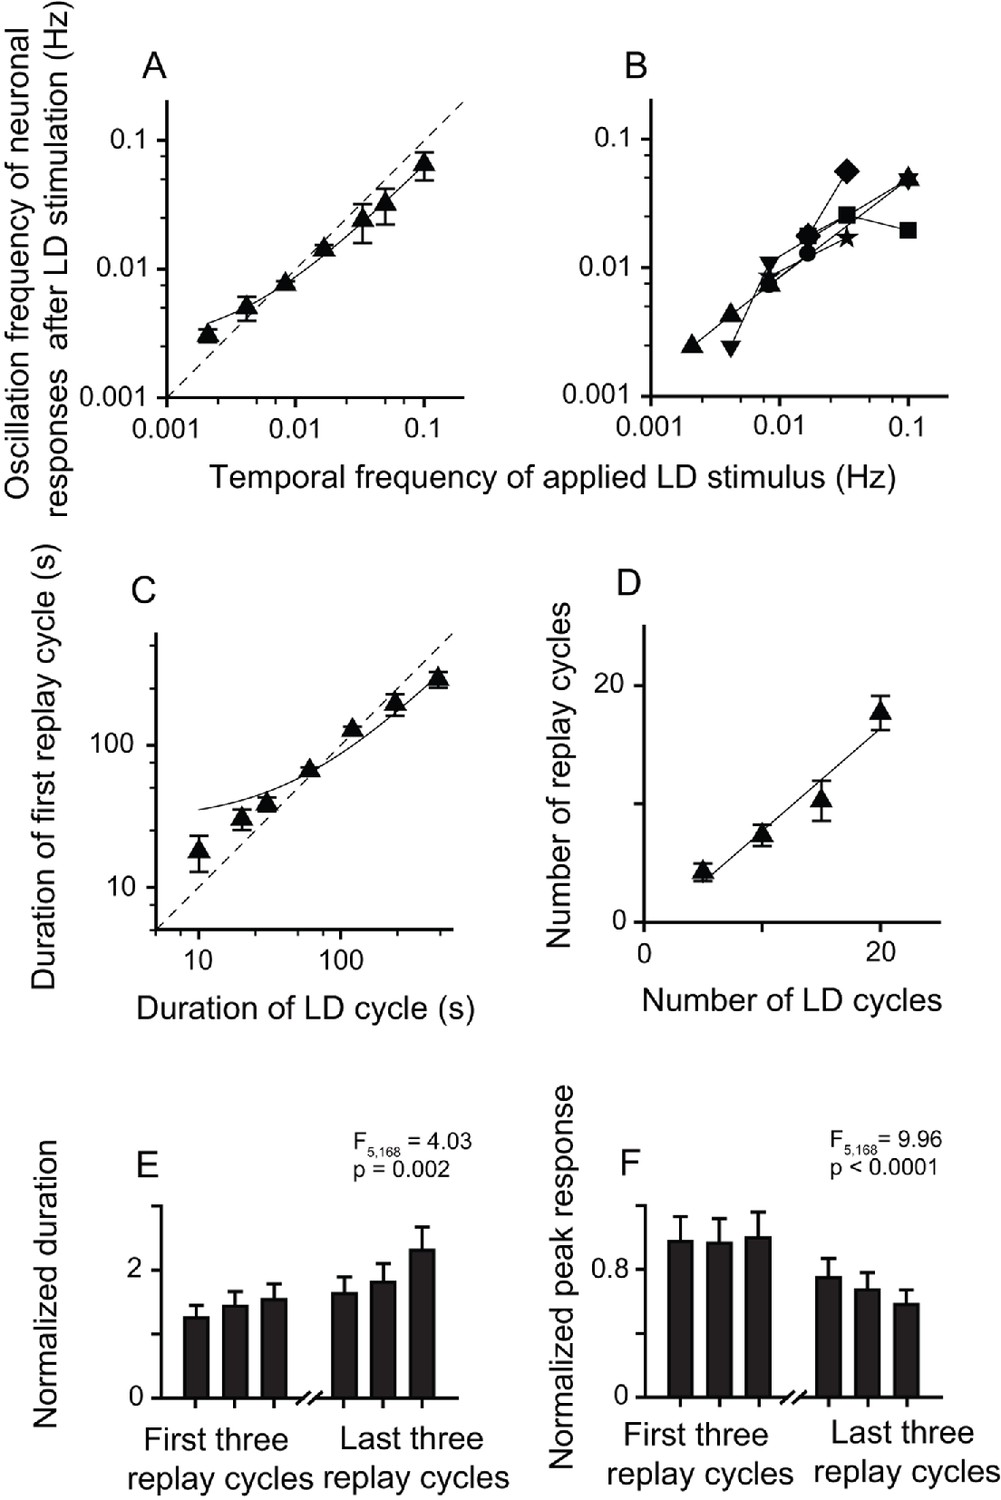
(A) Correlation between the oscillation frequencies of replay cells (n = 12 cells) in the first 14 min after LD stimulation and the temporal frequencies of LD stimuli (log-log scale). (B) A single replay cell could be re-entrained by periodic stimuli of different temporal frequencies (n = 4 cells, log-log scale) before (left) and after Wulst inactivation (right). Each type of symbol represents a replay cell. (C) Correlation between the duration of the first replay cycle of the replay cells and the duration of the LD cycle (log-log scale) (n = 12 cells). (D) Number of replay cycles monotonically increased when the number of LD cycles (L/D: 30 s/30 s) increased (n = 10 cells). (E, F) Mean durations (E) and mean peak responses (F) of the first and last three replay cycles of the replay cells (n = 12 cells) before (left) and after Wulst inactivation (right). The dashed lines in (A) and (C) are the diagonal lines. The data in (A), (C), and (D) are fitted by a linear function. Error bars in (E) and (F) represent SEM. For other conventions, see Figures 2 and 3.
-
Figure 4—source data 1
Post-stimulus responses of replay cells before and after Wulst inactivation in both hemispheres.
- https://doi.org/10.7554/eLife.27995.014
Figure 4—figure supplement 1
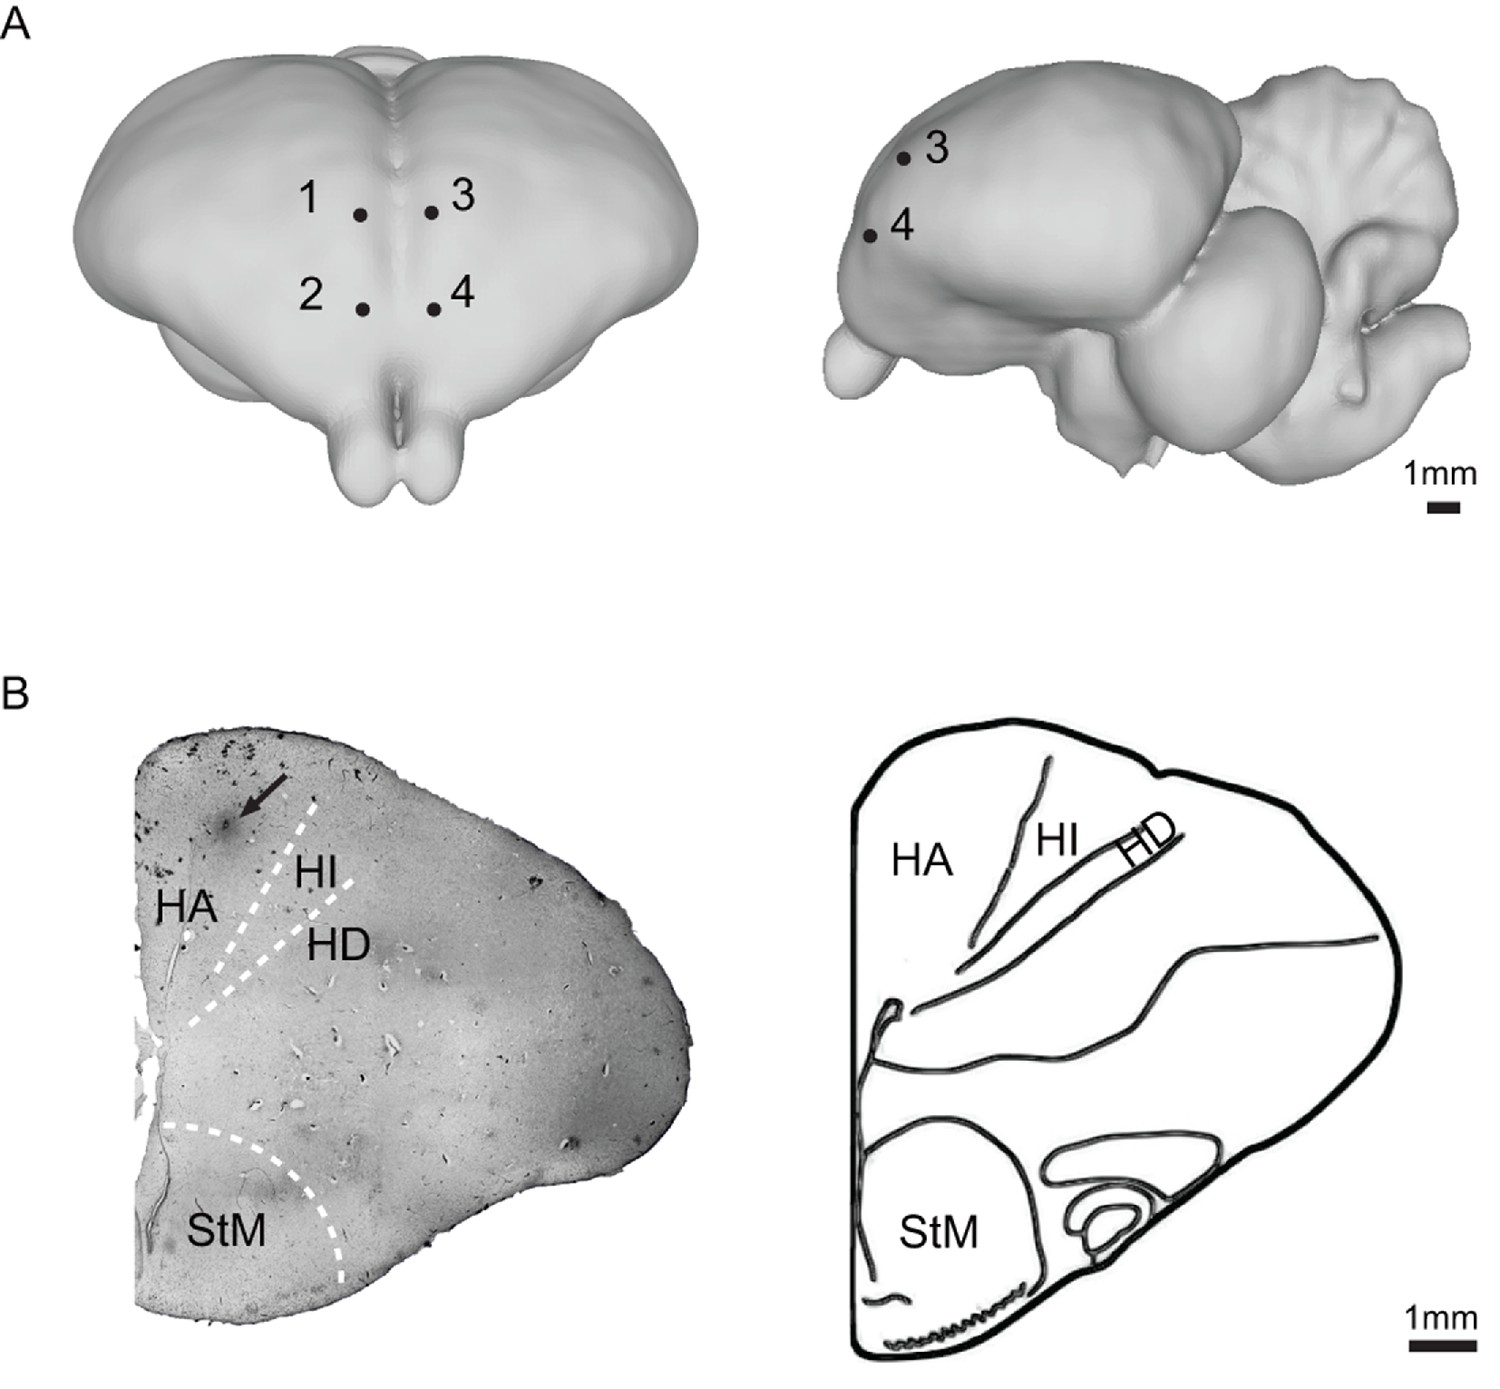
Location of injection sites of bilateral Wulst inactivation in the pigeon brain.
(A) Frontal (left) and lateral view (right) of injection sites in the Wulst in both hemispheres (Karten and Hodos, 1967). The avian Wulst in the pallium is a multi-laminate structure that contains the HA (hyperpallium apicale), HI (hyperpallium intercalatum), and HD (hyperpallium densocellulare). Projections of the DLA mainly terminate in the HD and HI of the Wulst (Karten et al., 1973; Bagnoli and Burkhalter, 1983). The HA is the major area of the Wulst that sends projections forward to other visual and somatosensory/motor areas and back to the DLA in the brain (Karten et al., 1973; Reiner and Karten, 1983). Injection of 1 µl of muscimol (2%) can completely inactivate neuronal activities in a 2 mm diameter around the cannula tip for ~3 hr, and can significantly attenuate the neuronal activities in a 4 mm diameter (Partsalis et al., 1995; Arikan et al., 2002). On the basis of these studies, the Wulst was inactivated by injection of 1 µl of muscimol (2%) at four different coordinates: (1: A10, L1.5, H1.5) and (2: A12, L1.5, H1.5) in the right hemisphere, and (3: A10, L1.5, H1.5) and (4: A12, L1.5, H1.5) in the left hemisphere. Muscimol and direct-blue have different spread extents in the brain. The locations of the muscimol injection sites were confirmed by injecting 0.2 µl of direct-blue 15 (2% direct-blue 15 in 0.5 M sodium acetate solution). (B) The location of one injection site (arrow) in the Wulst at A12.00 (left) and the corresponding schematic drawing of the brain section (right) are shown (Karten and Hodos, 1967). Abbreviations: StM, striatum mediale.
Figure 4—figure supplement 2
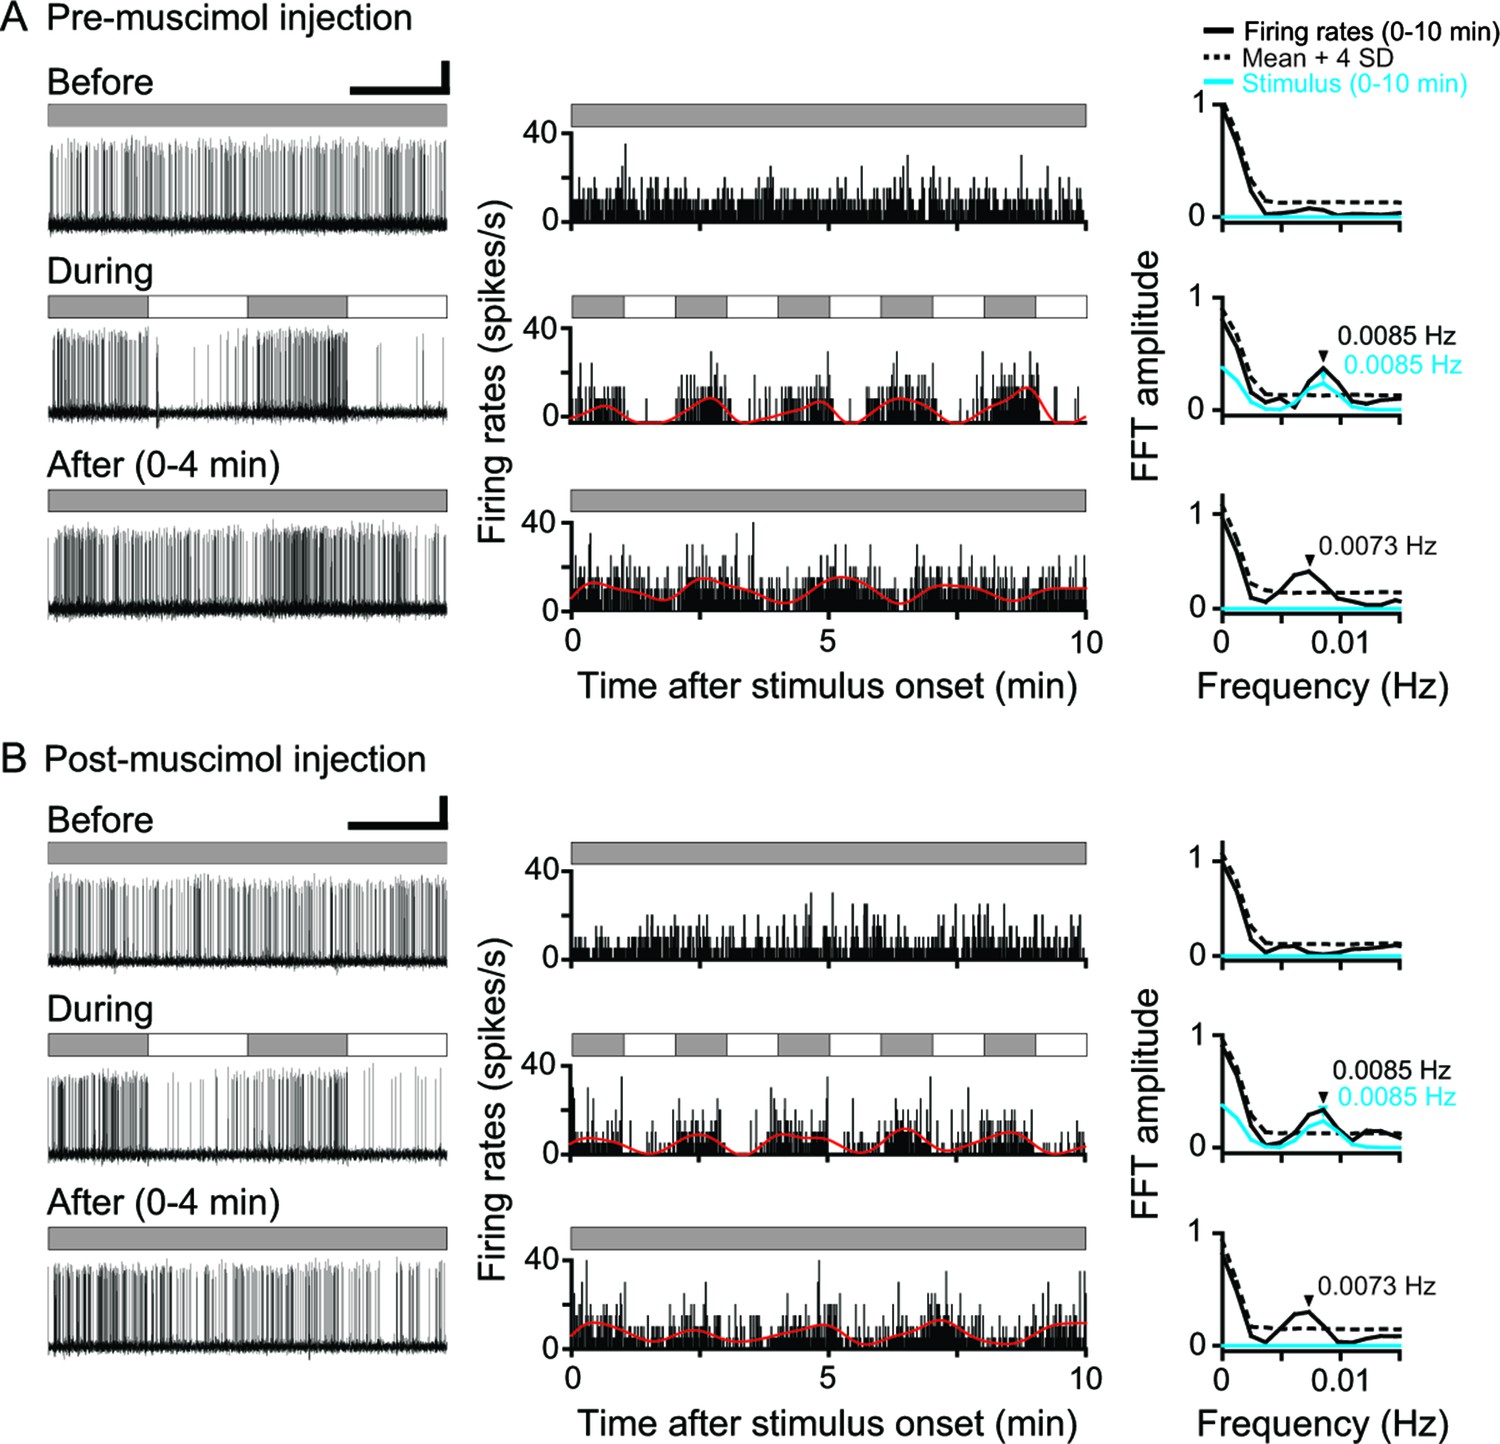
Neuronal responses of a single DLA replay cell before and after Wulst inactivation in both hemispheres.
(A, B) Original recording traces (left column), response histograms (middle column, bin = 0.2 s), and corresponding Fast Fourier Transformation (FFT) analyses (right column) before, during, and after LD stimulation are shown for a typical DLA replay cell pre- (A) and post-muscimol injection (B) in the Wulst in both hemispheres . In the right column, the black and blue arrows indicate the significant oscillation frequencies of the response histograms for the DLA cell and photic stimulus, respectively. Scale bars: 60 s, 50 μV and 60 s, 50 μV in left column of (A) and (B), respectively. For other conventions, see Figure 1.
Figure 4—figure supplement 3
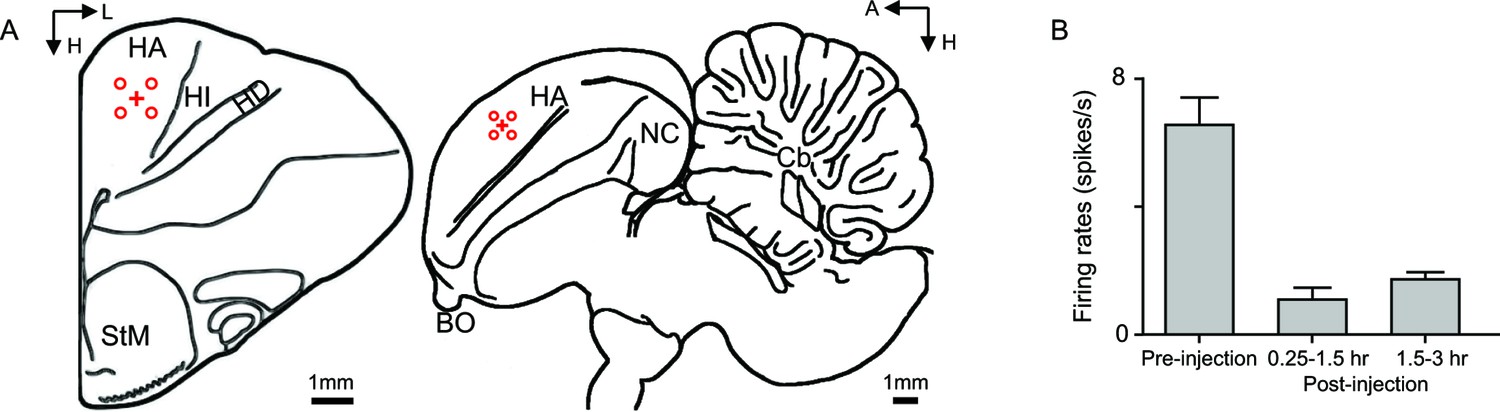
Inhibition of neuronal activities in the Wulst by muscimol.
Both GABAA and GABAB binding sites are abundant in the avian Wulst (Veenman et al., 1994). Muscimol (2%, 1 µl) effectively inhibited the neuronal activities in the Wulst. (A) Schematic representation of injection site (red cross) and recording sites (red circles) in the frontal (left) and parasagittal plane (right) of pigeon brains. To access the spatial range and temporal course of the muscimol inhibitory effect in the Wulst, the electrode proceeded in a grid pattern at eight positions centered on the injection site, with each recording site located 0.5 mm from the injection site. The electrode accessed each recording site, one by one, and continuously recorded 10 min of spontaneous activity at each site. It took about 1.5 hr to complete the recordings of all eight positions. (B) We measured the spontaneous activities of the Wulst cells averaged for eight recording sites surrounding the injection site before and after injection. The post-injection spontaneous activities of the Wulst cells were dramatically reduced relative to the pre-injection activities (n = 3 injection sites, mean ± SEM). Abbreviations: A, anterior; BO, bulbus olfactorius; Cb, cerebellum; H, height; HA, hyperpallium apicale; HD, hyperpallium densocellulare; HI, hyperpallium intercalatum; L, lateral; NC, nidopallium caudal; StM, striatum mediale.
Figure 5 with 1 supplement
Bilateral Wulst lesions had no effect on the entrained oscillatory responses of the replay cells after periodic LD stimulation.
(A) Oscillation frequencies (mean ± SEM) of 29 cells in the first 14 min after LD stimulation were linearly correlated with the temporal frequencies of LD stimuli (log-log scale). (B) A single replay cell could be re-entrained by periodic stimuli of different temporal frequencies (n = 6 cells, log-log scale). Each type of symbol represents a replay cell. (C) Duration of the first replay cycle of the replay cells (mean ± SEM, n = 29 cells) was closely related to the duration of the LD cycle during LD stimulation. (D) Number of replay cycles (mean ± SEM, n = 20 cells) monotonically increased when the number of LD cycles (L/D: 30 s/30 s) increased. (E, F) Mean durations (E) and peak responses (F) of the first and last three replay cycles of the replay cells (n = 29 cells). Dashed lines in (A) and (C) are the diagonal lines. Data in (A), (C), and (D) are fitted by the linear function. For other conventions, see Figures 2 and 3.
-
Figure 5—source data 1
Post-stimulus responses of replay cells before and after Wulst lesion in both hemispheres.
- https://doi.org/10.7554/eLife.27995.017
Figure 5—figure supplement 1

Locations of bilateral Wulst lesions in the pigeon brain.
(A) Schematic diagram of the frontal (left) and lateral view (right) of the Wulst (dark gray: A8.00 to 14.50, 0 to L3.00, 0 to H3.00) in both hemispheres (Karten and Hodos, 1967). (B) Histograph of the frontal sections through the Wulst lesion areas (left) and corresponding schematic overviews (right) (Karten and Hodos, 1967). Abbreviations: E, entopallium; HA, hyperpallium apicale; HD, hyperpallium densocellulare; HI, hyperpallium intercalatum; N, nidopallium; StM, striatum mediale (Avian Brain Nomenclature Forum et al., 2004).
Figure 6
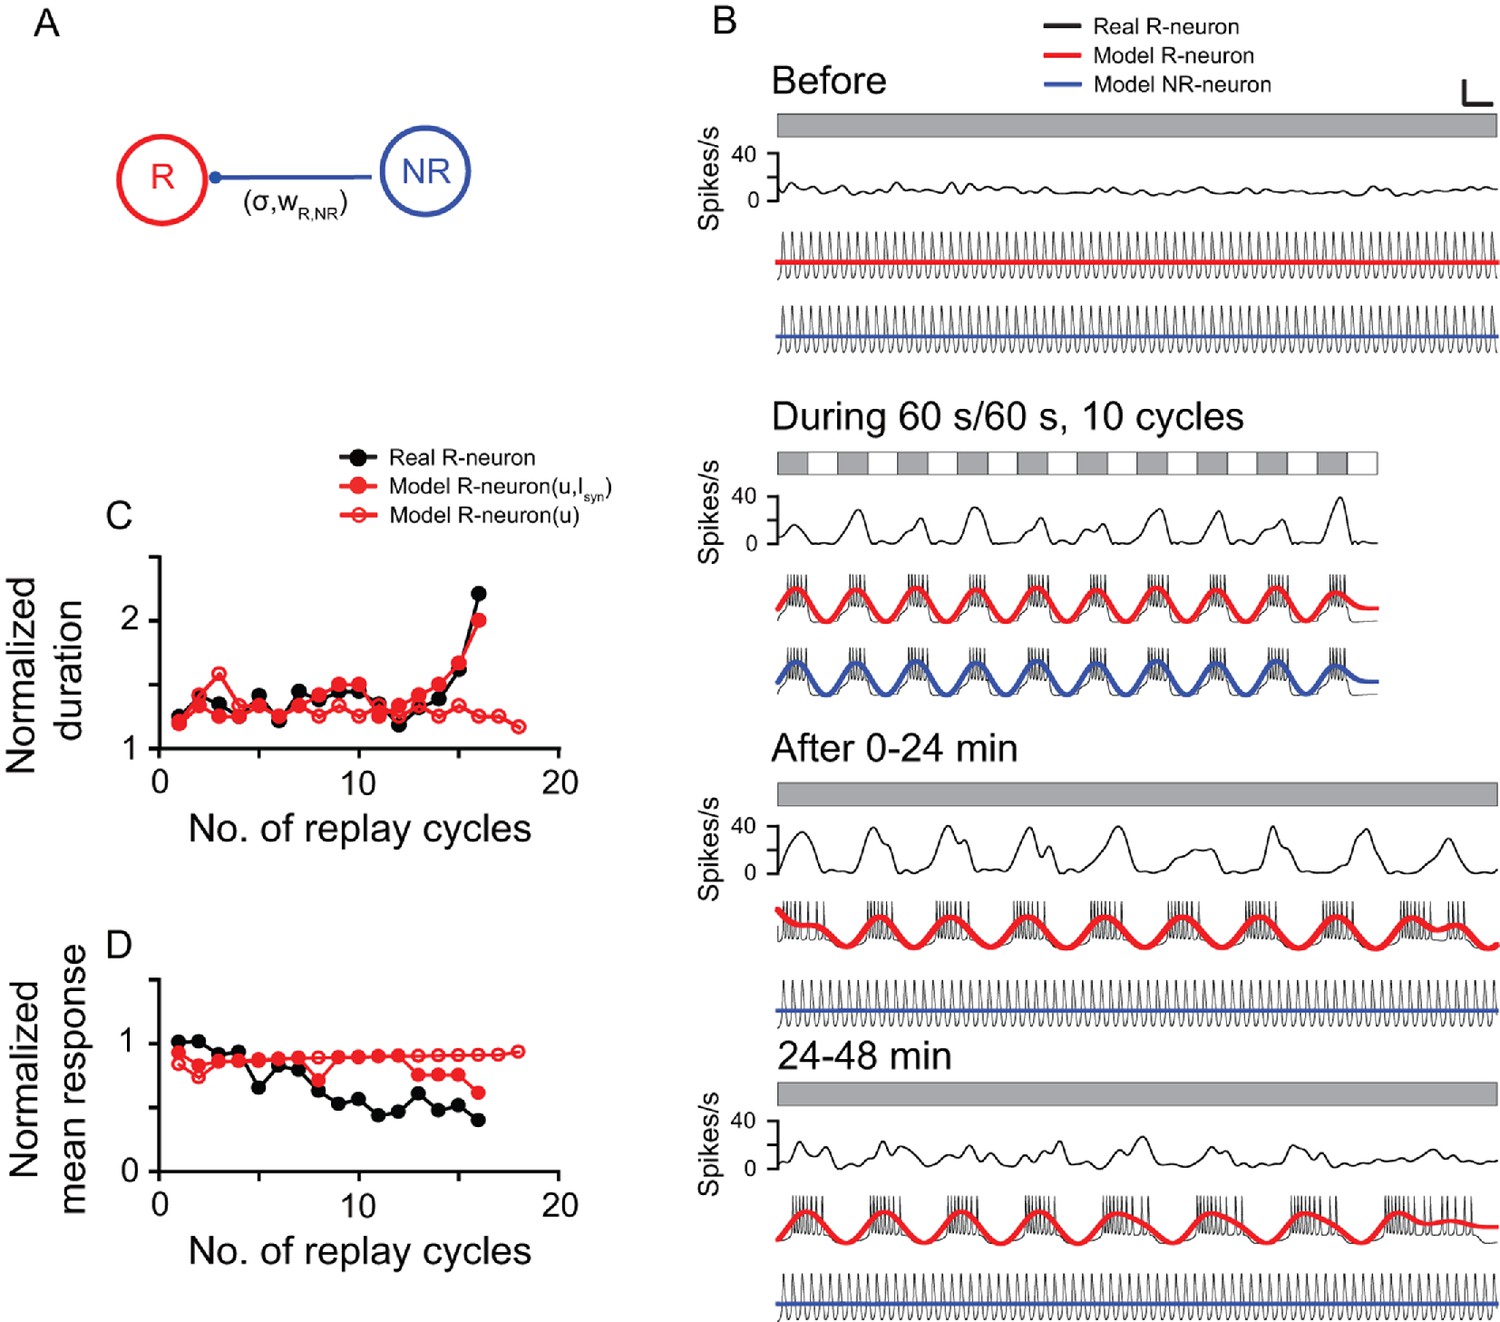
Computational model simulation of the responses of thalamic luminance cells to periodic stimuli.
(A) In the simplified neural network, the model replay neuron (R-neuron) received inhibitory synaptic inputs (Isyn) from the non-replay neuron (NR-neuron) with synaptic weight (wR,NR) and coupling strength (σR). The model NR-neuron did not receive synaptic inputs from the R-neuron. (B) By adjusting the simulation parameter values (see Materials and methods), the model R-neuron (red line) and NR-neuron (blue line) captured most of the response features of the thalamic cell in Figure 3 (black line) to the periodic LD stimulus (LD: 60 s/60 s, 10 cycles). For clear illustration of the response changes, the simulated firing traces of each model neuron were filtered by a zero-phase, low-pass Butterworth filter. The filtered firing rates are marked in red (R-neuron) and blue (NR-neuron). (C, D) Like the real replay cell illustrated in Figure 3, after LD stimulation, the duration of each replay cycle of the R-neuron (R-neuron [u,Isyn]) increased (C), while the mean activity of each replay cycle decreased with time (D). Without the inhibitory inputs of the NR-neuron (Isyn), the R-neuron (R-neuron [u]) showed oscillatory activity, but the duration and activity of each replay cycle did not change over time. u: recovery variable in the equation of the model neuron. Scale bars: 1 min, 300 μV in (B) for the firing traces of the model neurons. For other conventions, see Figure 1
-
Figure 6—source data 1
Simulation results of model neurons to periodic photic stimuli.
- https://doi.org/10.7554/eLife.27995.019
Additional files
-
Transparent reporting form
- https://doi.org/10.7554/eLife.27995.020
Download links
A two-part list of links to download the article, or parts of the article, in various formats.
Downloads (link to download the article as PDF)
Open citations (links to open the citations from this article in various online reference manager services)
Cite this article (links to download the citations from this article in formats compatible with various reference manager tools)
Representation of time interval entrained by periodic stimuli in the visual thalamus of pigeons
eLife 6:e27995.
https://doi.org/10.7554/eLife.27995


