Reaction times can reflect habits rather than computations
- Johns Hopkins University School of Medicine, United States
- Columbia University, United States
Figures
Figure 1

Experiment 1: interception task.
(A) Paradigm. Participants were first asked to perform a block of point-to-point reaches by moving a cursor representing their hand (red circle; red dashed arrow reflects direction of hand movement) to hit stationary targets (cyan circle). Following this, participants in the outward-interception task were required to hit targets that moved away from them (target motion denoted by black dashed arrow), while participants in the inward-interception task were required to hit targets that moved toward them. Following this, all participants completed a final block of point-to-point reaches. (B) Time course of average RT, average peak velocity, and average amplitude changes during the outward-interception task. Peak velocities are compared to the actual target velocity (solid gray line) and reach amplitude is compared to the average target amplitude at interception (solid gray line; note for pre- and post-blocks the targets remained at a fixed amplitude). For reaches made during the interception task, the reported amplitude is the magnitude of the entire movement generated (i.e., until the velocity of the hand returned to zero) regardless of when or whether the target was successfully intercepted. Shaded regions represent S.E.M. (C) Comparison of baseline (blue) and post-training (green) performance for average RT, average peak velocity, and average endpoint error; each gray line is an individual participant. (D,E) As in panels B and C, but for the inward-interception task. (F) Across the two tasks, there was a significant interaction between task and block for average RT; this was driven by an RT shift away from baseline behavior in opposite directions for the two groups following training.
-
Figure 1—source data 1
Outward.
This data set pertains to the outward-interception task, and were used to calculate the summary statistics in Figure 1C and Figure 1F. This file contains measured kinematic parameters (RT, peak velocity (Vpeak), and endpoint error (Err)), for each trial and participant during the pre-training (Block 1) and post-training (Block 2) point-to-point reaching blocks. Note, the first 10 trials in each block have been excluded to evaluate steady-state movement parameters.
- https://doi.org/10.7554/eLife.28075.005
-
Figure 1—source data 2
Inward.
This data set pertains to the inward-interception task, and were used to calculate the summary statistics in Figure 1E and Figure 1F. This file contains measured kinematic parameters (RT, peak velocity (Vpeak), and endpoint error (Err)), for each trial and participant during the pre-training (Block 1) and post-training (Block 2) point-to-point reaching blocks. Note, the first 10 trials in each block have been excluded to evaluate steady-state movement parameters.
- https://doi.org/10.7554/eLife.28075.006
Figure 2
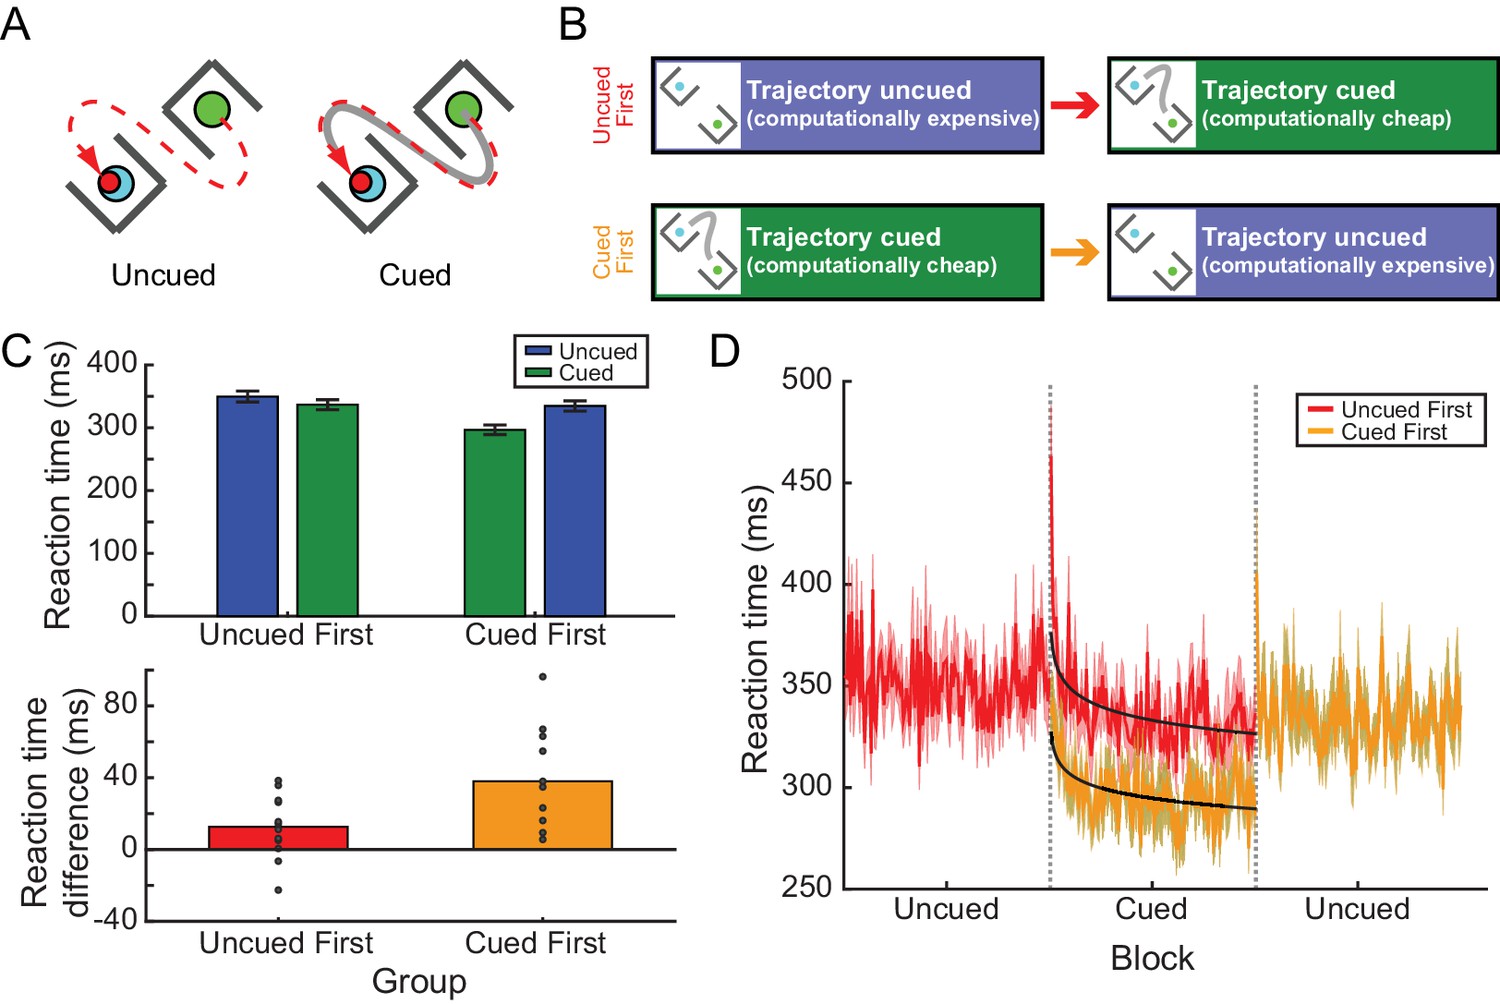
Experiment 2A: RTs depended on prior experience in the barrier task.
(A) Participants reached from a start position to a target without intercepting a pair of barriers. One example target and barrier configuration is shown at left. Under the path-cued condition (at right), participants were also provided with a cue (solid gray line) indicating how they should get to the target. Note, in both cases the barriers, target, and cue (when present) disappeared upon movement onset; hence participants in the cued condition were not merely tracing the cue but were required to hold the desired movement trajectory in memory, analogous to individuals performing the uncued condition. (B) Participants were divided into two groups; one group performed an uncued reaching block followed by a cued reaching block, while the other group performed these blocks in the opposite order. (C) Upper panel, the average RT across all participants for each condition (cued or uncued) for the two groups (uncued-first or cued-first). Lower panel, the average difference in RT between cued and uncued reaches across all barrier configurations; positive differences indicate that RTs were shorter on cued reaches compared to uncued reaches. Dots represent individual participants. (D) The time course of RTs across all trials, for each group (red, uncued-first group; orange; cued-first group). Black lines represent power-law fits to the decay of RT during the cued blocks of trials. Data in the cued-first group have been horizontally offset to align the cued blocks from each group for direct comparison.
-
Figure 2—source data 1
This file contains RT data for Experiment 2A, used to generate Figure 2C and Figure 2D.
These data were also used to fit mixed-effects models for computing statistics. The file contains the RT for each trial in each group (order, cued-first = 0, uncued-first = 1) and condition (cued = 0, uncued = 1). Additionally, there is a factor representing the barrier configuration (TB), which is assigned an arbitrary numbering from 0 to 63, which is used in the mixed-effects modeling analysis.
- https://doi.org/10.7554/eLife.28075.008
Figure 3
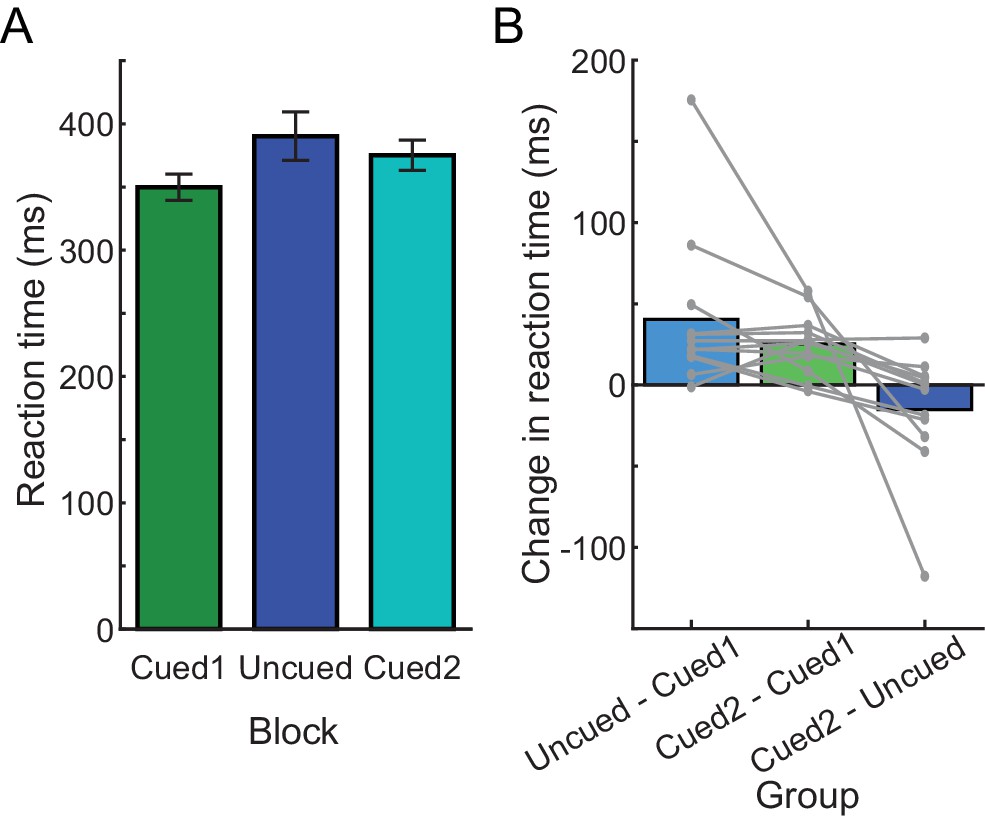
RTs in Experiment 2B.
(A) Average RTs during each block, in the order that blocks were experienced in the experiment (from left to right). (B) Change in average RT between each pair of blocks during the experiment; each gray line is an individual participant.
-
Figure 3—source data 1
This file contains RT data from Experiment 2B, used to generate Figure 3.
These data were also used to fit mixed-effects models for computing statistics. The file contains the RT for each trial in every condition (cued block = T, uncued = NT), for all three blocks (first cued block, uncued block, second cued block). Additionally, there is a factor representing the barrier configuration (TB), which is assigned an arbitrary numbering from 0 to 63, which is used in the mixed-effects modeling analysis.
- https://doi.org/10.7554/eLife.28075.010
Figure 4
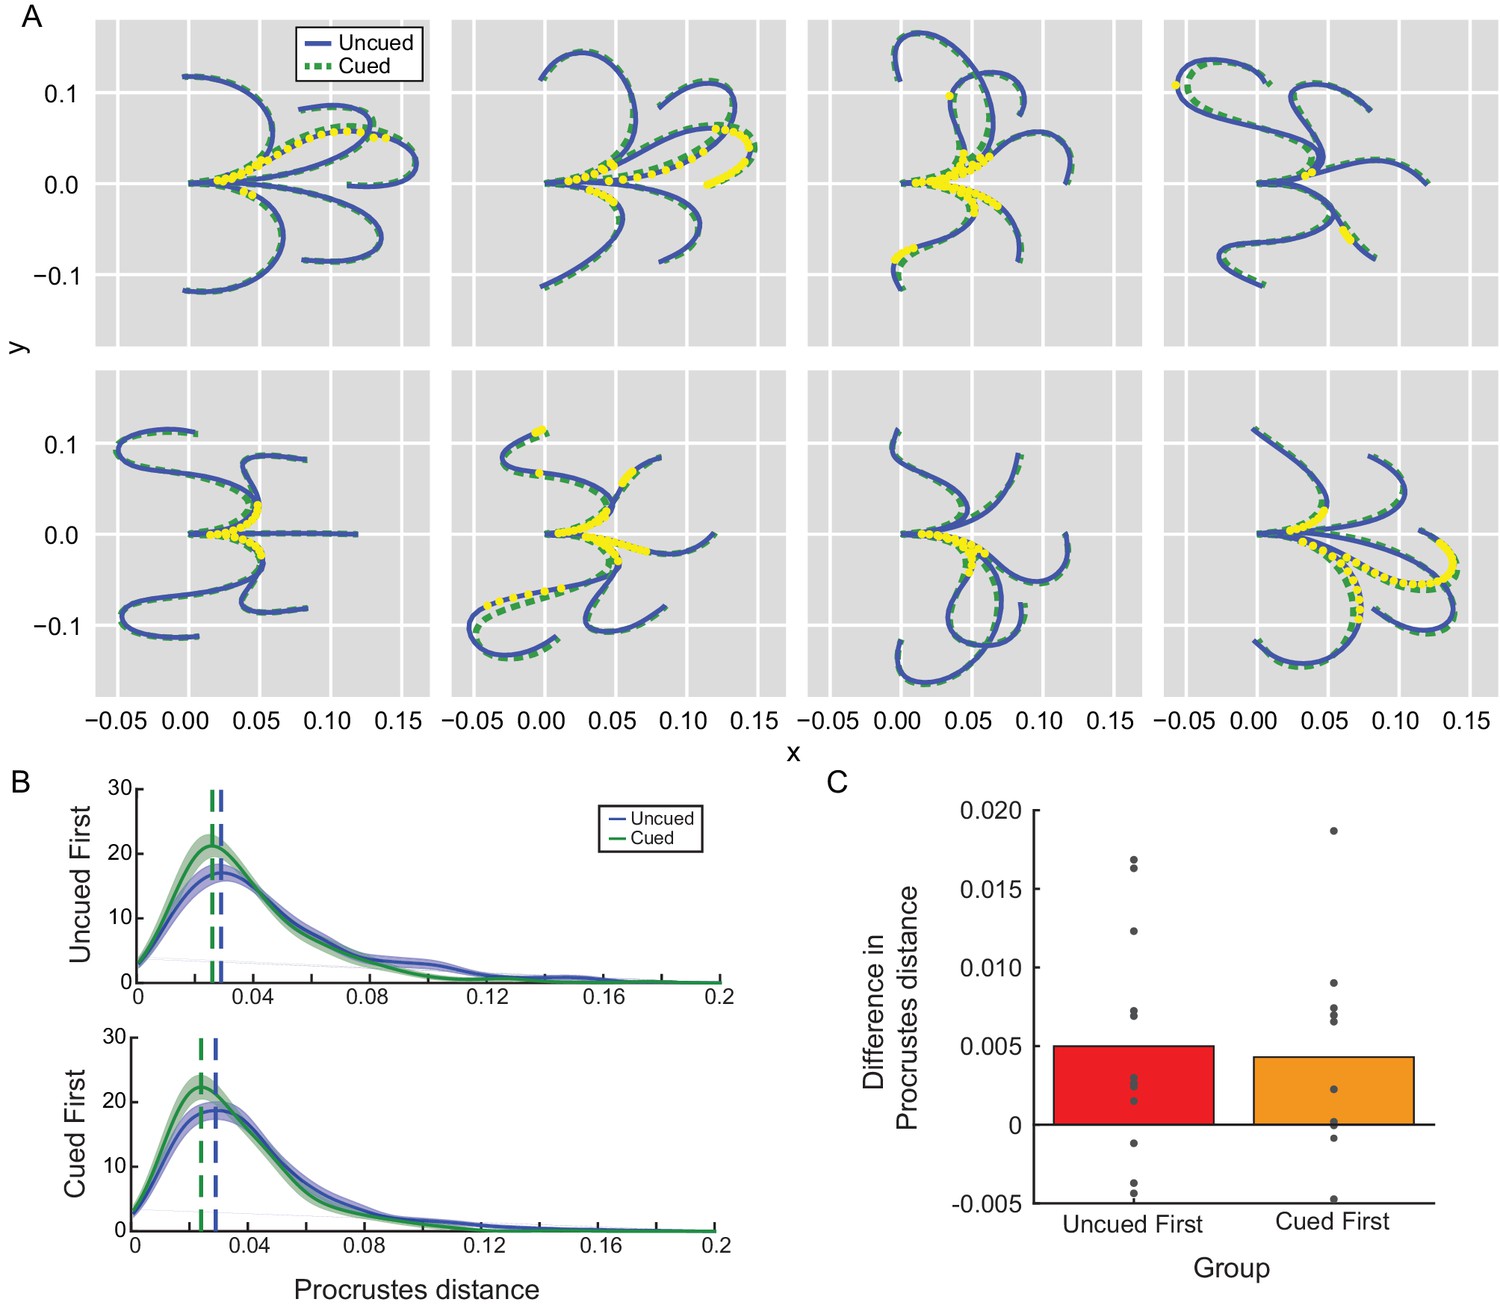
Movement kinematics in Experiment 2A depended on the presence of the path cue.
(A) Average reach trajectories across participants for each barrier configuration for uncued (blue) and cued (green) conditions. Each yellow dot represents a time at which the mean trajectories were found to be consistently different between conditions. Since no significant effect of order was observed, data were collapsed across groups. (B) Trajectory shapes for cued and uncued reaches were examined for their similarity to the path cue according to a Procrustes distance analysis. A Procrustes distance of zero means the trajectory is identical in shape to the path cue. Distributions of estimated Procrustes distances pooled across all trajectory shapes were averaged across all participants in each group (uncued-first or cued-first) and are shown for comparison; the mode of each distribution is indicated by the vertical dashed line for visualization purposes. No significant effect of order (group) was observed. (C) Average difference in Procrustes difference between uncued and cued reaches for each individual participant is shown; positive differences indicate that cued reaches are more similar in shape to the path cue compared to uncued reaches.
-
Figure 4—source data 1
Procrustes Distance.
These data contain Procrustes distance estimates for all the trajectories performed in Experiment 2A, used to generate Figure 4B and Figure 4C. The file contains the Procrustes distance for every trial in each group (order, cued-first = 0, uncued-first = 1) and condition (cued = 0, uncued = 1). These data were used to examine kinematic differences between conditions and groups (i.e., an effect of order) using a generalized linear mixed model in brms (see Materials and methods).
- https://doi.org/10.7554/eLife.28075.012
Tables
Table 1
Movement parameters for Experiment 1.
https://doi.org/10.7554/eLife.28075.003| Reaction time (ms) | Peak velocity (m/s) | Endpoint error (cm) | |
|---|---|---|---|
| Outward Interception | |||
| Pre-training | 295.38 ± 14.98 | 0.66 ± 0.02 | 1.16 ± 0.10 |
| Last training block | 255.20 ± 7.85 | 1.28 ± 0.10 | n/a |
| Post-training | 273.20 ± 12.10 | 0.67 ± 0.01 | 1.32 ± 0.22 |
| Inward Interception | |||
| Pre-training | 290.76 ± 18.35 | 0.55 ± 0.02 | 1.09 ± 0.06 |
| Last training block | 564.82 ± 112.11 | 0.27 ± 0.04 | n/a |
| Post-training | 303.63 ± 17.25 | 0.57 ± 0.01 | 1.05 ± 0.04 |
-
RT, peak velocity, and endpoint error for the two groups in Experiment 1 for point-to-point movements measured before and after training, as well as for shooting movements during the last block of training. Reach velocity was required to be between 0.6 and 0.9 m/s for the outward-interception task and between 0.5 and 0.8 m/s for the inward-interception task. Note that no endpoint error is reported for the last block of training because participants reached past a continuously moving target, making it difficult to define error when participants missed the target during those blocks.
Additional files
-
Supplementary file 1
Source data for Experiment 2B kinematics analysis.
These data contain the Procrustes Distance measure (range, 0 to 1) calculated for each trajectory performed by every participant in Experiment 2B. The file includes a column for condition (cued block = 0, uncued = 1) and a column for block (first cued block = 1, uncued block = 2, second cued block = 3). These data were used to calculate kinematic differences between blocks using a generalized linear mixed model in brms (see Materials and methods). There is no corresponding figure for these data, summary statistics are reported in the Results.
- https://doi.org/10.7554/eLife.28075.013
Download links
A two-part list of links to download the article, or parts of the article, in various formats.
Downloads (link to download the article as PDF)
Open citations (links to open the citations from this article in various online reference manager services)
Cite this article (links to download the citations from this article in formats compatible with various reference manager tools)
Reaction times can reflect habits rather than computations
eLife 6:e28075.
https://doi.org/10.7554/eLife.28075


