Neural and computational processes underlying dynamic changes in self-esteem
- University College London, United Kingdom
- Max Planck UCL Centre for Computational Psychiatry and Ageing Research, University College London, United Kingdom
Figures
Figure 1
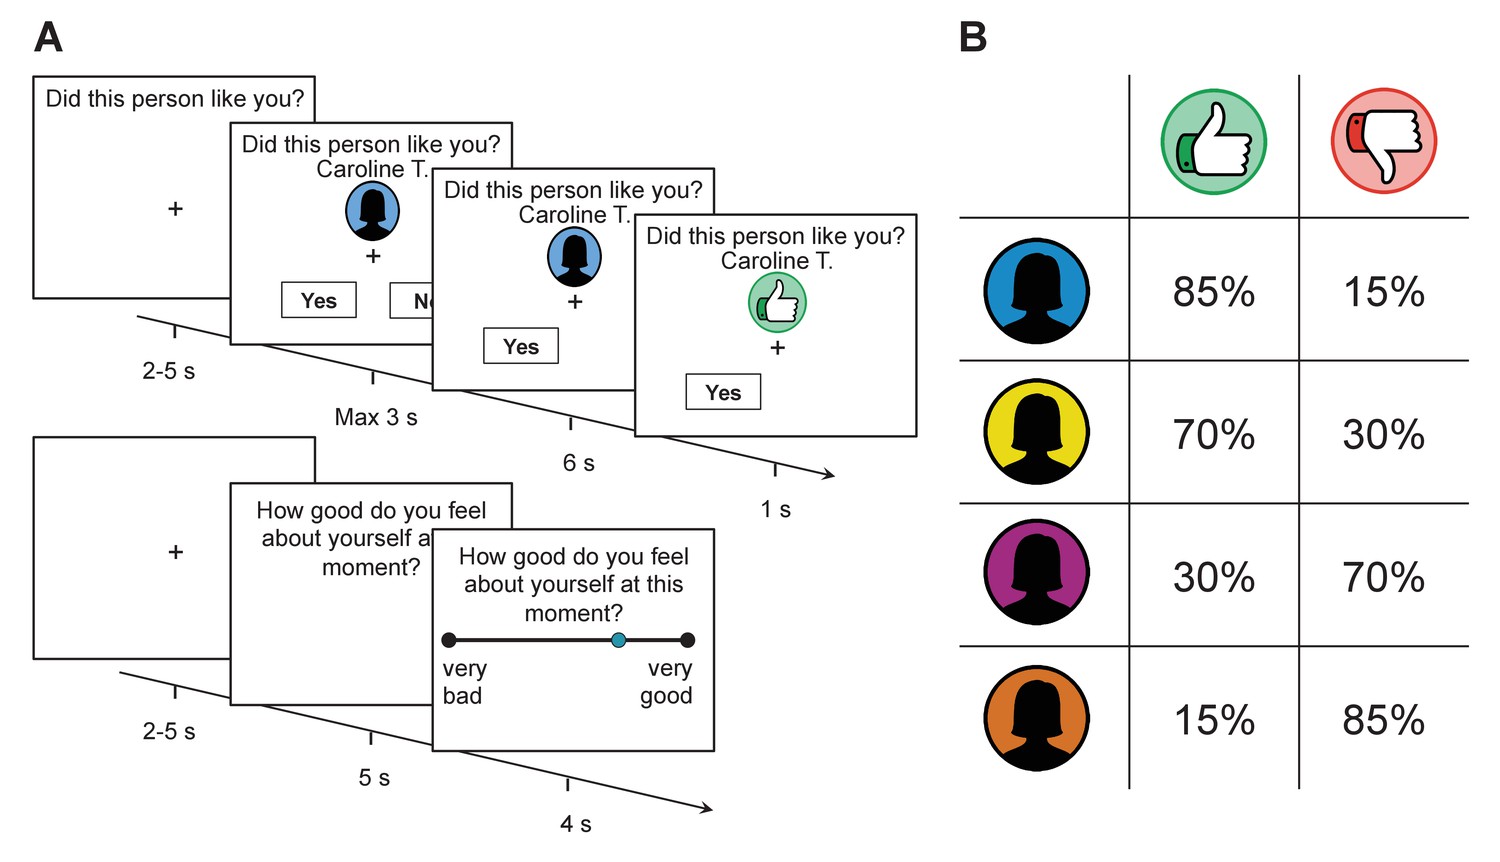
Task structure and feedback probabilities.
(A) Participants were provided with a visual cue that indicated which group a rater belonged to (assigned according to their overall disposition to provide approving or disapproving feedback; see panel on the right). They then made a prediction as to whether the rater would like or dislike them before receiving feedback. After every 2–3 trials, participants were asked to indicate their current level of self-esteem. (B) Probability of receiving approval or disapproval feedback was dependent on the rater’s group (signaled by a color cue). Participants received approving feedback in 85%, 70%, 30%, and 15% of the trials. Group colors were randomized across participants.
Figure 2 with 2 supplements
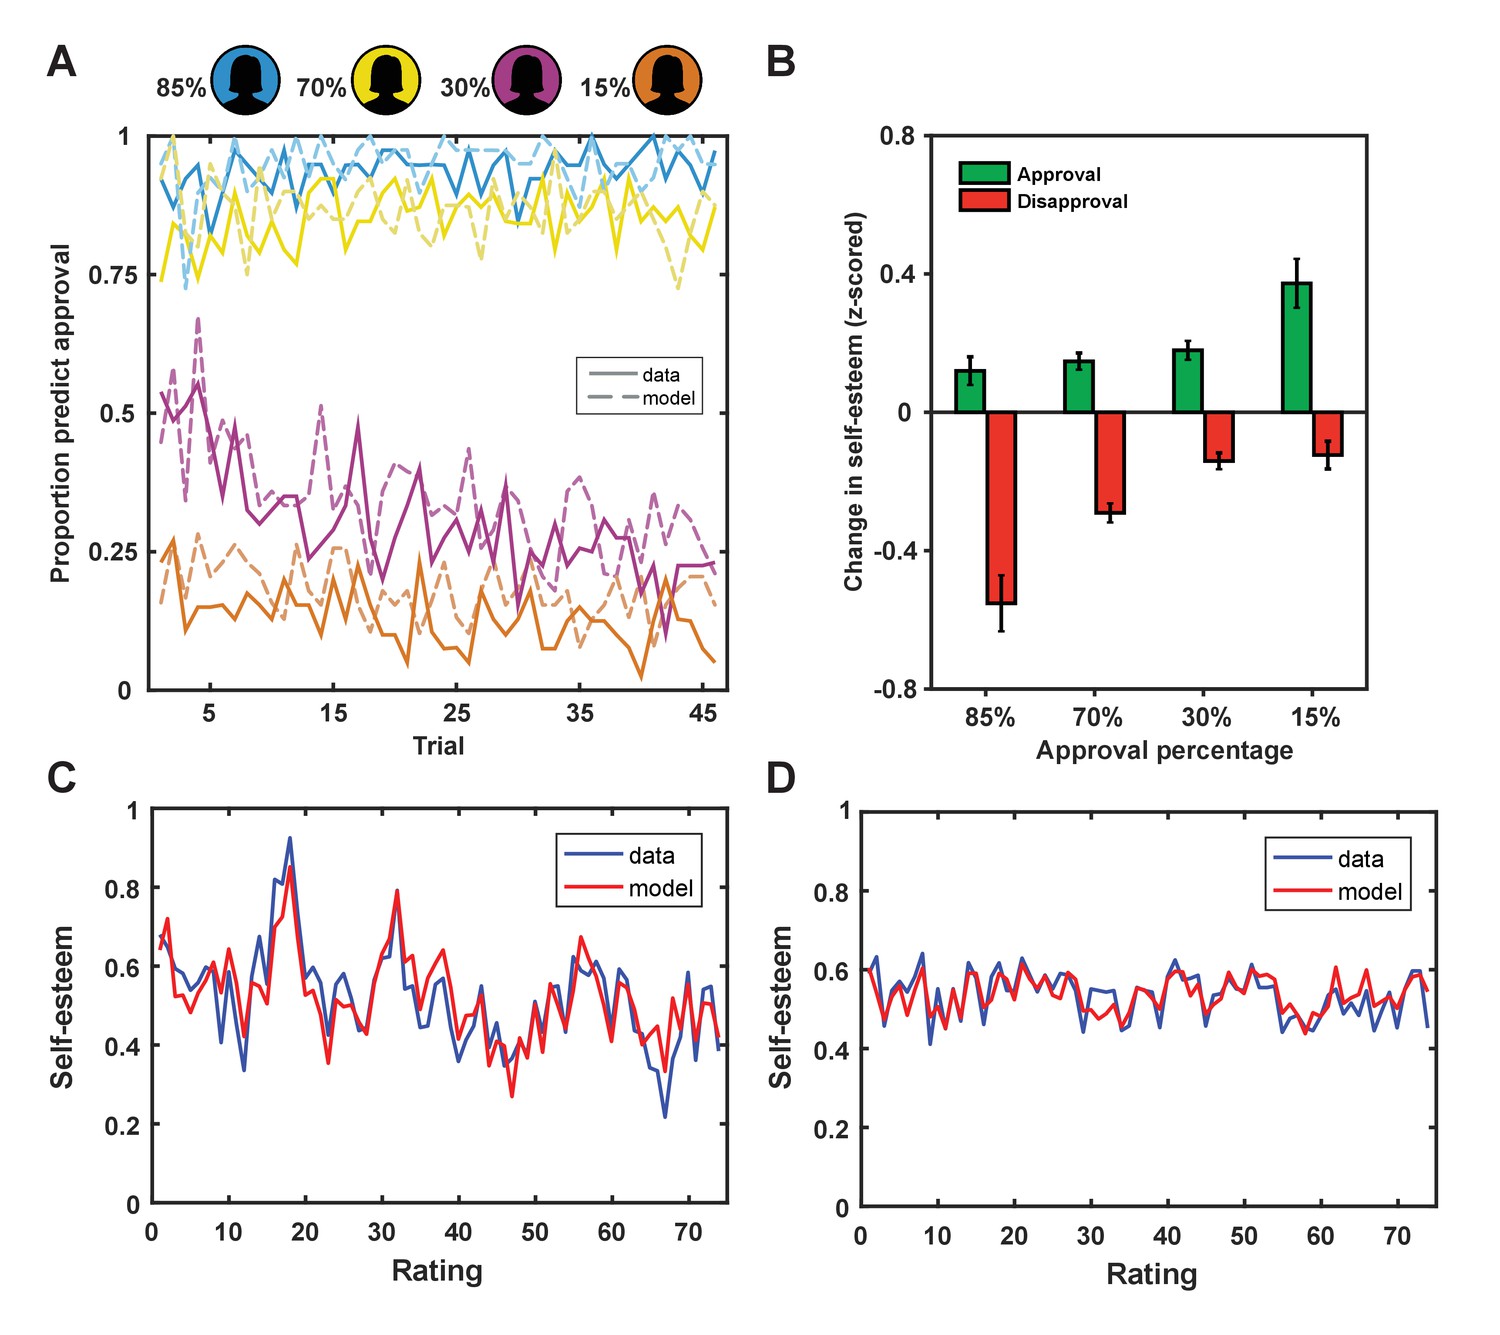
Behavioral results.
(A) Participants adapted their predictions about being liked by a rater based on the rater’s group membership (solid lines; colors indicate approval probability of group) and our learning model explained subject predictions (dotted lines). (B) Changes in self-esteem in response to feedback depended on social approval expectations that differed for the different groups, such that self-esteem depended on both valence (approval vs. disapproval) and the probability of approval. The largest self-esteem increases occurred with approval feedback from the 15% group, the most surprising positive feedback. The largest self-esteem decreases occurred with disapproval feedback from the 85% group, the most surprising negative feedback. Data are represented as mean ± standard error of the mean (SEM). (C and D) Self-esteem ratings over the course of the experiment in two exemplar participants (in blue) and predictions of our computational model (Equation 1; in red).
Figure 2—figure supplement 1
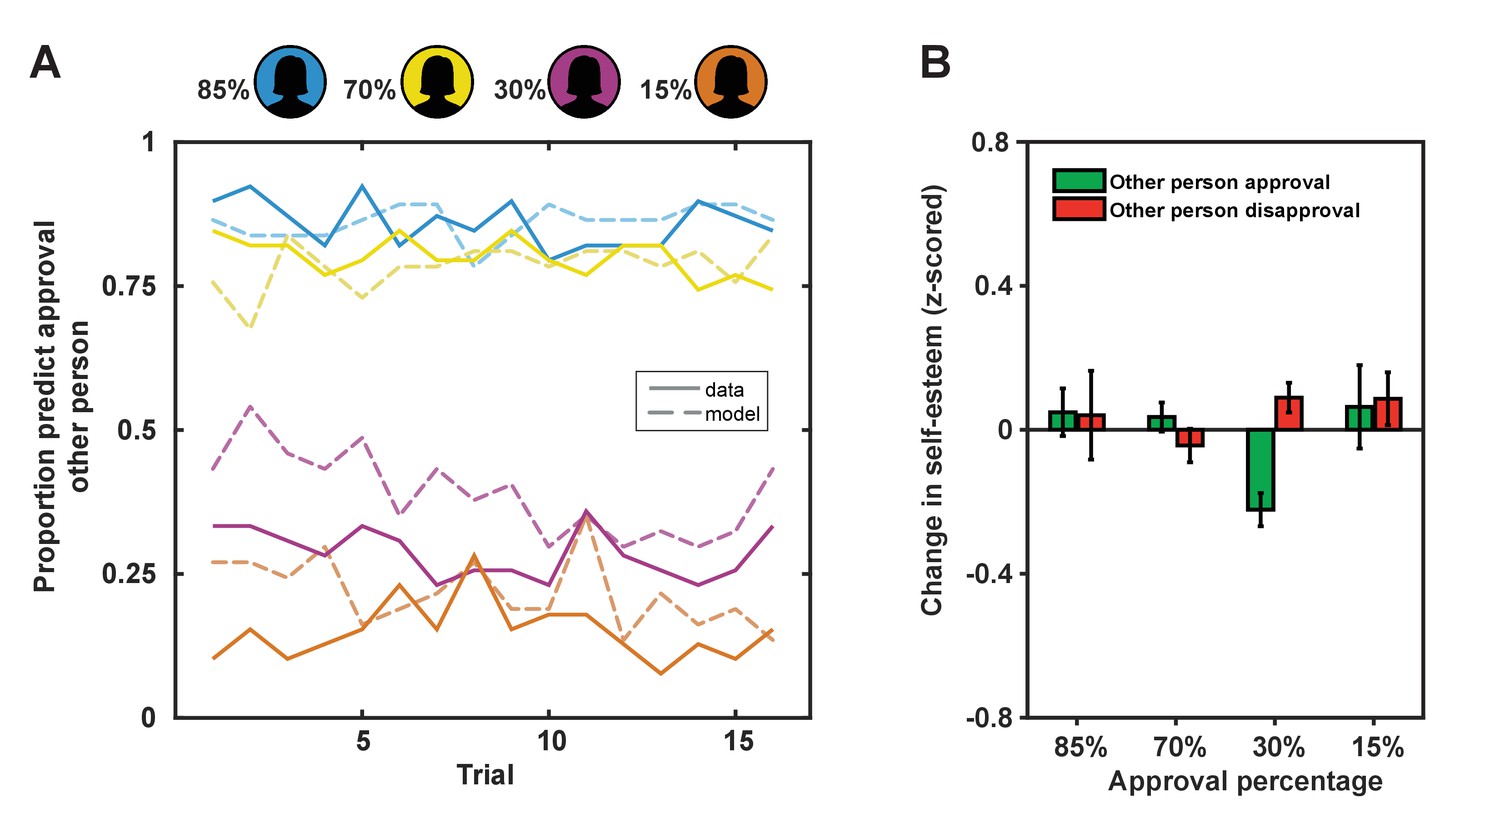
Results ‘Other evaluation’ Control Task.
To establish that the changes in self-esteem we observed in our fMRI experiment were specific to situations where the self is evaluated, participants performed a control task. This task that was identical to the scanning task except that subjects were not targets of evaluation. Instead they were asked to predict whether another participant (of the same gender and age) was liked and then observed the feedback this other person received. (A) Participants correctly predicted the feedback in 69% of the time for the other person (which was identical to correct predictions for themselves and close to the optimum of 77.5%). Choice patterns were reliably predicted by the same Rescorla-Wagner reinforcement-learning model (Rescorla and Wagner, 1972) used to fit participant’s choice behavior when they were the object of evaluation (r2 = 0.34 ± 0.32; mean ± SD). This shows that SPEs are important for learning about evaluative feedback irrespective of who the object of evaluations is. (B) Social feedback directed at another person did not affect self-esteem (F(1,38) =.477, p=0.494, ηp2 = 0.012). Group membership did not interact with feedback to affect self-esteem when another person was evaluated, F(3,114), p=0.172, ηp2 = 0.043. Together these findings show that the observed self-esteem changes in the fMRI task are specific to situations where the self is the object of evaluation. The absence of changes in self-esteem in the control task renders it unlikely that the changes in self-esteem we observed in our fMRI experiment were the result of demand characteristics. Data are represented as mean ± standard error of the mean (SEM).
Figure 2—figure supplement 2
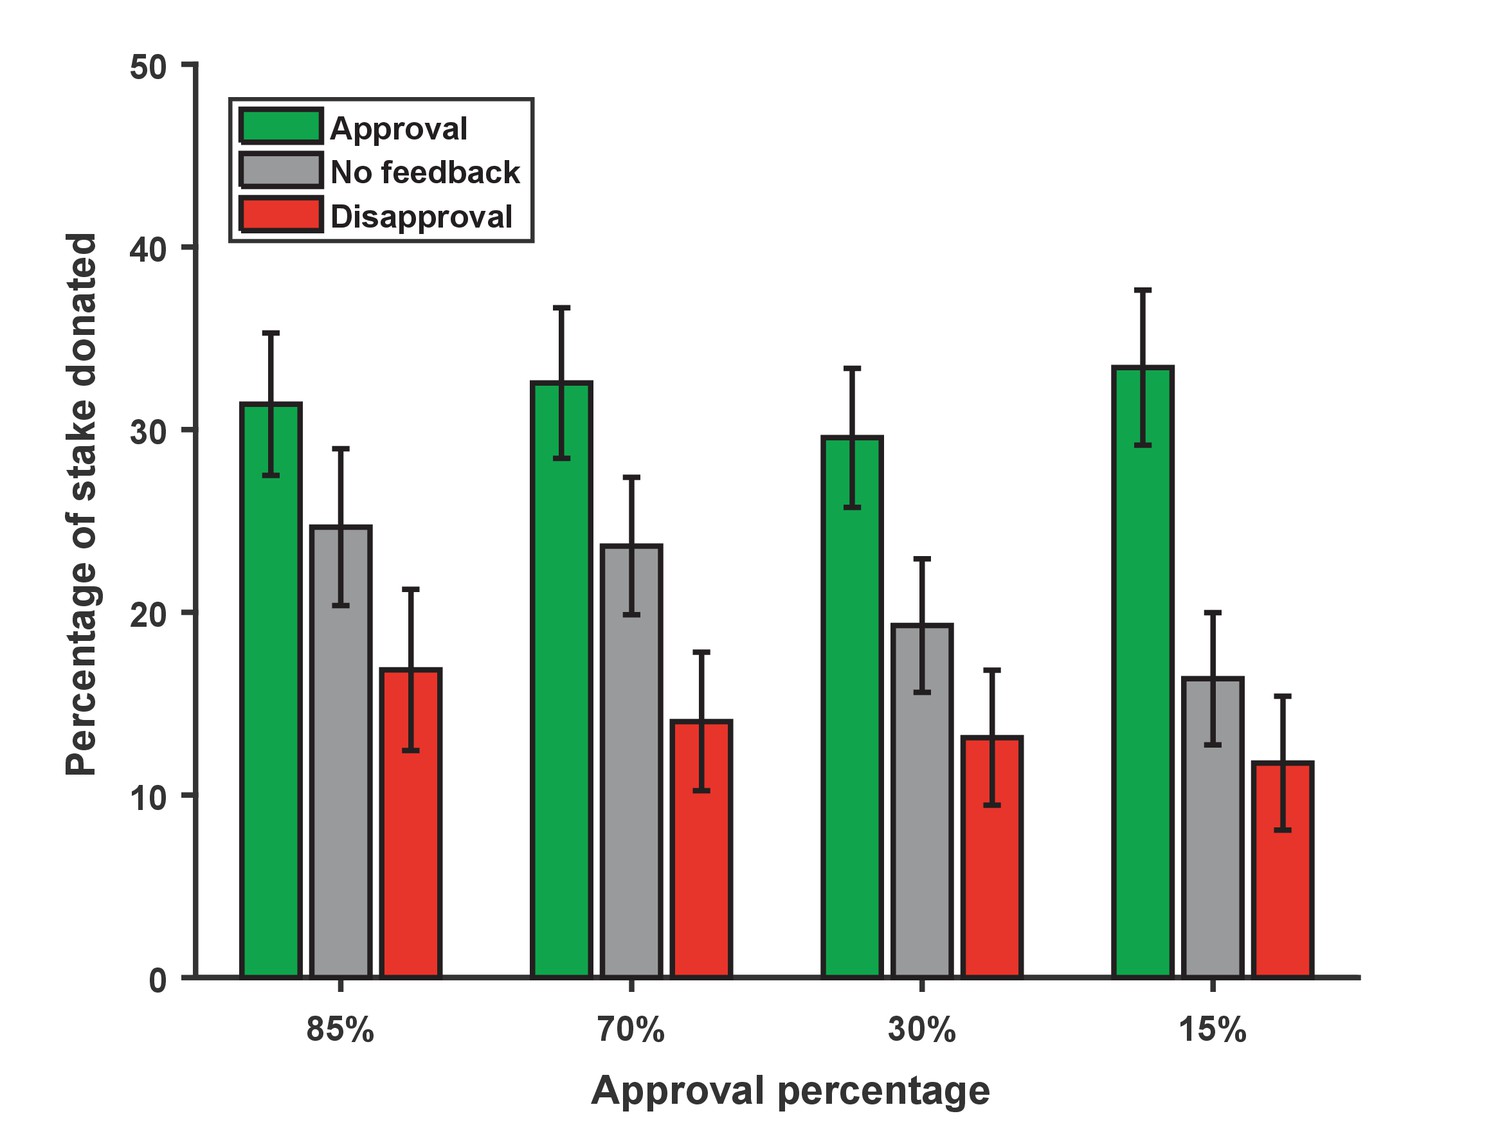
Results Dictator Game.
Participants completed a series of Dictator Games where they were asked how much money they wanted to donate to people who had previously rated them in the scanner. Participants donated on average 23% of their £5 endowment. Their donation behavior was modulated by the feedback raters gave them (F(2, 78)=34. 91, p<0.001, ηp2 = 0.472) such that they donated more to raters who gave approval than those whose feedback was not displayed (p<0.001) and those who disapproved of them (p<0.001). Donation behavior also interacted with probability of approval (F(6, 234)=3.33, p=0.007, ηp2 = 0.079). Follow-up comparisons showed that raters for whom feedback was not displayed were treated differently based on their group membership, F(3, 117)=5.88, p=0.001, ηp2 = 0.131. Raters from different groups who gave approval feedback were treated similar to each other (F(3, 117)=0.326, p=0.789, ηp2 = 0.008) as were raters from different groups who gave disapproval feedback (F(3, 117)=0.843, p=0.445, ηp2 = 0.021). These results provide evidence that participants treated the raters as real people and that social feedback had a significant impact on subsequent prosocial behavior. Data are represented as mean ± SEM.
Figure 3
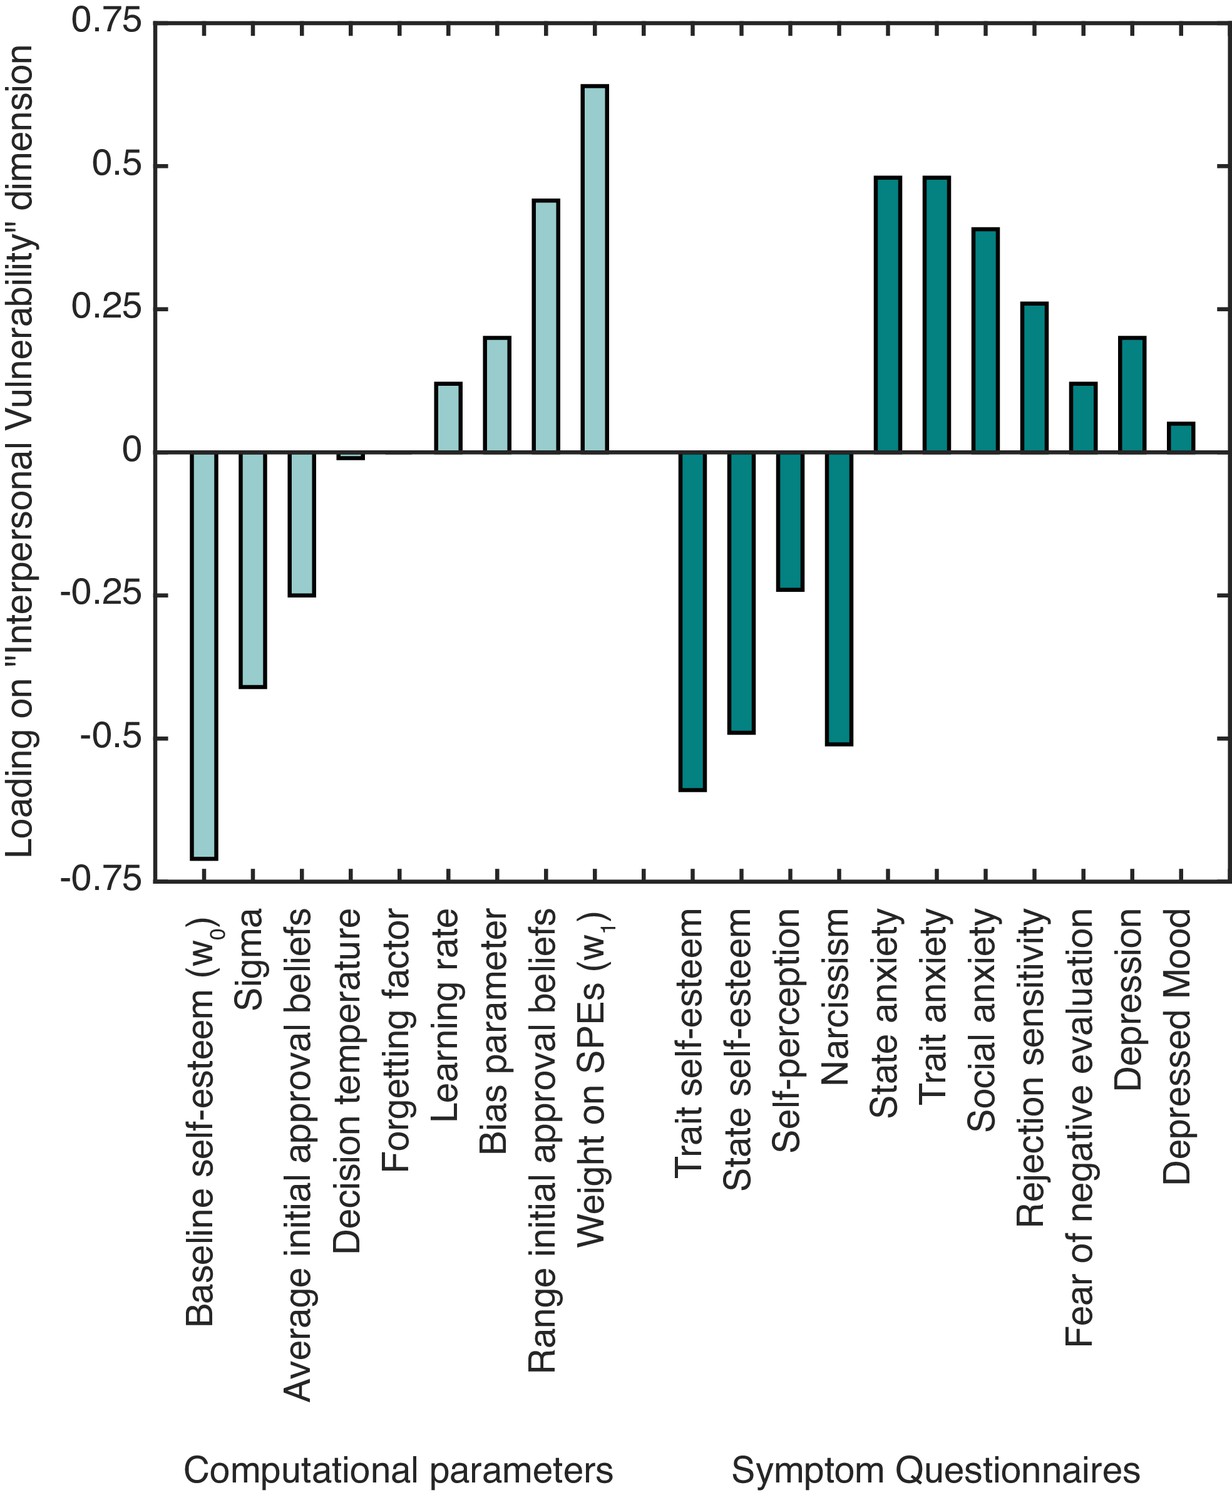
The standardized canonical coefficients for the ‘interpersonal vulnerability’ dimension across computational self-esteem parameters and psychiatric symptom measures.
https://doi.org/10.7554/eLife.28098.009
Figure 4
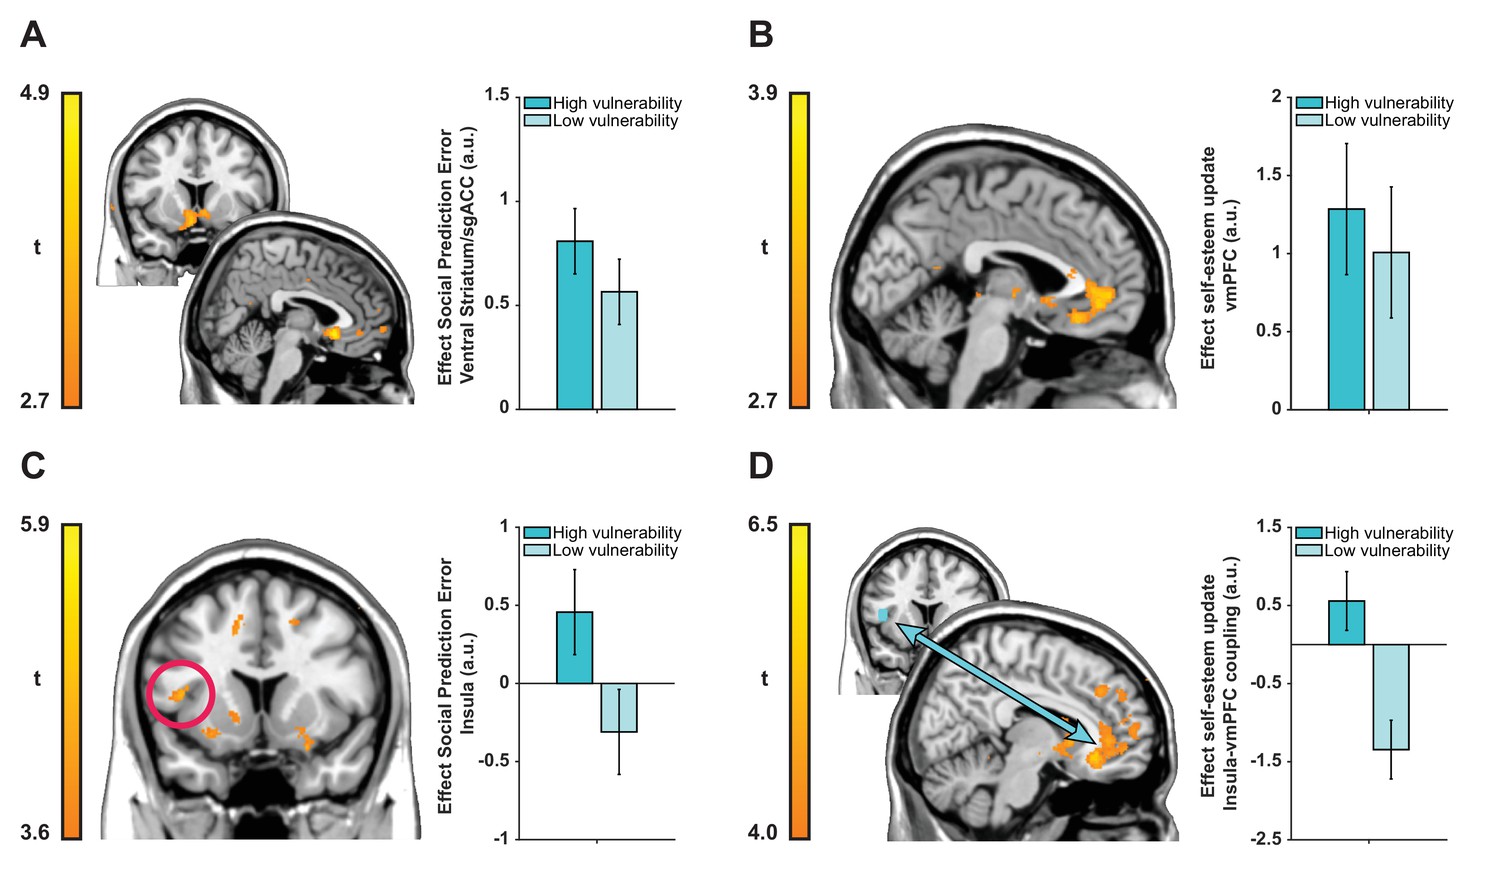
Neuroimaging results plotted separately for high and low ‘interpersonal vulnerability’ participants (based on median split) to facilitate interpretation.
(A) Social prediction errors correlated with activity in a cluster in bilateral ventral striatum extending into sgACC. (B) Trial-by-trial updates in self-esteem upon receipt of feedback correlated with activity in vmPFC (BA 14m and BA 32pl). (C and D) Vulnerability modulated the expression of prediction error responses in left anterior insula (extending into inferior frontal gyrus) and insula-vmPFC coupling during self-esteem updates. Images are thresholded at t > 2.7 (panels A and B), t > 3.6 (panel C) and t > 4.0 (panel D) with no cluster-extent threshold for display purposes. Data are represented as mean ± SEM. See tables in Supplementary file 2 for a full list of activations.
Tables
Table 1
Comparisons of fits of self-esteem models
Bayesian Information Criterion (BIC) measures are summed across all participants. Lower BIC values indicate a more parsimonious model fit. Mean squared error over self-esteem ratings indicates goodness of fit. k is the number of fitted parameters. Models 1–4 were fit to both choice behavior and self-esteem ratings and BIC measures comprise both the summed log likelihood of the model prediction over choice behavior and the summed log density of the model prediction over the self-esteem ratings. Models 5–6 were fit solely to the self-esteem ratings in order to allow for a fair comparison with a model without expectations (model 6), which by definition would not provide a good fit for the behavioral choice data. See Materials and Methods for details on the computational models.
| Model | k | Mean r2 | Median r2 | BIC | BIC-BICmodel1 |
|---|---|---|---|---|---|
| 1: Learning and positive bias | 9 | 0.31 | 0.27 | −633 | 0 |
| 2: Learning, but no bias | 8 | 0.29 | 0.25 | −378 | 255 |
| 3: Correct initial beliefs about approval | 7 | 0.25 | 0.22 | 409 | 1042 |
| 4: Separate term for expectations | 10 | 0.34 | 0.32 | −502 | 131 |
| Model | k | Mean r2 | Median r2 | BIC | BIC-BICmodel1 |
|---|---|---|---|---|---|
| 5: Free initial beliefs about approval | 5 | 0.32 | 0.31 | −5671 | 0 |
| 6: Outcome valence only | 7 | 0.23 | 0.18 | −5581 | 90 |
Table 2
Means and standard deviations for computational self-esteem parameters and psychiatric symptom measures.
https://doi.org/10.7554/eLife.28098.008| Computational self-esteem parameters | Mean (SD) |
|---|---|
| Baseline self-esteem (w0) | 0.73 (0.16) |
| Average initial approval beliefs () | 0.64 (0.24) |
| Decision temperature (T) | 0.12 (0.35) |
| Sigma in gaussian noise term | 0.08 (0.04) |
| Weight on SPEs (w1) | 0.04 (0.03) |
| Range initial approval beliefs () | 0.34 (0.29) |
| Bias parameter (ESV0) | 0.42 (0.25) |
| Learning rate (η) | 0.04 (0.08) |
| Forgetting factor (γ) | 0.66 (0.35) |
| Symptom questionnaires | Mean (SD) |
|---|---|
| Trait Self-Esteem (Rosenberg, 1965) | 21.60 (5.00) |
| State Self-Esteem (Heatherton and Polivy, 1991) | 77.93 (10.23) |
| Self-Perception (Neemann and Harter, 1986) | 2.98 (0.61) |
| Narcissism (Raskin and Terry, 1988) | 11.26 (5.8) |
| State Anxiety (Spielberger et al., 1970) | 1.62 (0.47) |
| Trait Anxiety (Spielberger et al., 1970) | 1.93 (0.47) |
| Social Anxiety (Liebowitz, 1987) | 1.05 (0.88) |
| Rejection Sensitivity (Downey and Feldman, 1996) | 9.24 (2.96) |
| Fear of Negative Evaluation (Carleton et al., 2011; Leary, 1983) | 2.71 (0.94) |
| Depression (Beck et al., 1996) | 5.40 (5.47) |
| Depressed Mood (Angold et al., 1995) | 9.15 (7.24) |
Additional files
-
Supplementary file 1
Instructions and questions for online profile on which participants were evaluated
- https://doi.org/10.7554/eLife.28098.011
-
Supplementary file 2
Brain regions revealed by whole-brain neuroimaging analyses thresholded at p < .001 uncorrected, k > 50 voxels.
- https://doi.org/10.7554/eLife.28098.012
-
Transparent reporting form
- https://doi.org/10.7554/eLife.28098.013
Download links
A two-part list of links to download the article, or parts of the article, in various formats.
Downloads (link to download the article as PDF)
Open citations (links to open the citations from this article in various online reference manager services)
Cite this article (links to download the citations from this article in formats compatible with various reference manager tools)
Neural and computational processes underlying dynamic changes in self-esteem
eLife 6:e28098.
https://doi.org/10.7554/eLife.28098


