Native KCC2 interactome reveals PACSIN1 as a critical regulator of synaptic inhibition
- University of Toronto, Canada
- University of Helsinki, Finland
- Mount Sinai Hospital, Canada
- Institut Universitaire en Santé Mentale de Québec, Canada
- Université Laval, Canada
- The University of Queensland, Australia
Figures
Figure 1 with 2 supplements
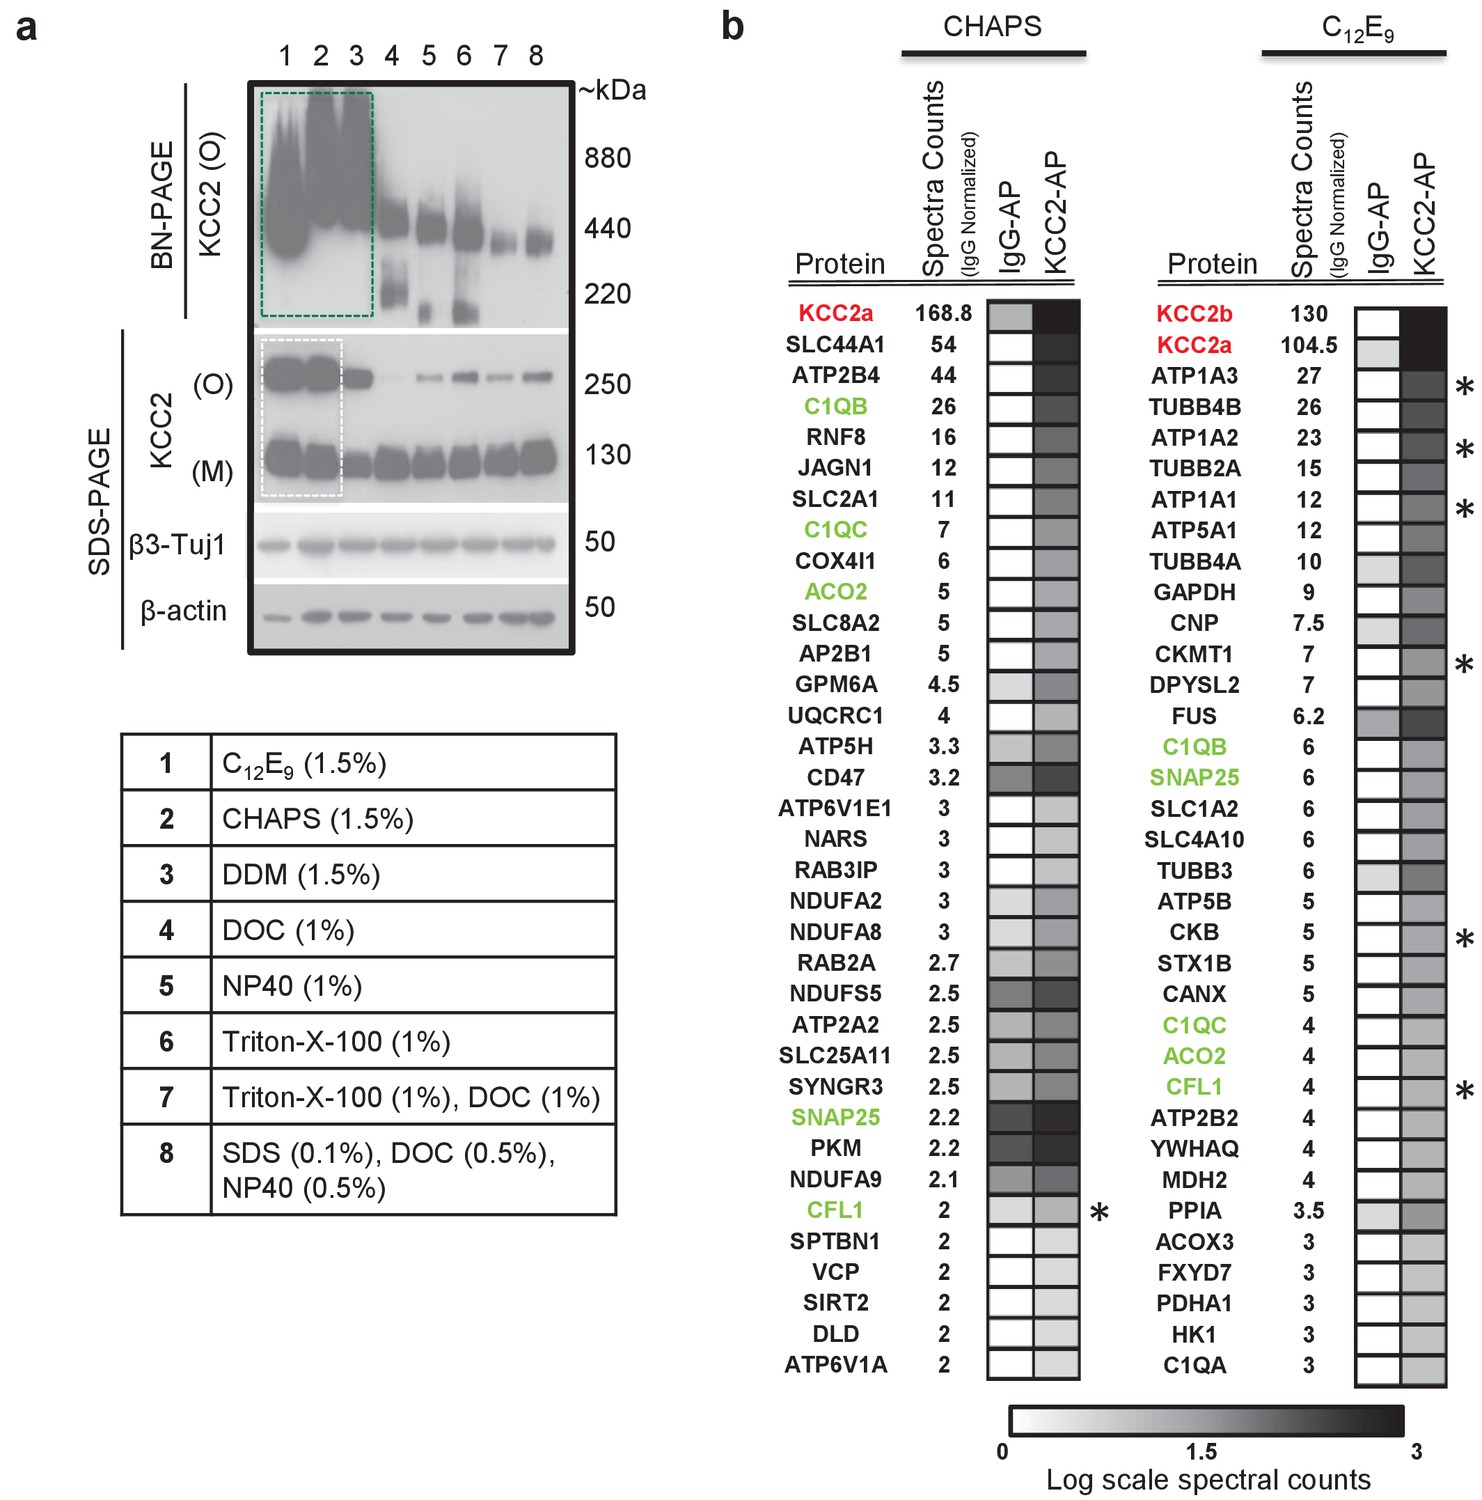
KCC2 multi-protein complexes can be extracted using native detergents.
(a) BN-PAGE and SDS-PAGE separation of solubilized membrane fractions prepared from ~P50 mouse brain, using the detergents listed in the associated table. Protein separations were western-blotted and probed with antibodies indicated on the left. O, oligomer; M, monomer. Blots are representative of two independent biological replicates. (b) Comparison of the top 35 proteins identified with high confidence in C-terminal KCC2 antibody immunoprecipitations from CHAPS-based or C12E9-based membrane extractions. IgG-AP immunoprecipitations were performed as a control. Heat maps represent log scale spectral counts of individual proteins per condition, expressed relative to global spectral counts. Unique peptides corresponding to KCC2 (indicated in red font) were most abundant in both conditions, confirming the specificity of the C-terminal antibody. Previously identified KCC2 interacting partners are identified by asterisks. Proteins in green represent those that commonly co-precipitated with KCC2 regardless of the detergent extraction.
-
Figure 1—source data 1
Proteins enriched in KCC2-AP using CHAPS vs C12E9.
- https://doi.org/10.7554/eLife.28270.006
Figure 1—figure supplement 1
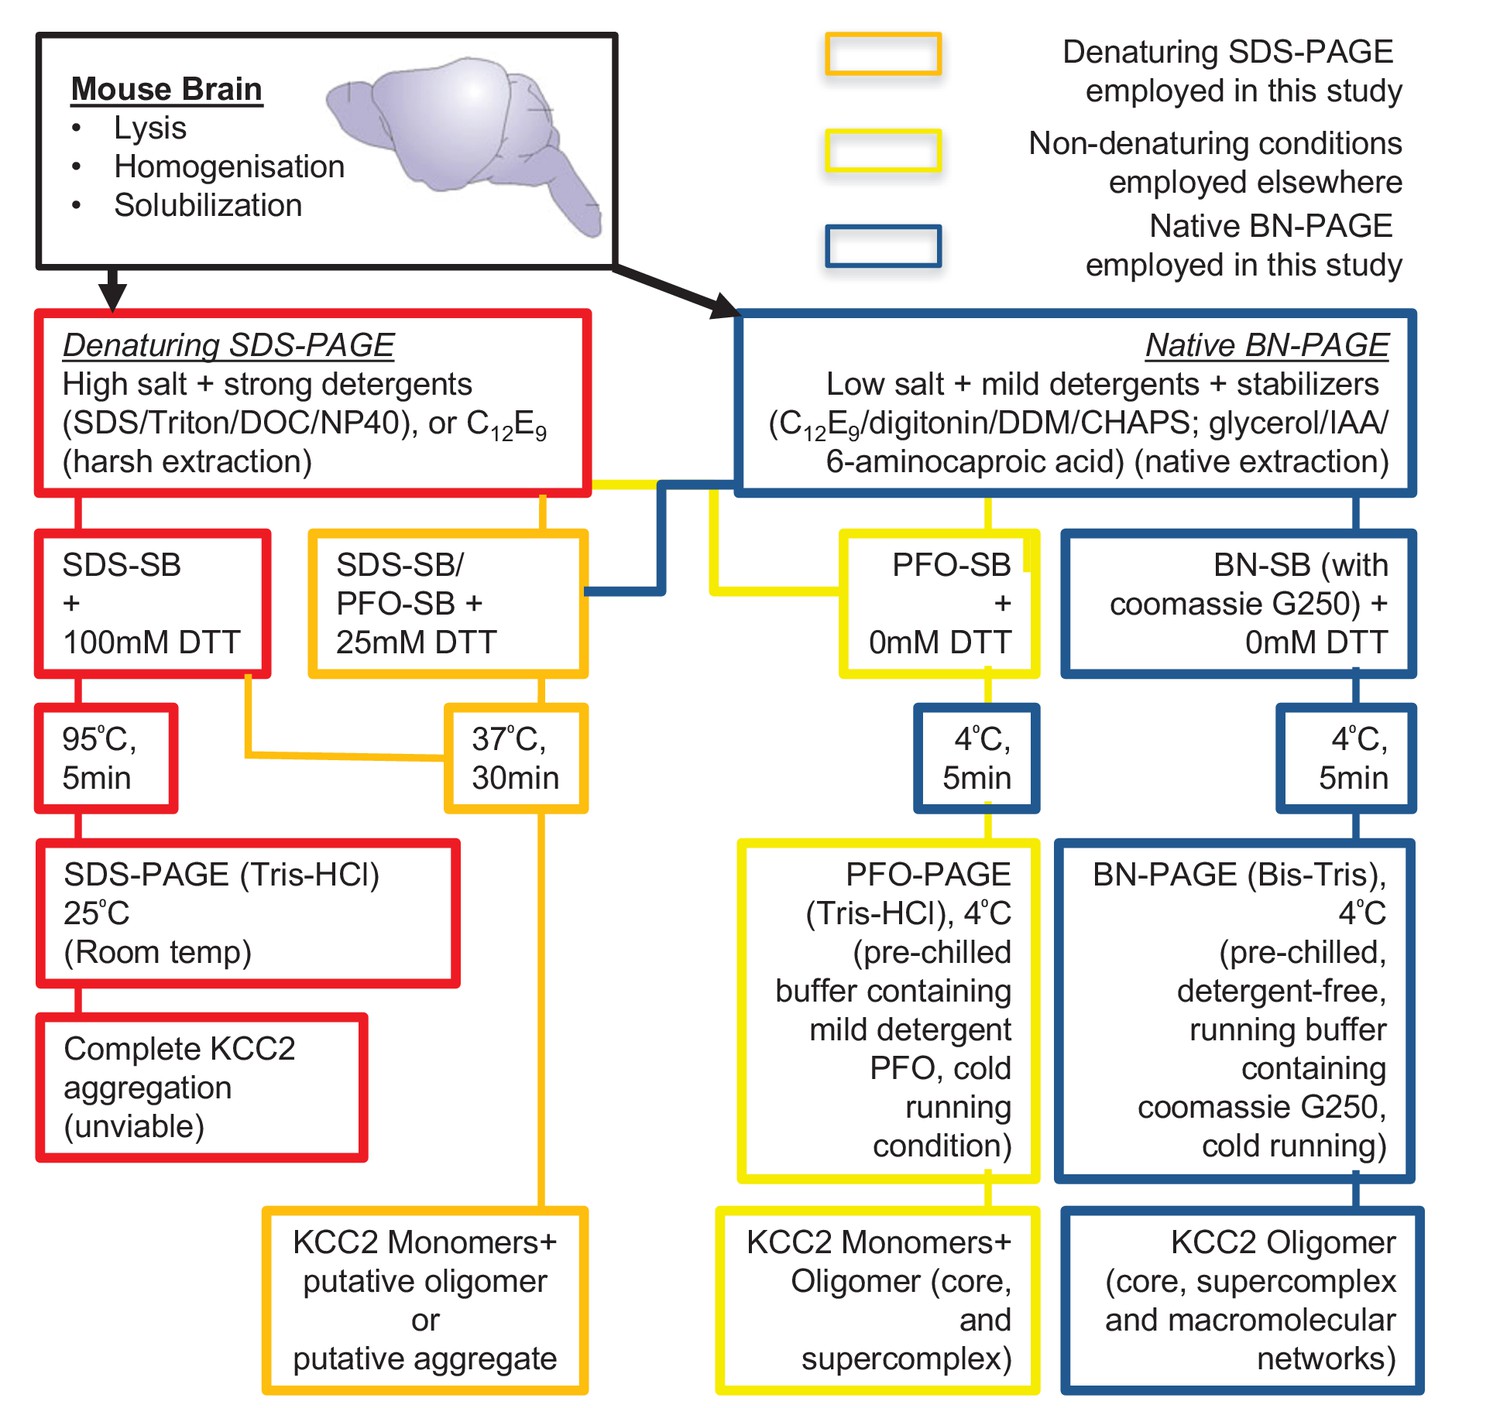
Workflow to enrich KCC2 complexes.
SDS, sodium dodecyl sulfate; DOC, deoxycholate; NP40, Igepal-CA630; C12E9, nonaethylene glycol monododecyl ether; DDM, n-dodecyl-β-D-maltoside; PFO, perfluoro-octanoic acid; IAA, Iodoacetmide; BN, blue-native; SB, sample buffer for gel loading. RED/ORANGE lines and boxes indicate harsh KCC2 extraction conditions; YELLOW lines and boxes indicate intermediary KCC2 extraction conditions; BLUE lines and boxes indicate mild, native-KCC2 extraction conditions. The orange and yellow extraction/gel running strategies were employed for studying the stability of KCC2 oligomers (by subjecting them to harsh-to-mildly denaturing conditions). The blue extraction/gel running conditions were employed to study the composition of native-KCC2-oligomers.
Figure 1—figure supplement 2
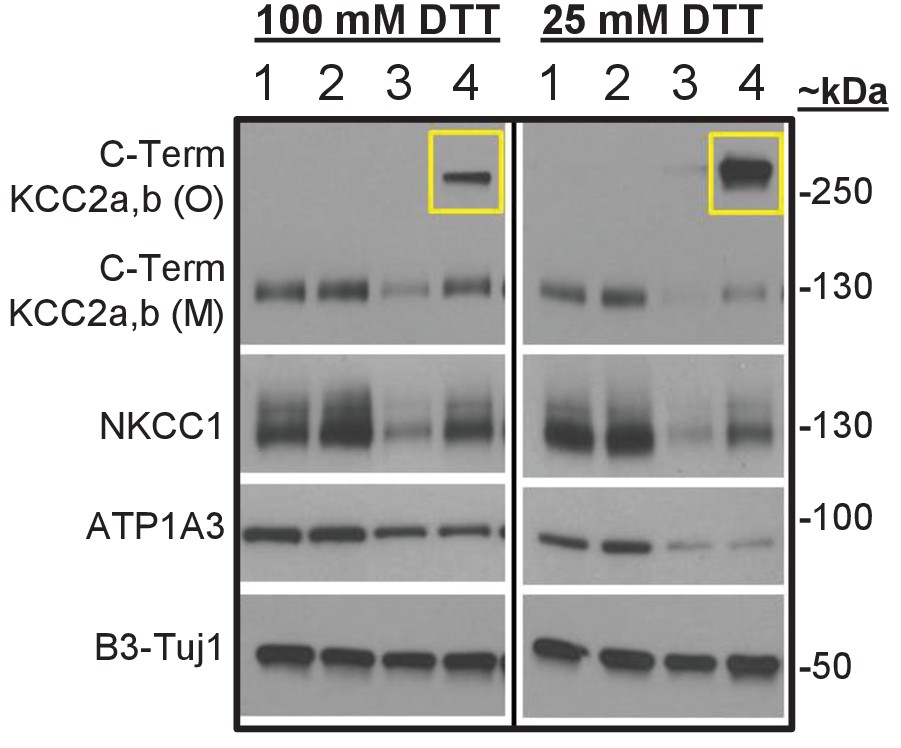
SDS-PAGE separation of solubilized membrane fractions.
Obtained with high-salt Tris-HCl buffer containing the following detergents (lane1: 1%Triton, 1%DOC; lane 2: 0.1%SDS, 0.5%DOC, 1%NP40 (RIPA); lane 3: 1%NP40 and lane 4: 1.5% C12E9). Samples were denatured in SDS-sample buffer containing 100 mM DTT or 25 mM DTT, @ 37⁰C for 30 min. Yellow-boxes indicate that C12E9-based native detergent enriches for more putative-KCC2 oligomers than the previously published KCC2 detergent extractions (lanes 1–3); and that the putative KCC2 oligomers are DTT-sensitive.
Figure 2 with 1 supplement
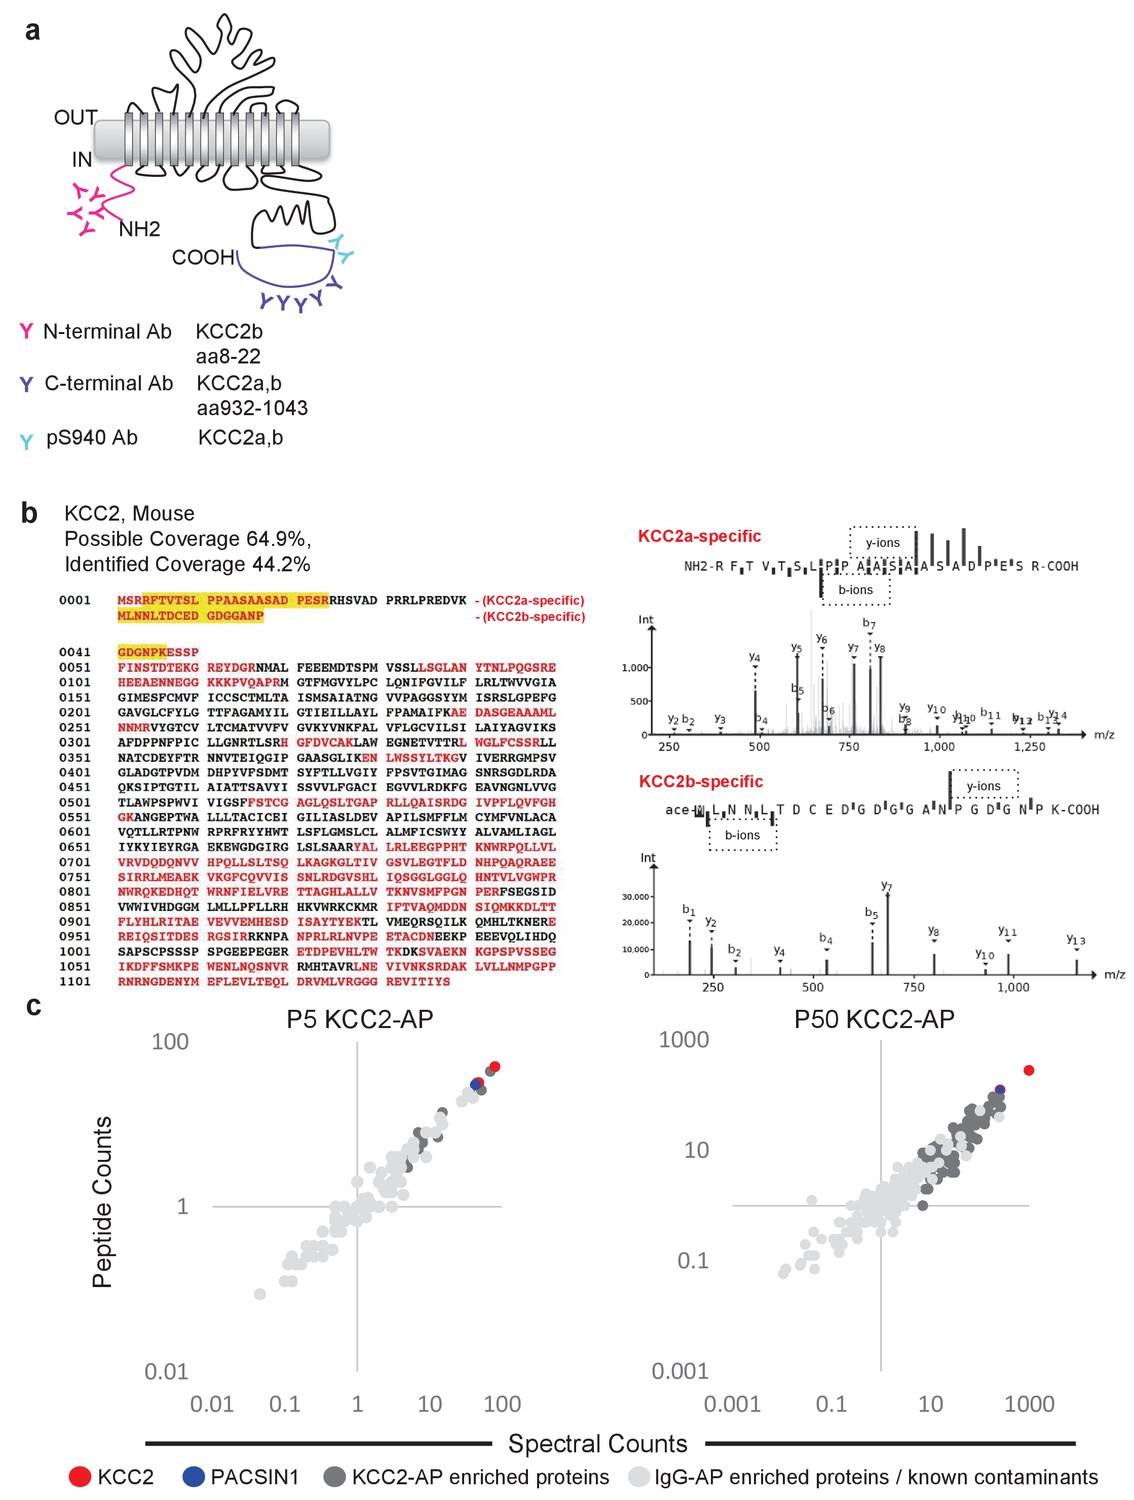
Multi-epitope AP identifies native-KCC2 protein constituents in mouse brain.
(a) Schematic of the locations of anti-KCC2 antibodies. (b) The primary KCC2 amino acid sequence. Red indicates the protein coverage of KCC2 identified by MS analysis; yellow indicates unique coverage for KCC2a and KCC2b isoforms. MS/MS- spectra of peptides unique for KCC2a and KCC2b. Right: the MS/MS ion fragmentation of the corresponding amino acid sequence is indicated above the spectra. (c) Spectral and peptide count plots of proteins in AP with all three anti-KCC2 antibodies in developing brain membrane fractions (P5, left) and adult brain membrane fractions (P50, right). Peptide and spectral counts are normalized (anti-KCC2/IgG) and plotted on a log scale. Red circles - highly enriched KCC2 bait. Blue circles - highly enriched PACSIN1 target peptides. Dark-grey circles - top proteins enriched with KCC2-AP in comparison to IgG control-AP. Light-grey circles - proteins enriched in IgG control-AP in comparison to KCC2-AP and known spurious interactors.
-
Figure 2—source data 1
LC/MS replicates.
- https://doi.org/10.7554/eLife.28270.009
Figure 2—figure supplement 1

Validation of KCC2 antibodies for immunodepletion.
Native KCC2 complexes from C12E9-solubilized whole-brain membrane fractions immunoprecipitated with pre-immune sera or anti-N-terminal KCC2b antibody (a) or anti-pSer940 KCC2 antibody (b) and immunoblotted with the antibodies indicated at right (C-terminal KCC2 antibody). Representative example of five biological replicates. IP, immunoprecipitate; I, input fraction (1% of IP); U. unbound fraction (1%of IP); O. oligomer; M. monomer.
Figure 3 with 2 supplements
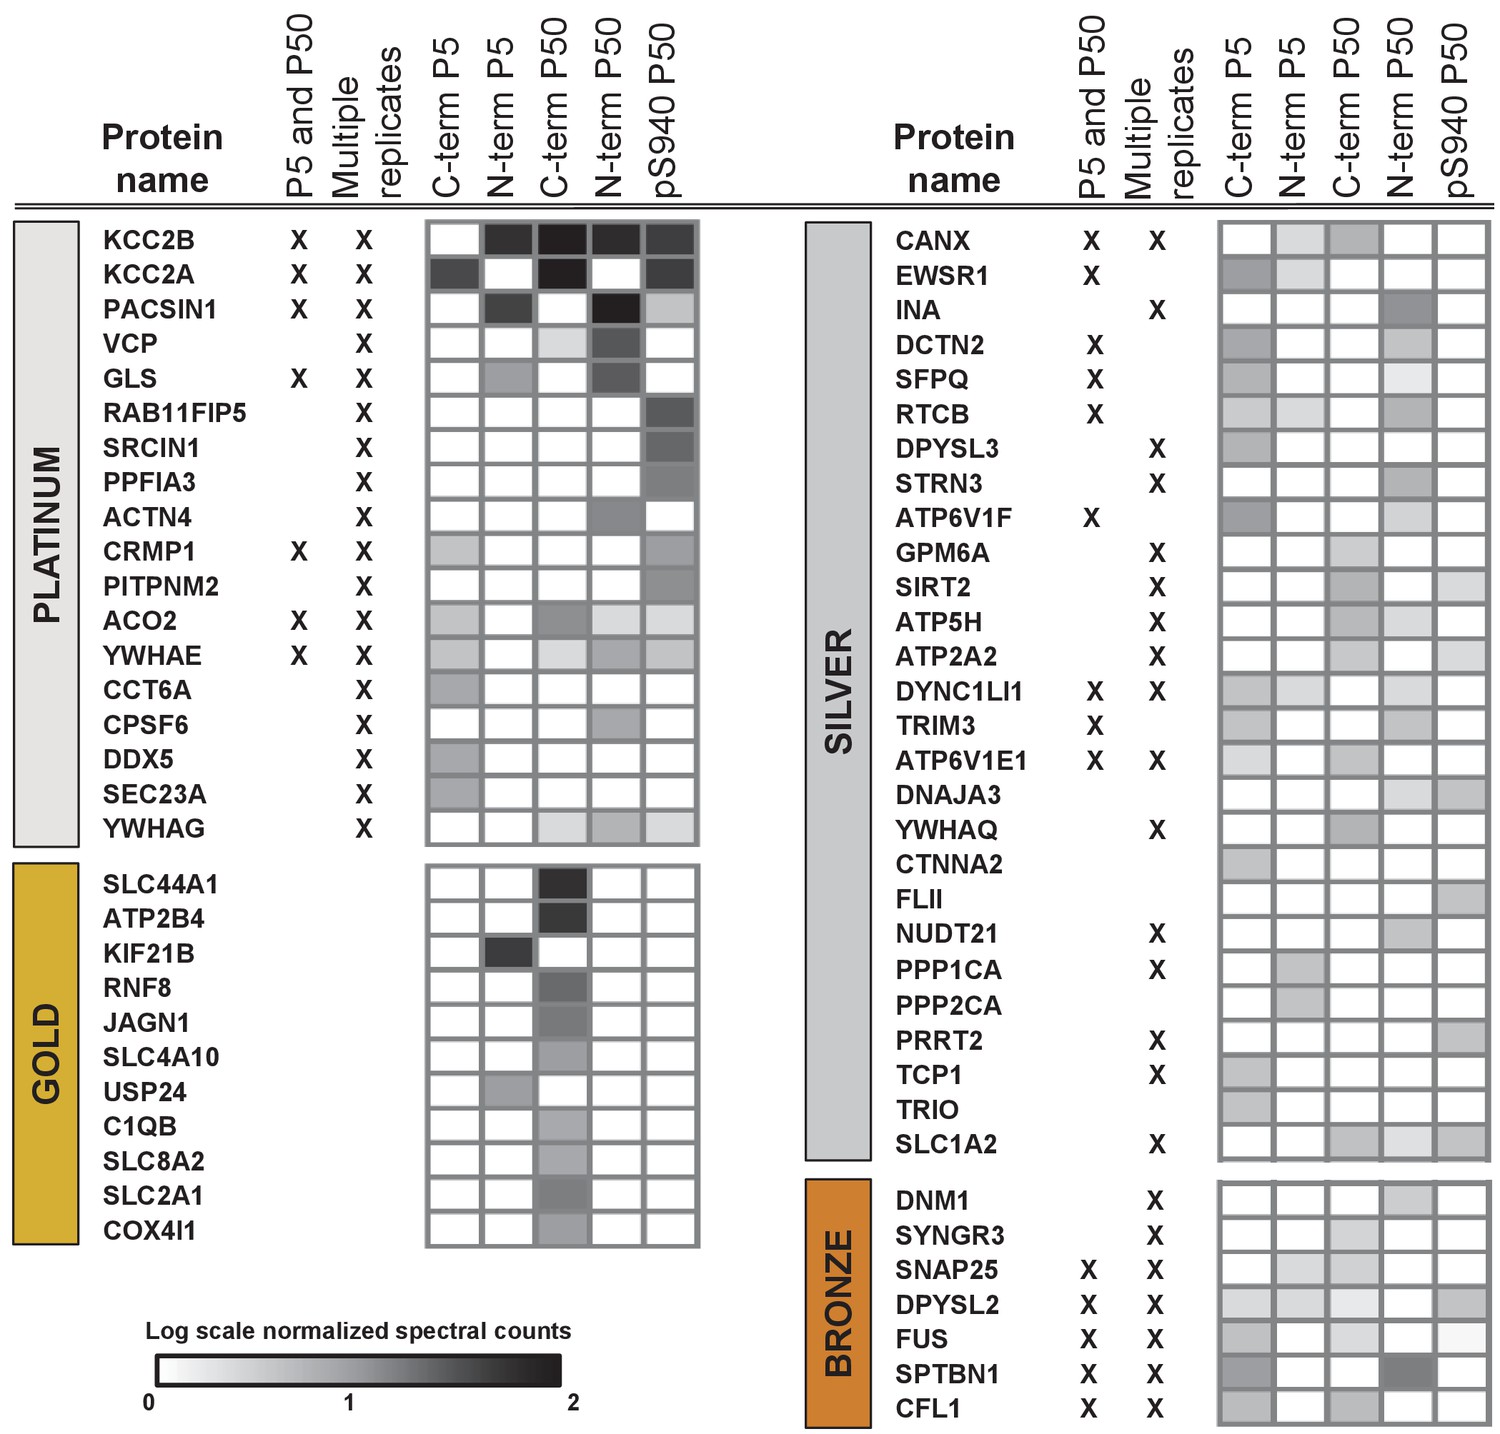
ME-AP reveals distinct KCC2 constituents in developing and mature brain.
Summary of the top 70 proteins identified with high confidence across KCC2-ME AP in the developing and mature brain. PLATINUM interactors: proteins enriched in a minimum of 2/3 replicates, and show 5 + fold spectral enrichment. GOLD interactors: proteins with 5 + fold spectral enrichment in one replicate. SILVER interactors: 3–5 fold spectral enrichment; BRONZE interactors: 1.5–3 fold spectral enrichment. Enrichment is in KCC2-AP in comparison with IgG-AP. Heat map represents log scale spectral enrichment of individual proteins per antibody condition, relative to respective control conditions. See Table 1 for a list of the transmembrane and soluble KCC2 interactors. .
-
Figure 3—source data 1
All validated peptide-spectrum matches for KCC2-AP and IgG-AP.
- https://doi.org/10.7554/eLife.28270.013
-
Figure 3—source data 2
Top CRAPome members that appear at 50% frequency.
- https://doi.org/10.7554/eLife.28270.014
-
Figure 3—source data 3
KCC2 interactors identified in AP/MS categorized into platinum, gold, silver, and bronze.
- https://doi.org/10.7554/eLife.28270.015
-
Figure 3—source data 4
Previously established KCC2 partners not identified in the present screen.
- https://doi.org/10.7554/eLife.28270.016
Figure 3—figure supplement 1
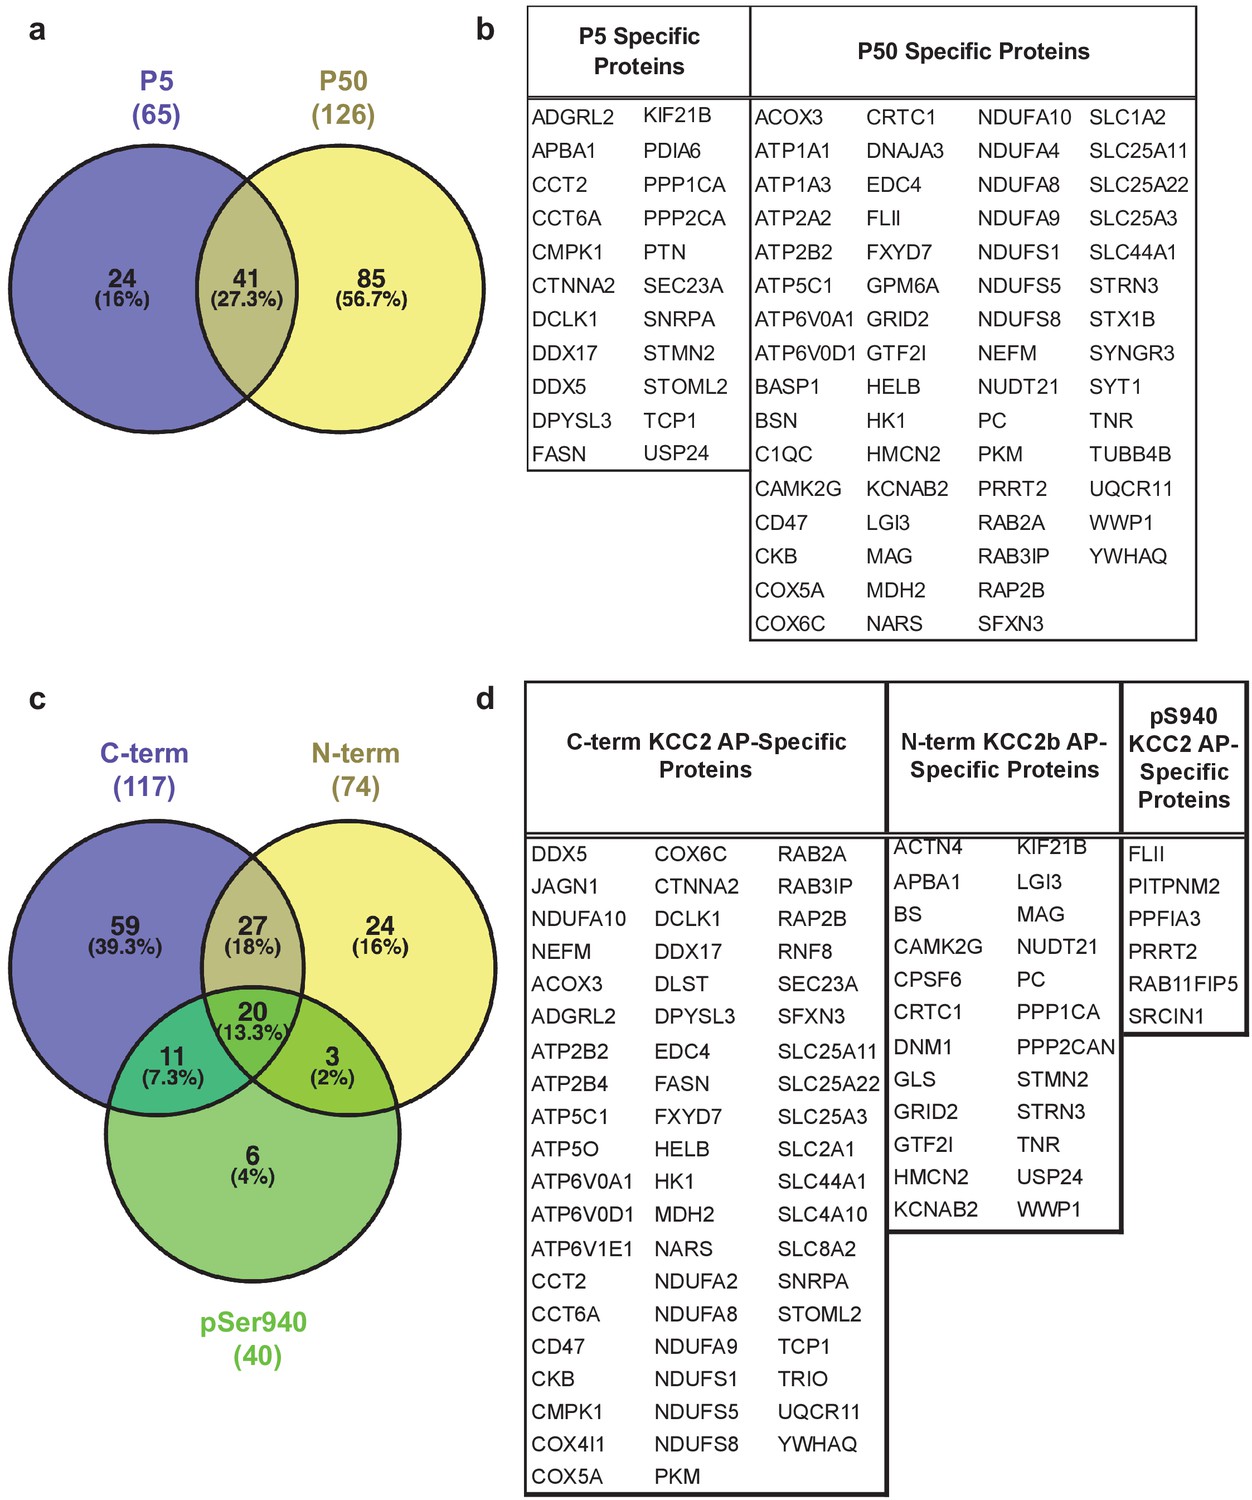
ME-AP proteomics identify the protein constituents of native KCC2.
(a) Venn diagram comparison of the intersection of data obtained using N-term and C-term antibodies in developing and mature brain. (b) Proteins that appear exclusively with P5 or P50 KCC2-immunoprecipitates. (c) Similar to (a) but for data obtained using all three antibodies. (d) Proteins that appear exclusively to the individual KCC2 antibody.
Figure 3—figure supplement 2
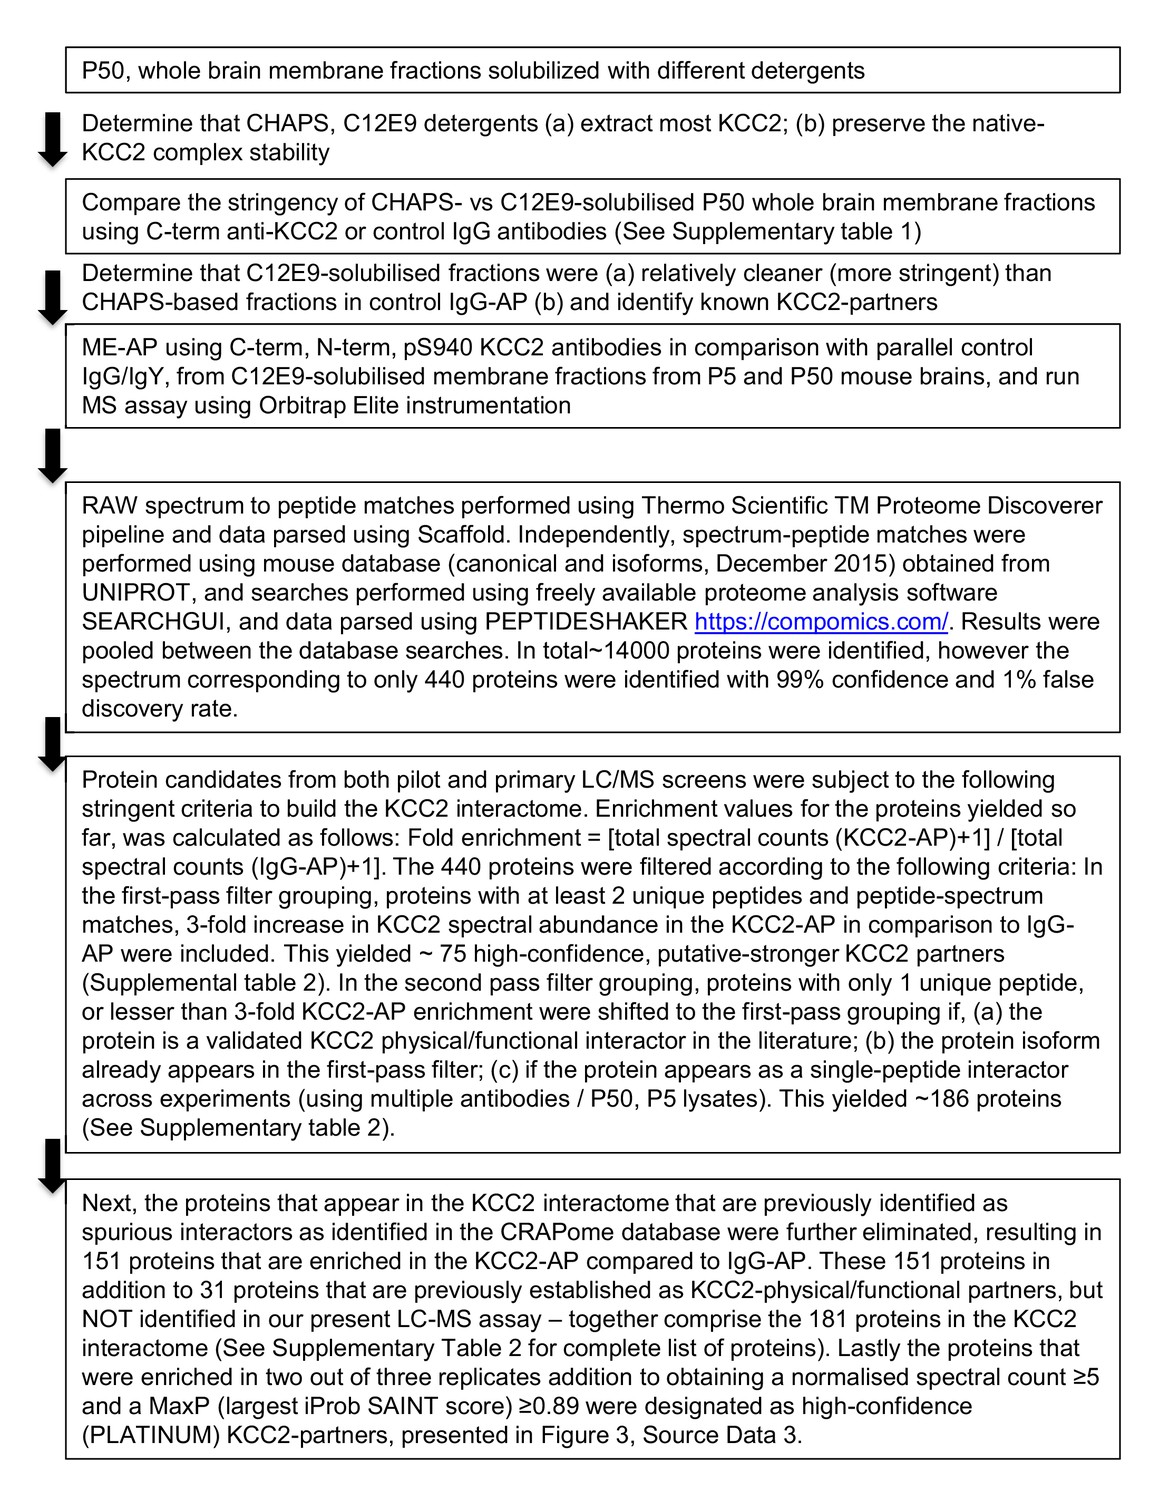
Workflow for curating the KCC2 interactome.
https://doi.org/10.7554/eLife.28270.012
Figure 4 with 1 supplement
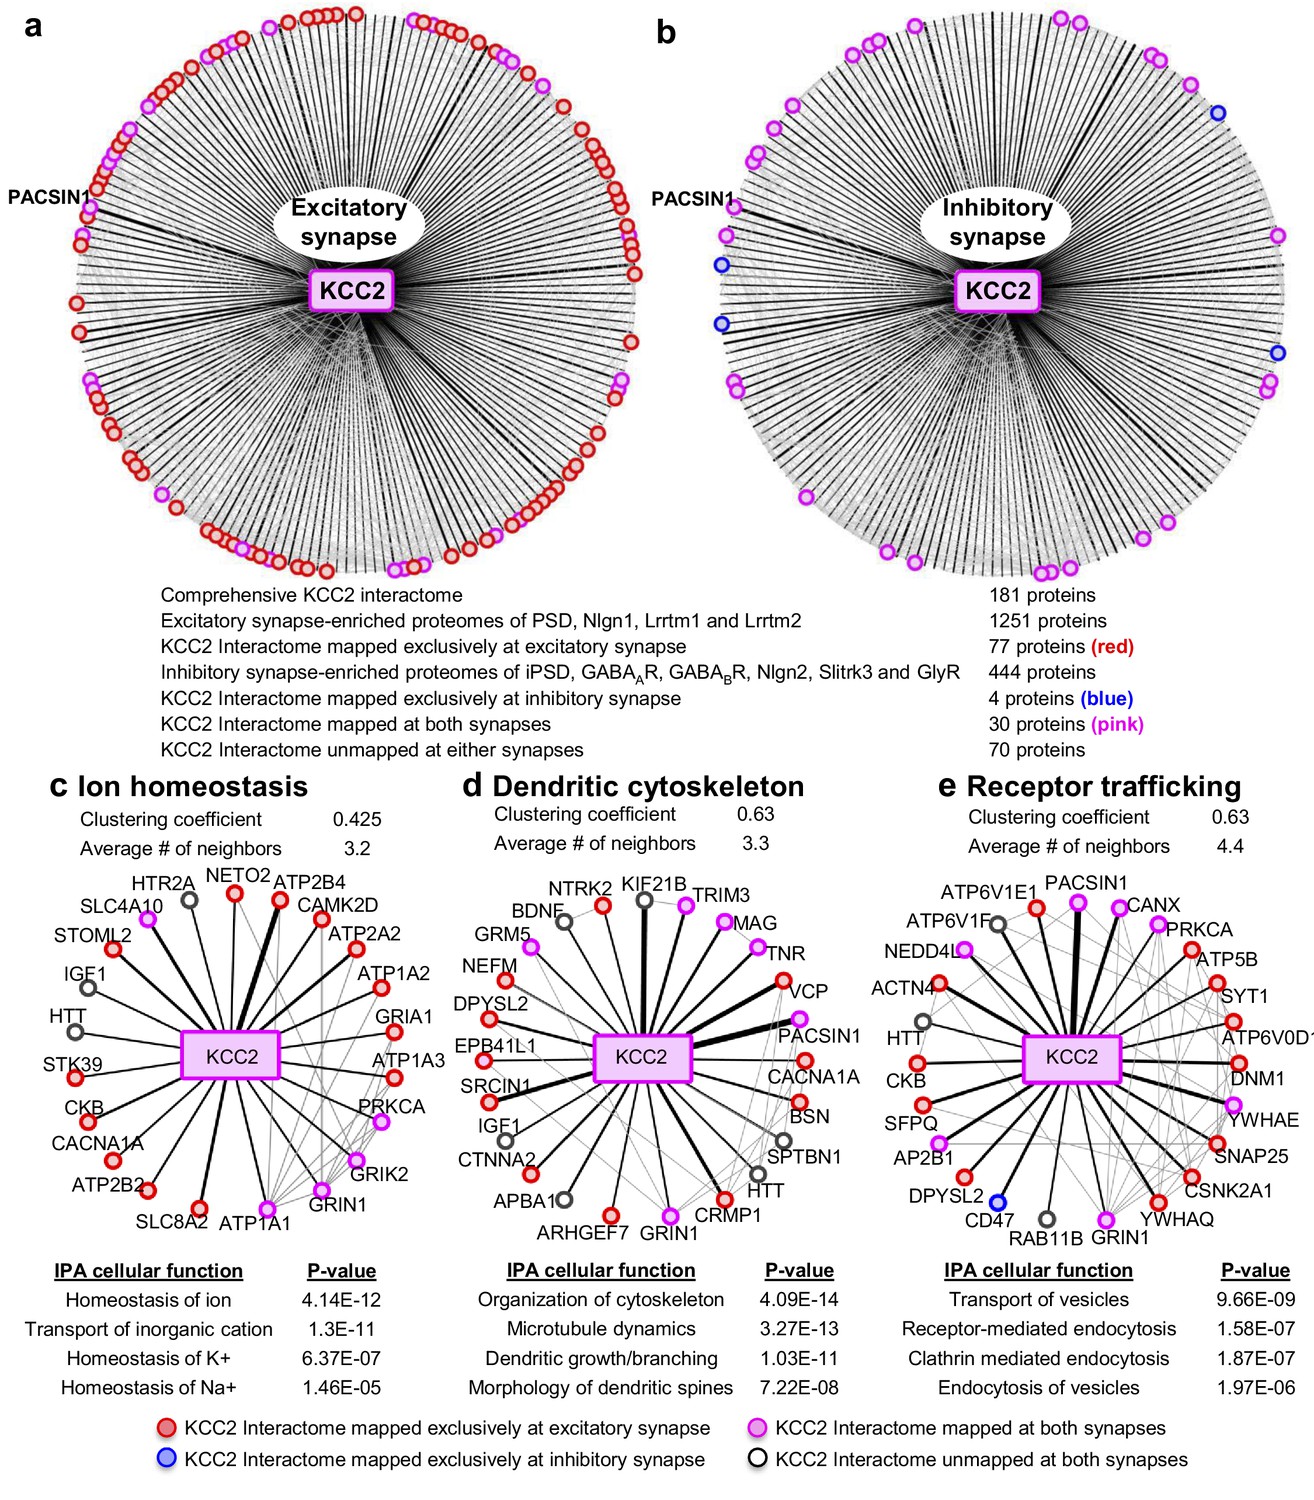
Members of the KCC2 interactome are highly represented at excitatory synapses.
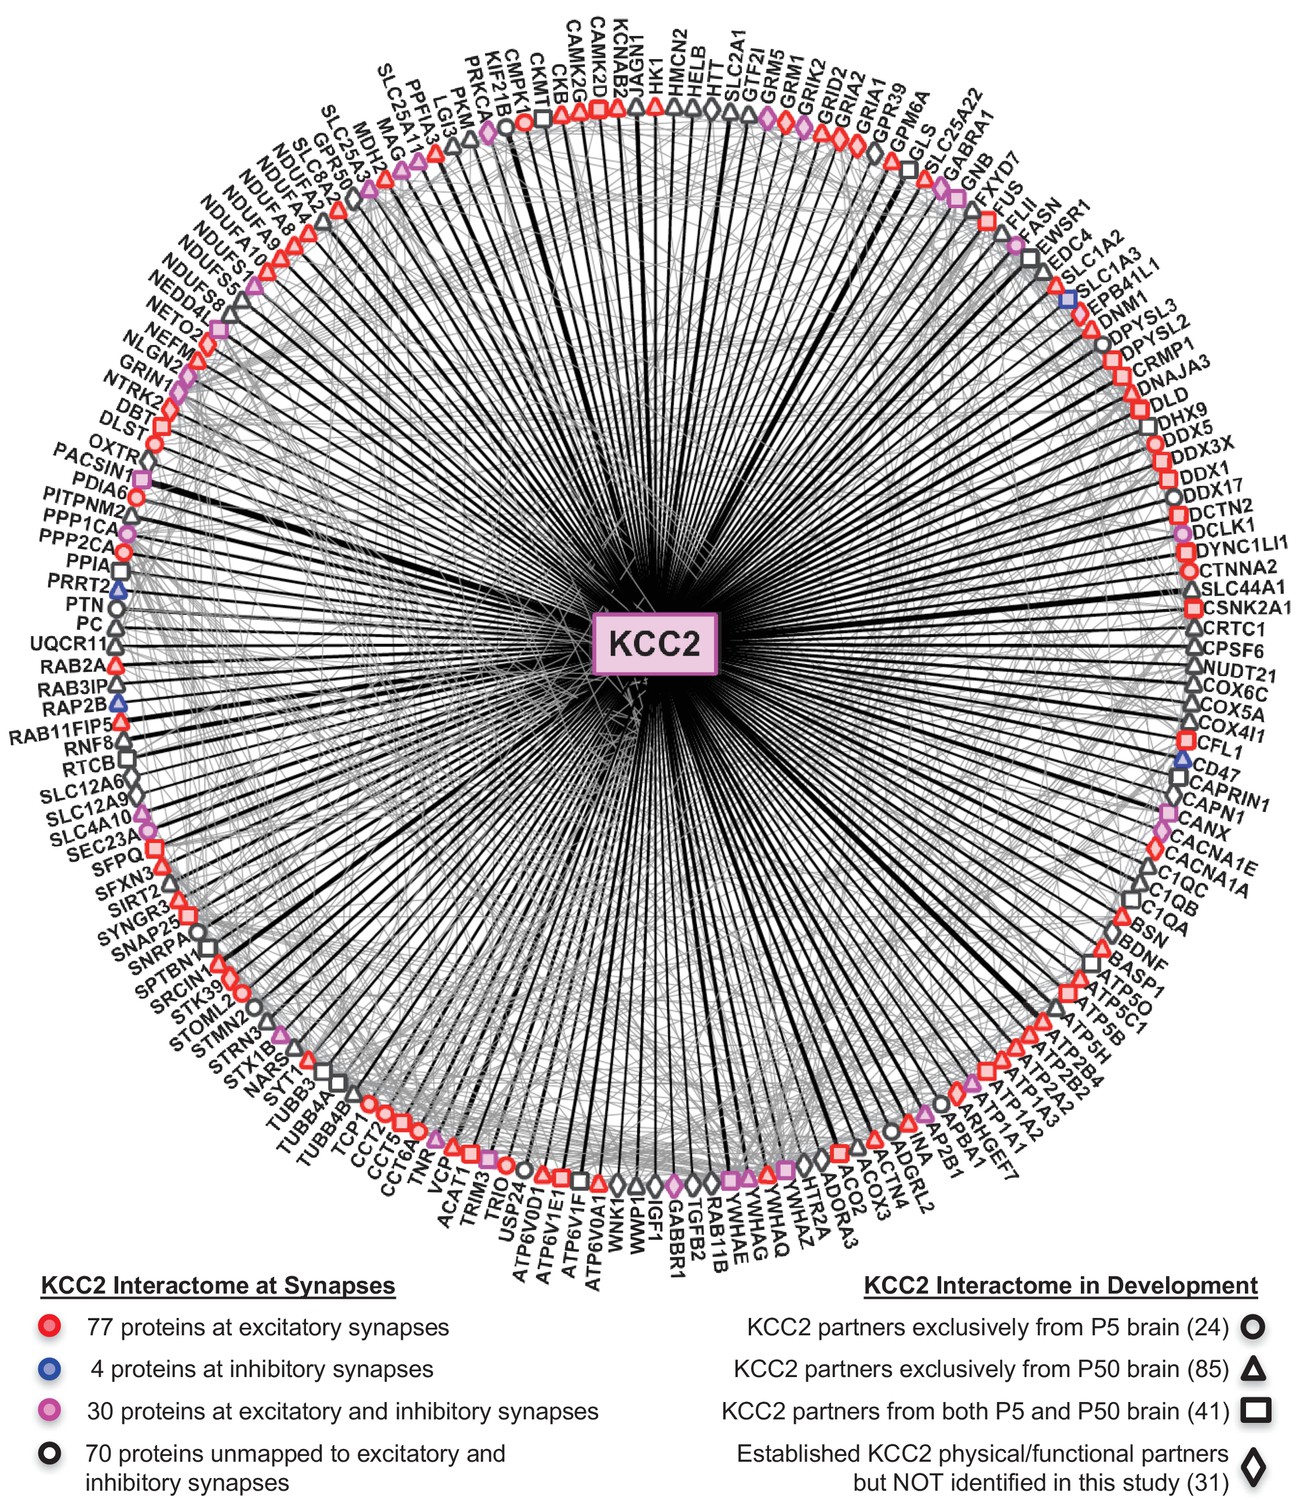
The KCC2 interactome mapped to (a) the excitatory synapse-enriched proteomes or, (b) the inhibitory synapse-enriched proteomes. The thickness of the black radial lines in the foreground denotes the number of spectral enrichment (KCC2/IgG) in the log scale. Grey radial lines in the background denotes the previously identified physical/co-expression networks across all interactome members. IPA revealing the members of the KCC2 interactome that are involved in (c) ion homeostasis, (d) dendritic cytoskeleton rearrangement and (e) recycling/endocytosis/trafficking. The following source data and figure supplements are available for Figure 4.
-
Figure 4—source data 1
Interactome mapping at excitatory and inhibitory synapses.
- https://doi.org/10.7554/eLife.28270.020
-
Figure 4—source data 2
Ingenuity pathway analysis.
- https://doi.org/10.7554/eLife.28270.021
Figure 4—figure supplement 1
The SLC12A5/KCC2 interactome.
The KCC2 interactome was mapped to the excitatory synapse-enriched proteomes, and the inhibitory synapse-enriched proteomes. Circle/triangle/square-shaped nodes represent the KCC2 partners identified in this present study; diamond-shaped nodes represent the KCC2 partners not identified, but previously established as physical/functional partners of KCC2. Red/blue/pink-filled nodes represent synaptic-KCC2 partners; uncolored nodes represent the putative-, non-synaptic KCC2 partners. The thickness of the radial lines represents the spectral enrichment (KCC2/IgG). See Figure 4—source data 1 for the complete list of all proteins used for mapping.
Figure 5 with 2 supplements

Characterization of the PACSIN1-KCC2 interaction.
(a) Spatiotemporal expression patterns of SLC12A5 and members of receptor trafficking node of the KCC2 interactome in the human brain; RNAseq data were analyzed in hippocampus. Pcw, postconceptual weeks. (b) Native KCC2 complexes from C12E9-solubilized whole-brain membrane fractions immunoprecipitated with IgY or anti-N-term KCC2 (left) and IgG or anti-PACSIN1 (right), and immunoblotted with antibodies as indicated. (c) Western blot analysis of developmental expression patterns of KCC2 and PACSIN1. (d) Antibody-shift assay followed by 2D-BN-PAGE separation using whole-brain membrane fractions, incubated with antibodies indicated on left; gel separations were immunoblotted with anti-KCC2 or PACSIN1 antibodies. (e) Coimmunoprecipitation performed in COS7 cells transfected with myc-tagged KCC2b and GFP-tagged PACSIN1/2/3 constructs, immunoprecipitated with anti-N-term KCC2b, and immunoblotted with the antibodies indicated at right. (f) Immunoblot of immunoprecipitates from transfected COS7 cell lysates. * indicate the lanes where PACSIN1 lacks the variable region between ~aa325-383. # of independent biological replicates are indicated in parenthesis: Figure 5e (4), Figure 5f (3), Figures 5b,c,d (2).
-
Figure 5—source data 1
Human brain RNAseq data from the Allan Brain Atlas for receptor trafficking node.
- https://doi.org/10.7554/eLife.28270.025
Figure 5—figure supplement 1

Spatiotemporal expression patterns of SLC12A5 and members of receptor trafficking node of the KCC2 interactome in the human brain.
The RNAseq data were analyzed for the above members across five brain regions including Amygdala, Striatum, Thalamus, Cerebellum, and the ganglionic eminences at eight different developmental periods.
Figure 5—figure supplement 2

The primary amino acid sequence coverage of PACSIN1 (left), and protein coverage of PACSIN1 identified by MS analysis are indicated in red.
MS/MS- spectra of a peptide unique for PACSIN1, highlighted in yellow. The MS/MS ion fragmentation of the corresponding amino acid sequence is indicated above the spectra (right).
Figure 6 with 1 supplement
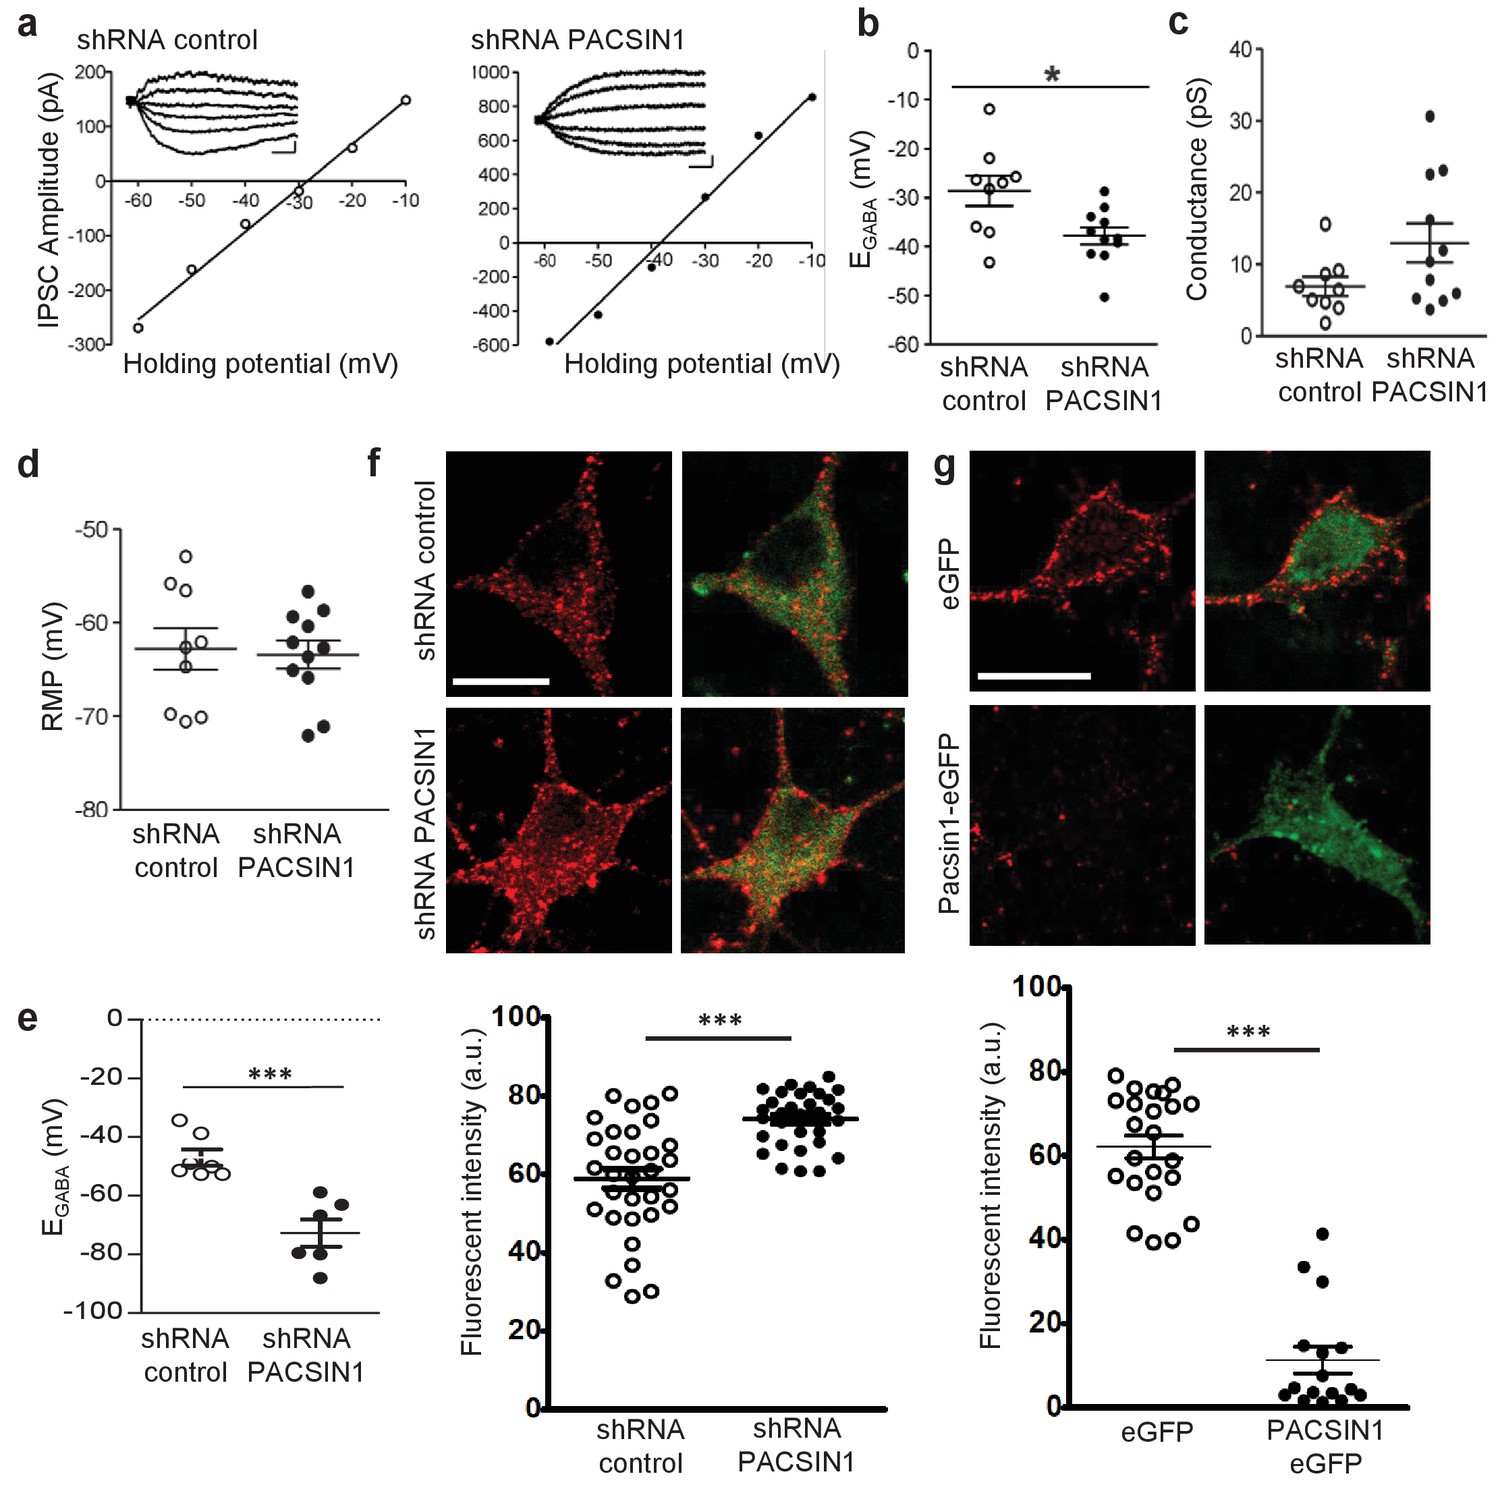
PACSIN1 is a negative regulator of KCC2 expression and function.
(a) Example IV curves measuring EGABA using Cl--loading through whole-cell configuration from cultured hippocampal neurons. Neurons were transduced with either control shRNA (n = 9; left) or PACSIN1 shRNA (n = 11; right). Summary of (b) EGABA, (c) synaptic conductance, and (d) RMP from all experiments similar to the examples in a. (e) Summary of EGABA recordings obtained by gramicidin-perforated patch clamp recordings. (f) Example confocal microscopic immunofluorescent images from cultured hippocampal neurons transduced with control shRNA (n = 32) or PACSIN1 shRNA (n = 32) and stained with anti-KCC2 (red; scale bar, 10 μm); green immunostain reports transfection. Below: summary of fluorescence intensities. (g) Similar to f, except neurons were transduced with either control eGFP (n = 23) or PACSIN1-eGFP (n = 16). n values for all experiments on cultured neurons were obtained from a minimum of three independent sets of cultures. Statistical significance was determined using student’s t-tests (two-tailed); *p<0.05, ***p<0.001. For all summary plots, the error bars denote mean ± sem. The following figure supplements is available for Figure 6.
Figure 6—figure supplement 1
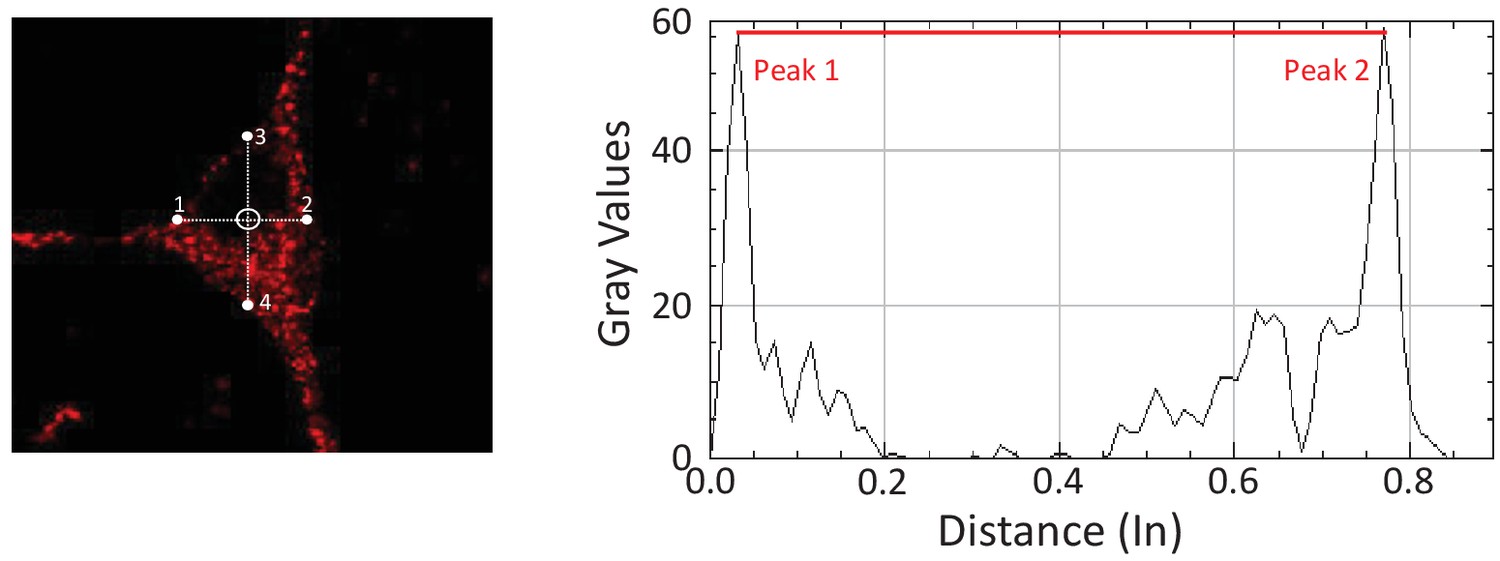
Example illustrating the calculation of fluorescence intensity.
Left, using ImageJ, four bisecting lines were drawn across the center of the cell. Right, the peak values of each line (2 values/line) were used to calculate peak fluorescent intensity of KCC2 at the membrane.
Tables
Table 1
KCC2 protein partners identified by ME-APs
https://doi.org/10.7554/eLife.28270.017| Protein name | UniProt ID | Spectral ratio | MaxP | ES | IS | P5 | P50 | pS940 |
|---|---|---|---|---|---|---|---|---|
| KCC2b | Q91V14-2 | 349.0 | 1 | X | X | X | X | X |
| KCC2a | Q91V14-1 | 203.8 | 1 | X | X | X | X | X |
| PACSIN1 | Q61644 | 136.0 | 1 | X | X | X | X | X |
| SLC44A1 | Q6X893 | 54.0 | 1 | X | ||||
| ATP2B4 | Q6Q477 | 44.0 | 1 | X | X | |||
| KIF21B | Q9QXL1 | 41.0 | 1 | X | ||||
| VCP | Q01853 | 24.0 | 1 | X | X | |||
| GLS | D3Z7P3 | 23.5 | 1 | X | X | |||
| RAB11FIP5 | Q8R361 | 22.0 | 1 | X | X | X | ||
| SRCIN1 | Q9QWI6 | 17.0 | 1 | X | X | X | ||
| RNF8 | Q8VC56 | 16.0 | 1 | X | ||||
| JAGN1 | Q5XKN4 | 12.0 | 1 | X | ||||
| PPFIA3 | P60469 | 11.0 | 1 | X | X | X | ||
| SLC2A1 | P17809 | 11.0 | 0.96 | X | ||||
| YWHAE | P62259 | 10.0 | 0.99 | X | X | X | X | X |
| ACTN4 | P57780 | 9.0 | 1 | X | X | |||
| CRMP1 | P97427 | 8.0 | 1 | X | X | X | X | |
| PITPNM2 | Q6ZPQ6 | 8.0 | 1 | X | X | |||
| ACO2 | Q99KI0 | 7.0 | 1 | X | X | X | X | |
| COX4I1 | P19783 | 6.0 | 0.96 | X | ||||
| SLC4A10 | Q5DTL9 | 6.0 | 1 | X | X | X | ||
| USP24 | B1AY13 | 6.0 | 1 | X | ||||
| YWHAG | P61982 | 6.0 | 0.96 | X | X | X | X | |
| C1QB | P14106 | 5.0 | 0.89 | X | X | |||
| CCT6A | P80317 | 5.0 | 0.99 | X | X | |||
| CPSF6 | Q6NVF9 | 5.0 | 0.99 | X | ||||
| DDX5 | Q61656 | 5.0 | 0.99 | X | X | |||
| DYNC1LI1 | Q8R1Q8 | 5.0 | 0.78 | X | X | X | ||
| SEC23A | Q01405 | 5.0 | 0.99 | X | X | X | ||
| SLC8A2 | Q8K596 | 5.0 | 0.99 | X | X | |||
| TRIM3 | Q9R1R2 | 5.0 | 0.78 | X | X | X | X | |
| CANX | P35564 | 4.5 | 1 | X | X | X | X | |
| ATP5H | Q9DCX2 | 4.0 | 0.81 | X | ||||
| ATP6V1E1 | P50518 | 4.0 | 0.78 | X | X | X | ||
| DDX17 | Q501J6 | 4.0 | 0.96 | X | ||||
| DNAJA3 | Q99M87 | 4.0 | 0.78 | X | X | X | ||
| DPYSL3 | Q62188 | 4.0 | 0.96 | X | ||||
| EWSR1 | Q61545 | 4.0 | 1 | X | X | X | ||
| MAG | P20917 | 4.0 | 0.96 | X | X | X | ||
| MDH2 | P08249 | 4.0 | 0.96 | X | X | |||
| RTCB | Q99LF4 | 4.0 | 0.98 | X | X | |||
| SNRPA | Q62189 | 4.0 | 0.96 | X | ||||
| STOML2 | Q99JB2 | 4.0 | 0.96 | X | X | |||
| STRN3 | Q9ERG2 | 4.0 | 0.96 | X | ||||
| YWHAQ | P68254 | 4.0 | 0.78 | X | X | |||
| INA | P46660 | 3.6 | 1 | X | X | |||
| ATP6V1F | Q9D1K2 | 3.5 | 0.95 | X | X | |||
| DCTN2 | Q99KJ8 | 3.5 | 1 | X | X | X | ||
| CD47 | Q61735 | 3.2 | 0.9 | X | X | |||
| ACOX3 | Q9EPL9 | 3.0 | 0.78 | X | ||||
| AP2B1 | Q9DBG3 | 3.0 | 1 | X | X | X | ||
| APBA1 | B2RUJ5 | 3.0 | 0.78 | X | ||||
| ATP2A2 | O55143 | 3.0 | 0.81 | X | X | X | ||
| CMPK1 | Q9DBP5 | 3.0 | 0.78 | X | X | |||
| CRTC1 | Q68ED7 | 3.0 | 0.78 | X | ||||
| CTNNA2 | Q61301 | 3.0 | 0.78 | X | X | |||
| FLII | Q9JJ28 | 3.0 | 0.78 | X | X | |||
| FXYD7 | P59648 | 3.0 | 0.78 | X | ||||
| GPM6A | P35802 | 3.0 | 0.93 | X | X | X | ||
| GRID2 | Q61625 | 3.0 | 0.78 | X | X | |||
| NARS | Q8BP47 | 3.0 | 0.78 | X | ||||
| NDUFA2 | Q9CQ75 | 3.0 | 1 | X | ||||
| NUDT21 | Q9CQF3 | 3.0 | 0.78 | X | ||||
| PPP1CA | P62137 | 3.0 | 0.78 | X | X | X | ||
| PPP2CA | P63330 | 3.0 | 0.78 | X | X | |||
| PRRT2 | E9PUL5 | 3.0 | 0.78 | X | X | X | ||
| SFPQ | Q8VIJ6 | 3.0 | 1 | X | X | X | ||
| SIRT2 | Q8VDQ8 | 3.0 | 0.89 | X | X | |||
| SLC1A2 | P43006 | 3.0 | 0.69 | X | X | X | ||
| TCP1 | P11983 | 3.0 | 0.78 | X | X | |||
| TRIO | Q0KL02 | 3.0 | 0.78 | X | X | |||
| PTN | P63089 | 2.7 | 1 | X | ||||
| RAB2A | P53994 | 2.7 | 0.84 | X | X | |||
| NDUFS5 | Q99LY9 | 2.5 | 0.82 | X | ||||
| CCT2 | P80314 | 2.5 | 1 | X | X | |||
| DNM1 | P39053 | 2.5 | 1 | X | X | |||
| SLC25A11 | Q9CR62 | 2.5 | 0.93 | X | X | X | ||
| DDX1 | Q91VR5 | 2.4 | 0.89 | X | X | X | ||
| NEDD4L | Q8CFI0 | 2.4 | 0.91 | X | X | X | X | |
| SYNGR3 | Q8R191 | 2.4 | 1 | X | X | X | ||
| DLD* | O08749 | 2.3 | 0.44 | X | X | X | X | |
| SNAP25 | P60879 | 2.3 | 0.65 | X | X | X | X | |
| DDX3X | Q62167 | 2.3 | 0.79 | X | X | X | X | |
| CAMK2G | Q923T9 | 2.3 | 1 | X | X | |||
| FASN | P19096 | 2.3 | 1 | X | X | X | ||
| PKM | P52480 | 2.2 | 0.85 | X | ||||
| NDUFA9 | Q9DC69 | 2.1 | 0.96 | X | X | |||
| BASP1 | Q91XV3 | 2.1 | 0.72 | X | X | X | ||
| CKB | Q04447 | 2.0 | 0.64 | X | X | |||
| COX6C | Q9CPQ1 | 2.0 | 0.89 | X | ||||
| CSNK2A1 | Q60737 | 2.0 | 0.84 | X | X | X | ||
| DHX9* | O70133 | 2.0 | 0.44 | X | X | |||
| DPYSL2 | O08553 | 2.0 | 0.97 | X | X | X | X | |
| EDC4 | Q3UJB9 | 2.0 | 1 | X | ||||
| FUS | P56959 | 2.0 | 0.94 | X | X | X | X | |
| KCNAB2 | P62482 | 2.0 | 0.92 | X | X | |||
| NDUFA8 | Q9DCJ5 | 2.0 | 0.96 | X | X | |||
| NDUFS8 | Q8K3J1 | 2.0 | 1 | X | ||||
| PDIA6 | Q922R8 | 2.0 | 0.89 | X | X | |||
| SFXN3* | Q91V61 | 2.0 | 0.44 | X | X | |||
| SLC25A22 | Q9D6M3 | 2.0 | 0.89 | X | X | |||
| STMN2 | P55821 | 2.0 | 1 | X | ||||
| TNR | Q8BYI9 | 2.0 | 1 | X | X | X | ||
| TUBB4B | P68372 | 1.9 | 0.55 | X | X | |||
| ATP5C1 | Q91VR2 | 1.9 | 0.6 | X | X | |||
| PPIA | P17742 | 1.8 | 0.74 | X | X | |||
| CKMT1 | P30275 | 1.8 | 0.86 | X | X | X | X | |
| COX5A | P12787 | 1.8 | 0.54 | X | ||||
| C1QC* | Q02105 | 1.8 | 0.43 | X | X | |||
| NDUFS1 | Q91VD9 | 1.8 | 0.88 | X | X | X | ||
| WWP1 | Q8BZZ3 | 1.8 | 0.88 | X | ||||
| ATP5B | P56480 | 1.7 | 0.38 | X | X | X | X | |
| CCT5 | P80316 | 1.7 | 0.81 | X | X | X | ||
| DCLK1 | Q9JLM8 | 1.7 | 0.96 | X | X | X | ||
| SLC25A3 | Q8VEM8 | 1.7 | 1 | X | X | X | ||
| SPTBN1 | Q62261 | 1.7 | 0.7 | X | X | |||
| TUBB3 | Q9ERD7 | 1.6 | 0.73 | X | X | X | ||
| CAMK2D | Q6PHZ2 | 1.6 | 0.82 | X | X | X | ||
| ATP6V0A1 | Q9Z1G4 | 1.5 | 0.92 | X | X | |||
| CFL1* | P18760 | 1.5 | 0.44 | X | X | X | ||
| ATP1A2* | Q6PIE5 | 1.5 | 0.04 | X | X | X | X | |
| ADGRL2 | Q8JZZ7 | 1.5 | 0.89 | X | ||||
| BSN | O88737 | 1.5 | 0.72 | X | X | |||
| DBT | P53395 | 1.5 | 0.86 | X | X | X | ||
| GTF2I | Q9ESZ8 | 1.5 | 0.89 | X | ||||
| HELB | Q6NVF4 | 1.5 | 0.89 | X | ||||
| HK1 | P17710 | 1.5 | 0.89 | X | X | |||
| HMCN2 | A2AJ76 | 1.5 | 0.89 | X | ||||
| LGI3 | Q8K406 | 1.5 | 0.89 | X | ||||
| PC | Q05920 | 1.5 | 0.89 | X | ||||
| RAB3IP | Q68EF0 | 1.5 | 0.89 | X | ||||
| UQCR11 | Q9CPX8 | 1.5 | 0.89 | X | ||||
| ATP1A1 | Q8VDN2 | 1.5 | 0.67 | X | X | X | X | |
| ATP5O | Q9DB20 | 1.5 | 0.71 | X | X | |||
| NDUFA4 | Q62425 | 1.4 | 0.51 | X | X | X | ||
| ATP6V0D1 | P51863 | 1.4 | 0.53 | X | X | |||
| ACAT1* | Q8QZT1 | 1.4 | 0.43 | X | X | X | ||
| ATP2B2* | Q9R0K7 | 1.4 | 0.47 | X | X | |||
| TUBB4A | Q9D6F9 | 1.4 | 0.64 | X | X | X | ||
| GNB1 | P62874 | 1.4 | 0.58 | X | X | X | X | X |
| C1QA | P98086 | 1.4 | 0.36 | X | X | |||
| NDUFA10 | Q99LC3 | 1.4 | 0.65 | X | X | |||
| RAP2B* | P61226 | 1.3 | 0.42 | X | X | |||
| SYT1 | P46096 | 1.3 | 0.65 | X | X | X | ||
| SLC1A3 | P56564 | 1.3 | 0.9 | X | X | X | ||
| CAPRIN1 | Q60865 | 1.3 | 0.56 | X | X | |||
| YWHAZ* | P63101 | 1.3 | 0.44 | X | X | X | X | X |
| ATP1A3* | Q6PIC6 | 1.3 | 0 | X | X | X | X | |
| STX1B* | P61264 | 1.3 | 0.45 | X | X | X | X | |
| NEFM | P08553 | 1.2 | 0.78 | X | X | |||
| DLST | Q9D2G2 | 1.2 | 0.72 | X | X |
-
Orange-Transmembrane.
Grey-Soluble.
-
Green-Secreted/Extracellular.
ES – excitatory synapse.
-
IS – inhibitory synapse.
Additional files
-
Transparent reporting form
- https://doi.org/10.7554/eLife.28270.028
Download links
A two-part list of links to download the article, or parts of the article, in various formats.
Downloads (link to download the article as PDF)
Open citations (links to open the citations from this article in various online reference manager services)
Cite this article (links to download the citations from this article in formats compatible with various reference manager tools)
Native KCC2 interactome reveals PACSIN1 as a critical regulator of synaptic inhibition
eLife 6:e28270.
https://doi.org/10.7554/eLife.28270


