Resolving the prevalence of somatic transposition in Drosophila
- The University of Oxford, United Kingdom
Figures
Figure 1
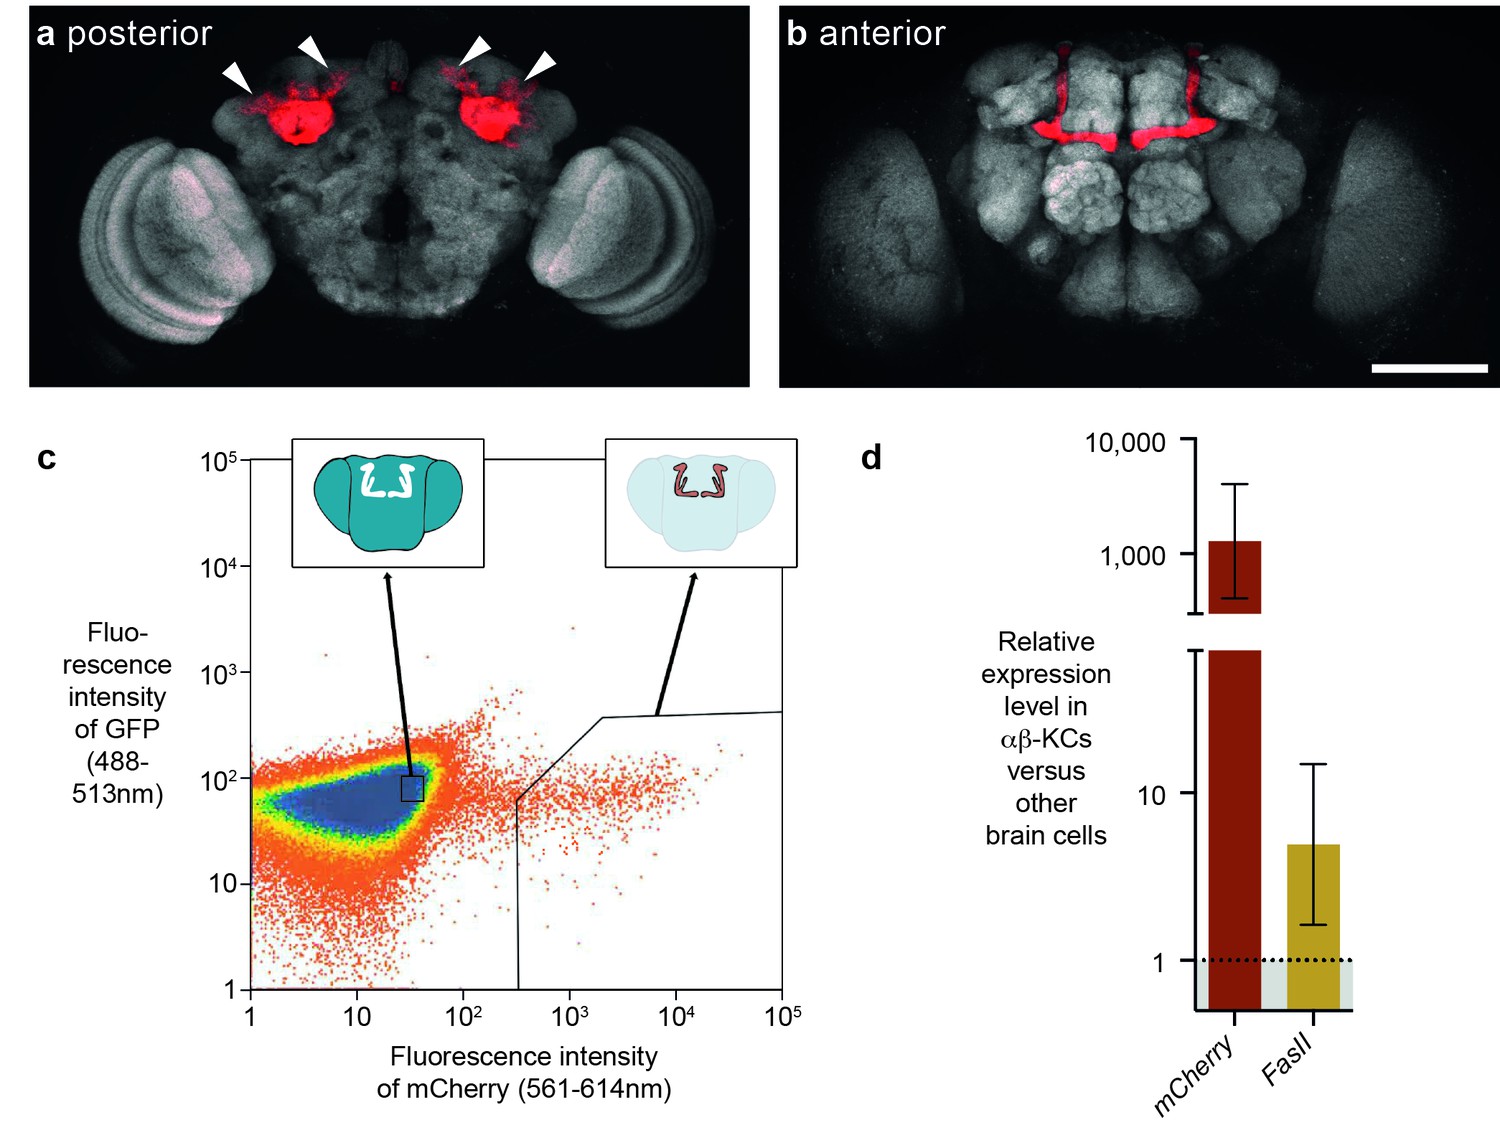
FACS strategy to extract αβ-Kenyon cells (αβ-KCs) from fly brains.
(a) Posterior projection view of a confocal microscope stack showing αβ-KC somata (arrow heads) in a female Mb008b-GAL4; UAS-mCherry fly brain. The general neuropil is stained with the anti-bruchpilot antibody nc82 (white) and red indicates αβ-KC mCherry expression. (b) Anterior projection from the same brain as in (a) showing axons of the mushroom body lobes of αβ-KCs in either brain hemisphere, which form distinct bilaterally symmetrical L-shaped projections into vertical and horizontal lobes. This lobe structure will be used in all schematic representations of the brain in the rest of this manuscript to indicate the source of each gDNA sample. Scale bar 100 µm. (c) Example plot from a FACS run of a single fly brain to illustrate the selection strategy used to sort mCherry-positive αβ-KCs from mCherry-negative cells in dissociated brain tissue. Sorting gates were hand-drawn, with the aim of selecting a pure proportion of mCherry αβ-KCs (right inset shows a simplified fly brain highlighting αβ-KCs) and a second population of similar size, from the mCherry negative cells in the rest of the brain (left inset). Single cells are represented as red points and areas of high-density are colored blue. The same gates were used for all samples in this study. (d) mCherry and FasII expression is elevated in mCherry positive cell fractions. Graph shows relative expression levels in FAC-sorted αβ-KCs as compared to that in unlabeled cells. Error bars denote standard error of the mean (SEM).
Figure 2 with 1 supplement
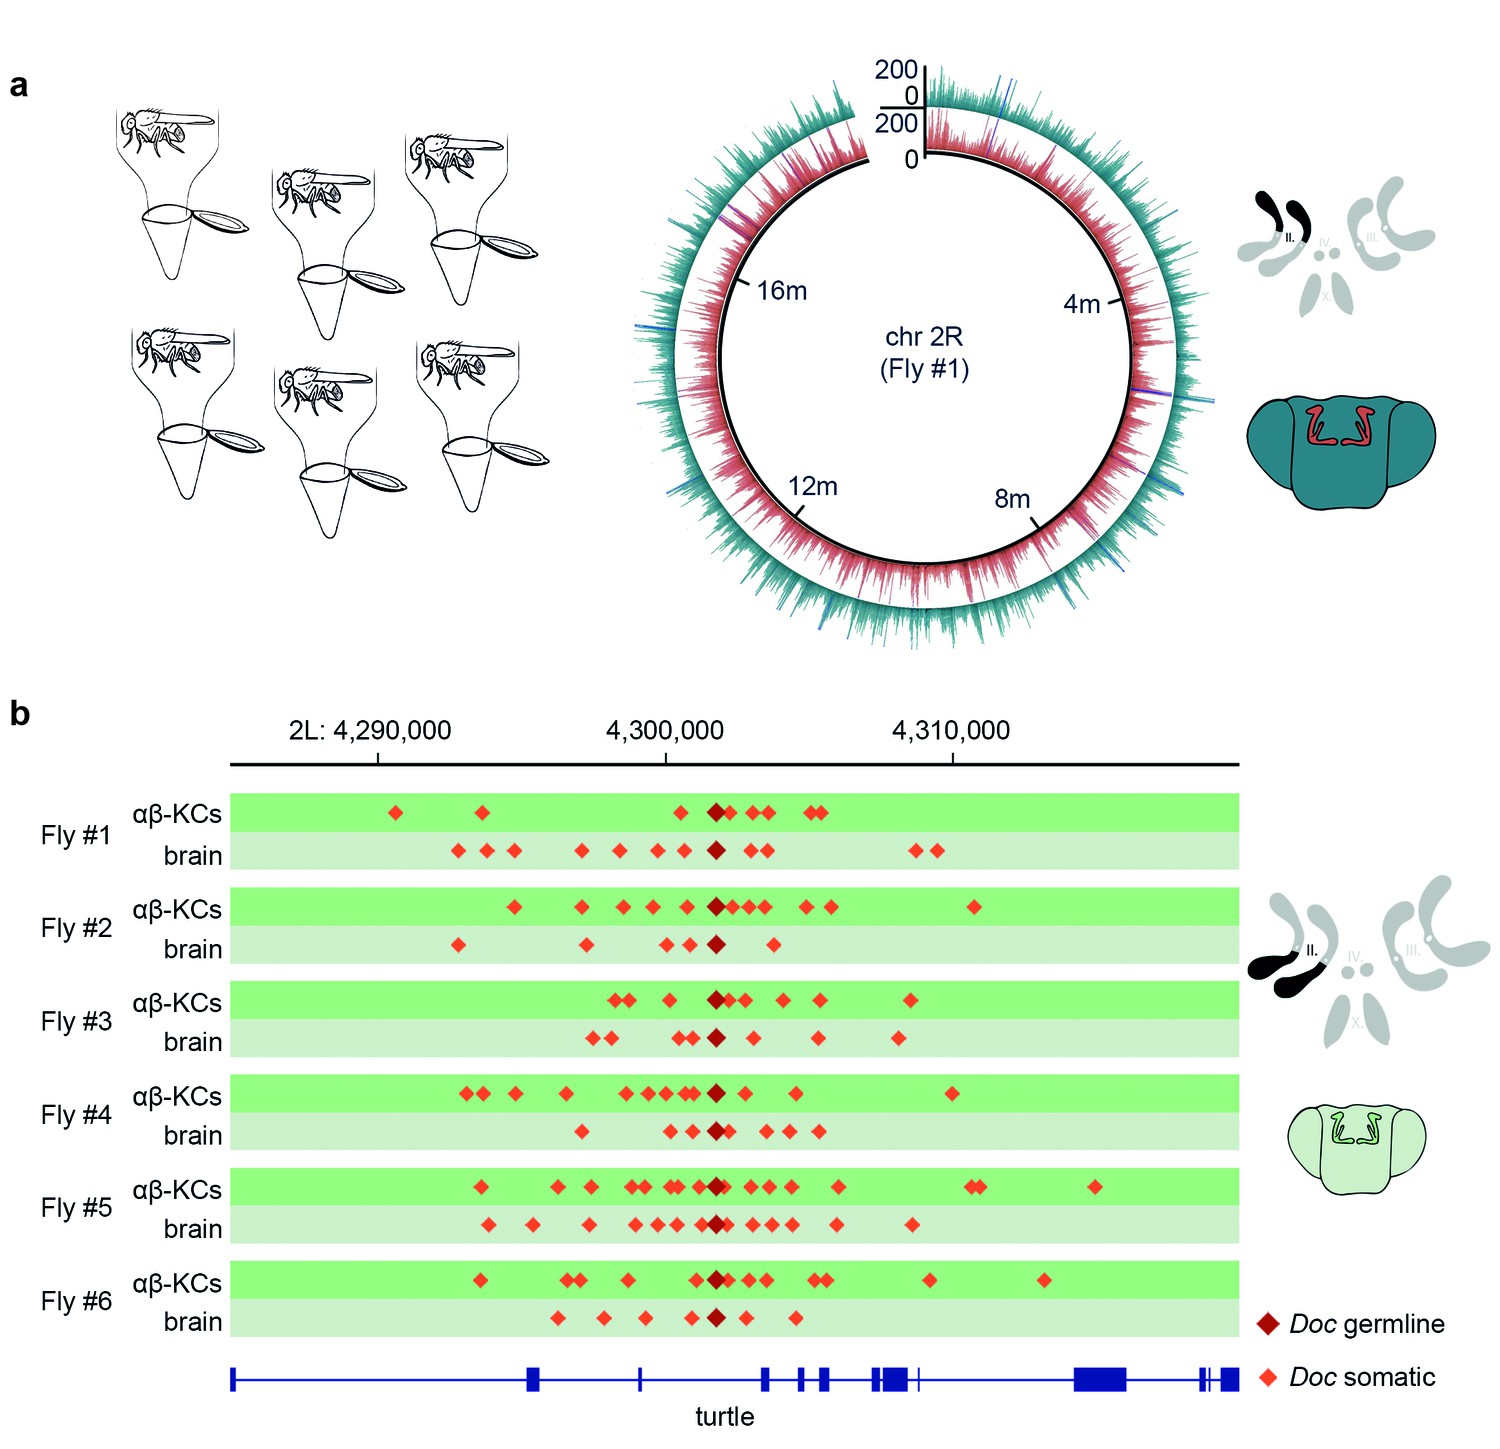
Single fly αβ-KC sequencing suggests transposon hovering.
(a) Schematic of the experimental approach. Six individual flies were processed independently. The circular plot shows the gDNA sequencing coverage of mCherry positive αβ-KCs (red trace) and mCherry negative cells from the rest of the brain (blue trace), on chromosome 2R from one representative individual fly. The schematic (top right) depicts the 4 fruit fly chromosome pairs. Chromosome 2R, which is the source data in the circular plot, is highlighted in black. Schematic fly brain (bottom right) indicates the color scheme; αβ-KCs (red), the rest of the brain (blue). Sequencing read alignments on other regions of the gDNA exhibited a similar coverage (data not shown). (b) Plot of a representative example of a germline transposon insertion that was found on chromosome 2L in each of the 6 individual flies and that is absent in the Drosophila melanogaster reference genome (Release 5.57). Putative new insertions were found at loci, which were approximately 10 kb up- and downstream of the germline insertion site of the same transposon type. Dark red diamonds represent the germline insertion of the transposon Doc, which was found in each of the 12 samples (αβ-KCs and the rest of the brain), and light red diamonds represent putative somatic Doc insertions. The genomic location of the turtle gene is shown below in blue. Boxes indicate exons and lines intronic regions of the gene. Schematic fly brain represents the color code used for this panel.
Figure 2—figure supplement 1
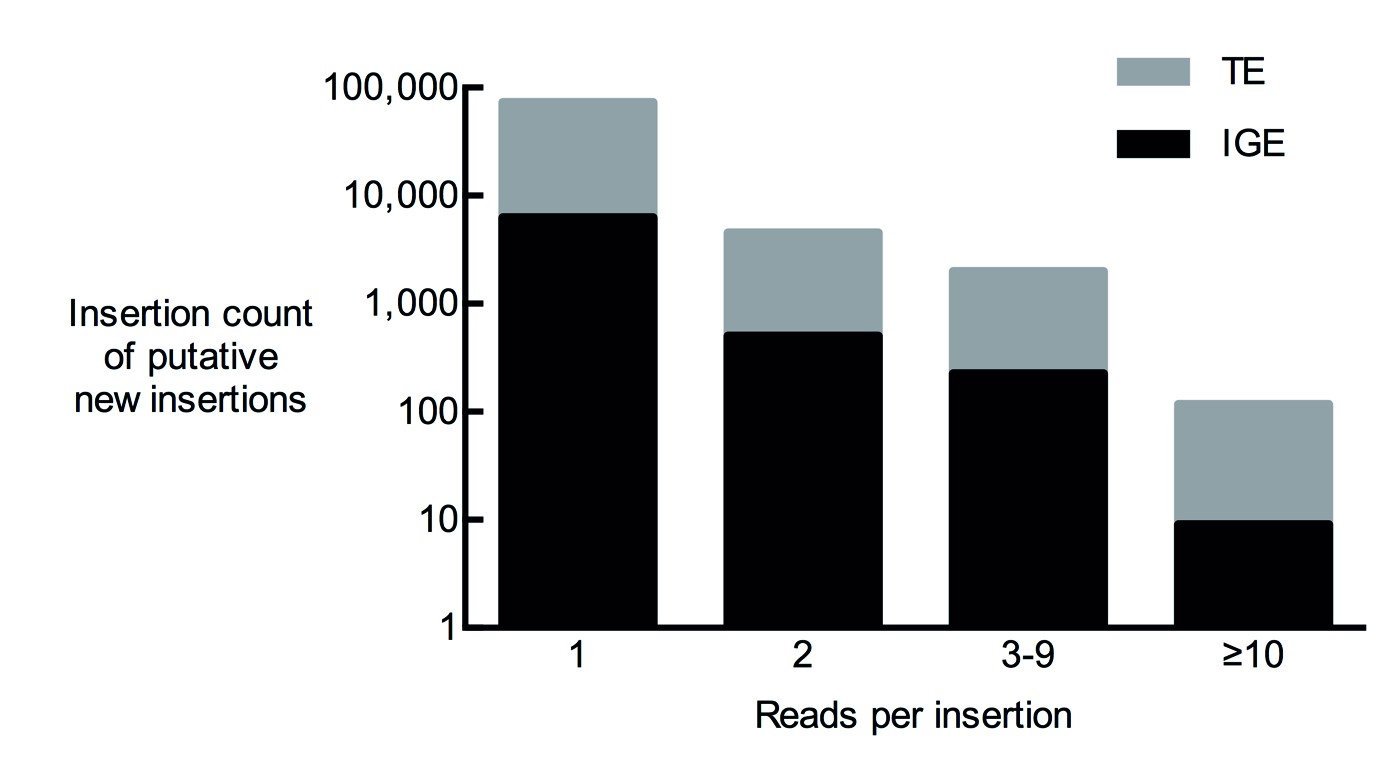
Total number of putative non-reference somatic TE insertions from 12 samples with 1, 2, 3–9 and more than 10 diagnostic reads.
https://doi.org/10.7554/eLife.28297.004
Figure 3
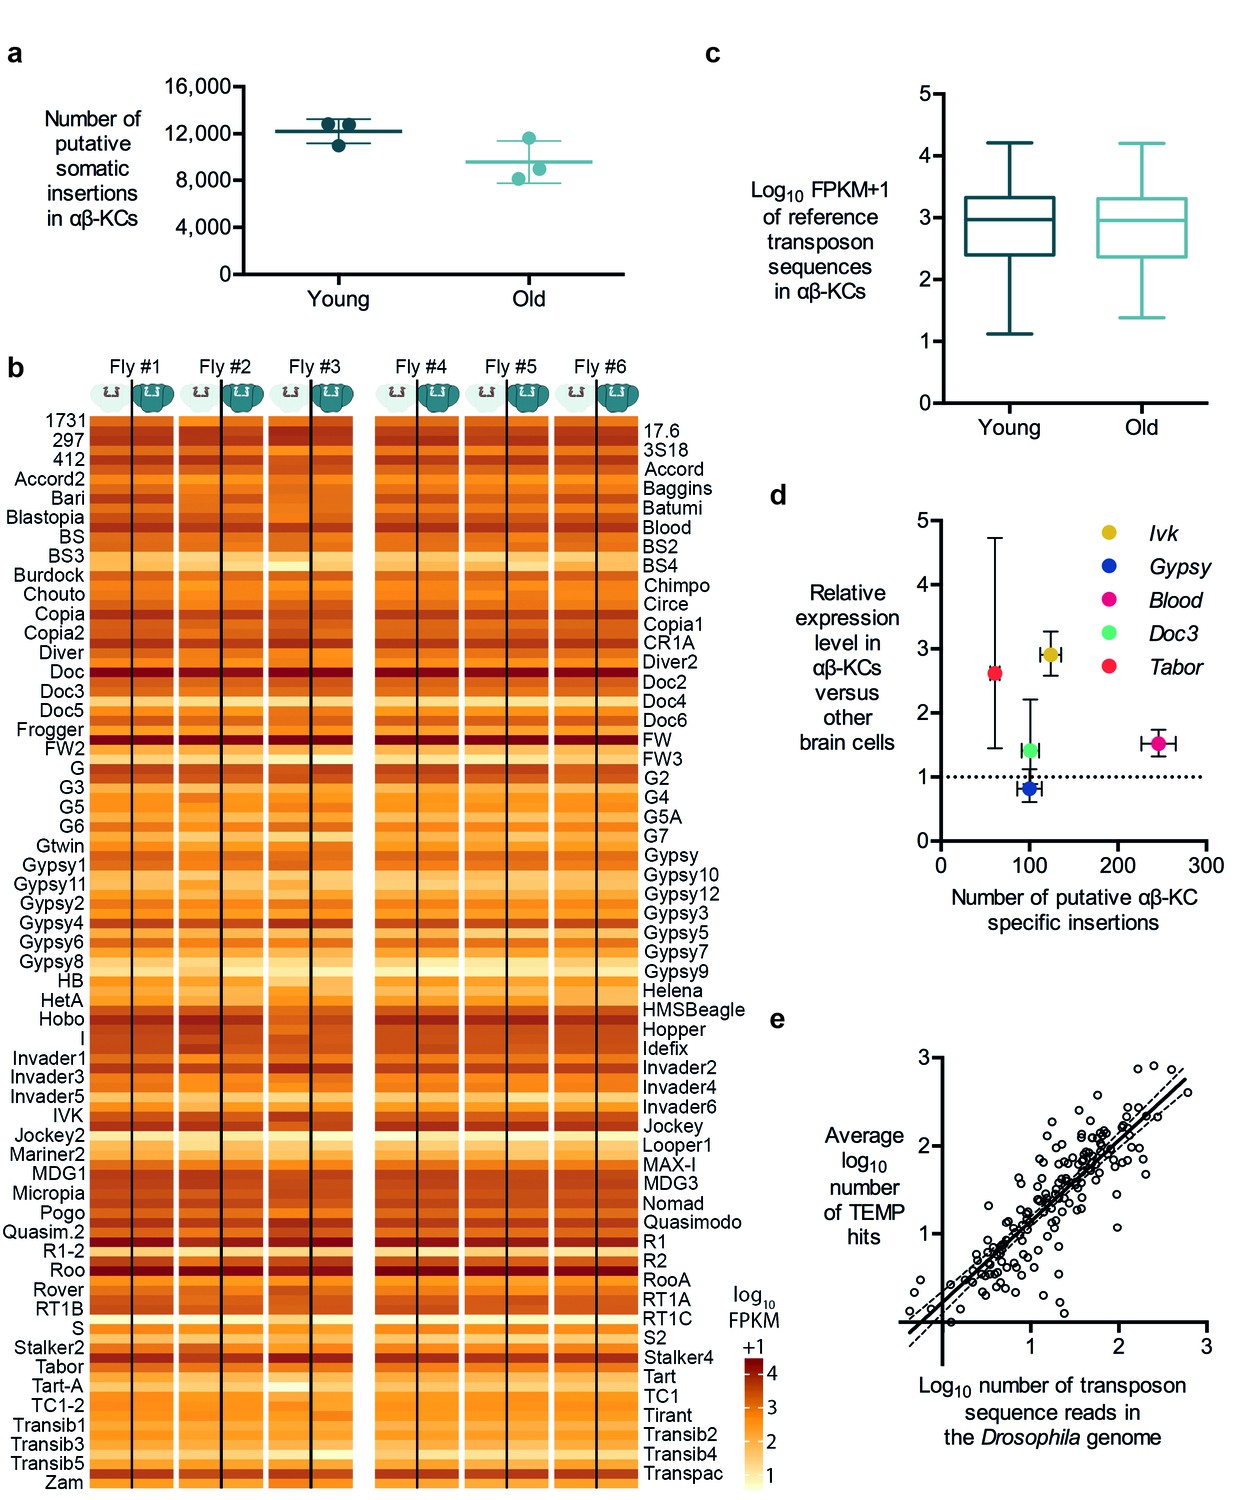
Transposon copy number and putative insertion rates do not correlate with age or transposon expression levels.
(a) The number of putative somatic insertion events does not differ between young (3–4 days) and old (30 days) flies (Mann-Whitney test, p=0.2). Error bars denote SEM. (b) Heatmap showing the normalized number of sequencing reads that map onto each of the 111 reference transposon sequences that were analyzed in this study. None of the few visible differences in the amount of transposon sequences in the gDNA from αβ-KCs when compared to the rest of the brain of the same individual are statistically significant. Individuals #1 - #3 are young flies (3–4 days) and #4 - #6 are old flies (30 days). FPKM stands for fragments per kilobase of transposon sequence per million fragments mapped. (c) Boxplot showing the normalized number of reads that map onto each of the 111 reference transposon sequences per αβ-KC sample of young (3–4 days) and old (30 days) flies. Whiskers represent Min and Max and the box represents the first and third interquartile interval. No statistical difference was evident (Mann-Whitney test, p=0.9184). (d) Plot showing no linear correlation between the expression levels of 5 different transposons in αβ-KCs and the number of putative new insertions of each transposon identified in these cells. gDNA data was acquired from 6 independent biological replicates. Error bars denote SEM. (e) Plot showing the logarithmic number of reads that map to each transposon consensus sequence taken from the Drosophila genome on the x-axis, and the logarithmic average number of putative insertions in 6 flies. Each point represents one transposon type. The line depicts the linear regression (R2 = 0.7166) and the 95% confidence interval.
Figure 4
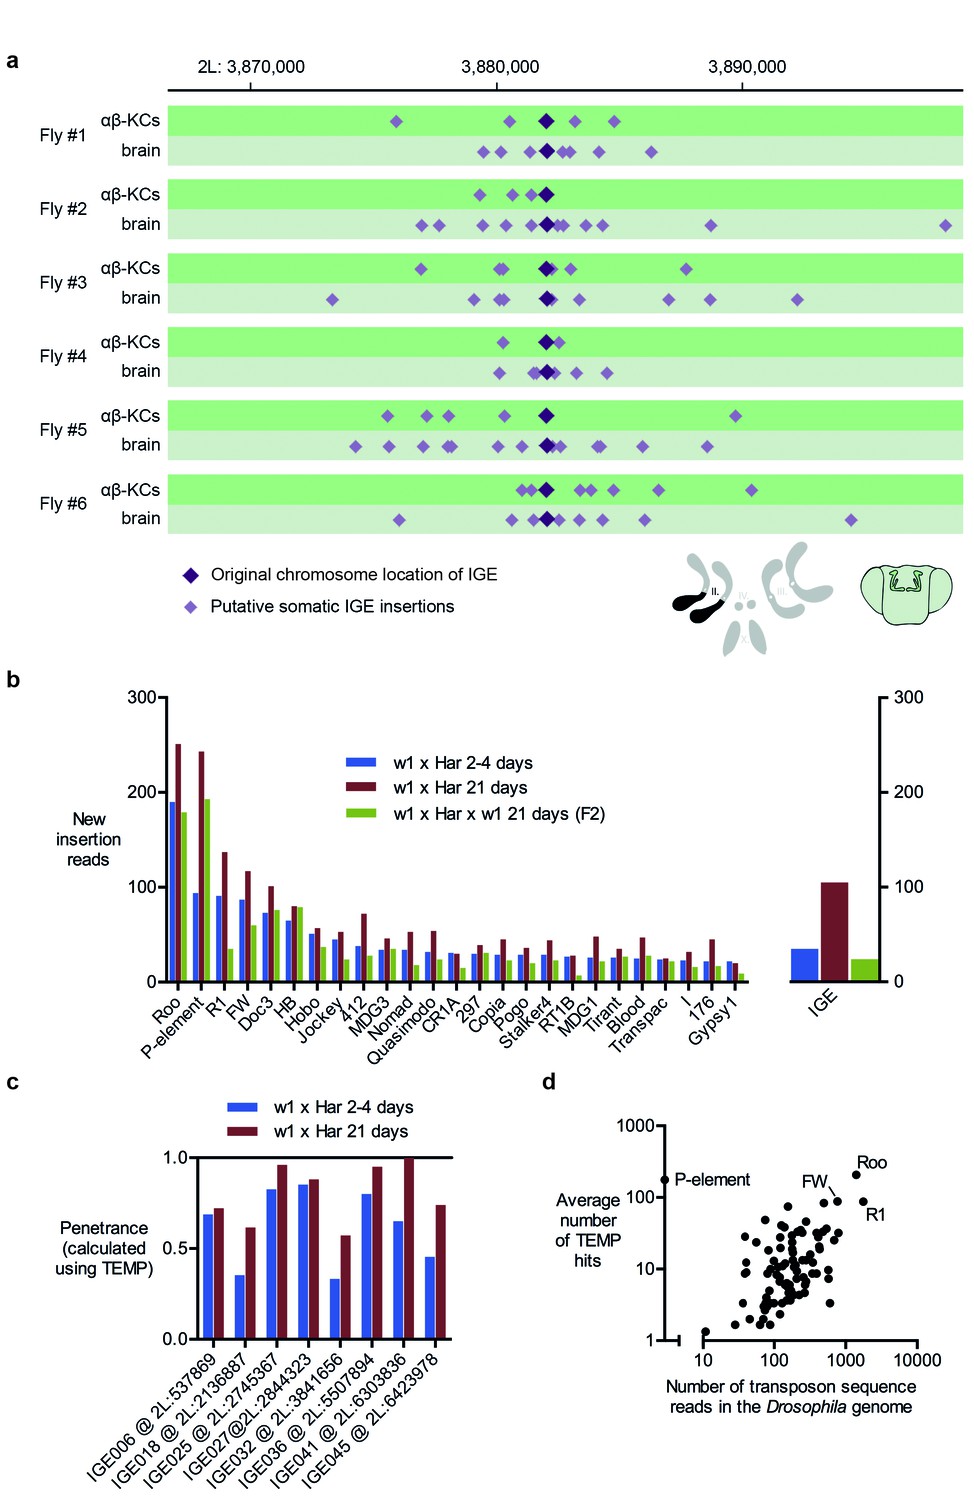
Immobile genetic elements appear to mobilize.
(a) Representative example of a germline IGE insertion event that was found in each of the 6 individual flies and that is absent in the simulated Drosophila melanogaster reference genome (DMsim). Putative somatic insertion events of the same IGE occurred at loci which are approximately 10 kb up- and downstream of the original germline insertion site. Dark purple diamonds represent the original germline insertion site, which, as expected, was present in each of the 12 samples (αβ-KCs and the rest of the brain). Light purple diamonds represent putative somatic IGE insertions in each of the samples. (b) Plot showing the number of putative new insertions in WGS data from oocytes (Khurana et al., 2011). Samples were normalized to a depth of 18.3-fold (as in Khurana et al., 2011) and the bars represent the putative insertions that were not detected in the parental strains. In addition, the number of IGE ‘mobilizations’ is shown. Note that the number of false positive IGE insertions is highest in the sample obtained from 21 day old dysgenic ovaries, and decreases in the F2 generation. (c) Graph illustrating the penetrance of a small selection of simulated IGE insertions. The actual penetrance for each locus should be 1. However, due to variations in local sequencing coverage, the analysis pipeline assigns varying frequencies to each IGE insertion. The penetrance of each IGE insertion shown apparently increases with age. (d) The average number of putative de novo insertions present in the three samples from oocytes (Khurana et al., 2011) correlates with the theoretical number of sequencing reads that map onto each transposon sequence in the Drosophila reference genome. The number of reads was based on the sequencing coverage (18.3-fold) and the number of 76nt fragments that overlap with each transposon reference sequence. Note, for example, Roo, R1 and FW the three endogenous transposons that contribute most frequently to ‘insertions’ are also the most abundant elements in the reference genome.
Figure 5
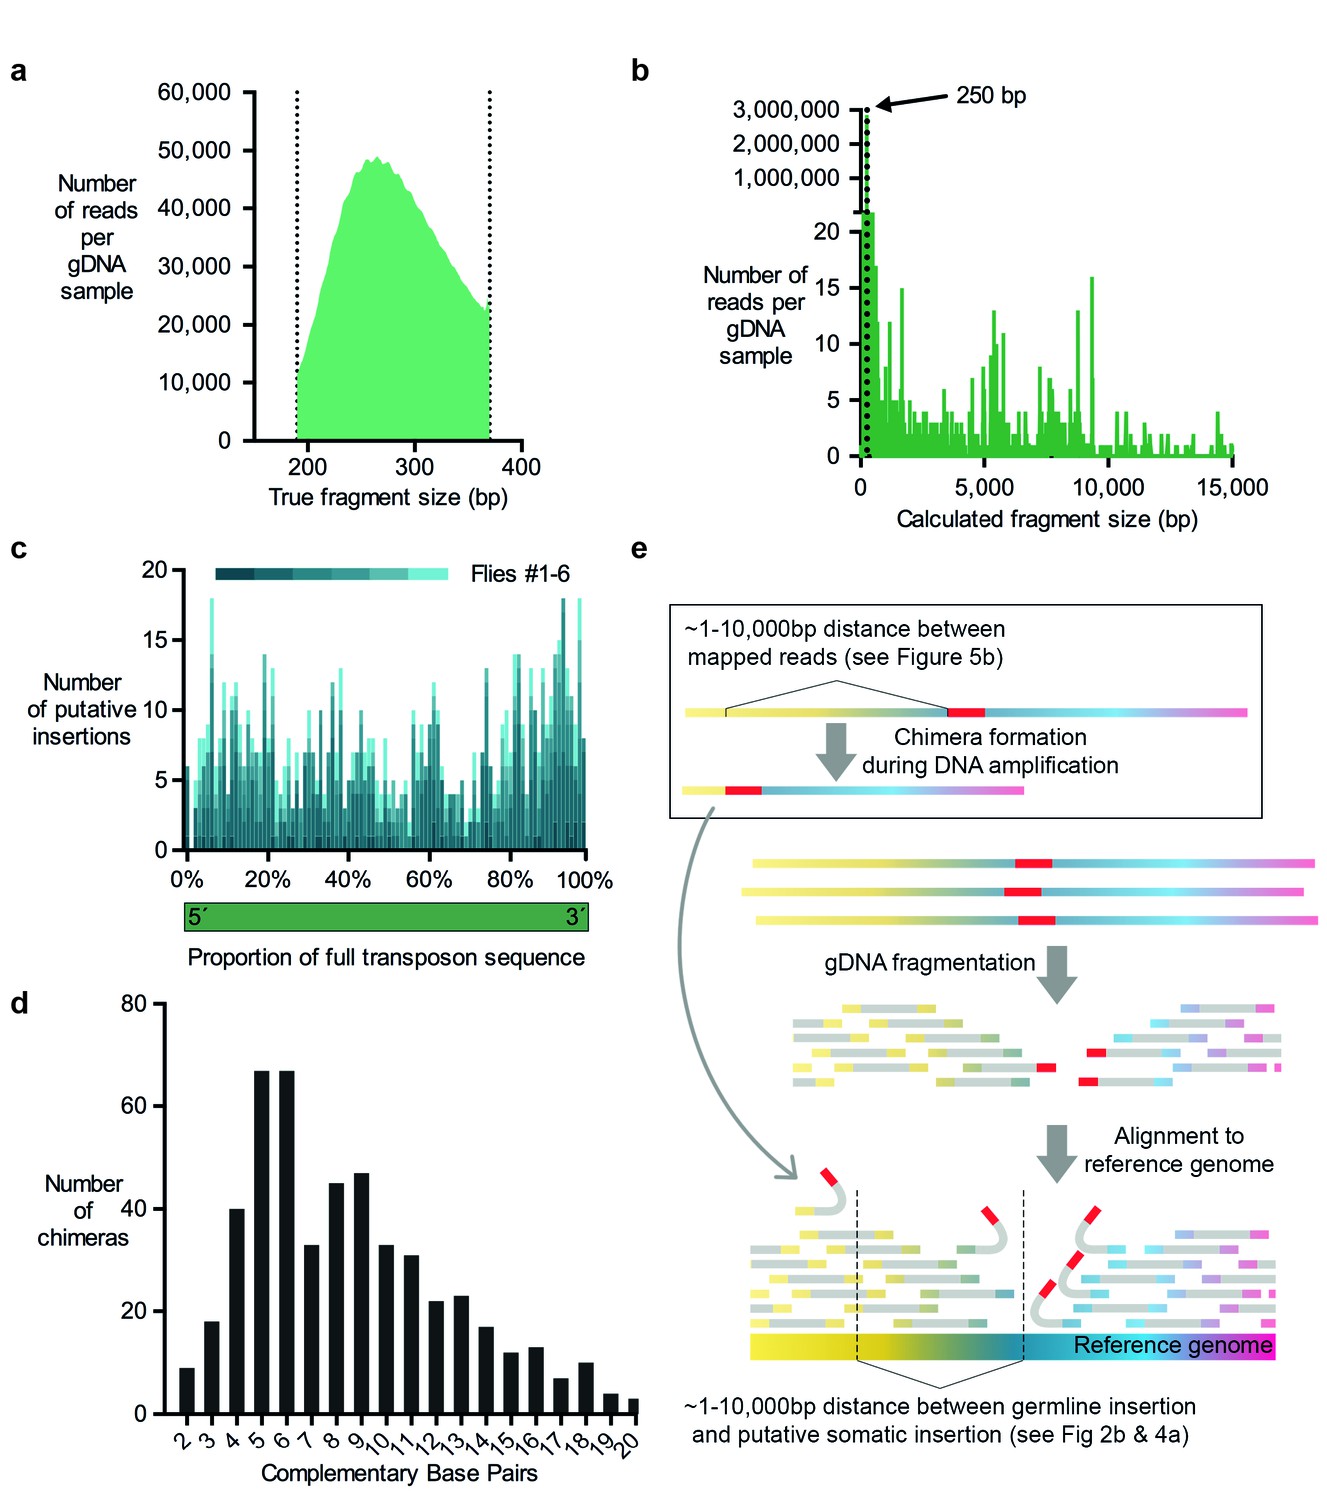
Evidence for chimera formation during DNA amplification.
(a) The DNA fragment sizes of long, overlapping sequencing read pairs were assessed by merging each read pair. The length of these merged fragments varied and peaked at 270 bp. (b) In silico assembled read pairs which are all 250 basepairs apart map at genomic locations which are further apart than the predicted size. Plot shows the calculated fragment size which is based on the distance between each of the two mapped paired-end read. (c) Transposon: chromosome breakpoints occur across the entire length of transposons. Plotted are the number of putative transposon insertions in each fly tested and grouped into bins based on the relative position of the breakpoint along the length of each transposon. (d) Graph illustrating the frequency of each size of complementary sequence spanning the junction of chimeric amplicons (only those above 1 are shown). (e) Schematic depicting how chimeric DNA, which was formed during gDNA amplification, can result in read-pairs which lead TEMP to predict the presence of a rare somatic transposon insertion down- or upstream of a germline insertion. For TEMP, gDNA is extracted, fragmented, sequenced and paired-end reads are aligned to a reference genome. According to data presented in panel (b), during gDNA amplification chimera are favorably formed between sections of gDNA that are between ~1 and 10,000 basepairs apart. This clustering mirrors the range of the apparent transposon and IGE hovering as predicted by TEMP (see Figures 2b and 4a).
Tables
Table 1
Summary of whole-genome sequencing data and TEMP results in this study. The number of artefactual IGE insertions that were detected in each sample are also shown. Note that the number of IGE insertions (column ‘Putative IGE insertions’) is a useful quality control metric to estimate the rate of chimera formed during amplification. Furthermore, the number of correctly identified IGEs (last column), in combination with the mean sequencing coverage, can be used to assess how equally distributed the read pairs are for each sample.
| Age | Sample number | Tissue sample | Read lengths | Total reads | % of reads mapped | Mean coverage | Range of insert sizes (of 90%) | Putative transposon insertions | Putative IGE insertions | Transposons only in αβ-KCs | IGEs only in αβ-KCs | Correctly identified IGEs (of 589) |
|---|---|---|---|---|---|---|---|---|---|---|---|---|
| YOUNG | 1 | αβ-KCs | 100 | 6E+07 | 96.96% | 39.43 | 434-500nt | 23301 | 2336 | 12827 | 1350 | 583 |
| 2 | other brain cells | 100 | 6E+07 | 94.96% | 38.54 | 434-496nt | 22162 | 2222 | 583 | |||
| YOUNG | 3 | αβ-KCs | 100 | 6E+07 | 93.21% | 38.02 | 432-496nt | 22581 | 2322 | 12783 | 1179 | 583 |
| 4 | other brain cells | 100 | 6E+07 | 96.01% | 39.21 | 434-504nt | 17224 | 2436 | 579 | |||
| YOUNG | 5 | αβ-KCs | 100 | 6E+07 | 96.57% | 39.13 | 438-508nt | 23974 | 2280 | 10977 | 1121 | 582 |
| 6 | other brain cells | 100 | 6E+07 | 93.45% | 37.2 | 452-510nt | 24887 | 2234 | 582 | |||
| OLD | 7 | αβ-KCs | 100 | 6E+07 | 96.58% | 36.99 | 450-506nt | 17092 | 1794 | 8133 | 723 | 582 |
| 8 | other brain cells | 100 | 6E+07 | 97.90% | 37.25 | 458-518nt | 16692 | 1777 | 582 | |||
| OLD | 9 | αβ-KCs | 100 | 6E+07 | 97.14% | 36.97 | 458-514nt | 18922 | 1998 | 8954 | 844 | 584 |
| 10 | other brain cells | 100 | 6E+07 | 96.96% | 37.05 | 450-510nt | 19254 | 1950 | 581 | |||
| OLD | 11 | αβ-KCs | 100 | 6E+07 | 96.29% | 38.72 | 437-497nt | 24587 | 2181 | 11616 | 989 | 582 |
| 12 | other brain cells | 100 | 6E+07 | 90.60% | 36.5 | 435-509nt | 21849 | 2241 | 582 | |||
| YOUNG | 13 | αβ-KCs | 250 | 7E+06 | 91.82% | 4.7 | 250nt | 1530 | 476 | 759 | 84 | 442 |
| 14 | other brain cells | 250 | 8E+06 | 89.30% | 5.17 | 250nt | 1687 | 501 | 464 | |||
| YOUNG | 15 | αβ-KCs | 250 | 2E+07 | 89.68% | 10.45 | 250nt | 2498 | 625 | 1671 | 230 | 415 |
| 16 | other brain cells | 250 | 9E+06 | 87.18% | 5.27 | 250nt | 1828 | 523 | 467 | |||
| YOUNG | 17 | αβ-KCs | 250 | 8E+06 | 78.12% | 6.41 | 250nt | 2189 | 212 | 1544 | 93 | 193 |
| 18 | other brain cells | 250 | 1E+07 | 64.74% | 5.72 | 250nt | 1908 | 279 | 255 | |||
| OLD | 19 | αβ-KCs | 250 | 9E+06 | 89.78% | 5.6 | 250nt | 1732 | 470 | 1008 | 87 | 420 |
| 20 | other brain cells | 250 | 9E+06 | 91.85% | 5.43 | 250nt | 1814 | 515 | 458 | |||
| OLD | 21 | αβ-KCs | 250 | 8E+06 | 90.51% | 5 | 250nt | 1627 | 491 | 1017 | 136 | 445 |
| 22 | other brain cells | 250 | 7E+06 | 90.26% | 5.01 | 250nt | 1575 | 458 | 396 | |||
| OLD | 23 | αβ-KCs | 250 | 8E+06 | 90.73% | 5.39 | 250nt | 1901 | 436 | 1204 | 124 | 388 |
| 24 | other brain cells | 250 | 8E+06 | 84.21% | 4.83 | 250nt | 1661 | 427 | 373 |
Additional files
-
Supplementary file 1
List of non-reference transposon insertion detected in all 12 WGS samples.
- https://doi.org/10.7554/eLife.28297.009
Download links
A two-part list of links to download the article, or parts of the article, in various formats.
Downloads (link to download the article as PDF)
Open citations (links to open the citations from this article in various online reference manager services)
Cite this article (links to download the citations from this article in formats compatible with various reference manager tools)
Resolving the prevalence of somatic transposition in Drosophila
eLife 6:e28297.
https://doi.org/10.7554/eLife.28297


