A synaptotagmin suppressor screen indicates SNARE binding controls the timing and Ca2+ cooperativity of vesicle fusion
- Massachusetts Institute of Technology, United States
- Wayne State University, United States
- Universidad Central del Caribe, Puerto Rico
- Texas Tech University Health Sciences Center, United States
Figures
Figure 1 with 1 supplement
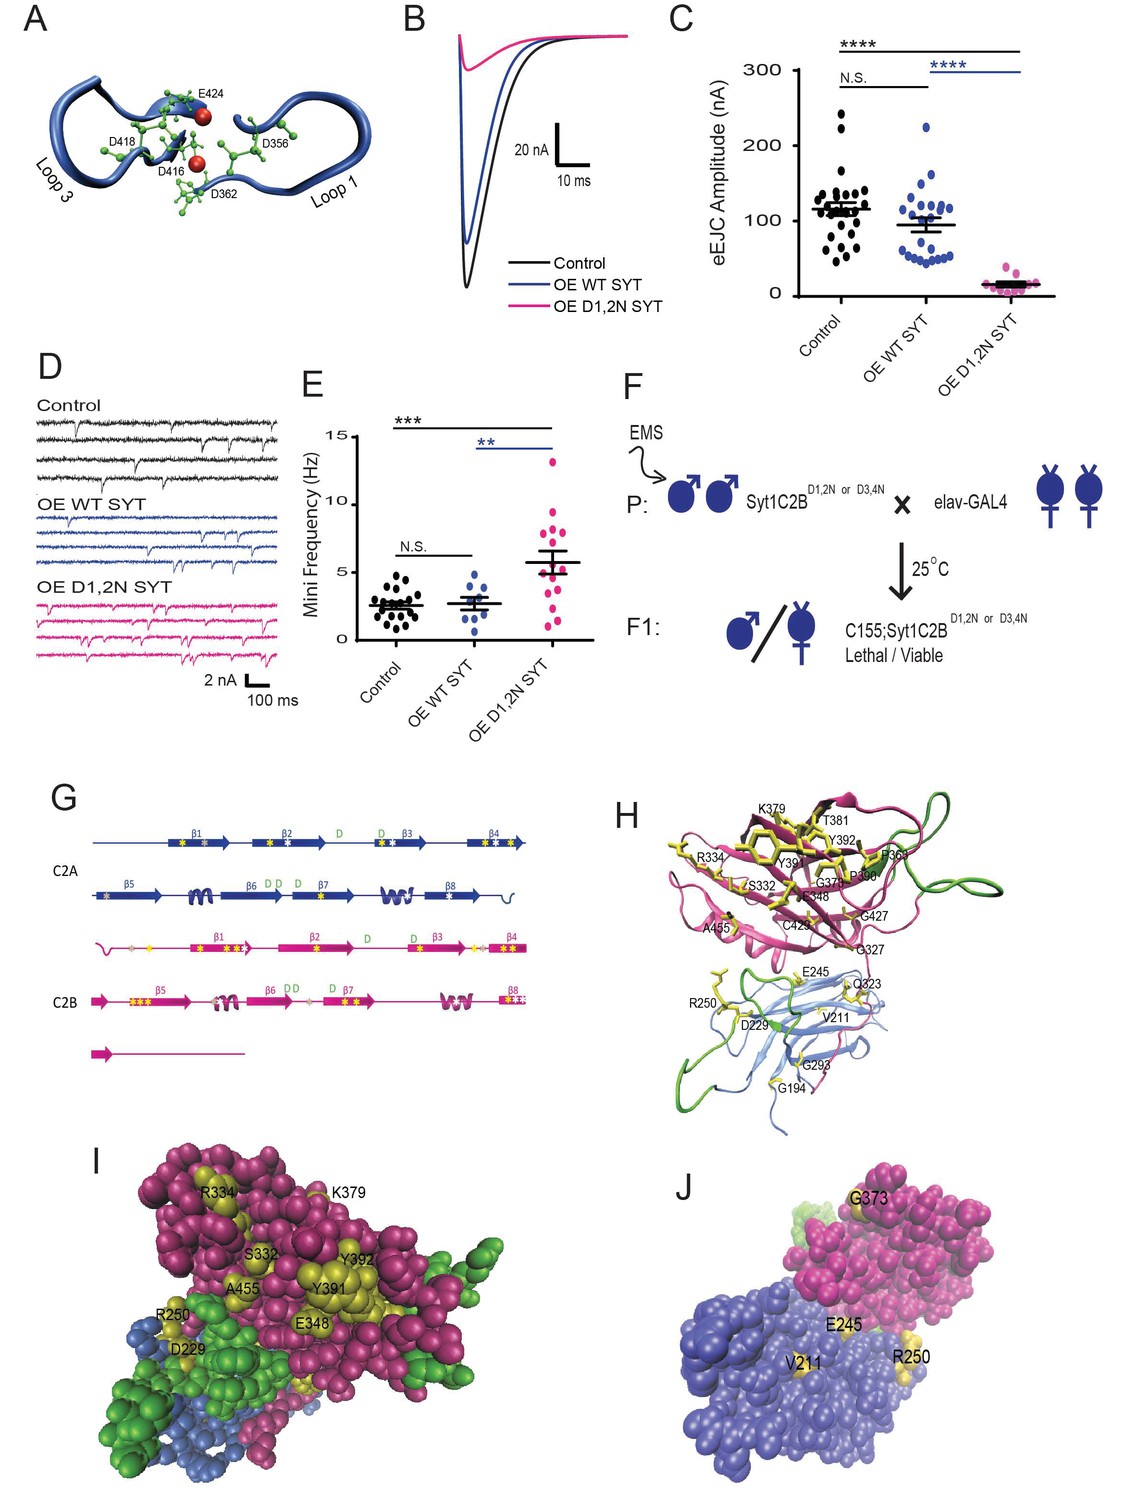
An intragenic suppressor screen for mutations that disrupt the lethality induced by Syt1C2BD1,2N or Syt1C2BD3,4N expression.
(A) View of key residues in the Syt1 C2B Ca2+ binding pocket. The Ca2+ binding loops 1 and 3 are highlighted in blue, the negatively charged Ca2+-binding residues in green, and Ca2+ ions in red. Neuronal overexpression of Syt1C2BD416,D418N (D1,2N) or Syt1C2BD356,D362N (D3,4N) results in pharate adult lethality. (B) Representative evoked excitatory junctional currents (eEJCs) recorded in 0.2 mM extracellular Ca2+ in control white larvae (black trace), elavC155-GAL4; UAS-Syt1 wildtype (OE WT SYT, blue trace) and elavC155-GAL4; UAS-Syt1C2BD1,2N (OE D1,2N SYT, magenta trace). (C) Quantification of mean eEJC amplitude in the indicated genotypes: control, 116.0 ± 8.7 nA, n = 27; OE WT Syt1, 95.0 ± 9.4 nA, n = 24; OE D1,2N Syt1, 15.9 ± 3.5 nA, n = 10. (D) Representative postsynaptic current recordings of spontaneous release in the indicated genotypes. (E) Quantification of average mini frequency for the indicated genotypes: control, 2.6 ± 0.3 Hz, n = 19; OE WT Syt1, 2.7 ± 0.5 Hz, n = 9; OE D1, 2N Syt1, 5.7 ± 0.8 Hz, n = 15. (F) Crossing scheme used for EMS screening of suppressors of Syt1C2BD1,2N or D3,4N-induced lethality. (G) Location of identified suppressors (point mutant - yellow asterisks, stop codon - white asterisks, deletion - grey asterisks) on the Syt1 secondary structure. C2A is indicated blue and C2B in magenta. (H) View of identified point mutant alleles (yellow) in the DSyt1 homology model. For all remaining structural images, the C2A domain is colored blue and the C2B domain is colored magenta, while the Ca2+ binding loops are highlighted in green. (I) Suppressor point mutants (yellow) located in a space-filling model of DSyt1. (J) Suppressor mutations (yellow) located on the opposite face of the DSyt1 structure compared to panel I. Statistical significance was determined using one-way ANOVA (nonparametric) with post hoc Sidak’s multiple comparisons test. N.S. = no significant change, *p<0.05, **p<0.01, ***p≤0.0005, ****p<0.0001. All error bars are standard error of the mean (SEM).
-
Figure 1—source data 1
Sample size (n), mean, SEM, and One-way Anova (and nonparametric) Sidak's multiple comparisons test are presented for the data in Figure 1C and Figure 2C,G,K,O.
- https://doi.org/10.7554/eLife.28409.004
-
Figure 1—source data 2
Sample size (n), mean, SEM, and One-way Anova (and nonparametric) Sidak's multiple comparisons test are presented for the data in Figure 1E and Figure 2D,H,L and P.
- https://doi.org/10.7554/eLife.28409.005
-
Figure 1—source data 3
Sample size (n), mean, SEM, and Student's t test are presented for the data in Figure 1—figure supplement 1B, C and E
- https://doi.org/10.7554/eLife.28409.006
Figure 1—figure supplement 1
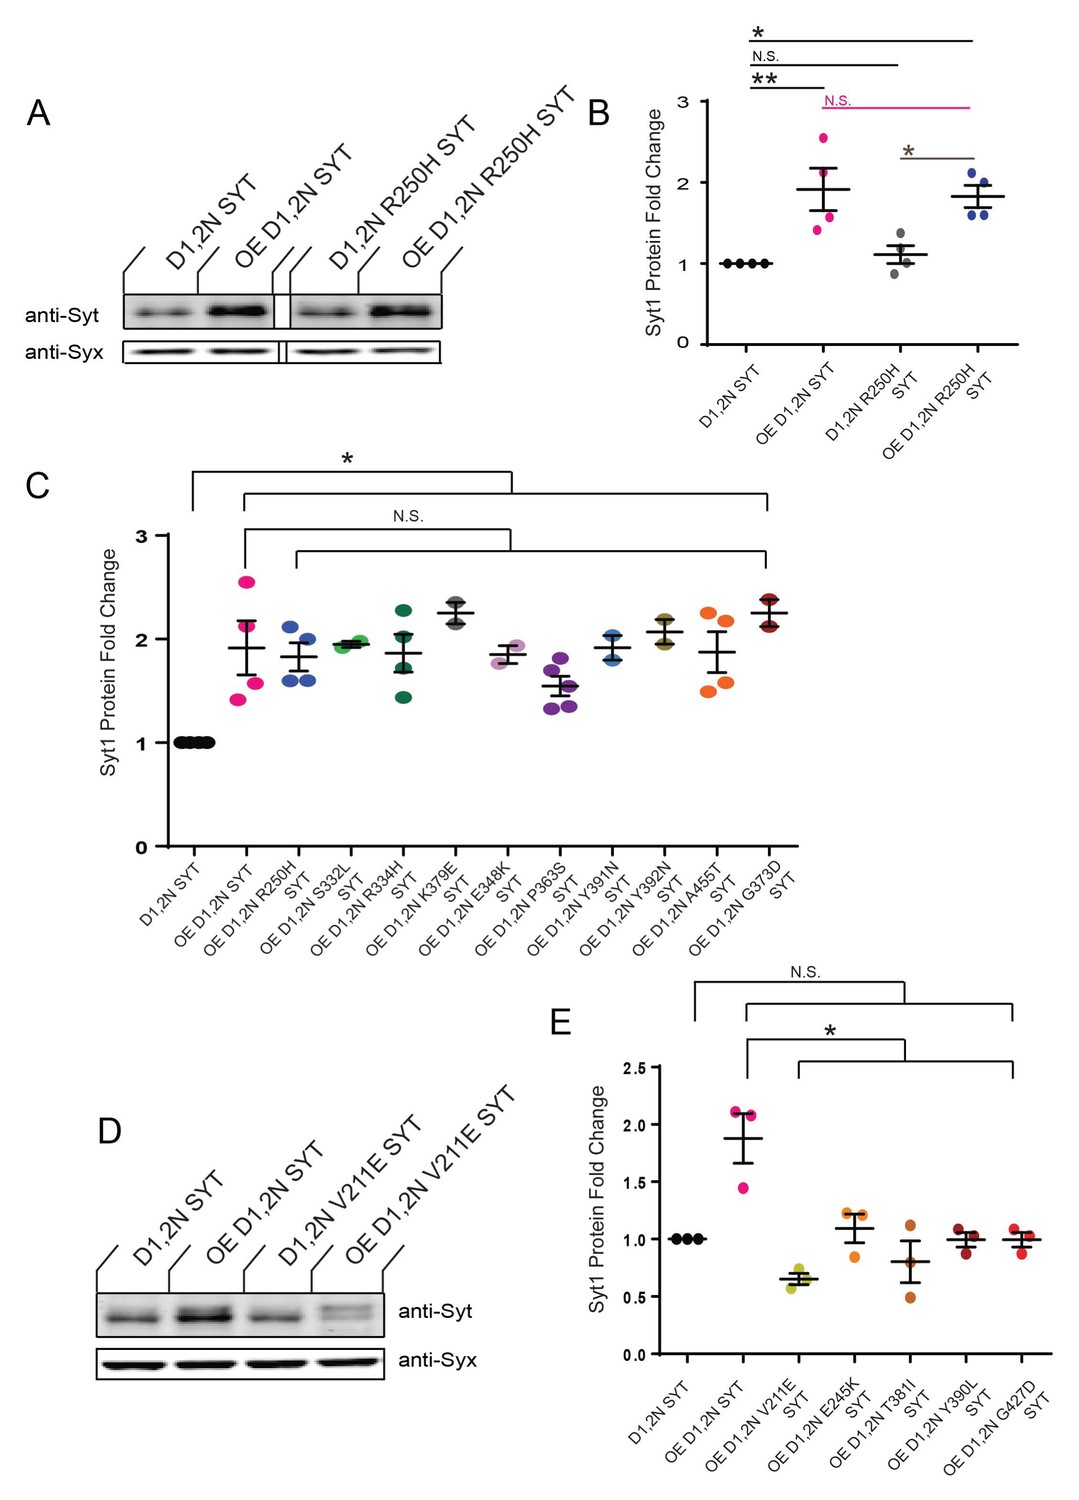
Summary of Western analysis of Syt1 alleles that suppress lethality following overexpression of Syt1C2BD1,2N or Syt1C2BD3,4N.
(A) Western of overexpressed Syt1 mutant proteins in head extracts of elavC155-GAL4; UAS-Syt1C2BD1,2N/+ (OE D1,2N SYT), control UAS-Syt1C2BD1,2N/+without a driver (D1,2N SYT), elavC155-GAL4; UAS-Syt1C2BD1,2N R250H (OE D1,2N R250H SYT) and control UAS-Syt1C2BD1,2N R250H/+without a driver (D1,2N R250H SYT. The top panel shows anti-Syt1 immunoreactivity, while the bottom panel shows anti-Syntaxin (anti-Syx) immunoreactivity as a loading control. Note the overexpressed R250H protein is stable and not degraded. (B) Quantification of fold-change of Syt1 protein expression in the indicated genotypes normalized to control UAS-Syt1C2BD1,2N/+without a driver (D1,2N SYT) and the loading control (anti-Syx). The following genotypes were tested: OE D1,2N SYT, 1.9 ± 0.3 (n = 4); D1,2N R250H SYT, 1.1 ± 0.1 (n = 4); OE D1,2N R250H SYT, 1.8 ± 0.1 (n = 4). (C) Quantification of fold change for Syt1 expression for the indicated genotypes that show stable overexpression. Protein levels were normalized as indicated above. The following genotypes were tested: OE D1,2N SYT, 1.9 ± 0.3 (n = 4); OE D1,2N R250H SYT, 1.8 ± 0.1 (n = 4); OE D1,2N S332L SYT, 1.9 ± 0.03 (n = 2); OE D1,2N R334H SYT, 1.9 ± 0.1 (n = 3); OE D1,2N K379E SYT, 2.3 ± 0.1 (n = 2); OE D1,2N E348K SYT, 1.9 ± 0.1 (n = 2); OE D1,2N P363S SYT, 1.5 ± 0.1 (n = 3); OE D1,2N Y391N SYT, 1.9 ± 0.1 (n = 2); OE D1,2N Y392N SYT, 2.1 ± 0.1 (n = 2); OE D1,2N A455T SYT, 1.9 ± 0.2 (n = 4); OE D1,2N G373D SYT, 2.3 ± 0.1 (n = 2). (D) Western of overexpressed Syt1 mutant proteins in head extracts of elavC155-GAL4; UAS-Syt1C2BD1,2N/+ (OE D1,2N SYT), control UAS-Syt1C2BD1,2N/+without a driver (D1,2N SYT), elavC155-GAL4; UAS-Syt1C2BD1,2N V211E (OE D1,2N V211E SYT) and control UAS-Syt1C2BD1,2N V211E/+without a driver (D1,2N V211E SYT). The top panel shows anti-Syt1 immunoreactivity, while the bottom panel shows anti-Syntaxin (anti-Syx) immunoreactivity as a loading control. Note the overexpressed V211E protein is degraded, and only the endogenous Syt1 protein is still detected. (E) Quantification of fold change for Syt1 expression for the indicated genotypes that fail to show stable overexpression. Protein levels were normalized as indicated above. The following genotypes were tested: OE D1,2N SYT, 1.9 ± 0.2 (n = 3); OE D1,2N V211E SYT, 0.7 ± 0.05 (n = 3); OE D1,2N E245K SYT, 1.1 ± 0.1 (n = 3);= OE D1,2N T381I SYT, 0.8 ± 0.2 (n = 3); OE D1,2N Y390L SYT, 1.0 ± 0.1 (n = 3); OE D1,2N G427D SYT, 0.7 ± 0.04 (n = 3). For panels B-C and E, statistical significance was determined using one-way ANOVA (nonparametric) with post hoc Sidak’s multiple comparisons test. N.S. = no significant change (p>0.05), *p<0.05, **p<0.01 Error bars represent SEM.
Figure 2 with 2 supplements
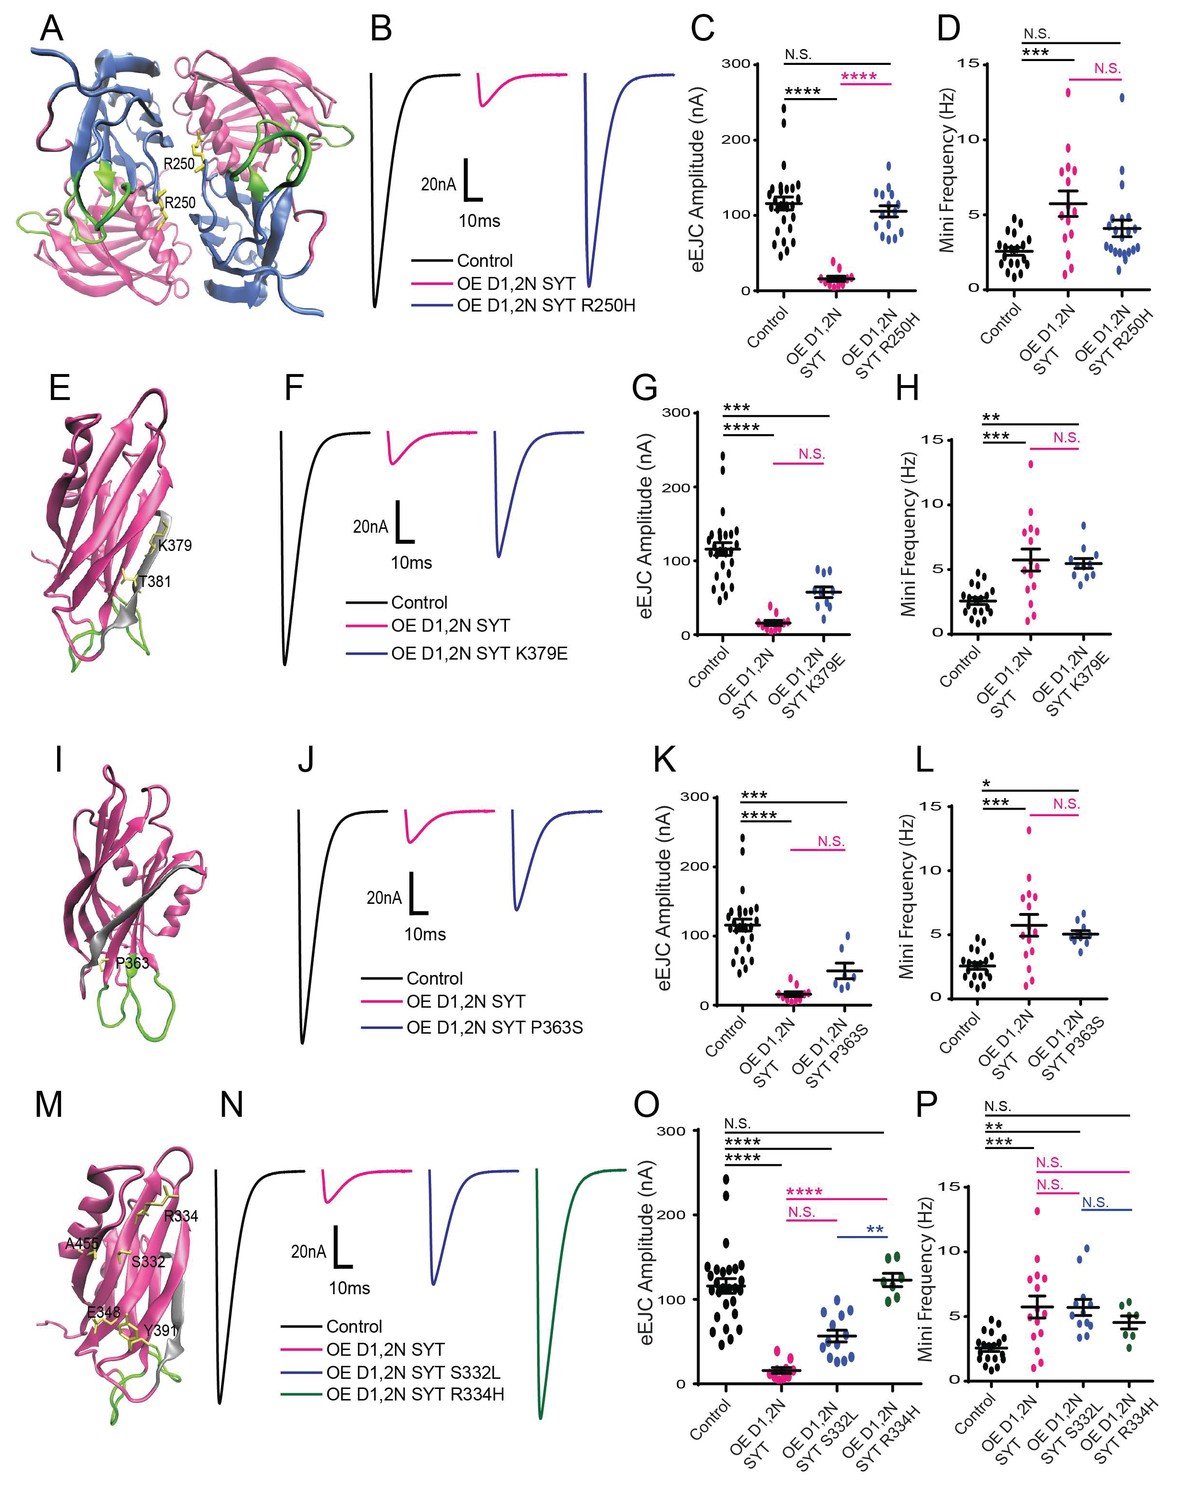
Characterization of suppressor mutation effects on DN Syt1C2BD1,2N physiology.
(A) Location of the R250 residue (yellow) in C2A at the Syt1 dimer interface. (B) Representative eEJCs recorded in 0.2 mM extracellular Ca2+ in control (black), elavC155-GAL4; UAS-Syt1C2BD1,2N (OE D1,2N SYT, magenta) and elavC155-GAL4; UAS-Syt1C2BD1,2N R250H (OE D1,2 N SYT R250H, blue). (C) Quantification of mean eEJC amplitude for the indicated genotypes: control, 116.0 ± 8.7 nA, n = 27; OE D1,2N Syt1, 15.9 ± 3.5 nA, n = 10; OE D1,2 N Syt1 R250H, 105.5 ± 7.5 nA, n = 15. (D) Quantification of average mini frequency for the indicated genotypes: control, 2.6 ± 0.3 Hz, n = 19; OE D1,2N Syt1, 5.7 ± 0.8 Hz, n = 15; OE D1,2N Syt1 R250H, 4.1 ± 0.6 Hz, n = 21. (E) Location of the K379 and T381 residues (yellow) in the C2B polybasic β-strand (grey). (F) Representative eEJCs recorded in 0.2 mM extracellular Ca2+ in control (black), elavC155-GAL4; UAS-Syt1C2BD1,2N (OE D1,2N SYT in magenta) and elavC155-GAL4; UAS-Syt1C2BD1,2N K379E (OE D1,2N SYT K379E, blue). (G) Quantification of mean eEJC amplitude in the indicated genotypes: control, 116.0 ± 8.7 nA, n = 27; OE D1,2N Syt1, 15.9 ± 3.5 nA, n = 10; OE D1,2N Syt1 K379E, 57.7 ± 7.3 nA, n = 10. (H) Quantification of average mini frequency for the indicated genotypes: control, 2.6 ± 0.3 Hz, n = 19; OE D1,2N Syt1, 5.7 ± 0.8 Hz, n = 15; OE D1,2N Syt1 K379E, 5.5 ± 0.4 Hz, n = 11. (I) Location of the P363 residue (yellow) near the C2B Ca2+ binding loops (green). (J) Representative eEJCs recorded in 0.2 mM extracellular Ca2+ in control (black), elavC155-GAL4; UAS-Syt1C2BD1,2N (OE D1,2N SYT, magenta) and elavC155-GAL4; UAS-Syt1C2BD1,2N K379E (OE D1,2N SYT P363S, blue). (K) Quantification of mean eEJC amplitude in the indicated genotypes: control, 116.0 ± 8.7 nA, n = 27; OE D1,2N Syt1, 15.9 ± 3.5 nA, n = 10; OE D1,2N Syt1 P363S, 49.6 ± 11.2 nA, n = 7. (L) Quantification of average mini frequency for the indicated genotypes: control, 2.6 ± 0.3 Hz, n = 19; OE D1,2N Syt1, 5.7 ± 0.8 Hz, n = 15; OE D1,2N Syt1 P363S, 5.1 ± 0.3 Hz, n = 10. (M) Location of the S332, R334, E348, Y391, and A455 residues (yellow) on the C2B surface opposite to the polybasic β-strand (grey). (N) Representative eEJCs recorded in 0.2 mM extracellular Ca2+ in control (black), elavC155-GAL4; UAS-Syt1C2BD1,2N (OE D1,2N SYT, magenta), elavC155-GAL4; UAS-Syt1C2BD1,2N S332L (OE D1,2N SYT S332L, blue) and elavC155-GAL4; UAS-Syt1C2BD1,2N R334H (OE D1,2N SYT R334H, green). (O) Quantification of mean eEJC amplitude in the indicated genotypes: control, 116.0 ± 8.7 nA, n = 27; OE D1,2N Syt1, 15.9 ± 3.5 nA, n = 10; OE D1,2N Syt1 S332L, 56.6 ± 7.0 nA, n = 13; OE D1,2N Syt1 R334H, 122.9 ± 7.8 nA, n = 7. (P) Quantification of average mini frequency for the indicated genotypes: control, 2.6 ± 0.3 Hz, n = 19; OE D1,2N Syt1, 5.7 ± 0.8 Hz, n = 15; OE D1,2N Syt1 S332L, 5.7 ± 0.6 Hz, n = 12; OE D1,2N Syt1 R334H, 4.5 ± 0.5 Hz, n = 7. Statistical significance was determined using one-way ANOVA (nonparametric) with post hoc Sidak’s multiple comparisons test. N.S. = no significant change, *p<0.05, **=p<0.005, ***=p<0.0005, ****=p<0.0001. All error bars are SEM.
-
Figure 2—source data 1
Sample size (n), mean, SEM, and One-way Anova (and nonparametric) Turkey's multiple comparisons test are presented for the data in Figure 2—figure supplement 2C,D,F,G,I,J,L,M
- https://doi.org/10.7554/eLife.28409.011
Figure 2—figure supplement 1
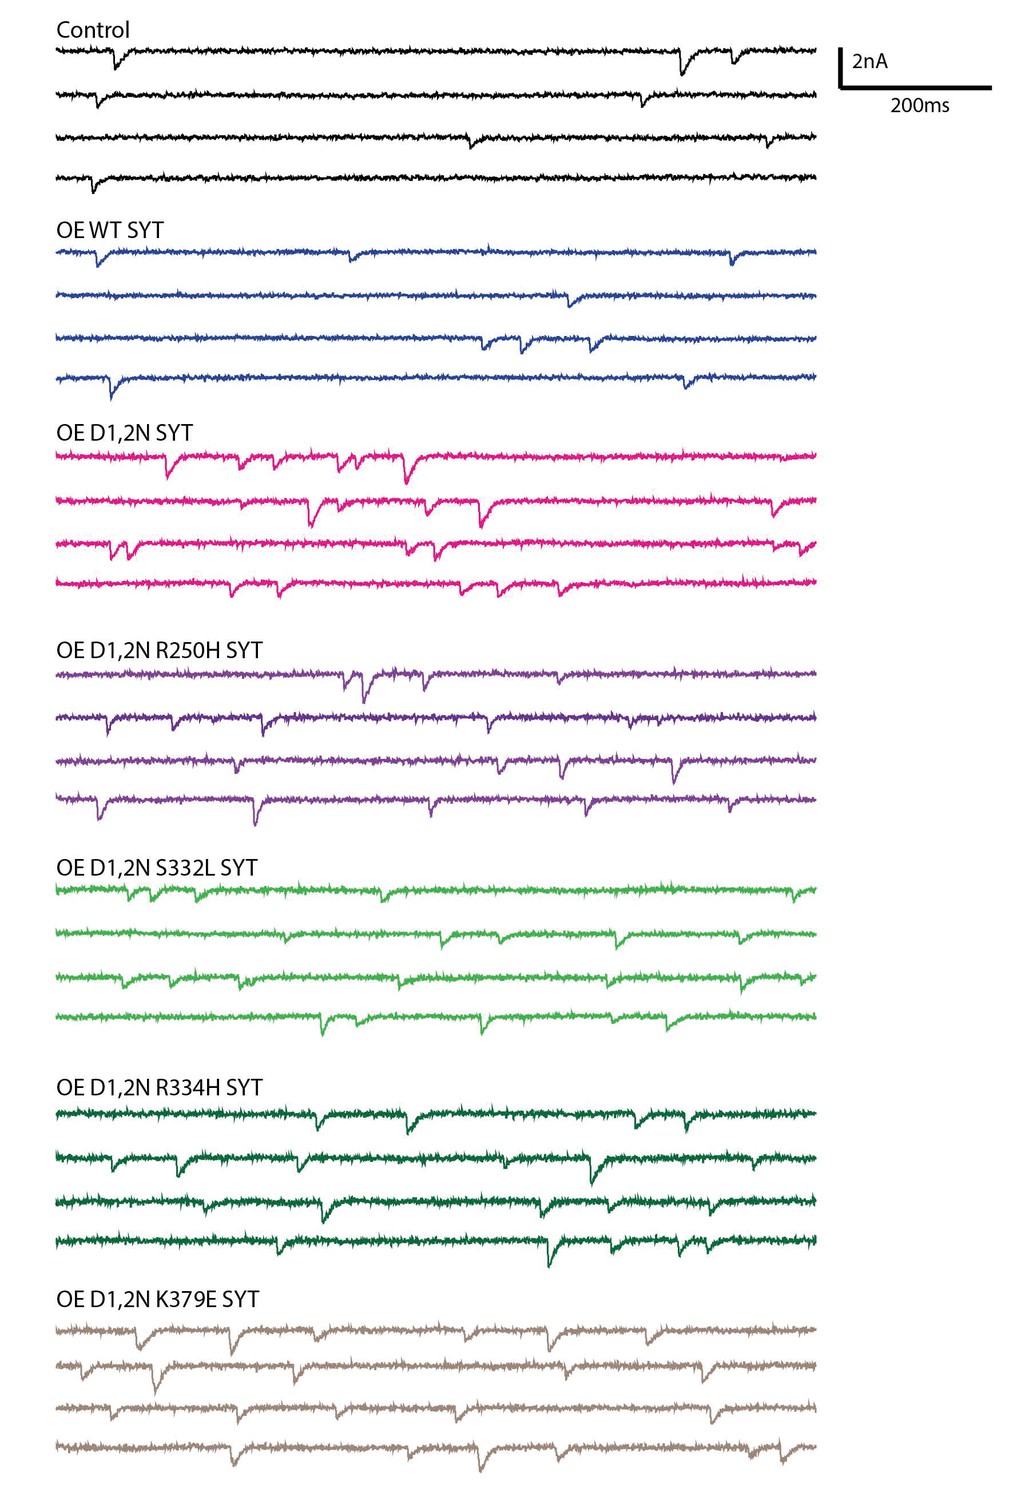
Postsynaptic current recordings of spontaneous release at third instar larval muscle 6 synapses in controls and in larvae overexpessing the indicated Syt1 transgenic protein by elav-GAL4 in HL3.1 saline.
Scale bar: 2 nA, 200 ms.
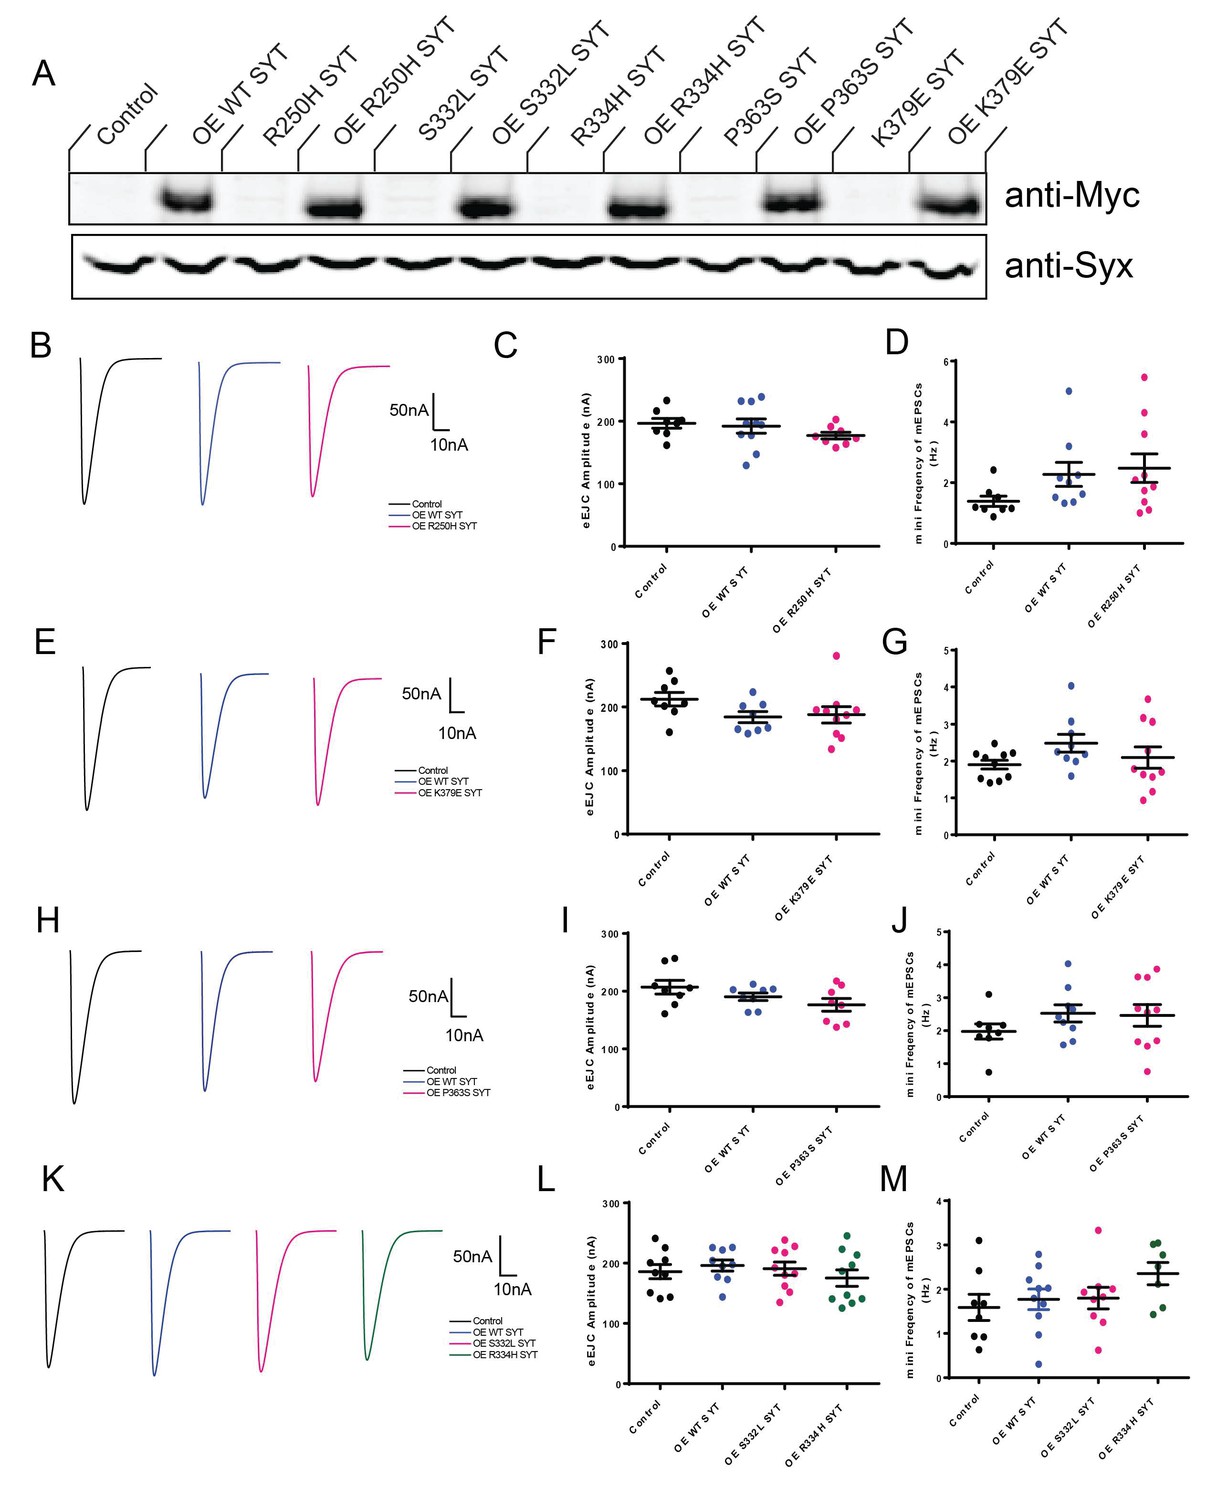
Figure 2—figure supplement 2
Characterization of the effects of mutant overexpression in the wildtype background.
(A) Western Blot of overexpressed Syt1 mutant proteins in head extracts of elavC155-GAL4; UAS-WT-Myc SYT (OE WT SYT), control elavC155-GAL4 without UAS (Control); elavC155-GAL4; UAS-R250H-Myc SYT (OE R250H SYT) and control UAS-R250H-Myc SYT without a driver (R250H SYT); elavC155-GAL4; UAS-S332L-Myc SYT (OE S332L SYT) and control UAS-S332L-Myc SYT without a driver (S332L SYT); elavC155-GAL4; UAS-R334H-Myc SYT (OE R334H SYT) and control UAS-R334H-Myc SYT without a driver (R334H SYT); elavC155-GAL4; UAS-P363S-Myc SYT (OE P363S SYT) and control UAS-P363S-Myc SYT without a driver (P363S SYT); elavC155-GAL4; UAS-K379E-Myc SYT (OE K379E SYT) and control UAS-K379E-Myc SYT without a driver (K379E SYT). The top panel shows anti-Myc immunoreactivity, while the bottom panel shows anti-Syntaxin (anti-Syx) immunoreactivity as a loading control. (B) Representative eEJCs recorded in 0.8 mM extracellular Ca2+ in control (black), elavC155-GAL4; UAS-WT-Myc SYT (OE WT SYT, blue) and elavC155-GAL4; UAS-R250H-Myc SYT (OE R250H SYT, magenta). (C) Quantification of mean eEJC amplitude for the indicated genotypes: control, 196.7 ± 7.8 nA, n = 8; OE WT SYT, 192.2 ± 11.4 nA, n = 10; OE R250H SYT, 177.0 ± 5.3 nA, n = 8. (D) Quantification of average mini frequency for the indicated genotypes: control, 1.4 ± 0.2 Hz, n = 8; OE WT SYT, 2.5 ± 0.5 Hz, n = 10; OE R250H SYT, 2.3 ± 0.4 Hz, n = 9. (E) Representative eEJCs recorded in 0.8 mM extracellular Ca2+ in control (black), elavC155-GAL4; UAS-WT-Myc SYT (OE WT SYT, blue) and elavC155-GAL4; UAS-K379E-Myc SYT (OE K379E SYT, magenta). (F) Quantification of mean eEJC amplitude for the indicated genotypes: control, 212.2 ± 10.6 nA, n = 8; OE WT SYT, 184.2 ± 8.4 nA, n = 8; OE K379E SYT, 187.9 ± 12.5 nA, n = 10. (G) Quantification of average mini frequency for the indicated genotypes: control, 1.9 ± 0.1 Hz, n = 10; OE WT SYT, 2.5 ± 0.2 Hz, n = 9; OE K379E SYT, 2.1 ± 0.3 Hz, n = 10. (H) Representative eEJCs recorded in 0.8 mM extracellular Ca2+ in control (black), elavC155-GAL4; UAS-WT-Myc SYT (OE WT SYT, blue) and elavC155-GAL4; UAS-P363S-Myc SYT (OE P363S SYT, magenta). (I) Quantification of mean eEJC amplitude for the indicated genotypes: control, 207.0 ± 11.8 nA, n = 8; OE WT SYT, 190.4 ± 6.5 nA, n = 8; OE P363S SYT, 176.3 ± 11.0 nA, n = 8. (J) Quantification of average mini frequency for the indicated genotypes: control, 2.0 ± 0.2 Hz, n = 8; OE WT SYT, 2.5 ± 0.3 Hz, n = 9; OE P363S SYT, 2.5 ± 0.3 Hz, n = 10. (K) Representative eEJCs recorded in 0.8 mM extracellular Ca2+ in control (black), elavC155-GAL4; UAS-WT-Myc SYT (OE WT SYT, blue), elavC155-GAL4; UAS-S332L-Myc SYT (OE S332L SYT, magenta) and elavC155-GAL4; UAS-R334H-Myc SYT (OE R334H SYT, green). (L) Quantification of mean eEJC amplitude for the indicated genotypes: control, 186.0 ± 11.9 nA, n = 9; OE WT SYT, 196.1 ± 9.2 nA, n = 9; OE S332L SYT, 190.9 ± 11.0 nA, n = 10. OE R334H SYT, 175.3 ± 13.6 nA, n = 10. (M) Quantification of average mini frequency for the indicated genotypes: control, 1.6 ± 0.3 Hz, n = 8; OE WT SYT, 1.8 ± 0.2 Hz, n = 10; OE S332L SYT, 1.8 ± 0.2 Hz, n = 9; OE R334H SYT, 2.4 ± 0.3 Hz, n = 7. Statistical significance was determined using one-way ANOVA (nonparametric) with post hoc Tukey’s multiple comparisons test. N.S. = no significant change (p>0.05). All error bars are SEM.
Figure 3 with 3 supplements
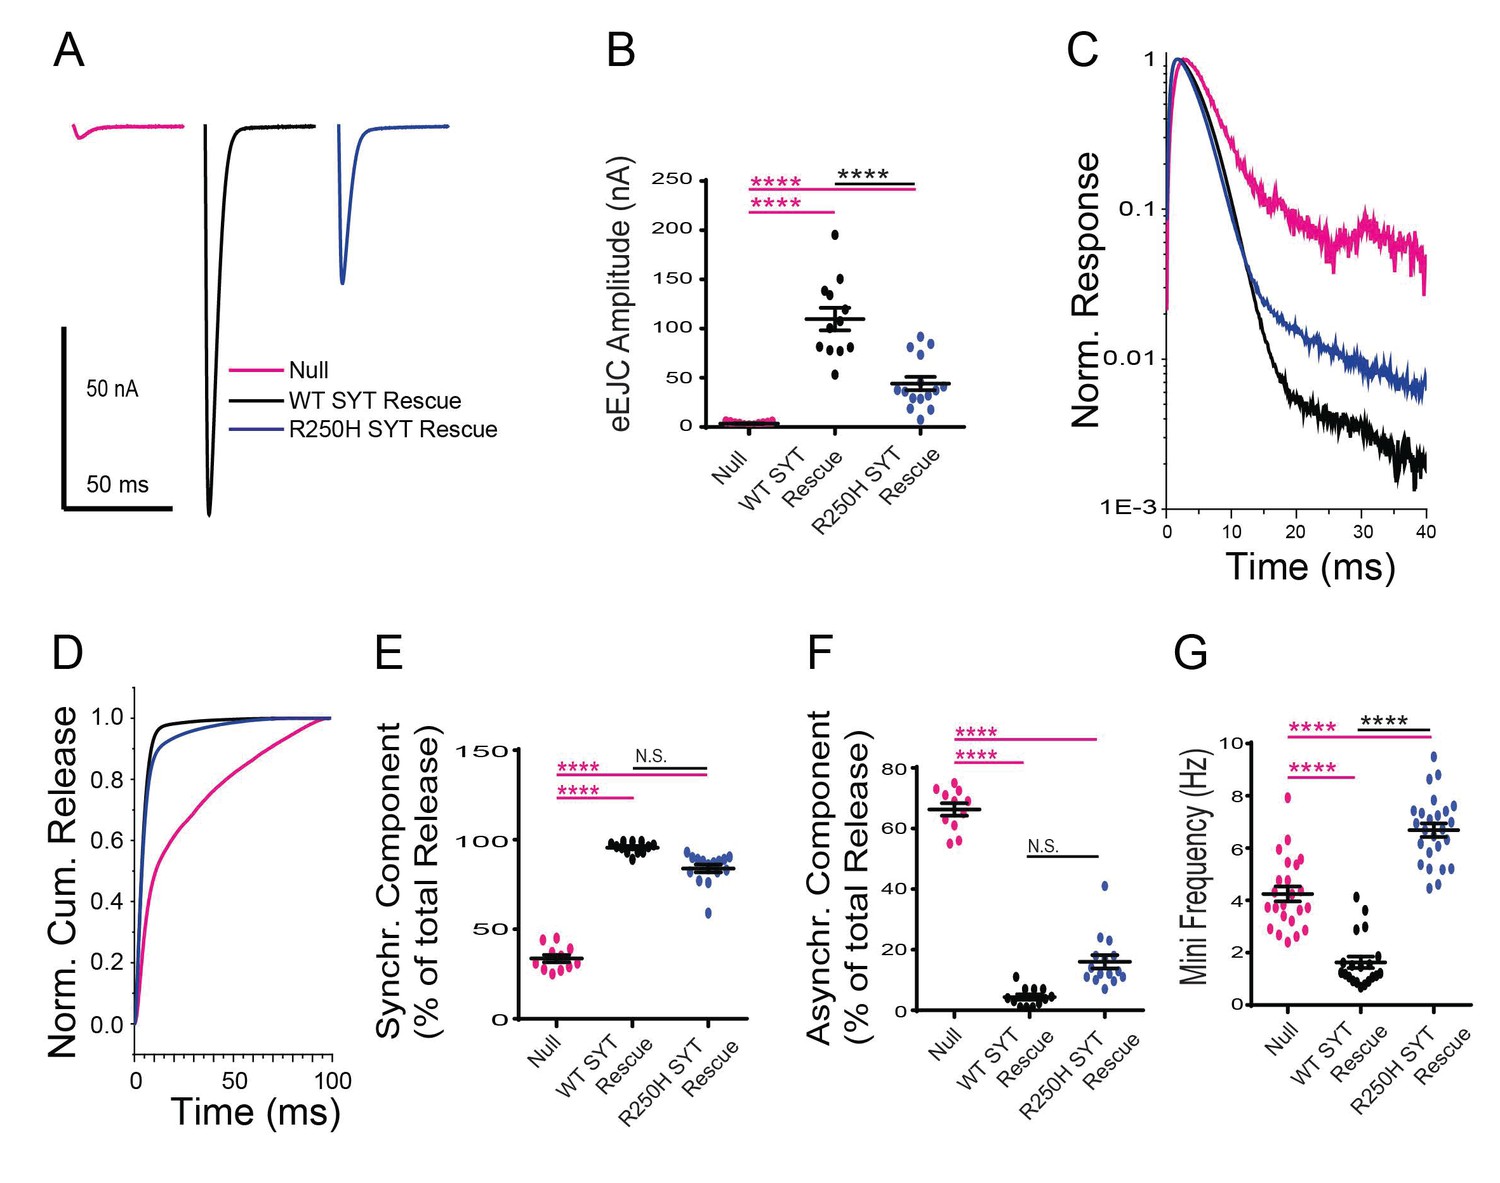
Effects of the R250H mutation on synaptic vesicle fusion.
(A) Representative eEJCs recorded in 2.0 mM extracellular Ca2+ in syt1 -/- null larvae (magenta), and null mutants rescued with wildtype Syt1 (WT SYT rescue, black) or R250H Syt1 (R250H SYT rescue, blue). (B) Quantification of mean eEJC amplitudes in the indicated genotypes: null, 3.5 ± 0.4 nA, n = 11; WT Syt1 rescue, 109.7 ± 11.5 nA, n = 12; R250H Syt1 rescue, 44.1 ± 6.8 nA, n = 15. (C) Average normalized responses for each genotype plotted on a semi-logarithmic graph to display release components. (D) Cumulative release normalized for the maximum in 2.0 mM Ca2+ for each genotype. Each trace was adjusted to a double exponential fit. (E) Quantification of the synchronous component of release for each genotype: null, 33.7 ± 2.1%, n = 11; WT Syt1 rescue, 95.6 ± 0.9%, n = 12; R250H Syt1 rescue, 84.0 ± 2.2%, n = 15. (F) Quantification of the asynchronous components of release for each genotype: null, 66.3 ± 2.1%, n = 11; WT Syt1 rescue, 4.4 ± 0.9%, n = 12; R250H Syt1 rescue, 16.0 ± 2.2%, n = 15. (G) Quantification of average mini frequency for the indicated genotypes: null, 4.2 ± 0.3 Hz, n = 23; WT Syt1 rescue, 1.6 ± 0.2 Hz, n = 20; R250H Syt1 rescue, 6.7 ± 0.3 Hz, n = 25. Statistical significance was determined using one-way ANOVA (nonparametric) with post hoc Sidak’s multiple comparisons test. N.S. = no significant change, ****p<0.0001. Error bars are SEM.
-
Figure 3—source data 1
Sample size (n), mean, SEM, and One-way Anova (and nonparametric) Sidak's multiple comparisons test are presented for the data in Figure 3B, Figure 6B and Figure 8B.
- https://doi.org/10.7554/eLife.28409.016
-
Figure 3—source data 2
Sample size (n), mean, SEM, and One-way Anova (and nonparametric) Sidak's multiple comparisons test are presented for the data in Figure 3E, Figure 6E and Figure 8E.
- https://doi.org/10.7554/eLife.28409.017
-
Figure 3—source data 3
Sample size (n), mean, SEM, and One-way Anova (and nonparametric) Sidak's multiple comparisons test are presented for the data in Figure 3F, Figure 6F and Figure 8F.
- https://doi.org/10.7554/eLife.28409.018
-
Figure 3—source data 4
Sample size (n), mean, SEM, and One-way Anova (and nonparametric) Sidak's multiple comparisons test are presented for the data in Figure 3G, Figure 6G and Figure 8G.
- https://doi.org/10.7554/eLife.28409.019
-
Figure 3—source data 5
Sample size (n), mean, SEM, and One-way Anova (and nonparametric) multiple comparisons test are presented for the data in Figure 3—figure supplement 2
- https://doi.org/10.7554/eLife.28409.020
Figure 3—figure supplement 1
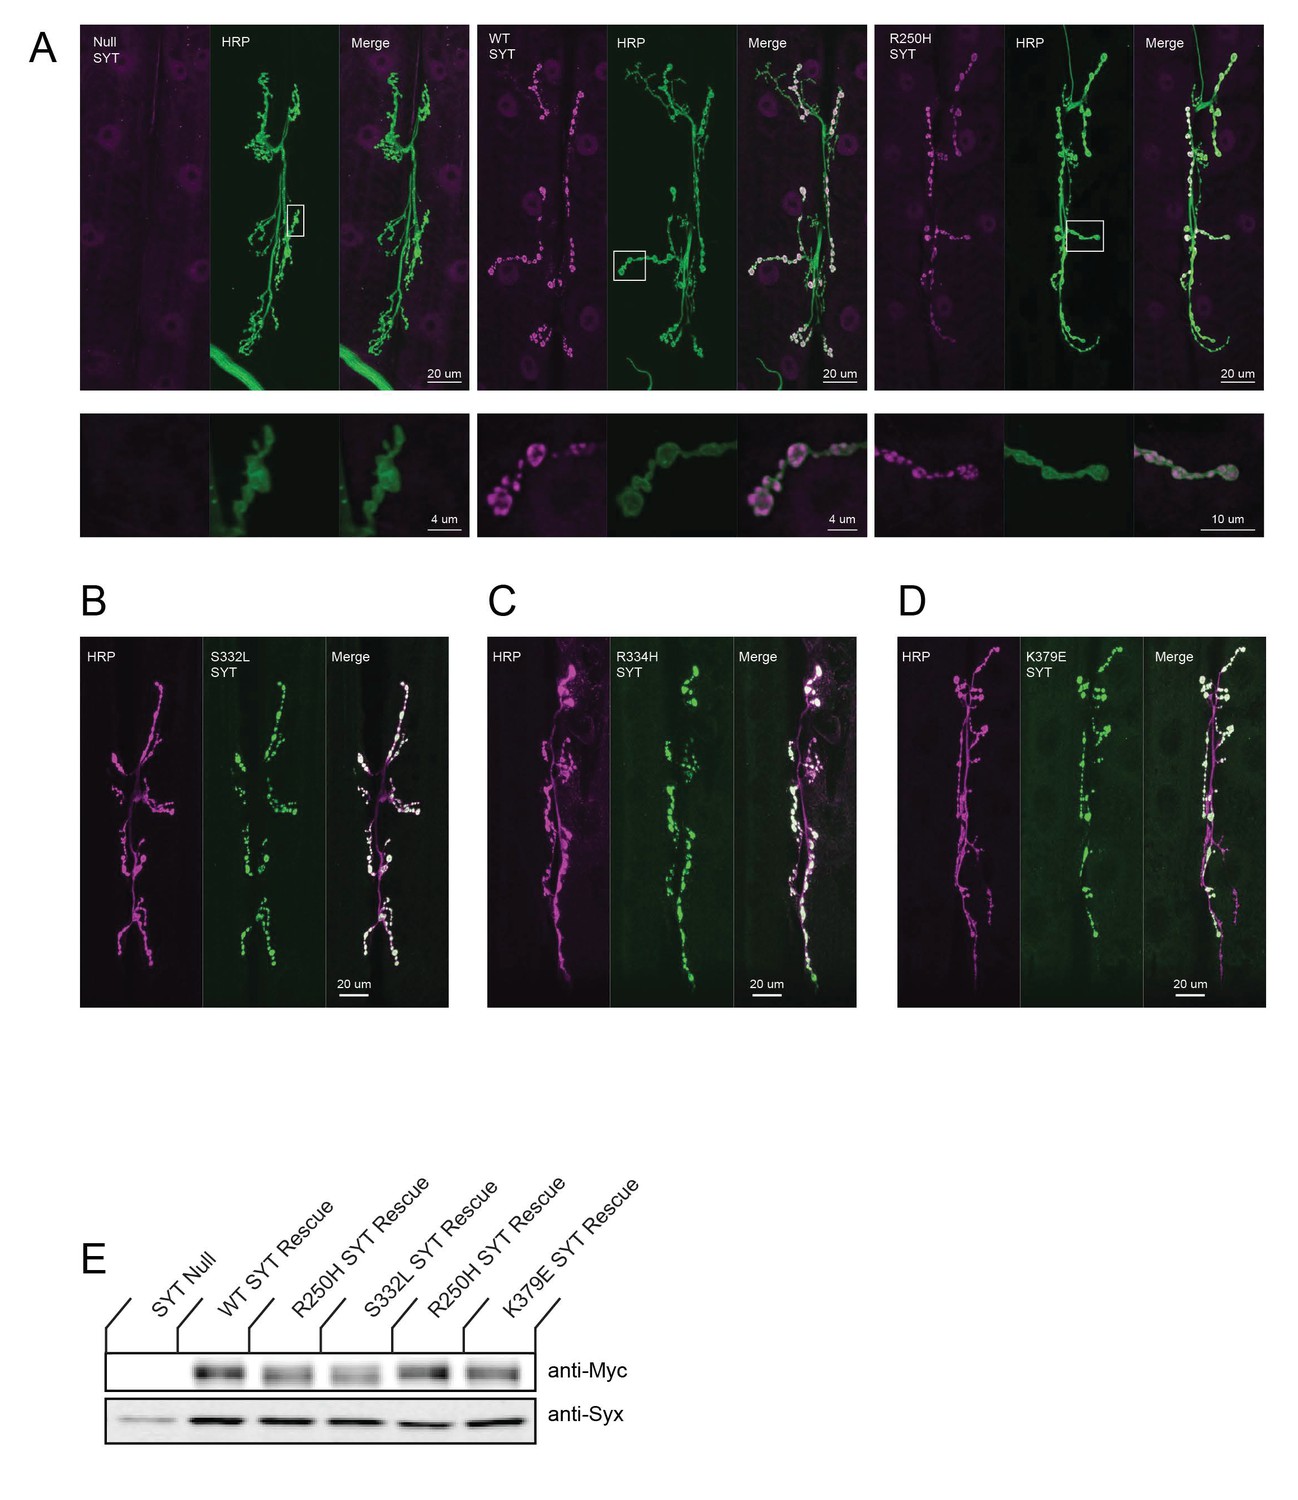
Syt1 mutant proteins normally target to the synapse.
(A) Representative NMJs stained with anti-Syt1 antiserum (magenta) in control syt1 null mutants (Null) versus null mutants rescued with wildtype Syt1 or R250H Syt1 driven by elavC155-GAL4 in the syt1 null background. Staining with the neuronal membrane marker anti-HRP is shown in green. The lower images are magnified views from the boxed regions in each panel. Wildtype and R250H Syt1 proteins target normally to presynaptic terminals. Scale bar: 20 um (upper panel), 4 um (lower panel). (B–D) Representative NMJs stained with anti-Syt1 (green) for the indicated transgenic rescue proteins driven by elavC155-GAL4 in the syt1 null background. Anti-HRP staining is displayed in magenta. The Syt1 mutant proteins target normally to presynaptic terminals. Scale bar is 20 µm. (E) Western Blot of expressing Syt1 mutant proteins with Myc tag in head extracts driven by elavC155-GAL4 in Syt null (Null) background. The top panel shows anti-Myc immunoreactivity, while the bottom panel shows anti-Syntaxin (anti-Syx) immunoreactivity as a loading control.
Figure 3—figure supplement 2
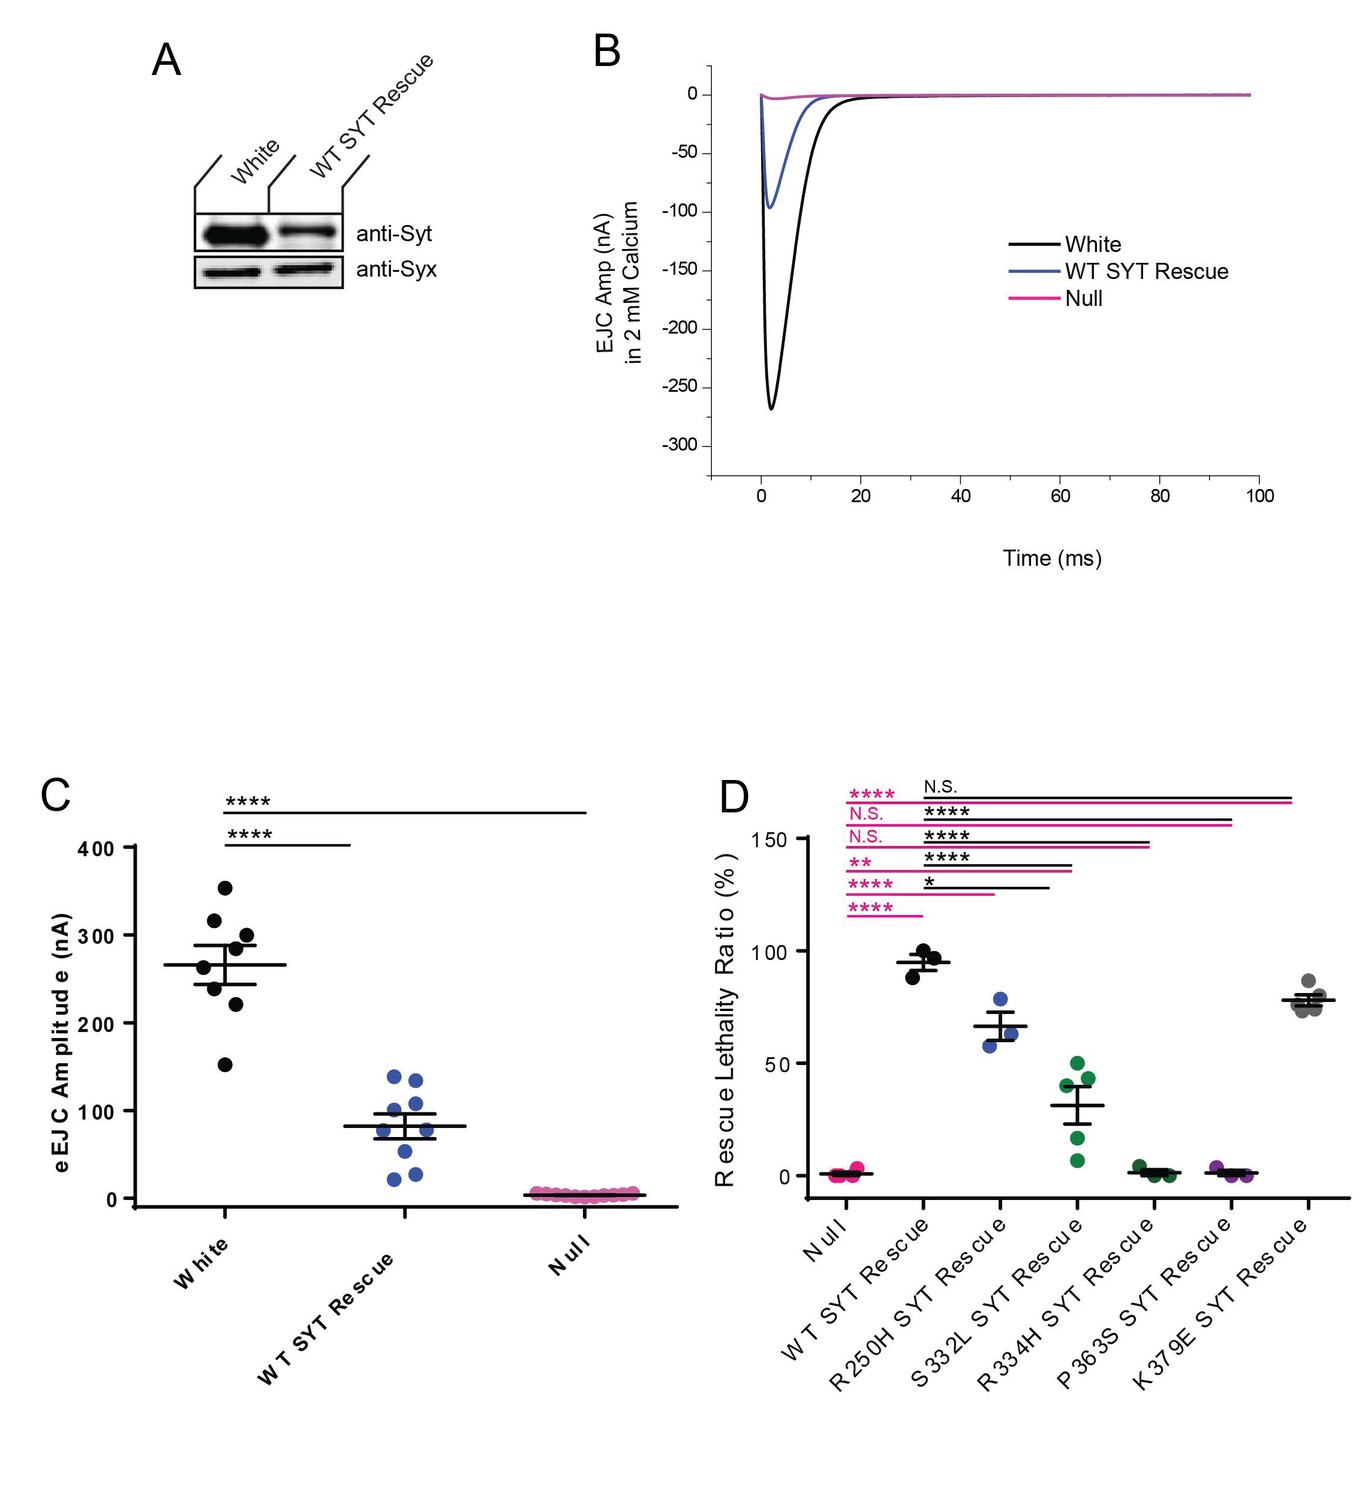
Comparison of wildtype (white) animals and Syt1 transgenic rescue.
(A) Western analysis of head extracts from adults expressing the wildtype Syt1 transgenic protein driven by elavC155-GAL4 in the syt1 null background compared to controls (white) expressing endogenous Syt1. The top panel shows anti-Syt immunoreactivity, while the bottom panel shows anti-Syntaxin (anti-Syx) immunoreactivity as a loading control. These transgenses are inserted through site-specific transformation via the ΦC31 integrase system, and are expressed at lower levels than the Syt1C2BD1,2N or Syt1C2BD3,4N overexpression lines. (B) Representative eEJCs recorded in 2 mM extracellular Ca2+ in white (black trace), elavC155-GAL4; UAS-wildtype Syt1 (WT SYT, blue) and the syt1 null (Null, magenta). (C) Quantification of mean eEJC amplitude for the indicated genotypes: white, 266.0 ± 22.1 nA, n = 8; WT SYT rescue, 81.9 ± 14.1 nA, n = 9; Null, 3.5 ± 0.4 nA, n = 11. Statistical significance was determined using one-way ANOVA (nonparametric) with post hoc Dunnett’s multiple comparisons test. ****p<0.0001. All error bars are SEM. (D) The ability of transgenes to rescue the lethality of the syt1 null is shown. Larvae were collected at the 1st instar larval stage and placed into food vials. The number of animals surviving to the adult stage was quantified. Quantification of average rescue ratio (%) for the indicated genotypes: null, 0.8 ± 0.8, n = 3; WT SYT Rescue, 94.9 ± 3.6, n = 3; R250H SYT Rescue, 66.4 ± 6.3, n = 3; S332L SYT Rescue, 31.3 ± 8.3, n = 5; R334H SYT Rescue, 1.4 ± 1.3, n = 3; P363S SYT Rescue, 1.2 ± 1.2, n = 3; K379E SYT Rescue, 78.0 ± 2.5, n = 5. Statistical significance was determined using one-way ANOVA (nonparametric) with post hoc Sidak’s multiple comparisons test. The results were all shown N.S. = no significant change (p>0.05), *p<0.05; **p<0.005; *****p<0.0001. All error bars are SEM.
Figure 3—figure supplement 3
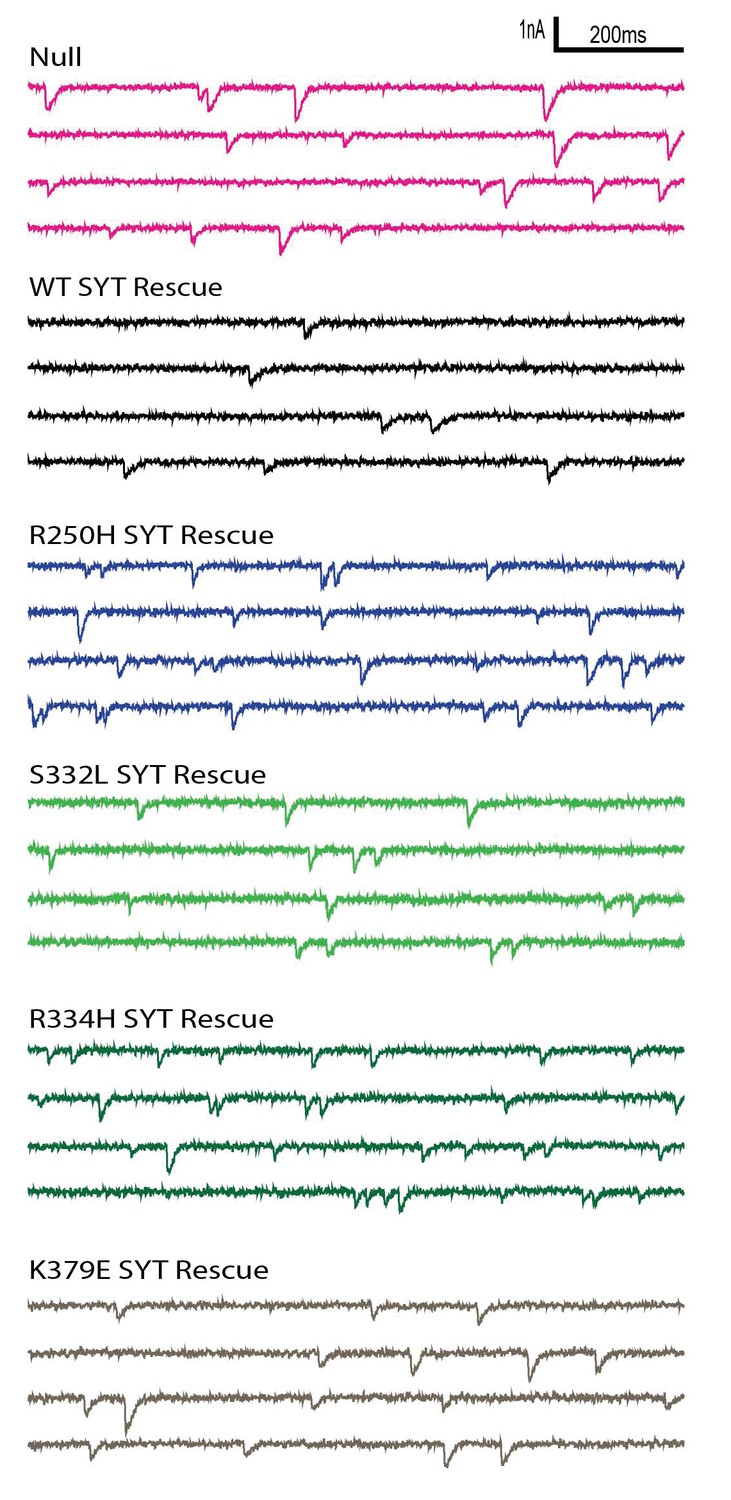
Postsynaptic current recordings of spontaneous release at third instar larval muscle 6 NMJs of the indicated genotypes in HL3.1 saline with 2 mM Ca2+.
Scale bar: 1 nA, 200 ms.
Figure 4

The R199H mutation (homologous to Drosophila R250H) drastically enhances Syt1 conformational flexibility.
(A) RMSD computed for backbone atoms of mammalian Syt1 along the MD trajectory. Note a region of instability between 0.5 and 1 µs, which is followed by a conformational transition. Arrows indicate the states shown in D. (B) Backbone RMSD per frame along the trajectory. Note a region of instability in the middle of the trajectory, followed by a relatively stable state (state 4, panel D) between 1.8 and 3.3 µs of the simulation. (C) Gyration radius along the trajectory indicating the separation between domains. Note a transient separation of the domains at 1.2–1.3 µs, which is followed by a decrease in gyration radius, corresponding to tightening of the overall structure. (D) Subsequent states of Syt1 along the trajectory. Note that the organization of the domains remains stable from state 0 to state 2, with a light separation of the domains in state 1. The transient state 3 has separated domains with the Ca2+-binding loops facing the same surface. This state transitions to a stable state 4 with Ca2+ binding loops of the C2A domain interacting with the alpha-helix of the C2B domain, similar to the initial state 0. (E) In the final state of the Syt1 trajectory, residue R199 (yellow) is positioned at the interface of the C2A and C2B domains. (F) RMSD for R199H Syt1 shows a major conformational transition in the beginning of the trajectory, as well as a lack of overall stability. (G) RMSD for R199H Syt1 shows multiple conformational transitions, especially in the second half of the trajectory. (H) The gyration radius of R199H Syt1 shows a separation of the domains in the beginning of the trajectory, followed by major fluctuations, corresponding to transient separation and tightening of the domains. (I) Subsequent states of R199H Syt1 along the trajectory show major rearrangements of the domains. (J) The trajectory of R199H Syt1 has an RMSD distribution shifted to the right, indicating more prominent conformational transitions. Note two closely positioned peaks in the WT distribution, corresponding to two stable conformational states along the trajectory. In contrast, the trajectory of mutated Syt1 shows five RMSD peaks, corresponding to five different conformations, all shifted to the right and considerably deviated from the initial state. (K) The RMSD per frame distribution is shifted for R199H Syt1, demonstrating more prominent conformational changes from frame to frame. (L) The gyration radius distribution is shifted in mutant Syt1, demonstrating a larger separation between the domains.
Figure 5
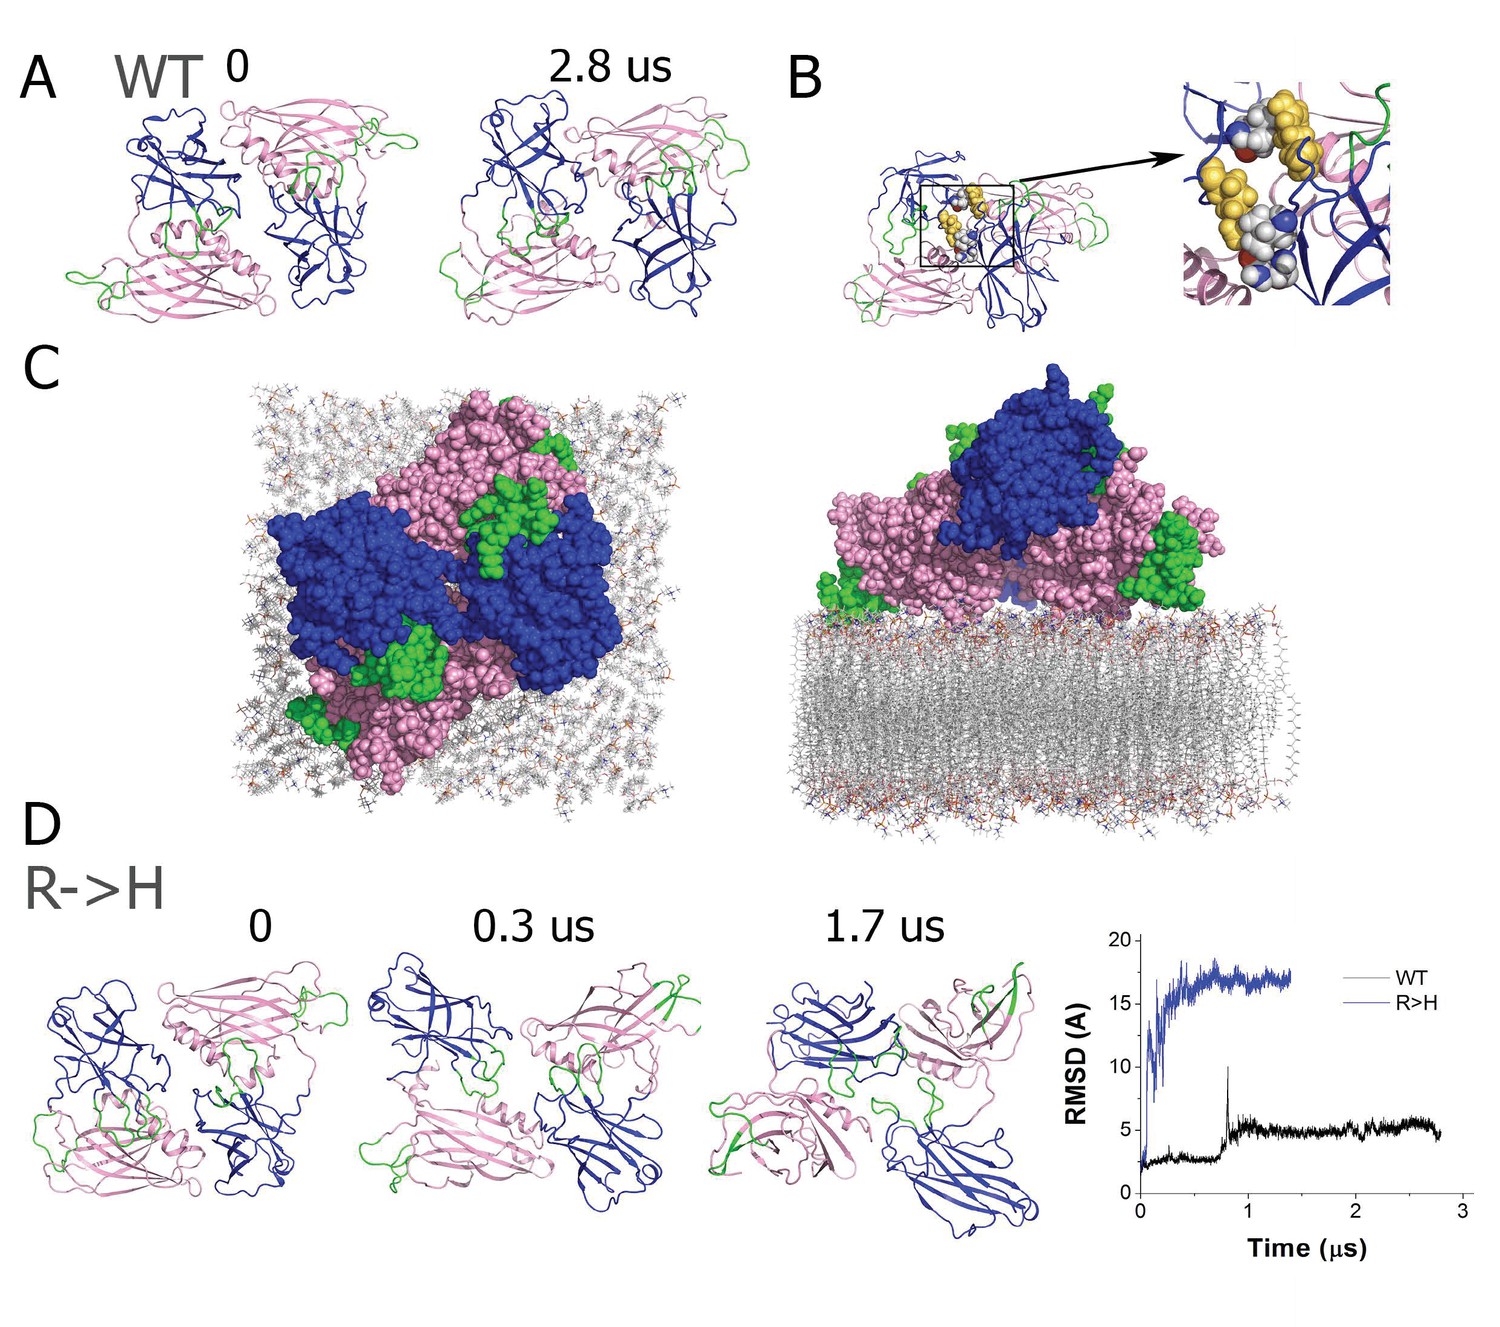
The R199H mutation destabilizes the Syt1 dimer.
(A) The dimer structure of native Syt1 is stable in the water/ion environment at the microsecond time scale. Note similar arrangements of monomers and dimers in the initial and final states. (B) The R199 residue (yellow) is central in van der Waals interactions between Syt1 monomers that form the dimer structure. (C) Structural model of the Syt1 dimer on top of the plasma membrane from a top-down view (left) and a perpendicular view to the membrane (right). Note the polybasic region of the C2B domain (magenta) interacts with the membrane, positioning the C2B Ca2+ binding loops (green) near the plasma membrane. In contrast, the Ca2+ binding loops (green) of the C2A domain (blue) face the opposite side of the structure, and could serve to interact with the synaptic vesicle membrane to bridge the two bilayers. (D) The dimeric structure of Syt1 is disrupted in the R199H mutant. Three states along the trajectory of the mutated dimer show a major rearrangement of the domains. The RMSD plot on the right reveals a major conformational transition at the beginning of the trajectory of R199H Syt1 (blue trace) compared to the trajectory of native Syt1 (black trace).
Figure 6
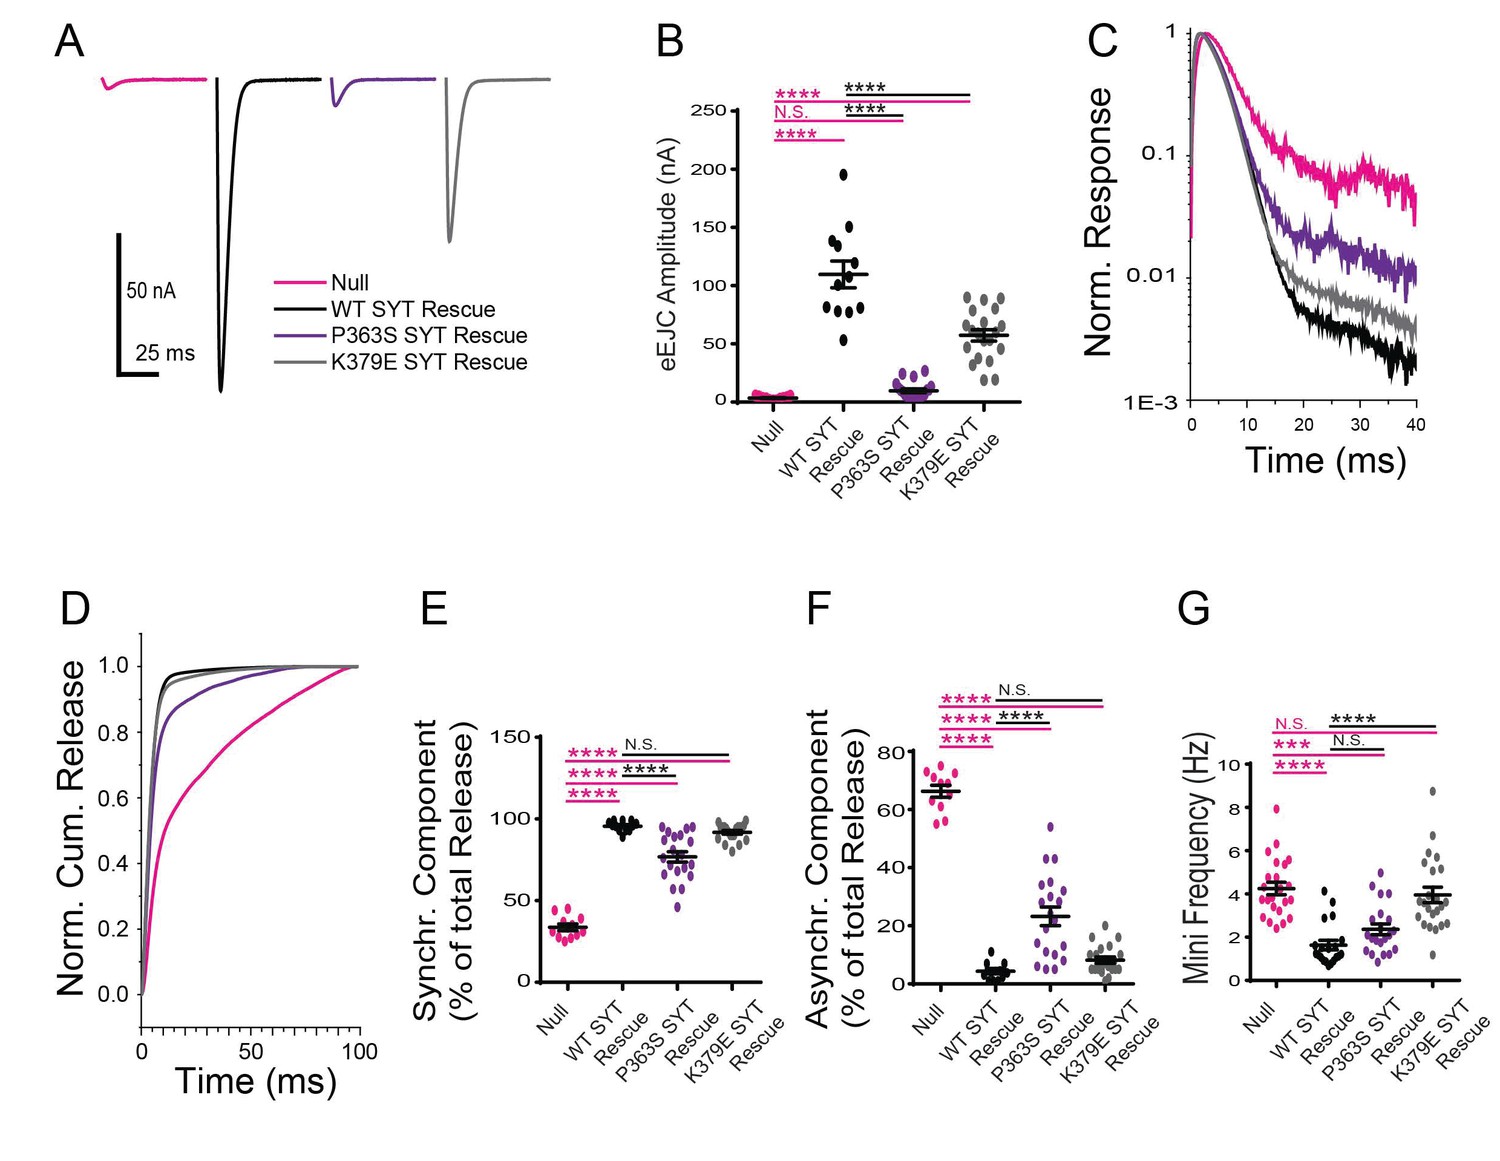
Physiological analysis of the K379E and P363S mutants on neurotransmitter release.
(A) Representative eEJCs recorded in 2.0 mM extracellular Ca2+ in syt1 -/- null larvae (magenta) and null mutants rescued with WT Syt1 (black), P363S Syt1 (purple) or K379E Syt1 (grey). (B) Quantification of mean eEJC amplitude for the indicated genotypes: null, 3.5 ± 0.4 nA, n = 11; WT Syt1 rescue, 109.7 ± 11.5 nA, n = 12; P363S Syt1 rescue, 9.8 ± 1.7 nA, n = 20; K379E Syt1 rescue, 57.3 ± 4.9 nA, n = 20. C. Average normalized responses plotted on a semi-logarithmic graph to display their components. (C) Average normalized responses for each genotype plotted on a semi-logarithmic graph to display release components. (D) Cumulative release normalized for the maximum in 2.0 mM Ca2+ for each genotype. Each trace was adjusted to a double exponential fit. (E) Quantification of the synchronous components of release for each genotype: null, 33.7 ± 2.1%, n = 11; WT Syt1 rescue, 95.6 ± 0.9%, n = 12; P363S Syt1 rescue, 76.8 ± 3.2%, n = 20; K379E Syt1 rescue, 91.8 ± 1.1%, n = 20. (F) Quantification of the asynchronous components of release for each genotype: null, 66.3 ± 2.1%, n = 11; WT Syt1 rescue, 4.4 ± 0.9%, n = 12; P363S Syt1 rescue, 23.2 ± 3.2%, n = 20; K379E Syt1 rescue, 8.2 ± 1.1%, n = 20. (G) Quantification of average mini frequency for the indicated genotypes: null, 4.2 ± 0.3 Hz, n = 23; WT Syt1 rescue, 1.6 ± 0.2 Hz, n = 20; P363S Syt1 rescue, 2.4 ± 0.2 Hz, n = 21; K379E Syt1 rescue, 4.0 ± 0.3 Hz, n = 23. Statistical significance was determined using one-way ANOVA (nonparametric) with post hoc Sidak’s multiple comparisons test. N.S. = no significant change, ***p<0.0005, ****p<0.0001. All error bars are SEM.
Figure 7

The Syt1-SNARE interaction surface (Zhou et al., 2015) reveals that residues S332 (S279 in mammalian Syt1), R334 (R281), Y391 (Y338), E348 (E295), and A455 (A402) are positioned at the Syt1-SNARE interface.
All five residues were identified as suppressors in our genetic screen. (A,B) Two perpendicular views of the Syt1-SNARE complex are shown. The residues listed above are shown in yellow. Orange – synaptobrevin; cyan – syntaxin; red – SN1 domain of SNAP25; silver – SN2 domain of SNAP25. (C,D) Magnified views of opposite surfaces of the Syt1-SNARE interface are shown. Note that the Syt1-SNARE interaction is supported by a salt bridge between R334 (R281) of Syt1 and E55 of SNAP25. In addition, S332 (S279) forms hydrophobic interactions with V48 of SNAP25.
Figure 8
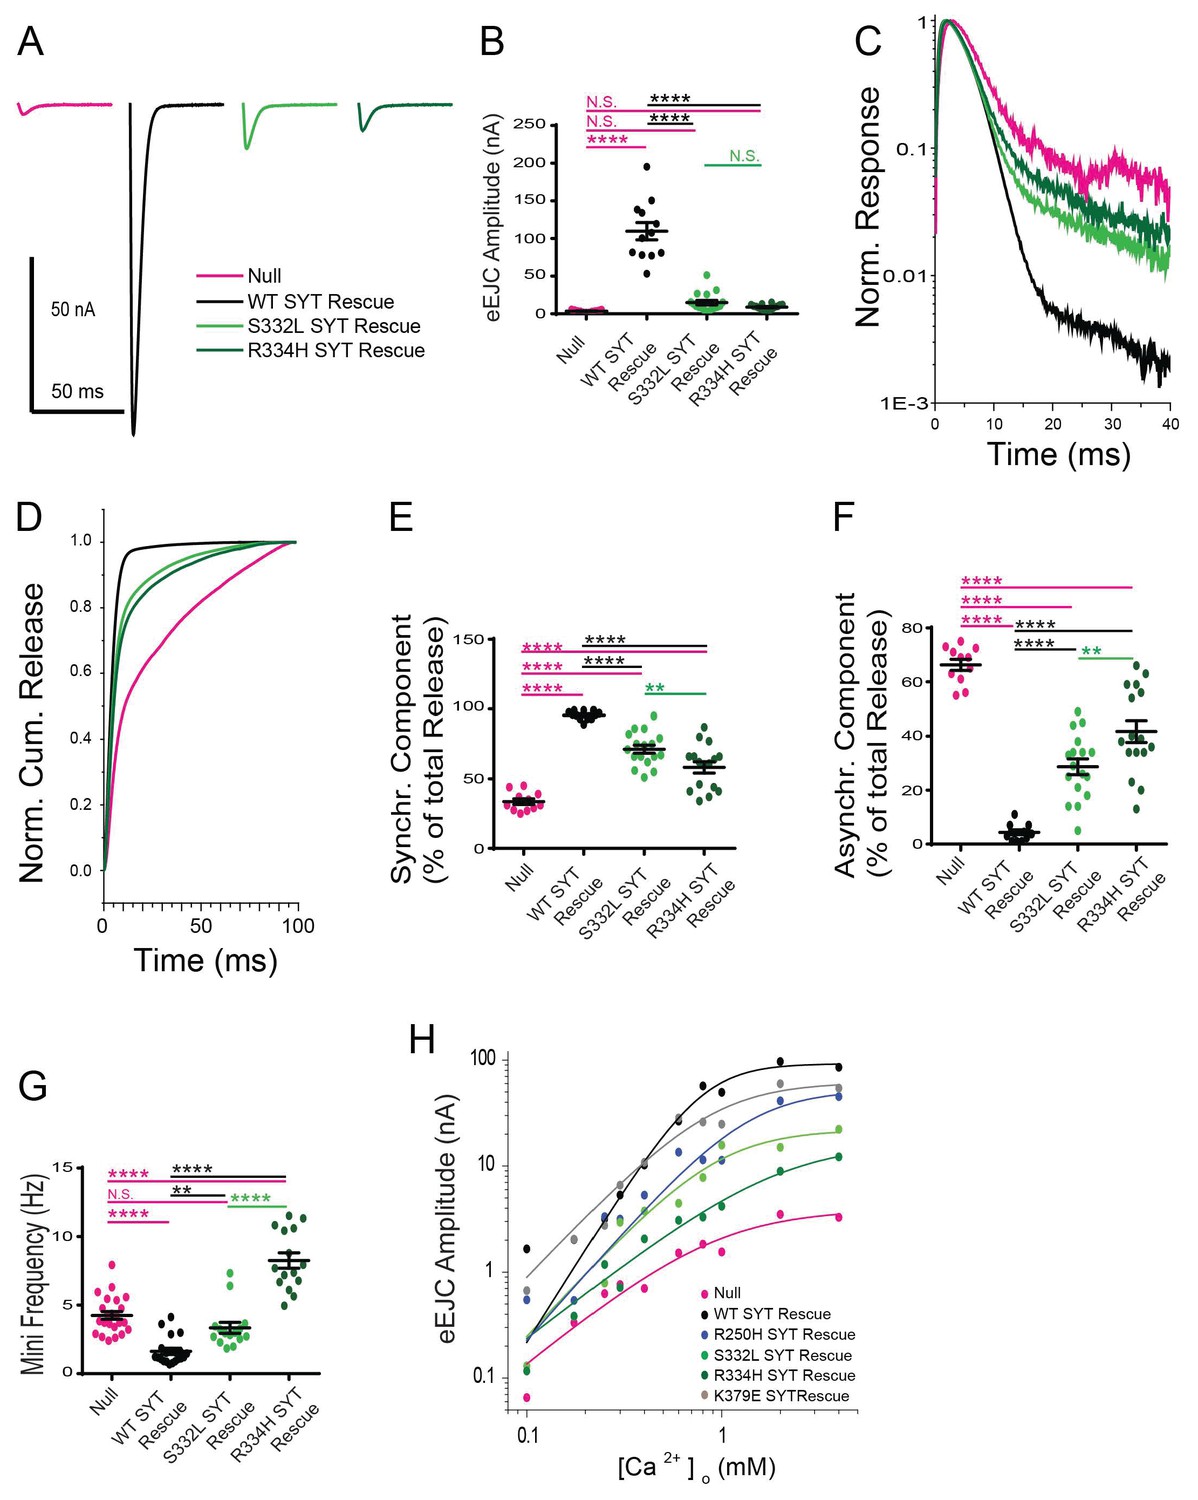
Effects of the S332L and R334H mutations on neurotransmitter release.
(A) Representative eEJCs recorded in 2.0 mM extracellular Ca2+ in syt1 -/- null larvae (magenta) and null mutants rescued with WT Syt1 (black), S332L Syt1 (light green) or R334H Syt1 (dark green). (B) Quantification of mean eEJC amplitudes for the indicated genotypes: null, 3.5 ± 0.4 nA, n = 11; WT Syt1 rescue, 109.7 ± 11.5 nA, n = 12; S332L Syt1 rescue, 14.9 ± 3.0 nA, n = 17; R334H Syt1 rescue, 8.8 ± 0.9 nA, n = 16. (C) Average normalized responses plotted on a semi-logarithmic graph to display their components. (D) Cumulative release normalized for the maximum in 2.0 mM Ca2+ for each genotype. Each trace was adjusted to a double exponential fit. (E) Quantification of the synchronous components of release for each genotype: null, 33.7 ± 2.1%, n = 11; WT Syt1 rescue, 95.6 ± 0.9%, n = 12; S332L Syt1 rescue, 71.3 ± 2.9%, n = 17; R334H Syt1 rescue, 58.3 ± 4.0%, n = 16. (F). Quantification of the asynchronous components of release for each genotype: null, 66.3 ± 2.1%, n = 11; WT Syt1 rescue, 4.4 ± 0.9%, n = 12; S332L Syt1 rescue, 28.7 ± 2.9%, n = 17; R334H Syt1 rescue, 41.8 ± 4.0%, n = 16. (G) Quantification of average mini frequency for the indicated genotypes: null, 4.2 ± 0.3 Hz, n = 23; WT Syt1 rescue, 1.6 ± 0.2 Hz, n = 20; S332L Syt1 rescue, 3.3 ± 0.4 Hz, n = 15; R334H Syt1 rescue, 8.3 ± 0.5 Hz, n = 15). For panels B-G, statistical significance was determined using one-way ANOVA (nonparametric) with post hoc Sidak’s multiple comparisons test. N.S. = no significant change, **=p < 0.01, ****=p < 0.0001. All error bars are SEM. (H) Ca2+ cooperativity of release is shown on a double logarithmic plot, with Hill fit for each genotype. Ten extracellular Ca2+ concentrations (mM) were tested: 0.1, 0.175, 0.25, 0.3, 0.4, 0.6, 0.8, 1, 2, 4. The cooperativity for the genotypes is (value ±standard error): null, 1.5 ± 0.4 (n = 102); WT Syt1 rescue, 2.9 ± 0.7 (n = 119); R250H Syt1 rescue, 2.1 ± 0.6 (n = 112); S332L Syt1 rescue, 2.0 ± 0.6 (n = 112); R334H Syt1 rescue, 1.4 ± 0.2 (n = 112); K379E Syt1 rescue, 1.9 ± 0.6 (n = 118). Regression analysis revealed significant differences in the WT Syt1 rescue (p<0.0001) and R334H Syt1 rescue (p<0.05) compared to null. The R250H Syt1 rescue (p<0.05) and the S332L Syt1 rescue (p<0.0001) were significantly different compared to WT Syt1 rescue. At least 6 recordings were performed in each concentration, with n indicating the total number of recordings in the 10 different Ca2+ concentrations.
-
Figure 8—source data 1
Sample size (n), mean, SEM are presented for the data in Figure 8H.
- https://doi.org/10.7554/eLife.28409.026
-
Figure 8—source data 2
Sample size (n), mean, SEM, and Hill Fit of Null are presented for the data in Figure 8H.
- https://doi.org/10.7554/eLife.28409.027
-
Figure 8—source data 3
Sample size (n), mean, SEM, and Hill Fit of WT SYT Rescue are presented for the data in Figure 8H.
- https://doi.org/10.7554/eLife.28409.028
-
Figure 8—source data 4
Sample size (n), mean, SEM, and Hill Fit of R250H SYT Rescue are presented for the data in Figure 8H.
- https://doi.org/10.7554/eLife.28409.029
-
Figure 8—source data 5
Sample size (n), mean, SEM, and Hill Fit of K379E SYT Rescue are presented for the data in Figure 8H.
- https://doi.org/10.7554/eLife.28409.030
-
Figure 8—source data 6
Sample size (n), mean, SEM, and Hill Fit of S332L SYT Rescue are presented for the data in Figure 8H.
- https://doi.org/10.7554/eLife.28409.031
-
Figure 8—source data 7
Sample size (n), mean, SEM, and Hill Fit of R334H SYT Rescue are presented for the data in Figure 8H.
- https://doi.org/10.7554/eLife.28409.032
-
Figure 8—source data 8
Regression Analysis are presented for the data in Figure 8H.
- https://doi.org/10.7554/eLife.28409.033
Figure 9 with 1 supplement
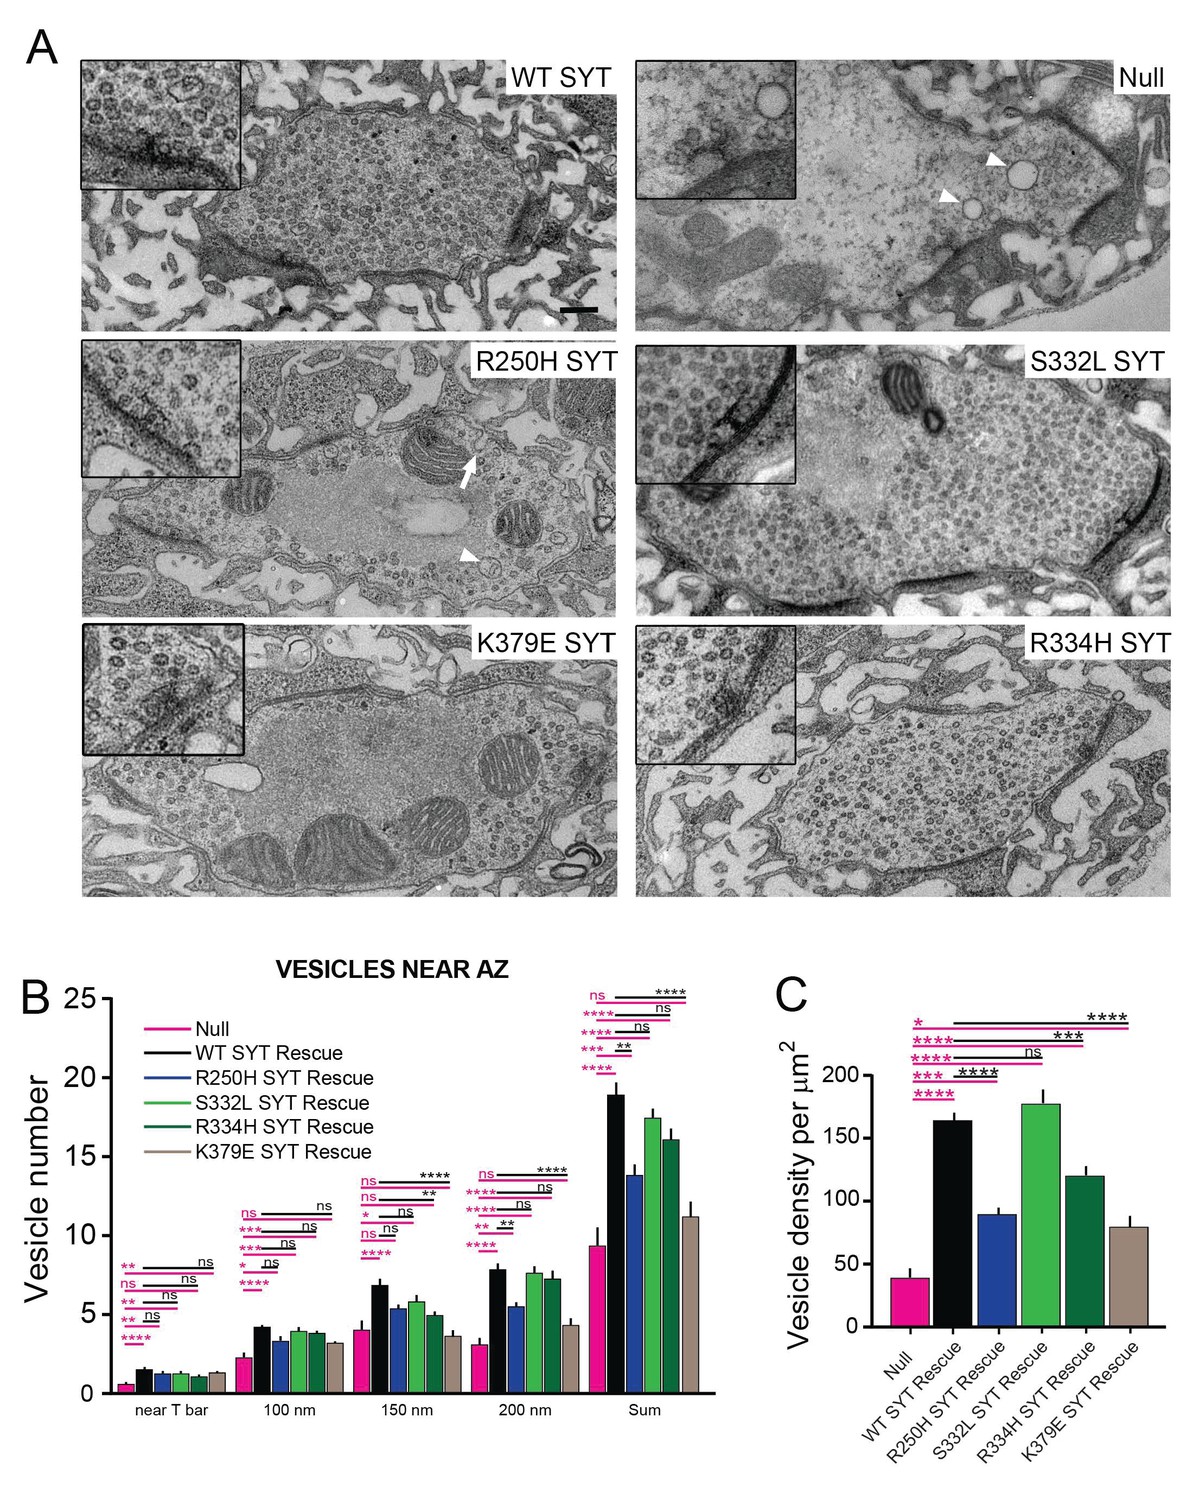
Ultrastructural synaptic defects in syt1 mutations.
(A) Representative electron micrographs of third instar synaptic boutons from the NMJ of syt1 null mutants rescued with the indicated transgenic lines. A 2X-magnified view of the T-bar is shown in the insert. Enlarged vacuolar structures prominent in the R250H rescue line are marked by a white arrowhead. Enlarged membrane invaginations in the R250H rescue are indicated by a white arrow. The scale bar is 0.2 μm. (B) Quantification of synaptic vesicle number located underneath the T-bar (near T-bar) or within 100 nm, 100–150 nm or 150–200 nm radius from the T-bar for the indicated genotypes. Quantification of vesicle number near T-bar for each genotype: null, 0.58 ± 0.16, n = 24; WT rescue, 1.5 ± 0.1, n = 20; R250H rescue 1.3 ± 0.1, n = 30; S332L rescue, 1.3 ± 0.1, n = 21; R334H rescue, 1.1 ± 0.1, n = 29; K379E rescue, 1.3 ± 0.2, n = 23. Quantification of vesicle number within 100 nm radius area around T-bar for each genotype: null, 2.3 ± 0.4, n = 24; WT rescue, 4.2 ± 0.2, n = 20; R250H rescue 3.3 ± 0.3, n = 32; S332L rescue, 4.0 ± 0.3, n = 21; R334H Rescue, 3.9 ± 0.2, n = 29; K379E Rescue, 3.2 ± 0.3, n = 23. Quantification of vesicle number within 100–150 nm area around T-bar for each genotype: null, 4.0 ± 0.5, n = 24; WT rescue, 6.9 ± 0.5, n = 20; R250H rescue 5.4 ± 0.3, n = 32; S332L rescue, 4.0 ± 0.3, n = 21; R334H rescue, 5.0 ± 0.3, n = 29; K379E rescue, 3.7 ± 0.4, n = 23. Quantification of vesicle number within 150–200 nm area around T-bar for each genotype: null, 3.2 ± 0.5, n = 24; WT rescue, 7.9 ± 0.5, n = 20; R250H rescue 5.5 ± 0.4, n = 32; S332L rescue, 7.7 ± 0.4, n = 21; R334H rescue, 7.3 ± 0.5, n = 29; K379E rescue, 4.3 ± 0.5, n = 23. Quantification of sum of vesicle number within 200 nm area around T-bar for each genotype: null, 9.3 ± 1.2, n = 24; WT SYT rescue, 18.9 ± 0.9, n = 20; R250H SYT rescue 14.3 ± 0.6, n = 32; S332L SYT rescue, 17.4 ± 0.7, n = 21; R334H SYT rescue, 16.1 ± 0.7, n = 29; K379E SYT rescue, 11.2 ± 0.9, n = 23. (C) Synaptic vesicle number was quantified and normalized to bouton area. Syt1 null mutants have a prominent reduction in vesicle number compared to control Syt1 rescued lines. Quantification of vesicle density for each genotype: null, 38.7 ± 7.5, n = 14; WT SYT rescue, 164.0 ± 7.4, n = 31; R250H SYT rescue 89.7 ± 6.6, n = 38; S332L SYT rescue, 177.3 ± 11.1, n = 18; R334H SYT rescue, 120.0 ± 6.9, n = 35; K379E SYT rescue, 79.6 ± 8.0, n = 20. Statistical significance was determined using one-way ANOVA (nonparametric) with post hoc Sidak’s multiple comparisons test. N.S. = no significant change, *p<0.05, **p≤0.01, ***p≤0.0005, ****p<0.0001. All error bars are standard error of the mean (SEM).
-
Figure 9—source data 1
Sample size (n), mean, SEM, and One-way Anova (and nonparametric) Sidak's multiple comparisons test are presented for the data in Figure 9B.
- https://doi.org/10.7554/eLife.28409.036
-
Figure 9—source data 2
Sample size (n), mean, SEM, and One-way Anova (and nonparametric) Sidak's multiple comparisons test are presented for the data in Figure 9C.
- https://doi.org/10.7554/eLife.28409.037
-
Figure 9—source data 3
Sample size (n), mean, SEM, and One-way Anova (and nonparametric) Sidak's multiple comparisons test are presented for the data in Figure 9—figure supplement 1.
- https://doi.org/10.7554/eLife.28409.038
Figure 9—figure supplement 1
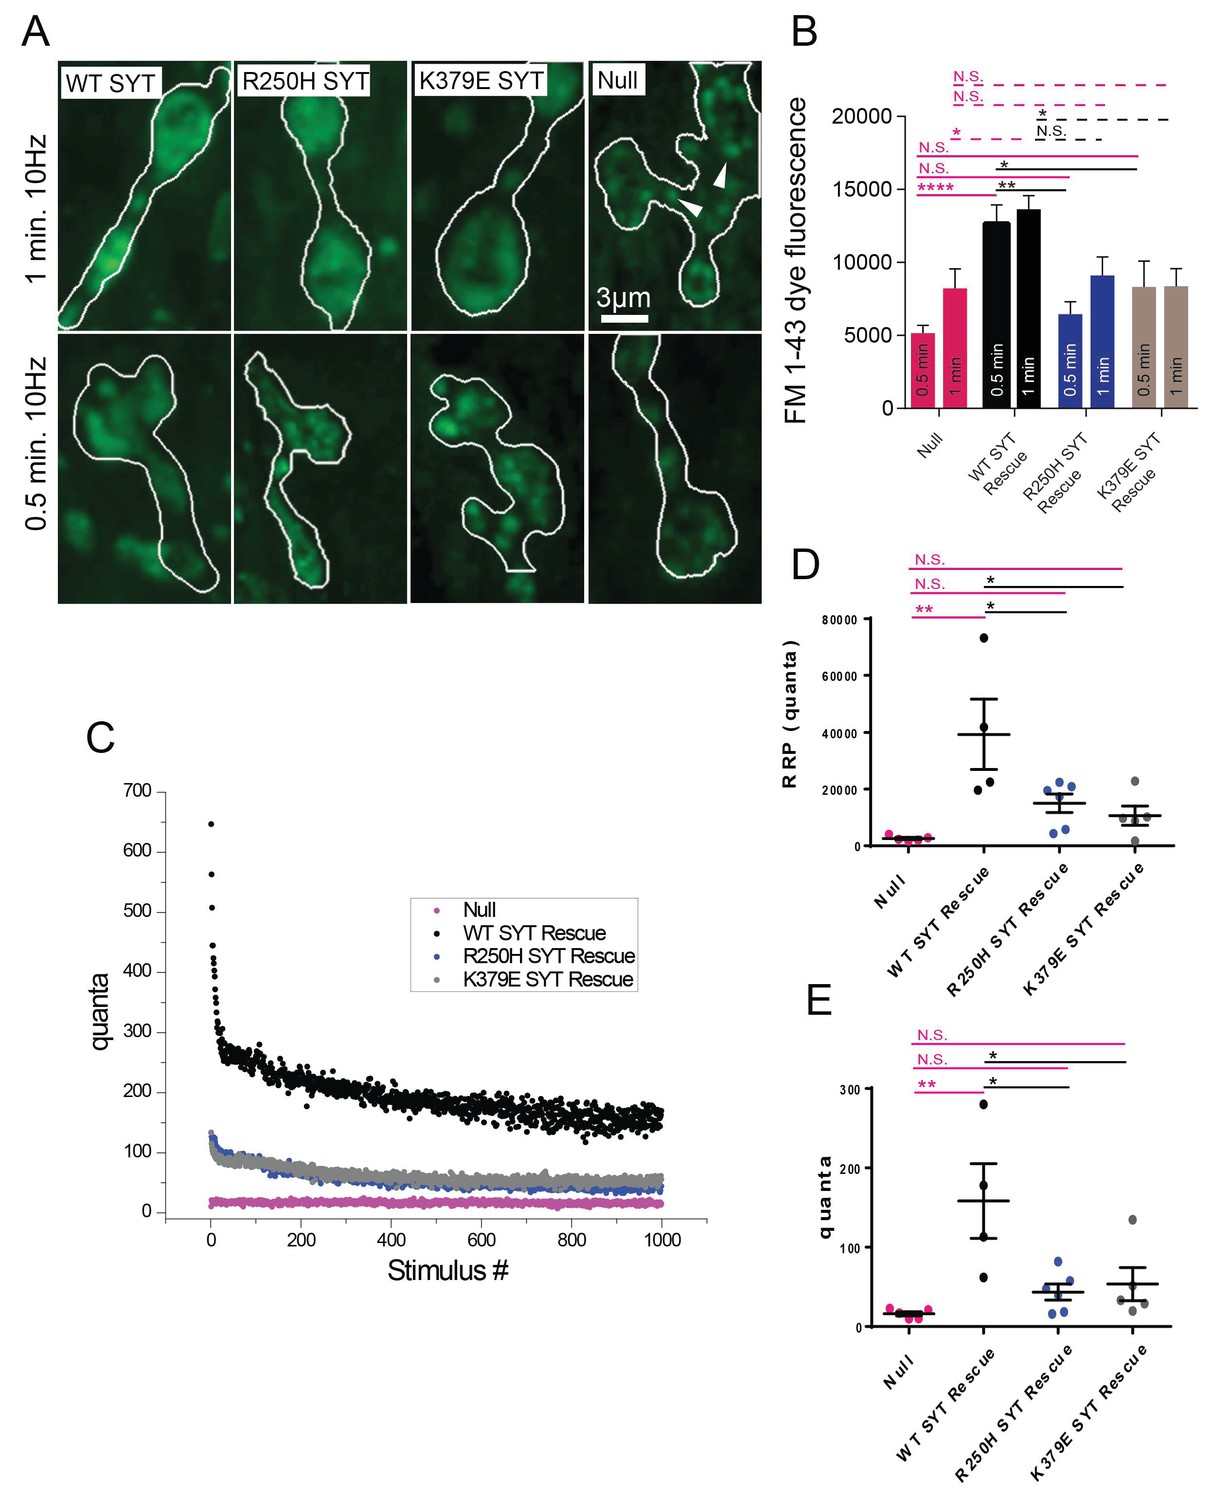
Characterization of FM 1–43 endocytosis in R250H and K379E rescue lines.
(A) Representative NMJ images for FM 1–43 internalization following 10 Hz stimulation at 0.5 min (upper panel) or 1 min (lower panel). The bouton area is outlined in white. Compared to controls where dye loading is observed throughout the bouton, syt1 null mutants show reduced and punctate loading (white arrowheads). The R250H and K379E rescues also show defective loading during shorter stimulation (B) Quantification of FM1-43 dye internalization for each genotype. For 0.5 min 10 Hz stimulation: null, 5154 ± 542.9, n = 22; WT SYT rescue, 12677 ± 1262, n = 13; R250H SYT rescue, 6460 ± 850.7, n = 14; K379E SYT rescue, 8324 ± 1764, n = 16. For 1 min 10 Hz stimulation: null, 8229 ± 1332, n = 10; WT SYT rescue, 13636 ± 932.7, n = 11; R250H SYT rescue, 9115 ± 1262, n = 7; K379E SYT rescue, 8372 ± 1203, n = 10. (C) Quantal release during tetanic 10 Hz nerve stimulation (1000 events) in 2 mM external Ca2+ in syt1 null (magenta trace), WT SYT rescue (black trace), R250H SYT rescue (blue trace) and K379E SYT rescue (grey trace). (D) Quantification of the readily releasable pool (RRP) in the following genotypes: syt1 null, 2583.9 ± 400.8 (n = 5); WT SYT rescue, 39322.6 ± 2343.3 (n = 4); R250H SYT rescue, 15034.3 ± 3243.7 (n = 6); K379E SYT rescue, 10635.7 ± 3405.9 (n = 5). Quantification was done as previously described (Jorquera et al., 2012). (E) Quantification of the average quantal content at steady state at the end of the stimulation (calculated from the average quantal content of the last 50 stimulation events from 1000). syt1 null, 16.1 ± 2.6 (n = 5); WT SYT rescue, 158.3 ± 47.0 (n = 4); R250H SYT rescue, 43.4 ± 10.1 (n = 6); K379E SYT rescue, 53.5 ± 21.0 (n = 5). Statistical significance was determined using one-way ANOVA (nonparametric) with post hoc Sidak’s multiple comparisons test. N.S. = no significant change (p>0.05), *p<0.05, **p<0.005. ****p<0.0001. Error bars represent SEM.
Tables
Table 1
Summary of identified alleles that suppress lethality following overexpression of Syt1C2BD1,2N or Syt1C2BD3,4N.
The location of the residues is indicated for Drosophila melanogaster, and for the homologous rodent (Rattus norvegicus) residues. The number of independent suppressor hits for each residue is indicated, as well as the location on the Syt1 secondary structure. The result of Western analysis to determine stability of the overexpressed mutant protein is also indicated (D (degraded), S (stable) and NT (not tested)).
| Dros. AA# Change | (Rat AA#) | # Hits | Location | Stability |
|---|---|---|---|---|
| Q48 stop codon | 1 | Intravesicular | NT | |
| Q50 stop codon | 5 | Intravesicular | NT | |
| Q63 stop codon | 1 | Intravesicular | NT | |
| Q67 stop codon | 3 | Intravesicular | NT | |
| Q80 stop codon | 8 | Intravesicular | NT | |
| W113 stop codon | 5 | Transmembrane | NT | |
| R141 stop codon | 2 | Linker domain | NT | |
| K147 stop codon | 1 | Linker domain | NT | |
| Q158R/stop codon | 2 | Linker domain | NT | |
| Q191 stop codon | 1 | Linker domain | NT | |
| G194E | (G143) | 1 | C2A beta 1 | NT |
| N205 deletion | 2 | C2A beta 1 | NT | |
| V211E | (V160) | 1 | C2A beta 2 | D |
| Q215 stop codon | (Q164) | 1 | C2A beta 2 | NT |
| D229N | (D178) | 2 | C2A beta 3 | NT |
| Y231 stop codon | (Y180) | 1 | C2A beta 3 | NT |
| E245K | (E194) | 1 | C2A beta 4 | D |
| K247 stop codon | (K196) | 1 | C2A beta 4 | NT |
| R250H/C | (R199) | 3 | C2A beta 4 | S |
| P267 deletion | (P215) | 1 | C2A beta 5 | NT |
| G293D | (G241) | 1 | C2A beta 7 | NT |
| Q306 stop codon | 3 | C2A loop between beta 7 & 8 | NT | |
| W111 stop codon | (W259) | 3 | C2A beta 8 | NT |
| G321 deletion | 1 | Linker between C2A & C2B | NT | |
| Q323K/stop codon | (Q270) | 3 | Linker between C2A & C2B | NT |
| G327R | (G274) | 1 | C2B beta 1 | NT |
| S332L | (S279) | 2 | C2B beta 1 | S |
| R334H/C/L | (R281) | 6 | C2B beta 1 | S |
| Y335 stop codon | (Y282) | 1 | C2B beta 1 | NT |
| E348K | (E295) | 4 | C2B beta 2 | S |
| P363S | (P310) | 2 | C2B beta 3 | S |
| G373D | (G320) | 1 | C2B loop between beta 3 & 4 | S |
| R375 deletion | (R322) | 1 | C2B loop between beta 3 & 4 | NT |
| K379E | (K326) | 1 | C2B beta 4 | S |
| T381I/stop codon | (T328) | 3 | C2B beta 4 | D |
| P390L | (P337) | 2 | C2B beta 5 | D |
| Y391D/N/H | (Y338) | 4 | C2B beta 5 | S |
| Y392N | (Y339) | 1 | C2B beta 5 | S |
| Q404 deletion | (Q351) | 1 | C2B loop between beta 5 & 6 | NT |
| I405 stop codon(I352) | 1 | C2B loop between beta 5 & 6 | NT | |
| G421 deletion | (G368) | 1 | C2B loop between beta 6 & 7 | NT |
| G427D | (G374) | 5 | C2B beta 7 | Partial D |
| C429S | (V376) | 1 | C2B beta 7 | NT |
| W443 stop codon | (W390) | 2 | C2B loop between beta 7 & 8 | NT |
| A455T | (A402) | 3 | C2B beta 8 | S |
| Q456 stop codon | (Q403) | 2 | C2B beta 8 | NT |
| W457 stop codon | (W404) | 6 | C2B beta 8 | NT |
Additional files
-
Source data 1
Sample size (n), mean, SEM, and One-way Anova (and nonparametric) Sidak's multiple comparisons test are presented for the data in Figure 9—figure supplement 1.
- https://doi.org/10.7554/eLife.28409.039
-
Transparent reporting form
- https://doi.org/10.7554/eLife.28409.040
Download links
A two-part list of links to download the article, or parts of the article, in various formats.
Downloads (link to download the article as PDF)
Open citations (links to open the citations from this article in various online reference manager services)
Cite this article (links to download the citations from this article in formats compatible with various reference manager tools)
A synaptotagmin suppressor screen indicates SNARE binding controls the timing and Ca2+ cooperativity of vesicle fusion
eLife 6:e28409.
https://doi.org/10.7554/eLife.28409


