Neurosecretory protein GL stimulates food intake, de novo lipogenesis, and onset of obesity
- Graduate School of Integrated Arts and Sciences, Hiroshima University, Japan
- University of California at Berkeley, United States
- Institute for Molecular and Cellular Regulation, Gunma University, Japan
- National Institute for Physiological Sciences, Japan
- School of Life Science, Sokendai (The Graduate University for Advanced Studies), Japan
- Graduate School of Medicine, University of the Ryukyus, Japan
Figures
Figure 1 with 1 supplement

Structure of NPGL and expression of NPGL in rats.
(A) The amino acid structure of NPGL is shown schematically. The bold line between cysteine residues indicates a disulfide bond. (B) Expression levels of the NPGL-precursor mRNA in the entire brain and different brain regions, including the telencephalon, diencephalon, mesencephalon, cerebellum, and mediobasal hypothalamus (n = 4). (C) Western blot analysis of mature NPGL in the hypothalamus. Synthetic NPGL served as a reference marker (1). The extract of the hypothalami from five rats (2). (D) Schematic representation of the localization of NPGL-immunoreactive fibers (blue dots) and cells (red dots) in the mediobasal hypothalamus. Abbreviations; Arc: the arcuate nucleus, ArcLP: lateroposterior part of the Arc, ArcMP: medial posterior part of the Arc, DMH: doromedial hypothalamus, f: fornix, LH: lateral hypothalamus, PMD: dorsal premammillary nucleus, PMV: ventral premammillary nucleus, Te: terete hypothalamic nucleus, VMH: ventromedial hypothalamus, and VTM: ventral tuberomammillary nucleus. (E–G) Photomicrographs of the cells containing NPGL-precursor mRNA in the mediobasal hypothalamus. The squares including the ArcLP and VTM are shown magnified in (F) and (G), respectively. Arrowheads in (G) indicate signals. Scale bar = 100 μm. (H and I) Photomicrographs of NPGL-immunoreactive cells in the ArcLP (H) and VTM (I). Arrowheads in (I) indicate signals. Scale bar = 100 μm. (J) Photomicrograph of NPGL-immunoreactive fibers between the DMH and VMH. Scale bar = 100 μm. Mean ± s.e.m. (one-way ANOVA with Tukey’s test as a post-hoc test: ***p<0.005).
Figure 1—figure supplement 1

Amino acid sequences and expression site of NPGL.
(A) Alignment of NPGL-precursor proteins deduced from human, rat, mouse, and chicken cDNA sequences. Black and gray boxes highlight fully conserved and highly conserved amino acids, respectively. The predicted mature sequences of NPGL are underlined. The two conserved Cys (C) residues, which are involved in the intramolecular disulfide bond formation, are indicated by asterisks. Gaps, indicated by hyphens, were inserted to optimize the sequence alignment. (B–D) Expression level of NPGL-precursor mRNA in various tissues of human (B), rat (C) and mouse (D) measured by real-time RT-PCR. Each value for the NPGL-precursor mRNA represents the mean from duplicate analyses. Data were normalized to β-actin (ACTB) mRNA and expressed relative to NPGL-precursor mRNA expression in the whole brain. (E) Alignment of mature NPGL, its analogs NPGL-Gly and NPGL(32-80), and NPGM. Gray boxes highlight conserved amino acids. The two conserved Cys (C) residues, which are involved in the intramolecular disulfide bond formation, are indicated by asterisks. (F) Dot blot analysis of synthetic NPGL, NPGM and NPGL(32-80) using an antibody raised in rabbit (left panel) or guinea pig (right panel). (G–L) Photomicrographs of NPGL-immunoreactive cells in the ArcLP (G) and VTM (J). Specificity control was obtained by preadsorbing the working dilution of the antibody with a saturating concentration (10 μg/ml) of NPGL or NPGM in the ArcLP (H and I) and VTM (K and L). Scale bar = 100 μm.
Figure 2 with 2 supplements
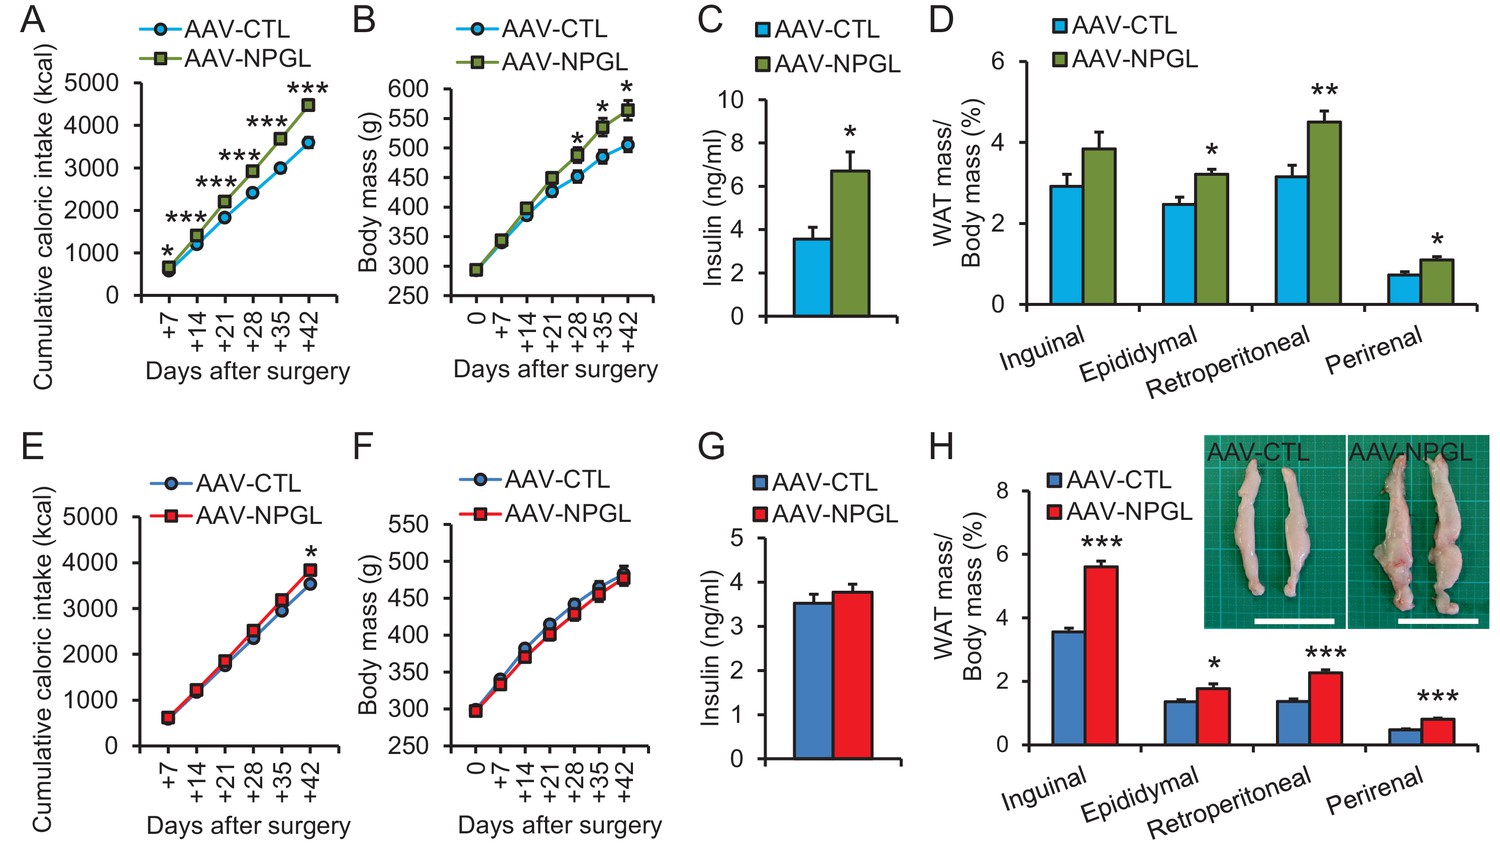
The effects of Npgl overexpression.
The panels show the data obtained by the injection of AAV-based control vector (AAV-CTL) or AAV-based NPGL-precursor gene vector (AAV-NPGL) in high calorie diet (A–D) and normal chow (E–H). (A) Cumulative food intake (n = 8). (B) The body mass (n = 8). (C) Serum insulin levels (n = 6–7). (D) Ratios of inguinal, epididymal, retroperitoneal, and perirenal WAT mass/body mass (n = 6–7). (E) Cumulative food intake (n = 6–7). (F) The body mass (n = 6–7). (G) Serum insulin levels (n = 6–7). (H) Ratios of inguinal, epididymal, retroperitoneal, and perirenal WAT mass/body mass (n = 6–7) and representative photographs of retroperitoneal WAT. Scale bar = 5 cm. Mean ± s.e.m. (Student’s t-test: *p<0.05, **p<0.01, ***p<0.005).
Figure 2—figure supplement 1
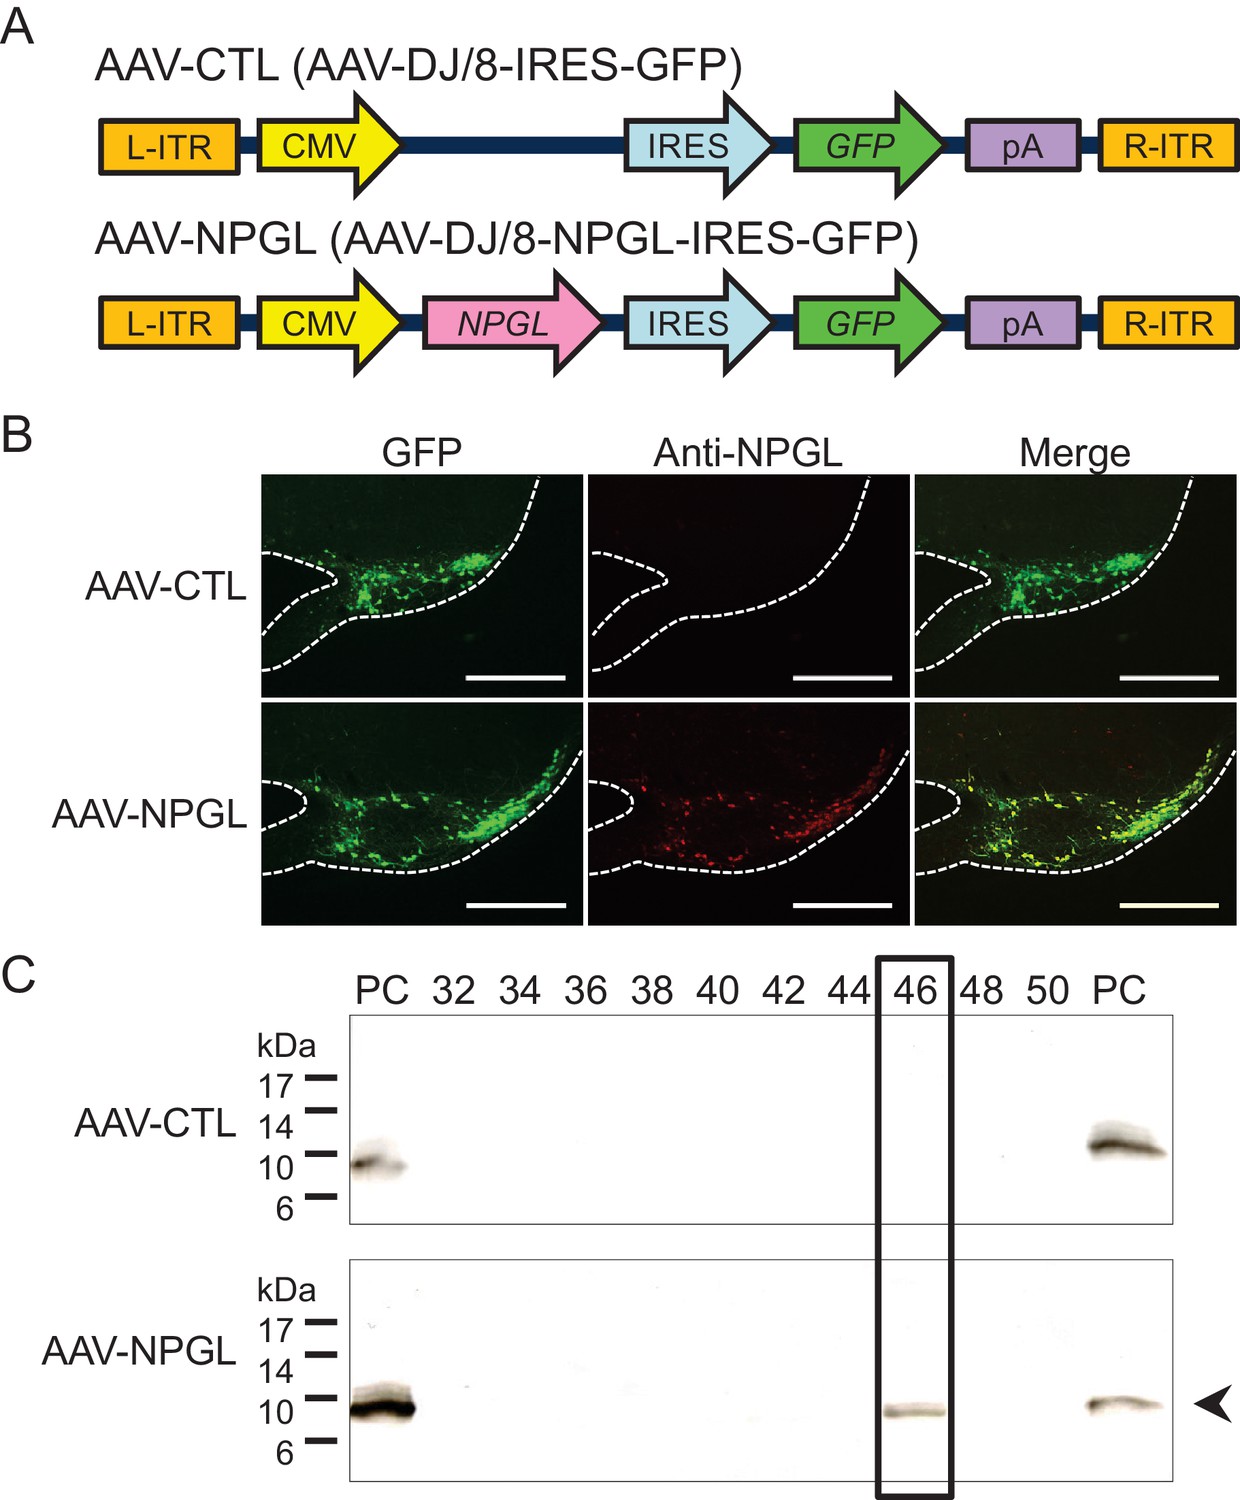
Construction of AAV-based vectors and verification of overexpression.
(A) Schematic structures of AAV-based control vector (AAV-CTL) and AAV-based NPGL-precursor gene vector (AAV-NPGL). Abbreviations: L- and R-ITR: left and right inverted terminal repeat, CMV: cytomegalovirus promoter, IRES: internal ribosome entry site, GFP: green fluorescence protein, pA: polyadenylation signal sequence. (B) Representative micrographs of mediobasal hypothalamus at 14 days after injection of the AAV-CTL or AAV-NPGL. Scale bar = 500 µm. (C) Western blot analysis of NPGL in the hypothalamus. Synthetic NPGL served as a positive control (PC). The extract of the hypothalamus from one animal was separated on HPLC, and the fractions were electrophoresed on 15% polyacrylamide gel. A single band of mature NPGL was only detected in the hypothalamic extract at 14 days after the injection of AAV-NPGL.
Figure 2—figure supplement 2
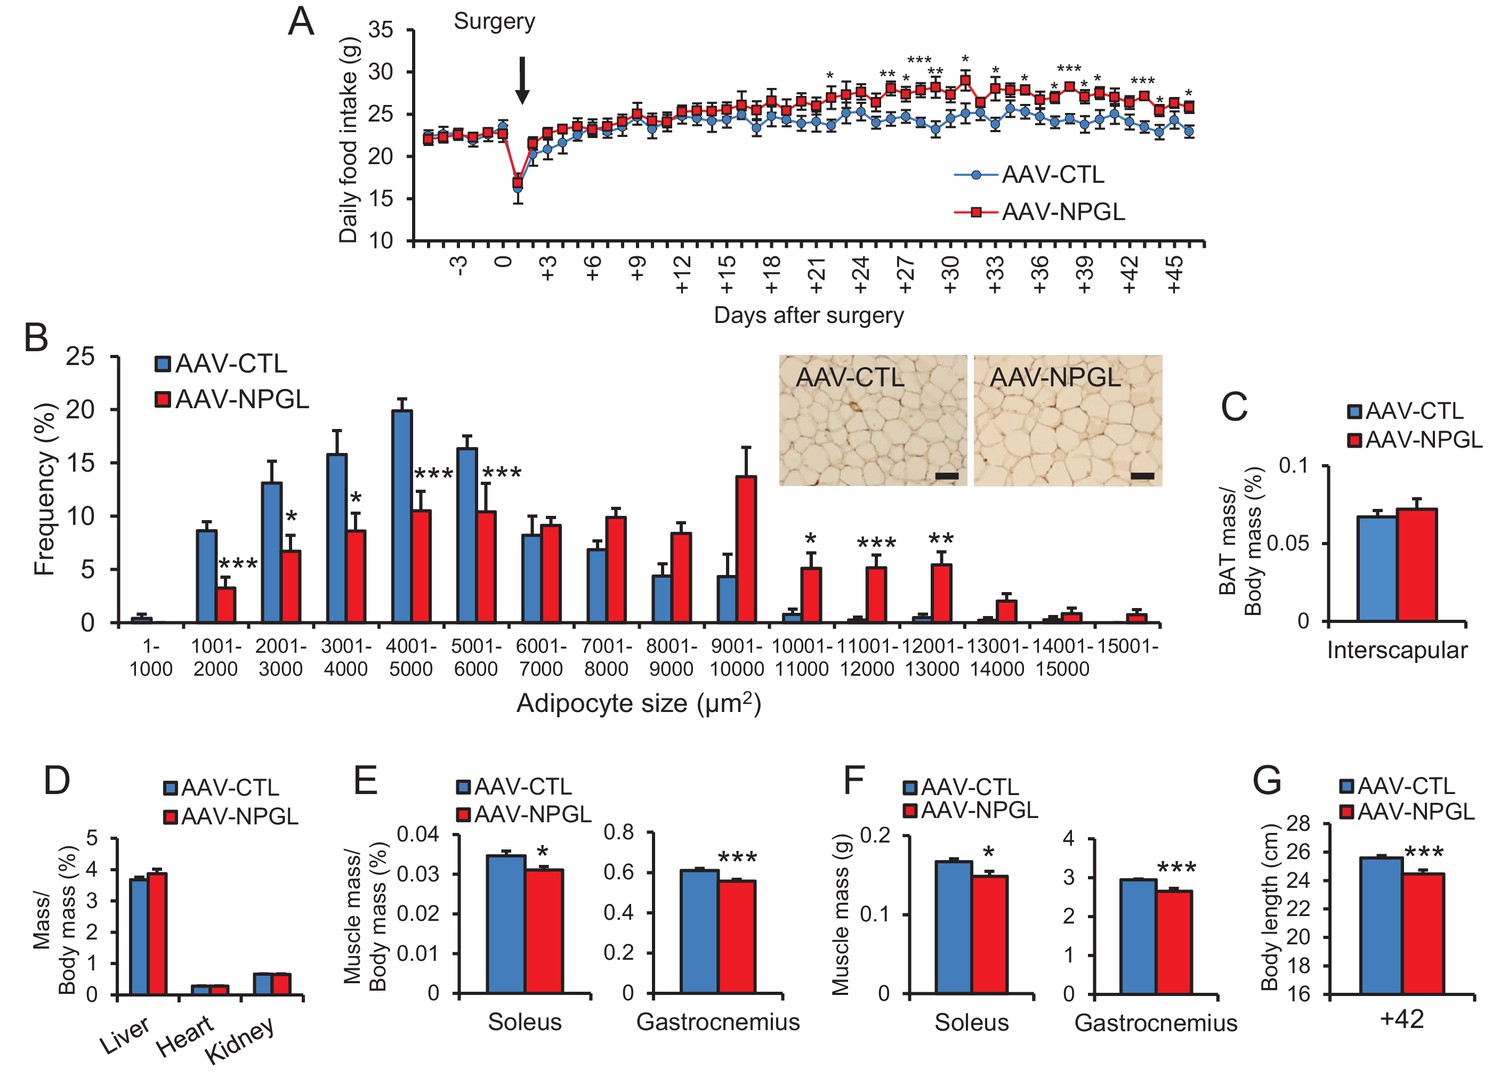
The effects of Npgl overexpression in normal chow.
(A) Changes in daily food intake (n = 6–7). (B) The frequency of various adipocyte sizes measured in 1000 μm2 areas and representative photographs in sections of retroperitoneal WAT (n = 5). Scale bar = 100 μm. (C) Ratio of the interscapular BAT mass/body mass (n = 6–7). (D) Ratios of liver, heart, and kidney mass/body mass (n = 6–7). (E) Ratios of soleus and gastrocnemius muscle mass/body mass (n = 6–7). (F) Masses of soleus and gastrocnemius muscles (n = 6–7). (G) Body length (nose to anus) (n = 6–7). Mean ± s.e.m. (Student’s t-test: *p<0.05, **p<0.01, ***p<0.005).
Figure 3
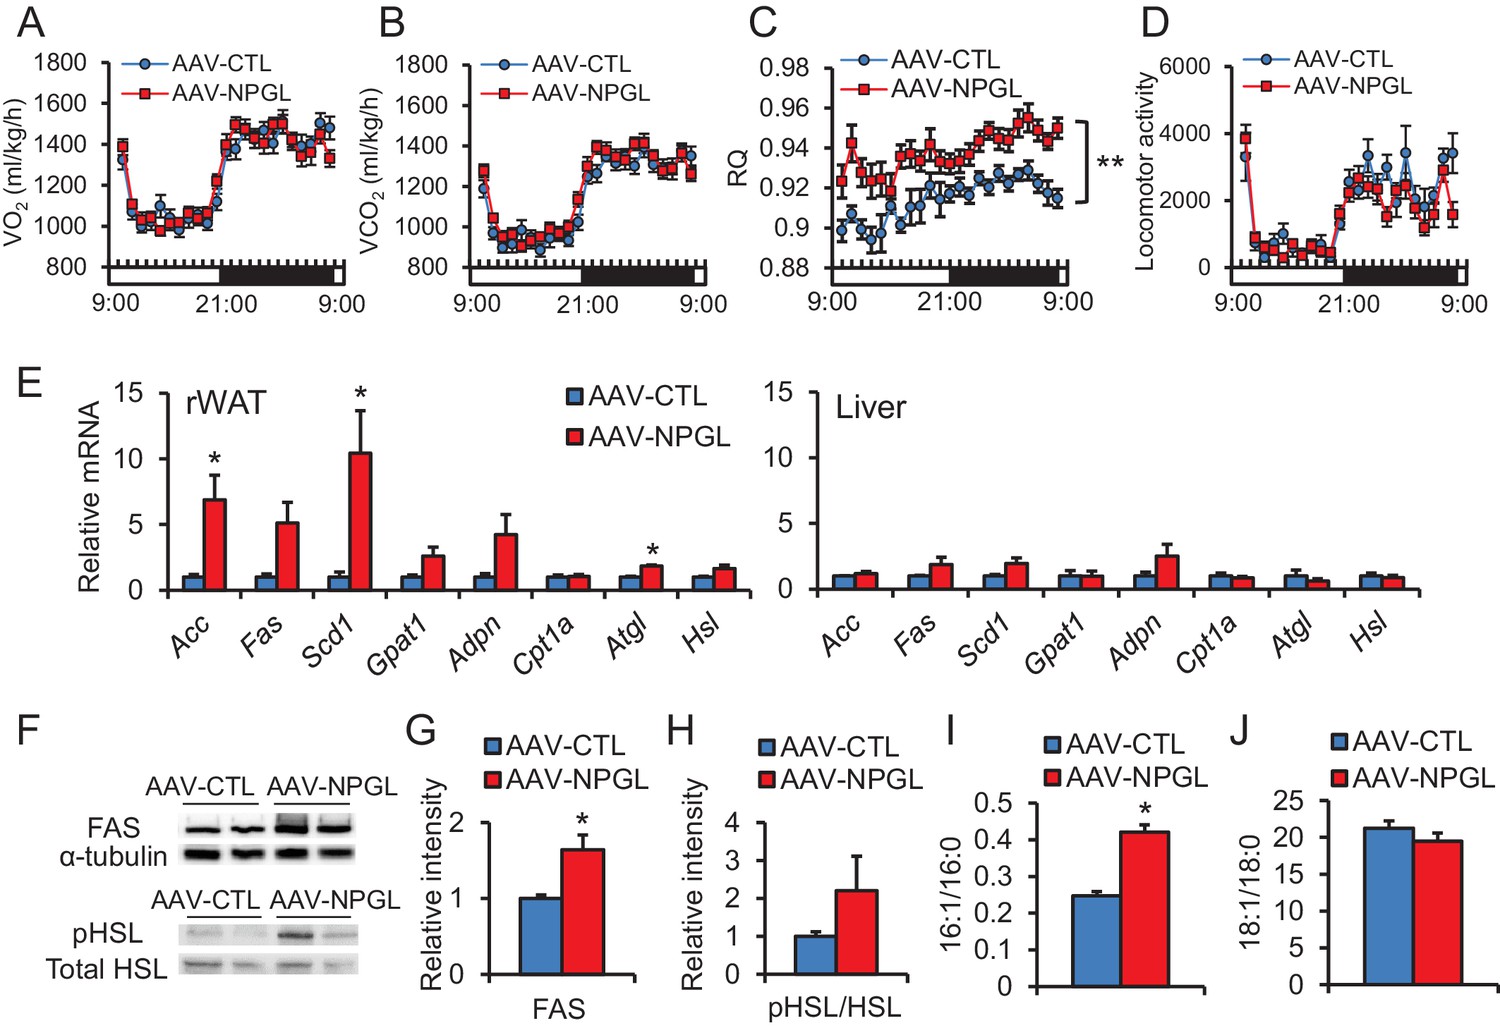
The effects of Npgl overexpression on O2/CO2 metabolism and lipogenic and lipolytic enzymes.
All panels show data obtained by the injection of AAV-based control vector (AAV-CTL) or AAV-based NPGL-precursor gene vector (AAV-NPGL) in normal chow. (A) O2 consumption (VO2) measured in the metabolic cage (n = 6–7). (B) CO2 production (VCO2) measured in the metabolic cage (n = 6–7). (C) The respiratory quotient (RQ) measured in the metabolic cage (n = 6–7). (D) The spontaneous locomotor activity measured by infrared ray passive sensor (n = 6–7). (E) mRNA expression levels for lipogenic (Acc, Fas, Scd1, Gpat1, and Adpn) and lipolytic (Cpt1a, Atgl, and Hsl) enzymes in retroperitoneal WAT (rWAT) and liver (n = 5–7). Representative photographs (F) of the western blot and protein expression levels of FAS (G) and phosphorylated HSL (pHSL) (H) in retroperitoneal WAT (n = 6). (I) Ratio of fatty acids (16:1 and 16:0) in retroperitoneal WAT (n = 6–7). (J) Ratio of fatty acids (18:1 and 18:0) in retroperitoneal WAT (n = 6–7). Mean ± s.e.m. (two-way ANOVA followed by Bonferroni’s test or Student’s t-test: *p<0.05, **p<0.01).
Figure 4 with 4 supplements
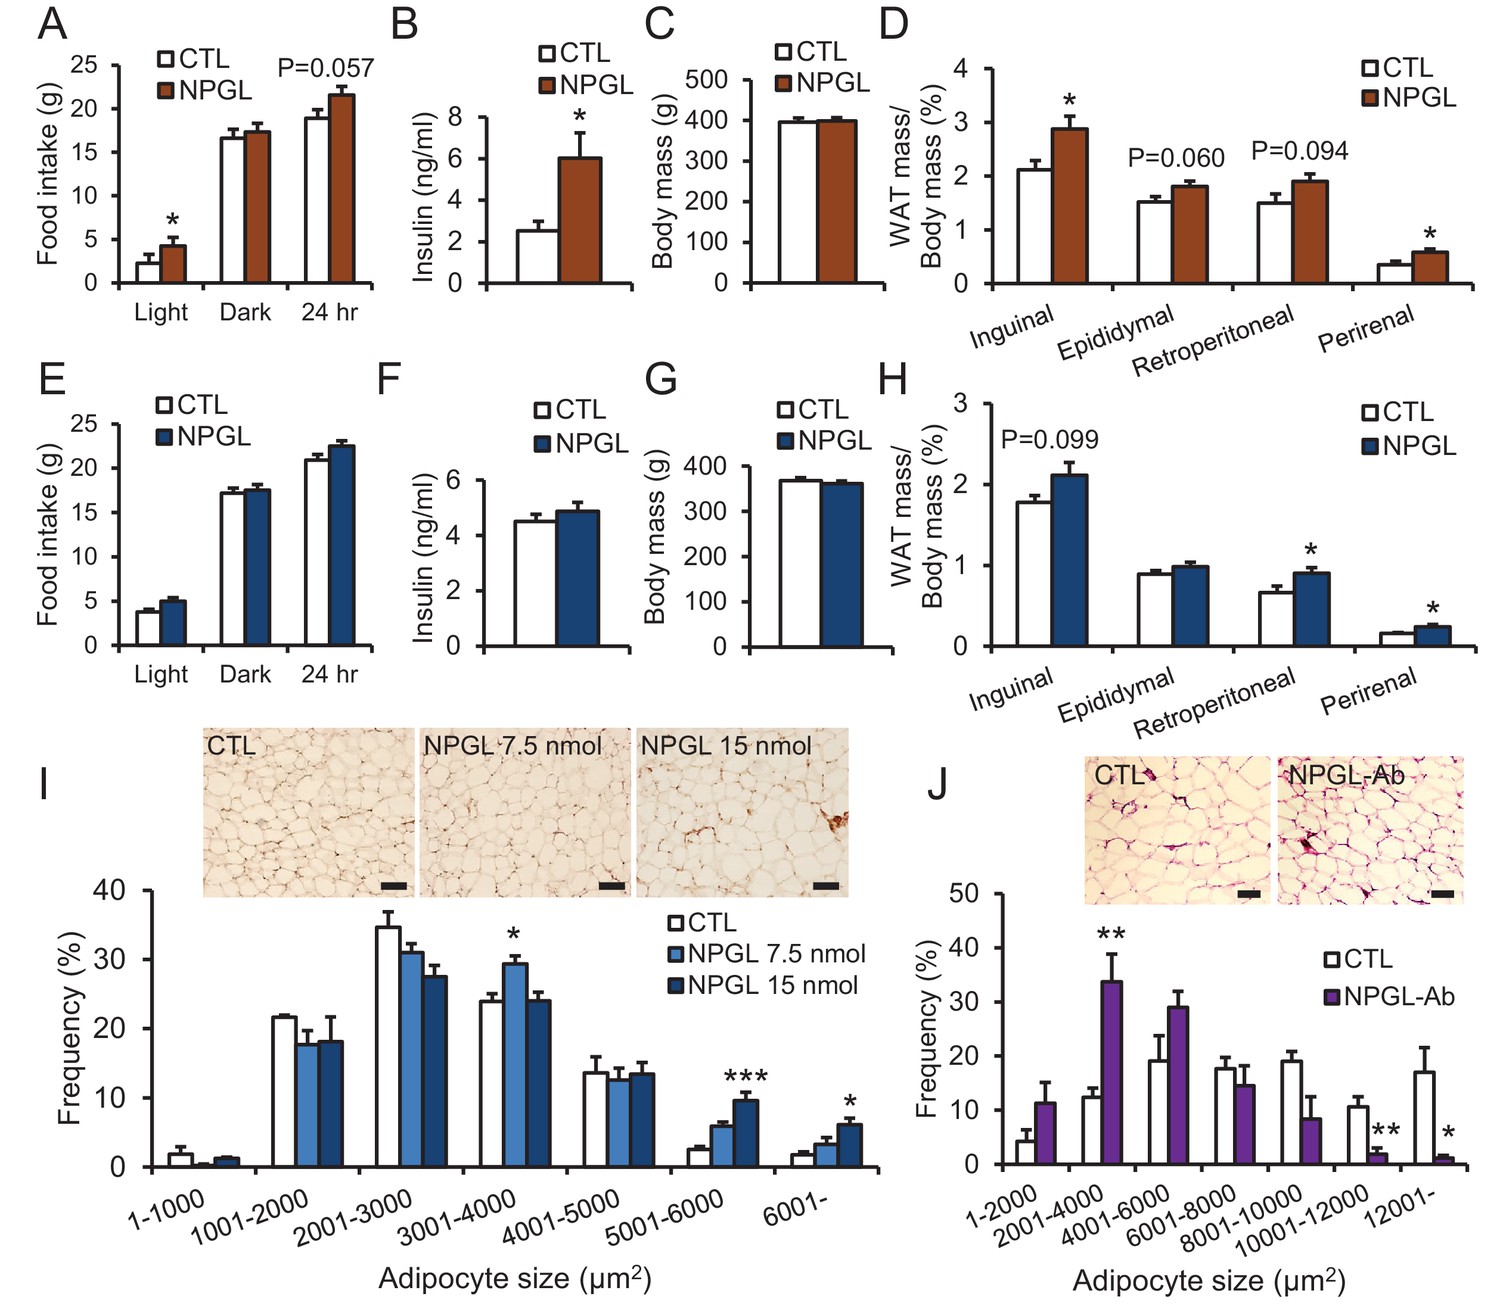
The effects of chronic i.c.v.
infusion of NPGL or antibody against NPGL. All panels show data obtained by the infusion of vehicle (CTL) or NPGL (A–I) in high calorie diet (A–D) and normal chow (E–I), and the control IgG (CTL) or the antibody against NPGL (NPGL-Ab) in high calorie diet (J). (A) The average of food intake during the light period, dark period, or over 24 hr (n = 8). (B) Serum insulin levels (n = 8). (C) Body mass (n = 8). (D) Ratios of inguinal, epididymal, retroperitoneal, and perirenal WAT mass/body mass (n = 8). (E) The average of food intake during the light period, dark period, or over 24 hr (n = 7). (F) Serum insulin levels (n = 7). (G) Body mass (n = 7). (H) Ratios of inguinal, epididymal, retroperitoneal, and perirenal WAT mass/body mass (n = 7). (I) The frequency of various adipocyte sizes measured in 1000 μm2 areas and representative photographs in sections of retroperitoneal WAT after the infusion of vehicle (CTL) or NPGL in normal chow (n = 4–5). Scale bar = 100 μm. (J) The frequency of various adipocyte sizes measured in 2000 μm2 areas and representative photographs in sections of retroperitoneal WAT after the infusion of the control IgG (CTL) or antibody against NPGL (NPGL-Ab) in high calorie diet (n = 4). Scale bar = 100 μm. Mean ± s.e.m. (Student’s t-test or one-way ANOVA with Tukey’s test as a post-hoc test: *p<0.05, **p<0.01, ***p<0.005).
Figure 4—figure supplement 1

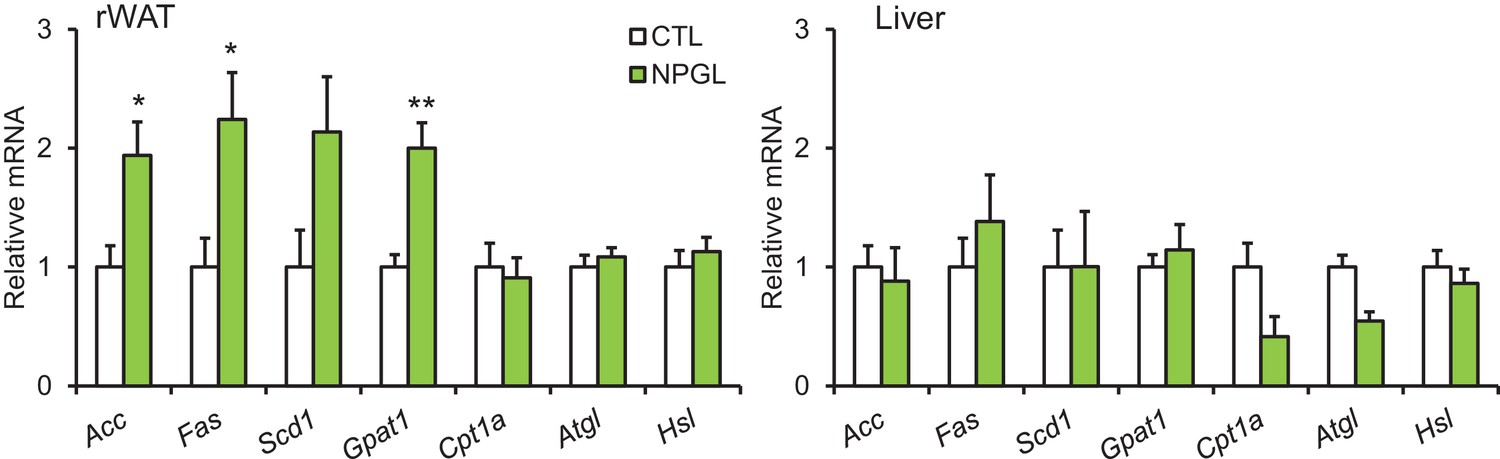
The effects of chronic i.c.v. infusion of NPGL on lipogenic and lipolytic enzymes.
All panels show data obtained by the infusion of vehicle (CTL) or NPGL in normal chow. (A) mRNA expression levels for lipogenic (Acc, Fas, Scd1, Gpat1, and Adpn) and lipolytic (Cpt1a, Atgl, and Hsl) enzymes in retroperitoneal WAT (rWAT) and liver (n = 5–7). Representative photographs (B) of the western blot and protein expression levels of FAS (C) and phosphorylated HSL (pHSL) (D) in retroperitoneal WAT (n = 7). (E) Ratio of fatty acids (16:1 and 16:0) in retroperitoneal WAT (n = 6–7). (F) Ratio of fatty acids (18:1 and 18:0) in retroperitoneal WAT (n = 6–7). Mean ± s.e.m. (Student’s t-test: *p<0.05, ***p<0.005).
Figure 4—figure supplement 2
The effects of acute i.c.v. injection of NPGL on lipogenic and lipolytic enzymes.
All panels show data obtained after 5 hr of i.c.v. injection of vehicle (CTL) or NPGL in normal chow. mRNA expression levels for lipogenic (Acc, Fas, Scd1, and Gpat1) and lipolytic (Cpt1a, Atgl, and Hsl) enzymes in retroperitoneal WAT (rWAT) and liver (n = 5). Mean ± s.e.m. (Student’s t-test: *p<0.05, **p<0.01).
Figure 4—figure supplement 3

The effects of chronic i.c.v. infusion of synthetic analogs in normal chow.
(A) Sequences of mature NPGL, and its analogs NPGL-Gly and NPGL(32-80). The two conserved Cys (C) residues, which are involved in the intramolecular disulfide bond formation, are indicated by bold. (B) Ratios of inguinal, epididymal, and retroperitoneal WAT mass/body mass after the infusion of vehicle (CTL) or NPGL-Gly (n = 7). (C) Ratios of inguinal, epididymal, and retroperitoneal WAT mass/body mass after the infusion of vehicle (CTL) or NPGL(32-80) (n = 4–7). Mean ± s.e.m. (Student’s t-test: ***p<0.005).
Figure 4—figure supplement 4
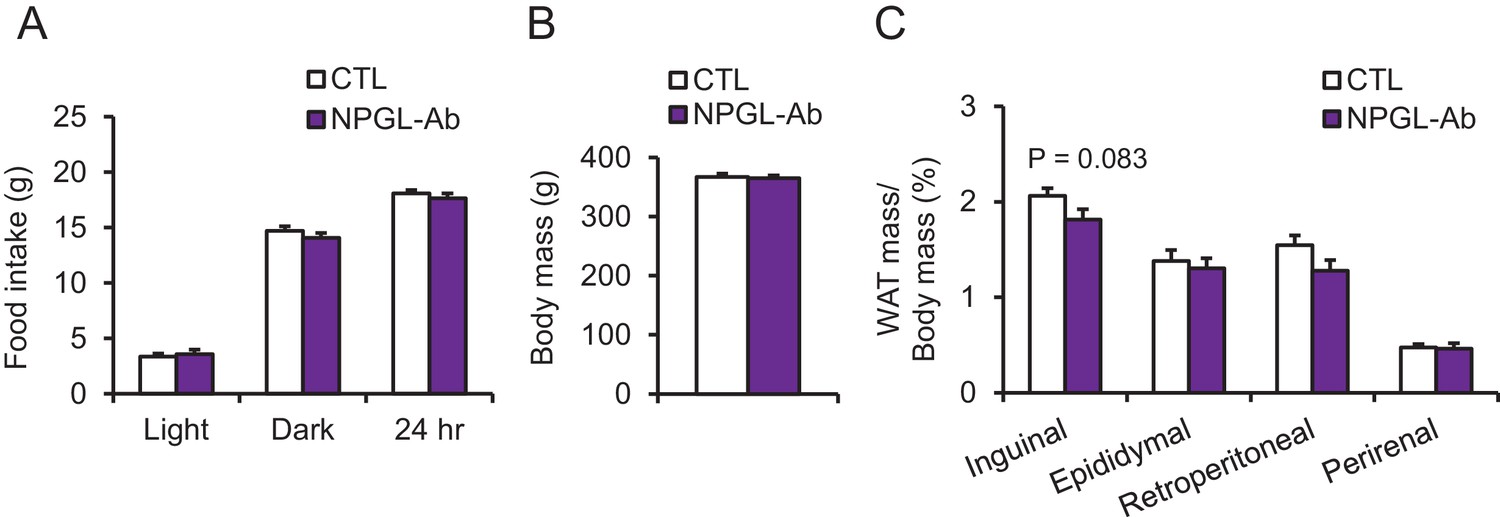
The effects of chronic i.c.v. infusion of antibody against NPGL in high calorie diet.
(A) The average intake of a high calorie diet during infusion of control IgG (CTL) or antibody against NPGL (NPGL-Ab) during the light period, dark period, or over 24 hr (n = 8). (B) Body mass (n = 8). (C) Ratios of inguinal, epididymal, retroperitoneal, and perirenal WAT mass/body mass (n = 8). Mean ± s.e.m. (Student’s t-test).
Figure 5 with 1 supplement
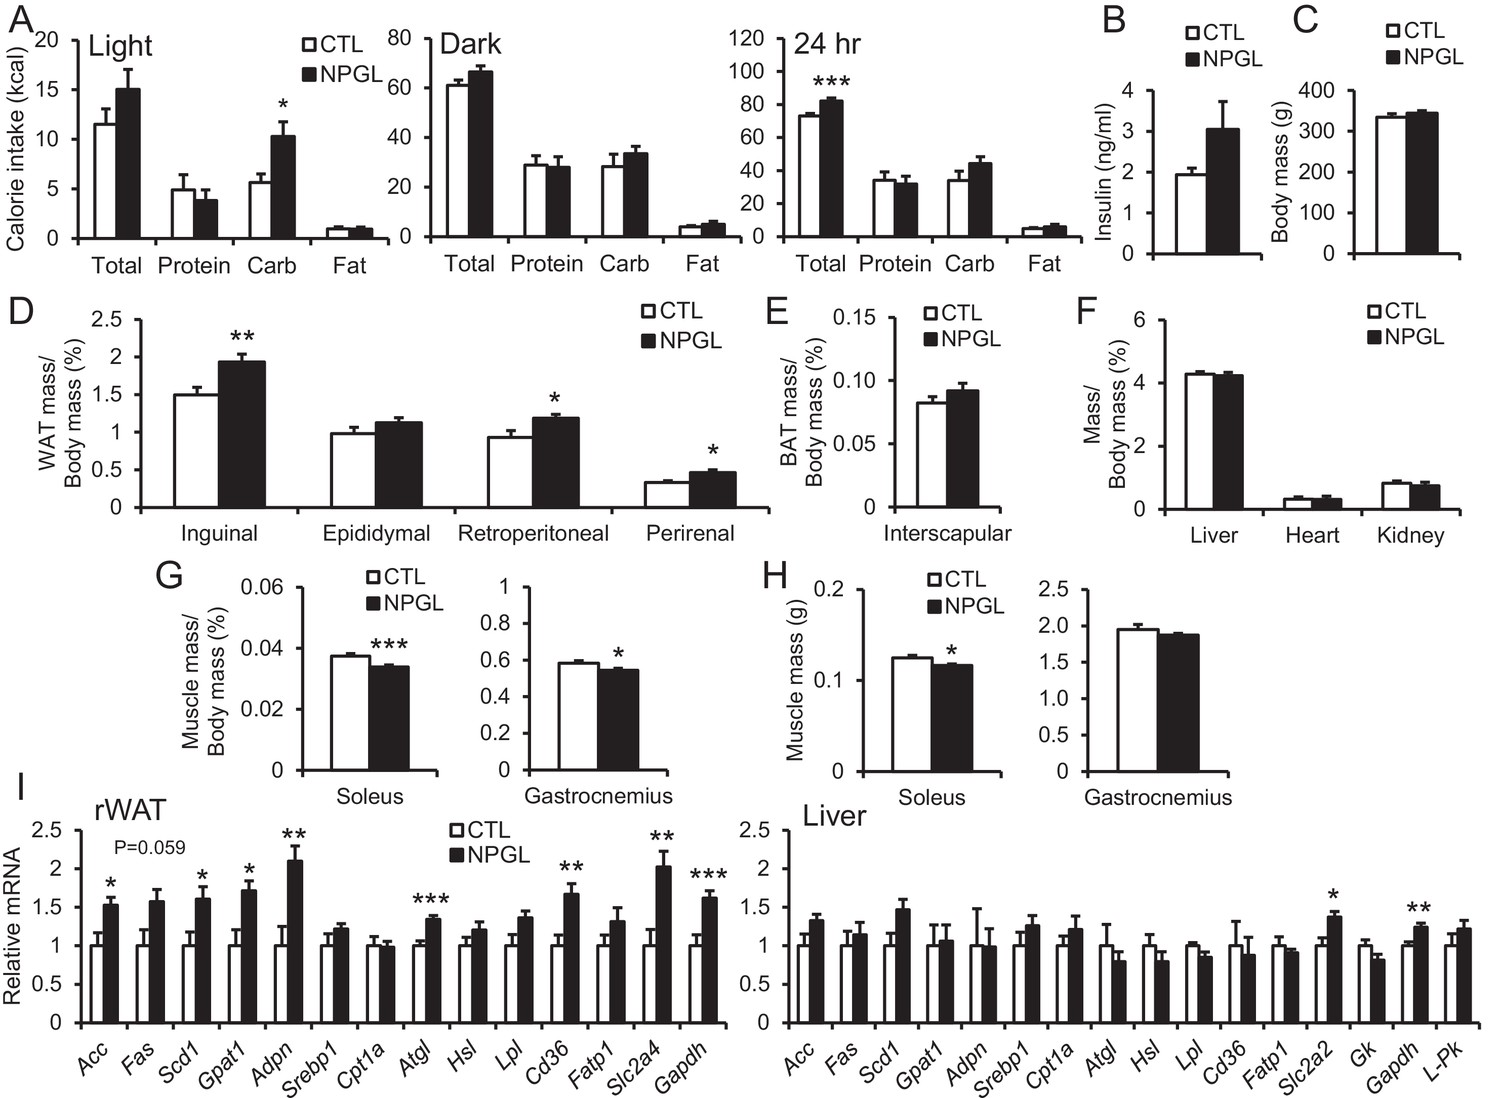
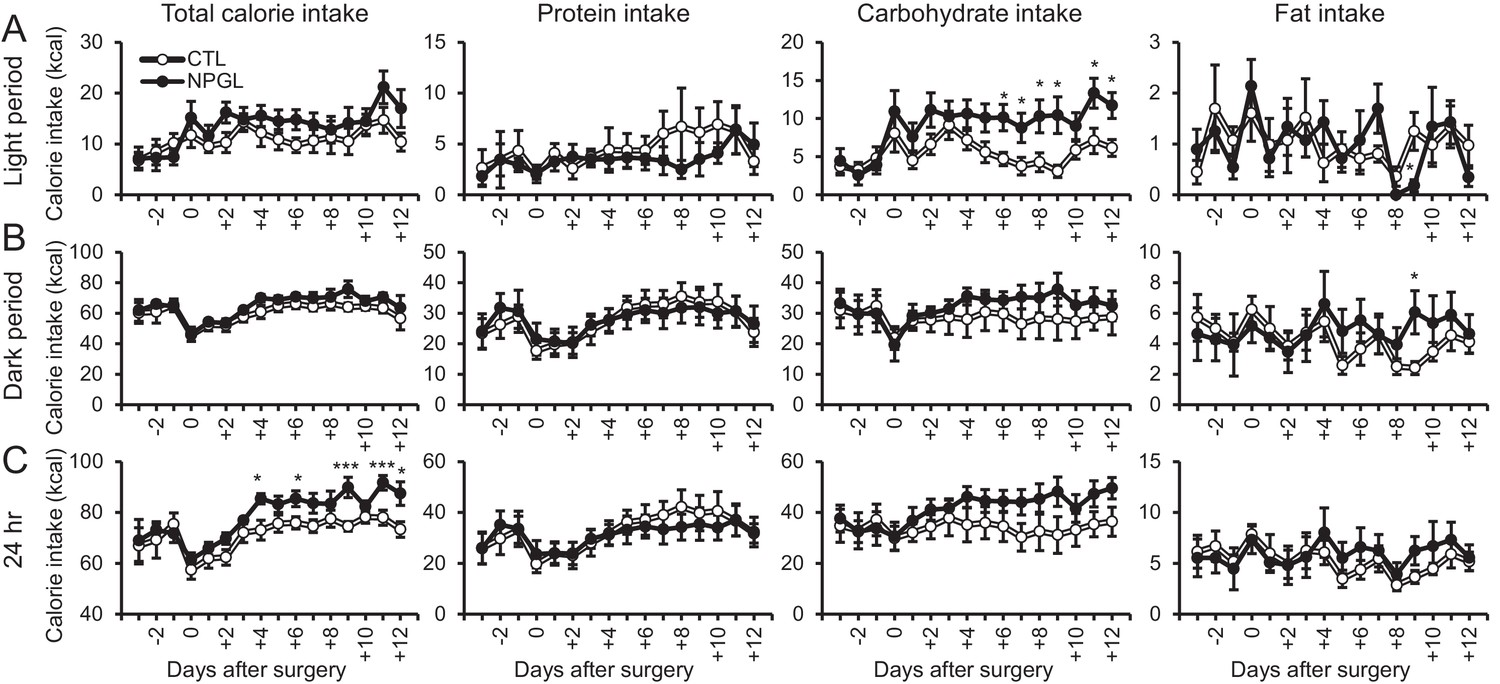
Feeding behavior of macronutrient diets during chronic i.c.v. infusion of NPGL.
(A) The calorie intake of macronutrient diets (total, protein, carbohydrate, and fat) by the infusion of vehicle (CTL) or NPGL during the light period, dark period, or over 24 hr (n = 8). (B) Serum insulin levels (n = 8). (C) Body mass (n = 8). (D) Ratios of inguinal, epididymal, retroperitoneal, and perirenal WAT mass/body mass (n = 8). (E) Ratio of the interscapular BAT mass/body mass (n = 8). (F) Ratios of liver, heart, and kidney mass/body mass (n = 8). (G) Ratios of soleus and gastrocnemius muscle mass/body mass (n = 8). (H) Masses of soleus and gastrocnemius muscles (n = 8). (I) mRNA expression levels for lipogenic (Acc, Fas, Scd1, Gpat1, and Adpn) and lipolytic (Cpt1a, Atgl, and Hsl) enzymes, sterol regulatory element binding protein 1 (Srebp1), lipoprotein lipase (Lpl), Cd36, fatty acid transport protein 1 (Fatp1), Slc2a4, Gapdh, Slc2a2, glucokinase (Gk), and liver pyruvate kinase (L–Pk) in retroperitoneal WAT (rWAT) and liver (n = 7–8). Mean ± s.e.m. (Student’s t-test: *p<0.05, **p<0.01, ***p<0.005).
Figure 5—figure supplement 1
The effects of chronic i.c.v. infusion of NPGL under macronutrient diets.
(A) Changes in calorie intake of a macronutrient diet (total, protein, carbohydrate, and fat) during the light period (n = 8). (B) The changes in calorie intake of macronutrient diets (total, protein, carbohydrate, and fat) during the dark period (n = 8). (C) Changes in calorie intake of a macronutrient diet (total, protein, carbohydrate, and fat) over 24 hr (n = 8). Mean ± s.e.m. (Student’s t-test: *p<0.05, ***p<0.005).
Figure 6
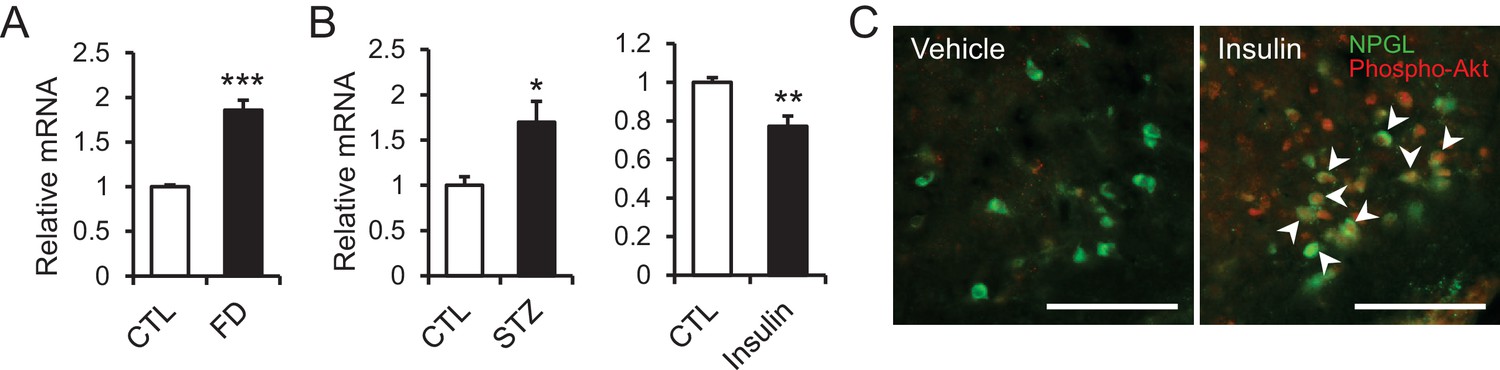
The changes of Npgl mRNA by fasting, streptozotocin or insulin and responsibility of NPGL-producing cells to insulin.
(A) The effects of fasting. Npgl mRNA levels in the mediobasal hypothalamus of fasted rats (n = 8). (B) The effects of streptozotocin (STZ) or insulin. Npgl mRNA levels in the mediobasal hypothalamus after 7 days of i.p. injection of STZ (n = 7) or after 7 hr of i.p. injection of insulin (n = 6–7). (C) Induction of phosphorylated Akt (red) in NPGL-immunoreactive cells (green) after 45 min of i.c.v. injection of insulin in overnight fasted rats. Arrowheads indicate double-labeled cells (co-localization of phospho-Akt and NPGL). Scale bar = 100 μm. Mean ± s.e.m. (Student’s t-test: *p<0.05, **p<0.01, ***p<0.005).
Figure 7
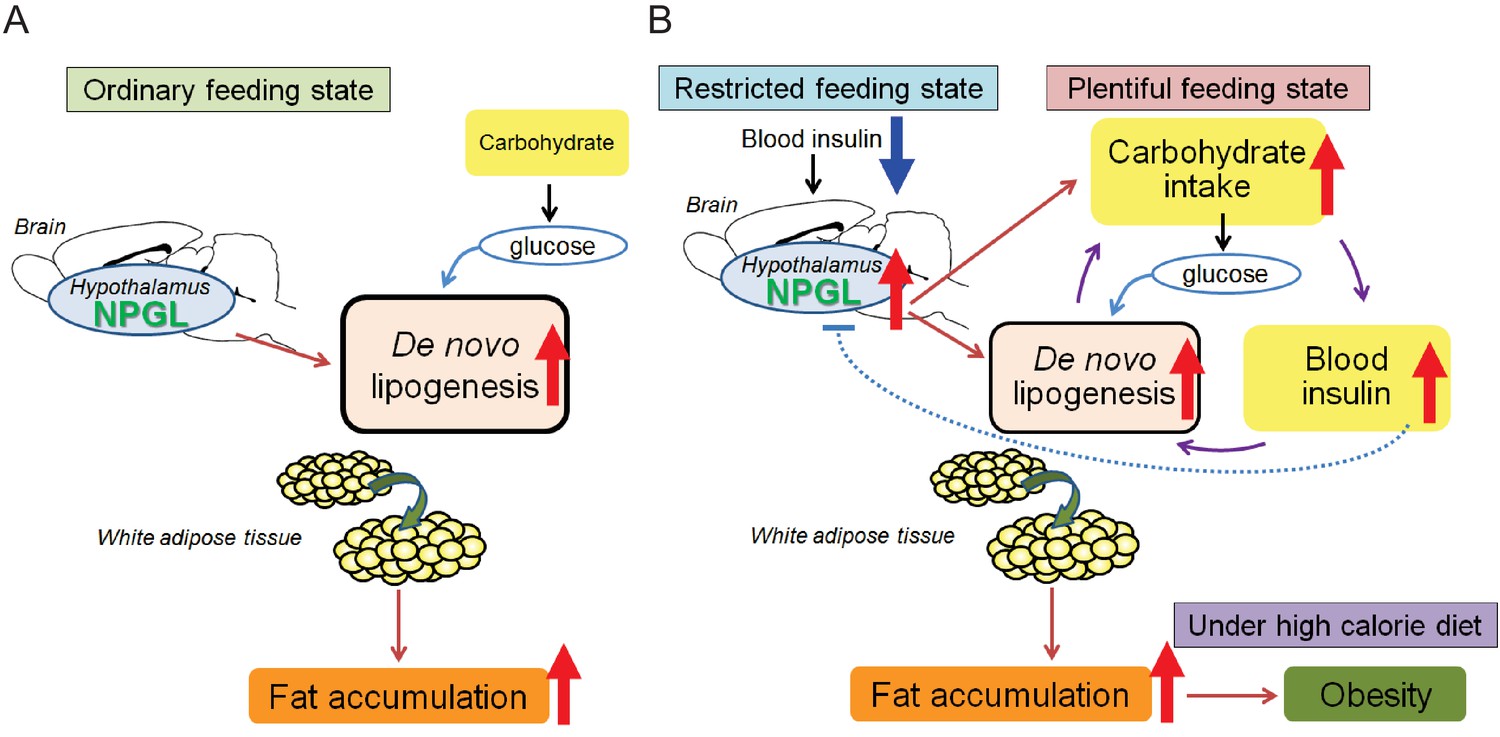
Potential role of NPGL in food intake and fat accumulation.
Downward blue and upward red arrows indicate ‘inhibition’ and ‘stimulation’, respectively and other-colored arrows demonstrate downstream events. (A) During the ordinary feeding state, NPGL stimulates de novo lipogenesis and promotes fat accumulation of WAT. (B) In the restricted feeding state like fasting, a decrease in circulating insulin induces the expression of Npgl mRNA and NPGL production in the hypothalamus. When food is readily available, NPGL stimulates carbohydrate intake and induces de novo lipogenesis using available carbohydrate. Subsequently, NPGL stimulates more carbohydrate usage to provide the glucose substrate for lipogenesis. Finally carbohydrate intake increases blood insulin levels. This step can be repeated to achieve fat accumulation in WAT efficiently. Excess de novo lipogenesis by NPGL is inhibited through negative feedback actions of insulin to maintain steady-state fat storage in WAT. Under high calorie diet, NPGL induces overweight and finally obesity.
Tables
Table 1
Blood chemistry during Npgl overexpression.
| A. Blood chemistry during Npgl overexpression under high calorie diet. | ||
|---|---|---|
| AAV-CTL | AAV-NPGL | |
| Glucose (mg/dl) | 144 ± 6.1 | 156 ± 6.2 |
| Free Fatty Acid (mEq/l) | 0.462 ± 0.038 | 0.460 ± 0.033 |
| Triglyceride (mg/dl) | 192 ± 12.7 | 184 ± 13.7 |
| Cholesterol (mg/dl) | 149 ± 9.6 | 127 ± 6.1† |
| Insulin (ng/ml) | 3.56 ± 0.77 | 6.71 ± 0.90* |
| B. Blood chemistry during Npgl overexpression under normal chow. | ||
|---|---|---|
| AAV-CTL | AAV-NPGL | |
| Glucose (mg/dl) | 105 ± 2.6 | 108 ± 2.6 |
| Free Fatty Acid (mEq/l) | 0.703 ± 0.028 | 0.618 ± 0.031† |
| Triglyceride (mg/dl) | 202 ± 13.4 | 253 ± 23.9† |
| Cholesterol (mg/dl) | 80.8 ± 4.0 | 85.4 ± 2.1 |
| Insulin (ng/ml) | 3.52 ± 0.21 | 3.77 ± 0.16 |
| Leptin (ng/ml) | 12.0 ± 0.59 | 18.5 ± 1.60*** |
| Corticosterone (ng/ml) | 511 ± 2.1 | 512 ± 2.1 |
-
†p <0.1, *p<0.05, ***p<0.005.
Table 2
Blood chemistry during chronic i.c.v. infusion of NPGL or the antibody against NPGL.
| A. Blood chemistry during chronic i.c.v. infusion of NPGL under high calorie diet. | ||
|---|---|---|
| CTL | NPGL | |
| Glucose (mg/dl) | 138 ± 5.7 | 135 ± 2.5 |
| Free Fatty Acid (mEq/l) | 0.526 ± 0.043 | 0.56 ± 0.066 |
| Triglyceride (mg/dl) | 101 ± 13.2 | 149 ± 20.9† |
| Cholesterol (mg/dl) | 99.0 ± 5.1 | 120.4 ± 5.3* |
| Insulin (ng/ml) | 2.53 ± 0.45 | 6.03 ± 1.22* |
| Leptin (ng/ml) | 8.76 ± 1.0 | 17.07 ± 1.6*** |
| B. Blood chemistry during chronic i.c.v. infusion of NPGL under normal chow. | ||
|---|---|---|
| CTL | NPGL | |
| Glucose (mg/dl) | 123 ± 7.0 | 128 ± 7.2 |
| Free Fatty Acid (mEq/l) | 0.276 ± 0.017 | 0.289 ± 0.017 |
| Triglyceride (mg/dl) | 73.0 ± 4.5 | 101.7 ± 11.6† |
| Cholesterol (mg/dl) | 66.5 ± 2.1 | 67.5 ± 3.4 |
| Insulin (ng/ml) | 4.51 ± 0.26 | 4.87 ± 0.33 |
| Leptin (ng/ml) | 8.84 ± 1.4 | 7.93 ± 0.70 |
| Corticosterone (ng/ml) | 523 ± 3.6 | 519 ± 1.4 |
| C. Blood chemistry during chronic i.c.v. infusion of the antibody against NPGL under high calorie diet. | ||
|---|---|---|
| CTL | NPGL-Ab | |
| Glucose (mg/dl) | 134 ± 2.38 | 137 ± 1.84 |
| Free Fatty Acid (mEq/l) | 0.529 ± 0.078 | 0.479 ± 0.048 |
| Triglyceride (mg/dl) | 129 ± 14.6 | 118 ± 18.8 |
| Cholesterol (mg/dl) | 111.9 ± 3.7 | 98.5 ± 4.7* |
| Insulin (ng/ml) | 2.23 ± 0.29 | 2.53 ± 0.33 |
| Leptin (ng/ml) | 9.14 ± 0.85 | 7.24 ± 0.51† |
| D. Blood chemistry during chronic i.c.v. infusion of NPGL under macronutrient diet. | ||
|---|---|---|
| CTL | NPGL | |
| Glucose (mg/dl) | 116 ± 4.4 | 124 ± 4.4 |
| Free Fatty Acid (mEq/l) | 0.359 ± 0.034 | 0.416 ± 0.042 |
| Triglyceride (mg/dl) | 74.4 ± 6.4 | 97.7 ± 7.8* |
| Cholesterol (mg/dl) | 99.7 ± 3.5 | 90.8 ± 5.5 |
| Insulin (ng/ml) | 1.94 ± 0.16 | 3.05 ± 0.68 |
| Leptin (ng/ml) | 3.92 ± 0.32 | 6.24 ± 0.33*** |
-
†p <0.1, *p<0.05, ***p<0.005.
Table 3
Sequences of oligonucleotide primers for real-time RT-PCR.
| A. Sequences of oligonucleotide primers for real-time RT-PCR in human tissues. | |||
|---|---|---|---|
| Gene | Forward primer | Reverse primer | Accession no. |
| NPGL | GGAACCATGGCTTAGGAAGG | CCTTAGGAGCTGAGAATATGTA | NM_001102659.1 |
| ACTB | GGCACCACACCTTCTACAAT | AGGTCTCAAACATGATCTGG | NM_001101.3 |
| B. Sequences of oligonucleotide primers for real-time RT-PCR in rat tissues. | |||
|---|---|---|---|
| Gene | Forward primer | Reverse primer | Accession no. |
| Npgl | GGAACCATGGCTTAGGAAGG | TCTAAGGAGCTGAGAATATGCA | LC003309 |
| Acc | GAGGTGGATCAGAGATTTCA | TTCAGCTCTAACTGGAAAGC | NM_022193.1 |
| Fas | AGGATGTCAACAAGCCCAAG | ACAGAGGAGAAGGCCACAAA | NM_017332.1 |
| Scd1 | TGAAAGCTGAGAAGCTGGTG | CAGTGTGGGCAGGATGAAG | NM_139192.2 |
| Gpat1 | CAGCGTGATTGCTACCTGAA | CGGAAGGTGTGGACAAAGAT | NM_017274.1 |
| Adpn | GGGCTACGCTATGTCTGAGC | GAGACTGCACACGAAGGTGA | NM_001282324.1 |
| Cpt1a | GGATGGCATGTGGGTAAAAG | TACTGACACAGGCAGCCAAA | NM_031559.2 |
| Atgl | GCTGCAAGTGGGTTTTTGAT | GTGAACGGTAAGGCACAGGT | NM_001108509.2 |
| Hsl | GAGACGGAGGACCATTTTGA | CGGAGGTCTCTGAGGAACAG | NM_012859.1 |
| Srebp1 | TCACAGATCCAGCAGGTCCCC | GGTCCCTCCACTCACCAGGGT | NM_001276707.1 |
| Lpl | TCTCCTGATGATGCGGATTT | CAACATGCCCTACTGGTTTC | NM_012598.2 |
| Cd36 | GAGGTCCTTACACATACAGAGTTCGTT | ACAGACAGTGAAGGCTCAAAGATG | NM_031561.2 |
| Fatp1 | GCGGCGTTCGGTGTGTAC | GCACGCGGATCAGAACAGA | NM_053580.2 |
| Slc2a2 | GACATCGGTGTGATCAATGC | TGTCGTATGTGCTGGTGTGA | NM_012879 |
| Slc2a4 | CCTCCAGGATGAAGGAAACA | GGGAGAAAAGCCCATCTAGG | NM_012751 |
| Gapdh | CGGCAAGTTCAACGGCACAG | ACTCCACGACATACTCAGCAC | NM_017008.4 |
| Gk | TTGAGACCCGTTTCGTGTCA | AGGGTCGAAGCCCCAGAGT | NM_001270850.1 |
| L-Pk | TGATGATTGGACGCTGCAA | GAGTTGGTCGAGCCTTAGTGATC | NM_012624.3 |
| Npy | TATCCCTGCTCGTGTT | GATTGATGTAGTGTCGCAGA | NM_012614.2 |
| Agrp | GCAGACCGAGCAGAAGATGT | GACTCGTGCAGCCTTACACA | NM_033650.1 |
| Pomc | TAAGAGAGGCCACTGAACAT | GTCTATGGAGGTCTGAAGCA | NM_139326.2 |
| Actb | GGCACCACACTTTCTACAAT | AGGTCTCAAACATGATCTGG | NM_031144.3 |
| Rps18 | AAGTTTCAGCACATCCTGCGAGTA | TTGGTGAGGTCAATGTCTGCTTTC | NM_213557.1 |
| C. Sequences of oligonucleotide primers for real-time RT-PCR in mouse tissues. | |||
|---|---|---|---|
| Gene | Forward primer | Reverse primer | Accession no. |
| Npgl | GGAACCATGGCTTAGGAAGG | TCTAAGGAGCTGAGAATATGCA | LC088498 |
| Actb | GGCACCACACCTTCTACAAT | AGGTCTCAAACATGATCTGG | NM_007393.4 |
Additional files
-
Supplementary file 1
The detailed statistical analysis of figures.
The table shows the statistics test, number of n, comparison, p value, and degree of freedom and F/t/z/ETC value in each figure panel.
- https://doi.org/10.7554/eLife.28527.021
Download links
A two-part list of links to download the article, or parts of the article, in various formats.
Downloads (link to download the article as PDF)
Open citations (links to open the citations from this article in various online reference manager services)
Cite this article (links to download the citations from this article in formats compatible with various reference manager tools)
Neurosecretory protein GL stimulates food intake, de novo lipogenesis, and onset of obesity
eLife 6:e28527.
https://doi.org/10.7554/eLife.28527


