Structural basis of host recognition and biofilm formation by Salmonella Saf pili
- Shanghai Institute of Hematology, Rui-Jin Hospital, Shanghai JiaoTong University School of Medicine and School of Life Sciences and Biotechnology, Shanghai JiaoTong University, China
Figures
Figure 1 with 1 supplement
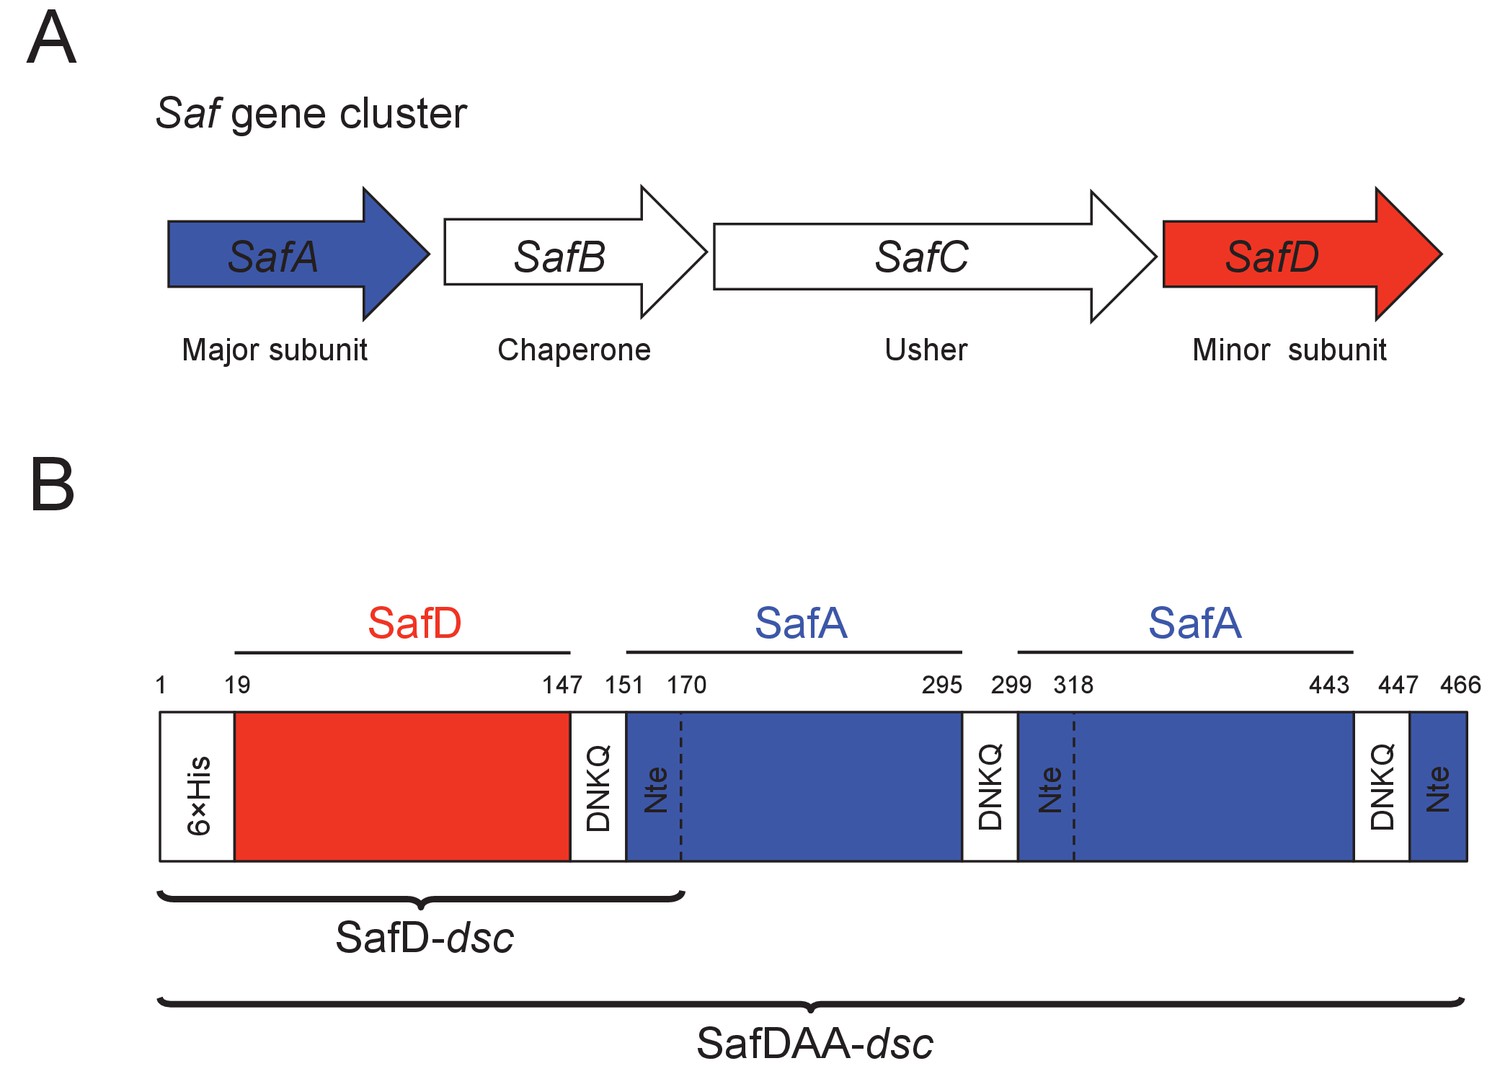
Recombinant expression strategy of SafD-dsc and SafDAA-dsc.
(A) SafABCD gene cluster in Salmonella enterica. SafA, the major subunit. SafB, the periplasmic chaperone, SafC, the outer membrane usher, and SafD, the minor subunit. (B) Schematic diagram of recombinant SafD-dsc and SafDAA-dsc. The artificial linker, enabling the linkage of subunits, is composed of four residues DNKQ. A 19-residue donor strand (termed Nte from SafA) is used to ensure the correct folding of pilin subunits, allowing the stable expression of SafD-dsc and SafDAA-dsc in E.coli.
Figure 1—figure supplement 1
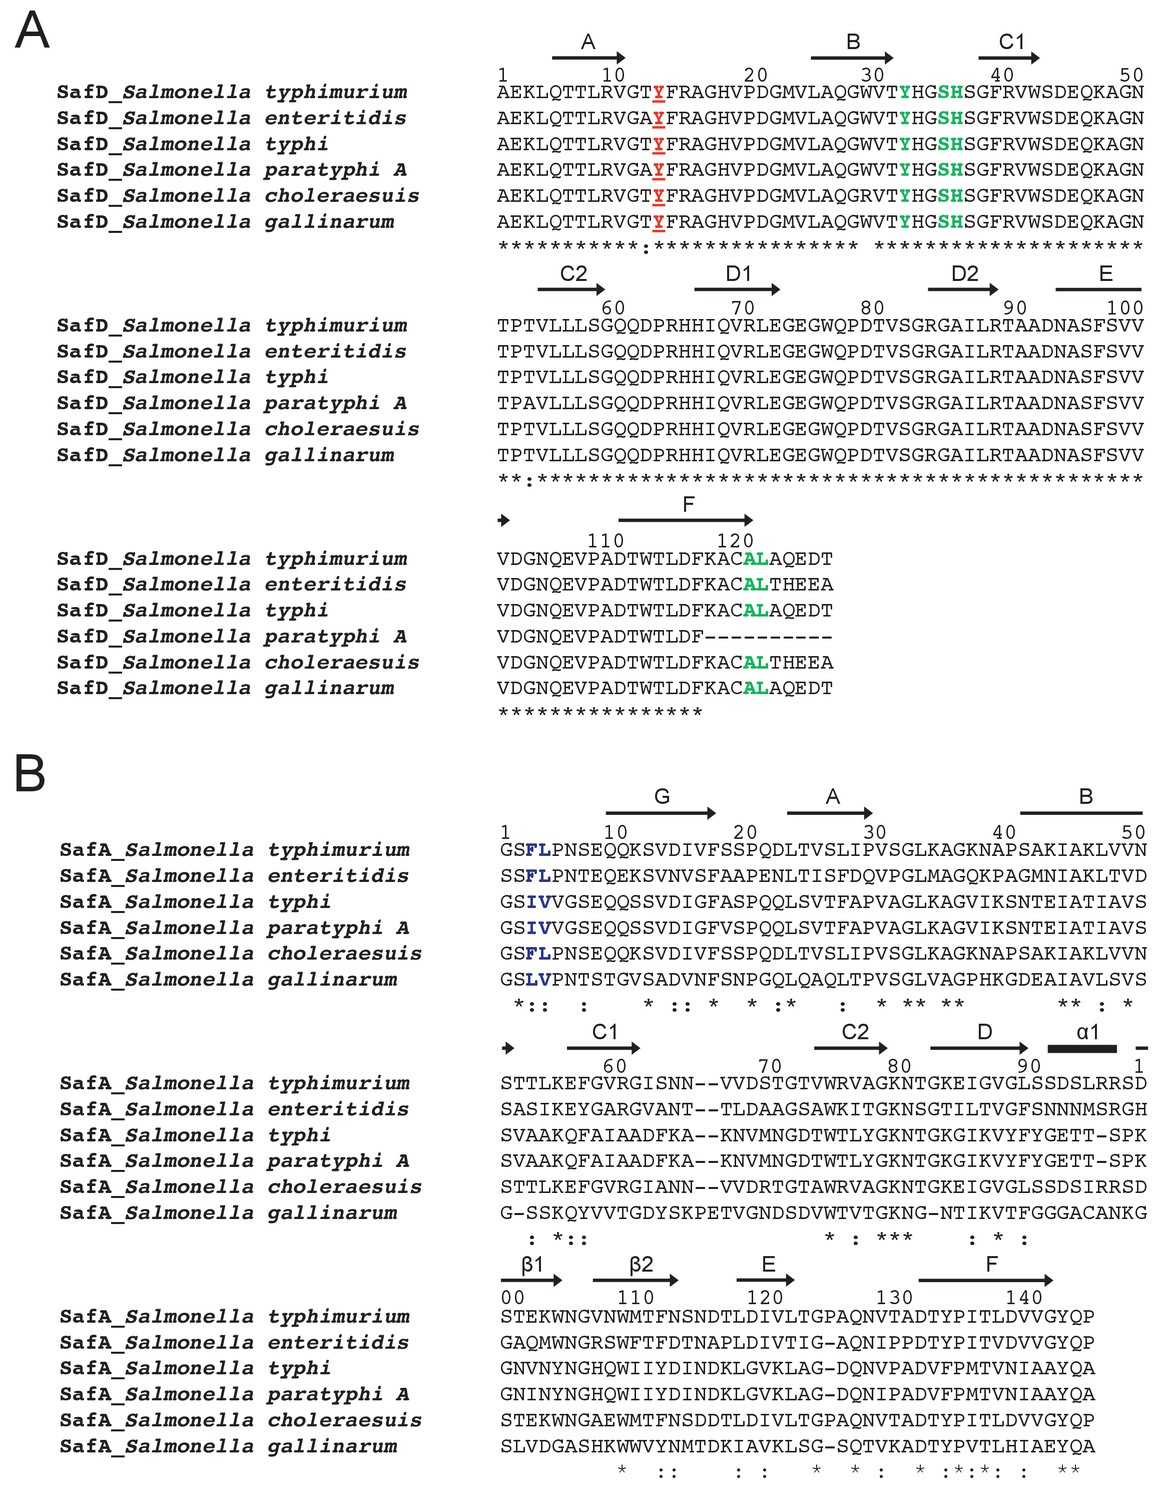
Sequence alignment of SafD (A) and SafA (B) in Salmonella enterica strains.
SafD subunit is evolutionary conserved (>97% sequence identity). In marked contrast, SafA displays much lower sequence similarity among Salmonella species (~36% sequence identity). The secondary structure is annotated with arrows (for β-strand) and black stick (for α-helix) on top of the sequence alignment. The highly and relatively conserved residues are indicated with ‘*' and ‘:', respectively. The SafD residues of Tyr13 and delineating the P** pocket are colored in red and green (A), respectively. The relatively conserved residues corresponding the P* and P** pocket in SafANte are colored in blue (B).
Figure 2 with 1 supplement
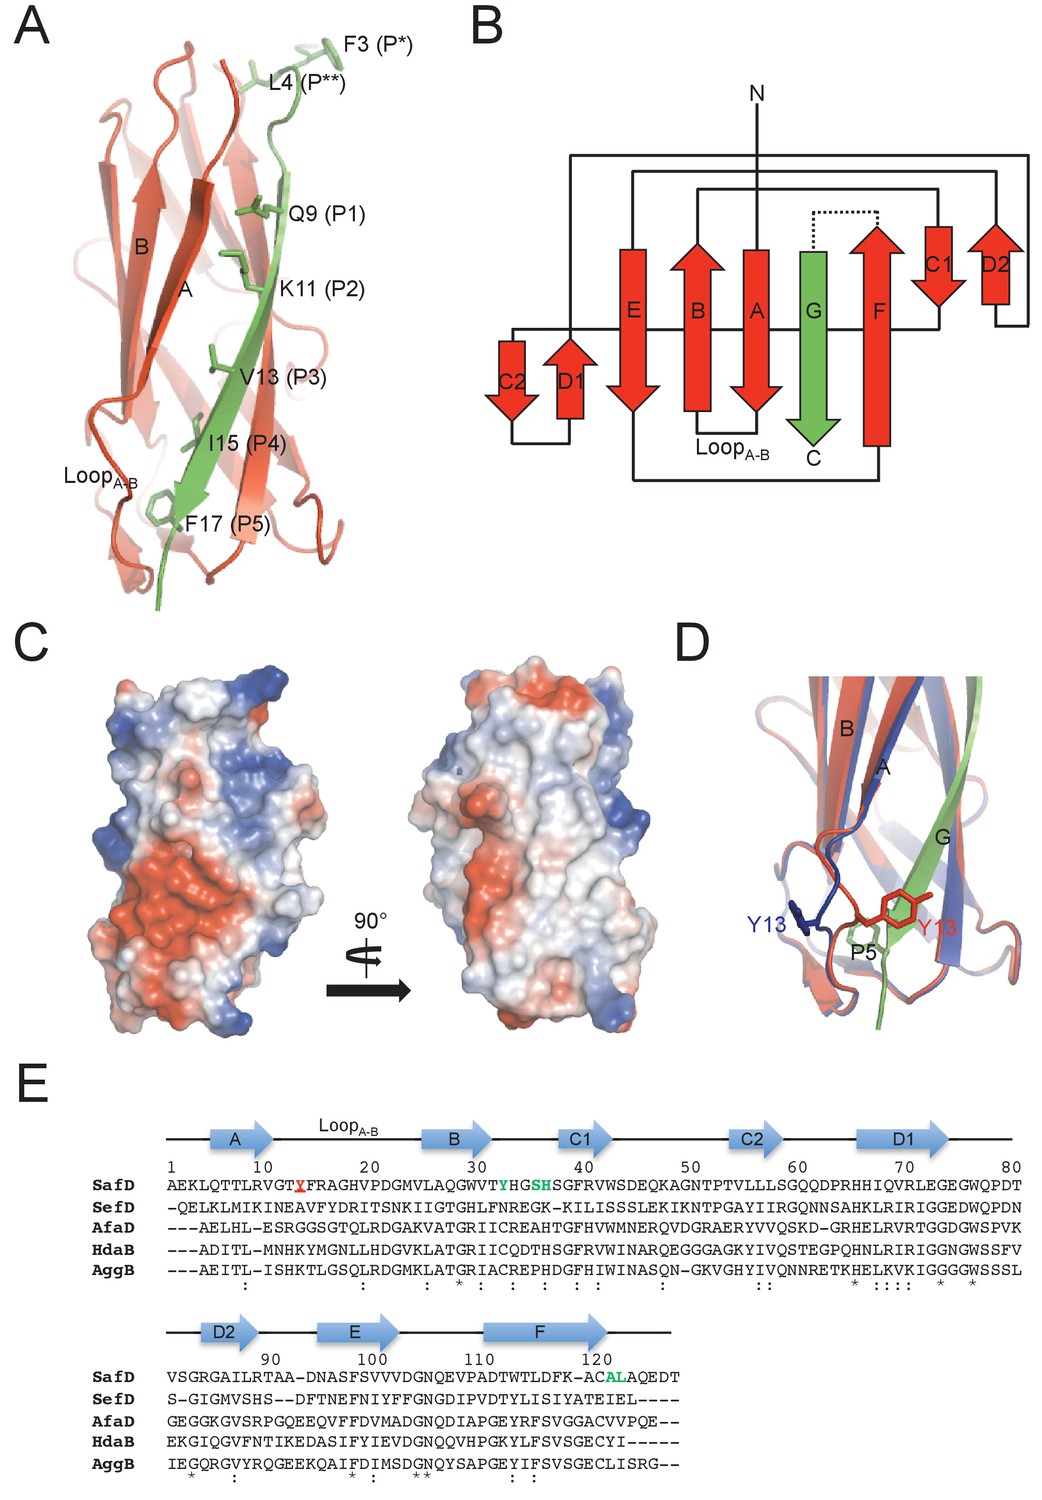
Crystal structure of SafD-dsc.
(A) The cartoon representation of SafD-SafANte. The SafD is colored in red and SafANte in green. The residues, Leu4, Gln9, Lys11, Val13, Ile15, Phe17, corresponding the P** and P1-P5 pockets, respectively, are shown in stick representation. (B) The topology diagram of SafD-dsc. The secondary structure of SafD is colored in red. The complementing G strand is colored in green. The artificial linker DNKQ is highlighted with dotted line. (C) Electrostatic surface of SafD-dsc. The surface is colored with electrostatic potential (blue for positive charge and red for negative charge). (D) Structural superimposition of SafD-dsc molecules presented in this report. The residue Tyr13 in LoopA-B is highlighted and shown in stick representation. (E) Sequence alignment of SafD, SefD, AfaD, DraD and AggB adhesins. The β-strands of SafD are shown with arrows on top of the sequences. The highly and relatively conserved residues are indicated with ‘*' and ‘:', respectively. Tyr13 is underscored and colored in red. Residues delineating the P** pocket are shown in green.
Figure 2—figure supplement 1
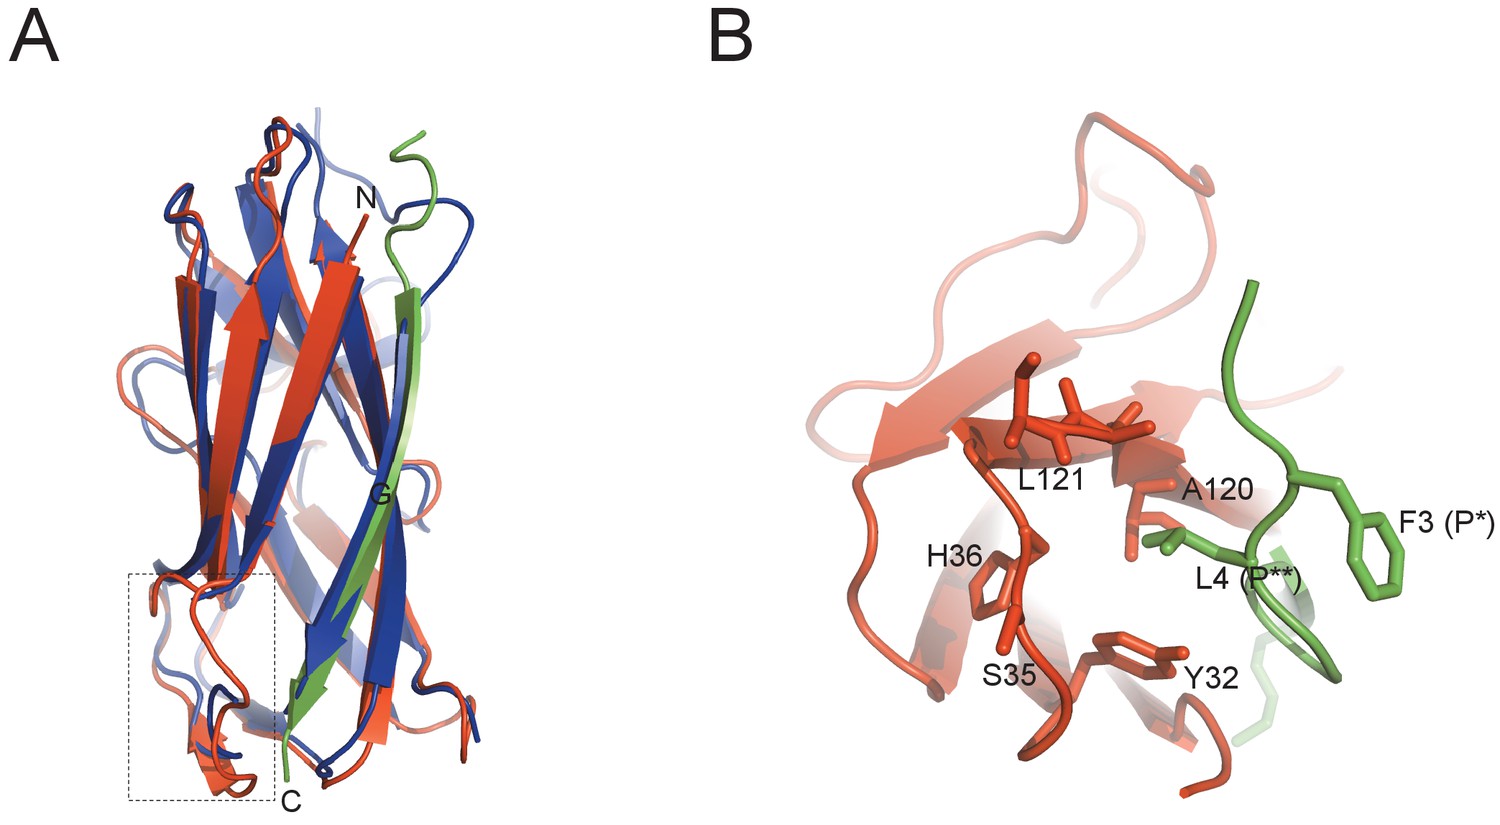
Protein diversity in SafD-dsc.
(A) Structural superimposition of SafD-dsc and AggBdsA (PDB code: 4PHX). The SafD, SafANte and AggBdsA are colored in red, green and blue, respectively. The region around LoopA-B is boxed. The equivalent LoopA-B in AggBdsA structure is disorded, and hence not shown. (B) The enlarged view of P** pocket in SafD-dsc. Residues delineating the P** pocket are shown in red and stick representation. The Phe3 (P*) and Leu4 (P**) of SafANte are shown in green.
Figure 3 with 1 supplement
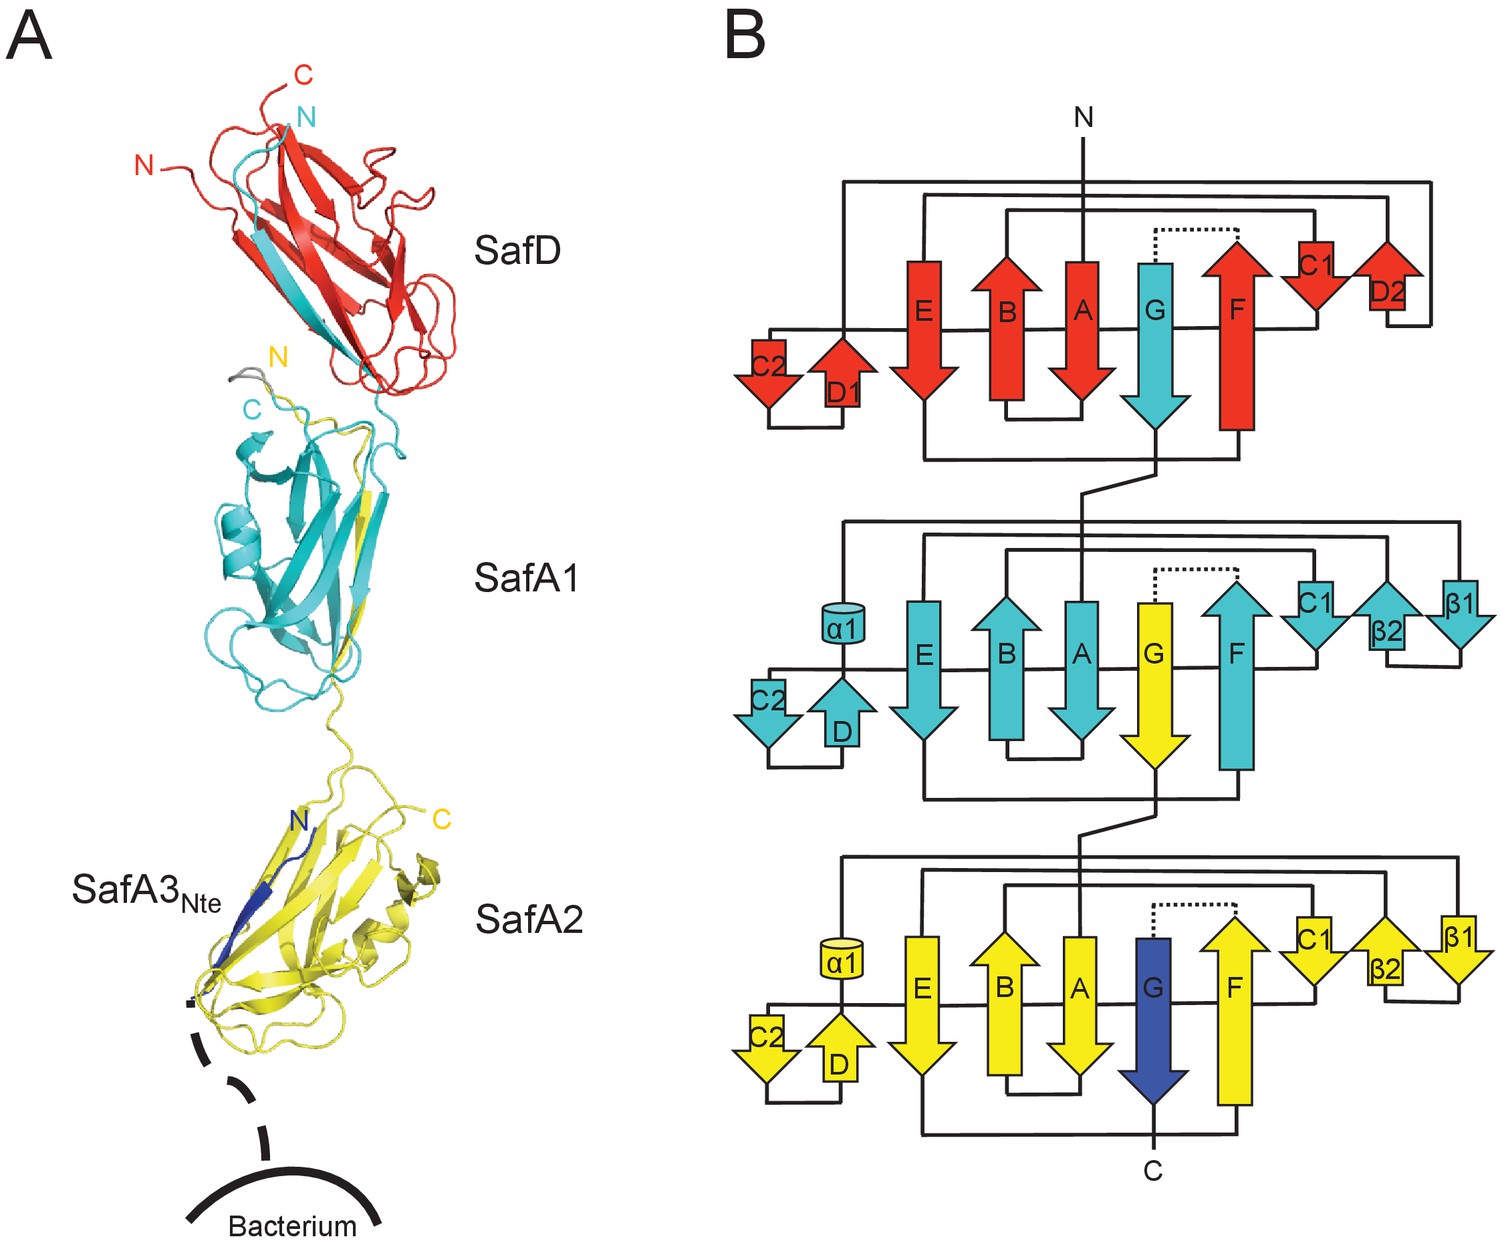
Crystal structure of SafDAA-dsc.
(A) The cartoon representation of SafD-SafA1-SafA2-SafA3Nte, colored in red, cyan, yellow and blue, respectively. N- and C-termini of each subunit are labelled. The other SafA subunits of Saf pili are shown with a dotted line. The artificial linker sequences DNKQ in between SafD-SafA1 is colored in gray. (B) The topology diagram of SafDAA-dsc. The D, A1, A2 and A3 subunits are colored using the same color scheme as described above.
Figure 3—figure supplement 1
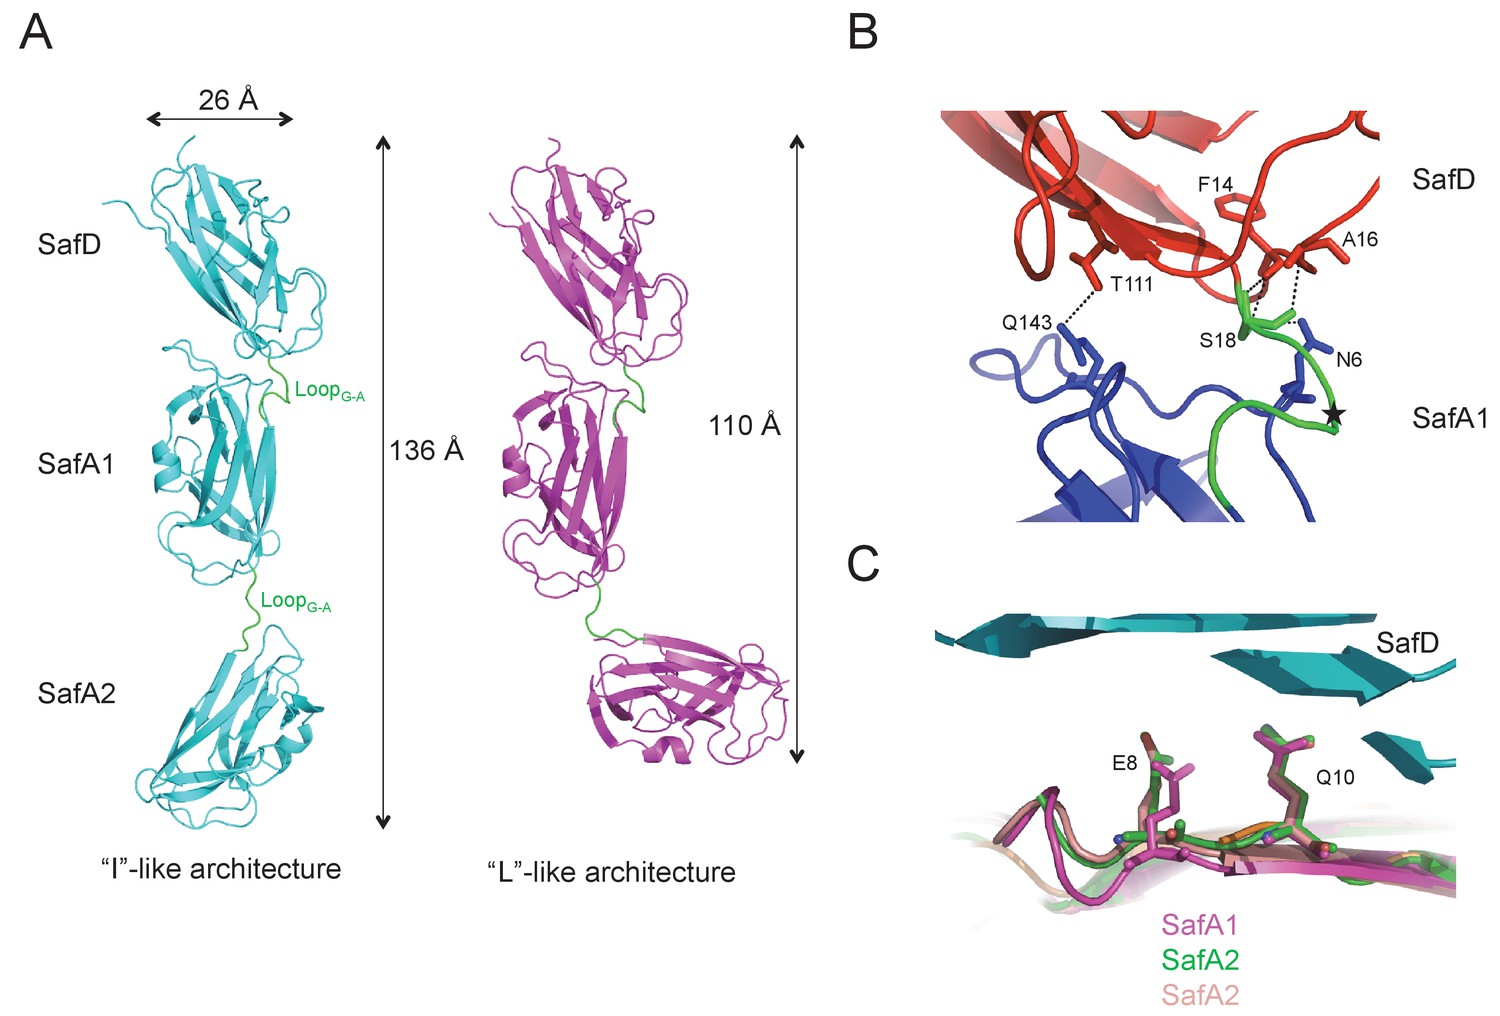
The architectures of SafDAA-dsc.
(A) The ‘I’- and ‘L’-like SafDAA-dsc. (B) The enlarged view of SafD-SafA1. The SafD, SafA1, and linker LoopG-A are shown in red, blue and green, respectively. The P20 residue in LoopG-A is highlighted with a black star. The residues forming inter-molecular hydrogen bonds are shown in stick representation. The hydrogen bonds are shown in dashed lines. (C) Structural superimposition of SafA subunits. SafA1 that forms direct hydrogen bonds with SafD is colored in megenta. SafA2 subunits of ‘L’-like architecture that do not form direct hydrogen bond with SafD in both Type I and Type II dimers are colored in green and pink.
Figure 4
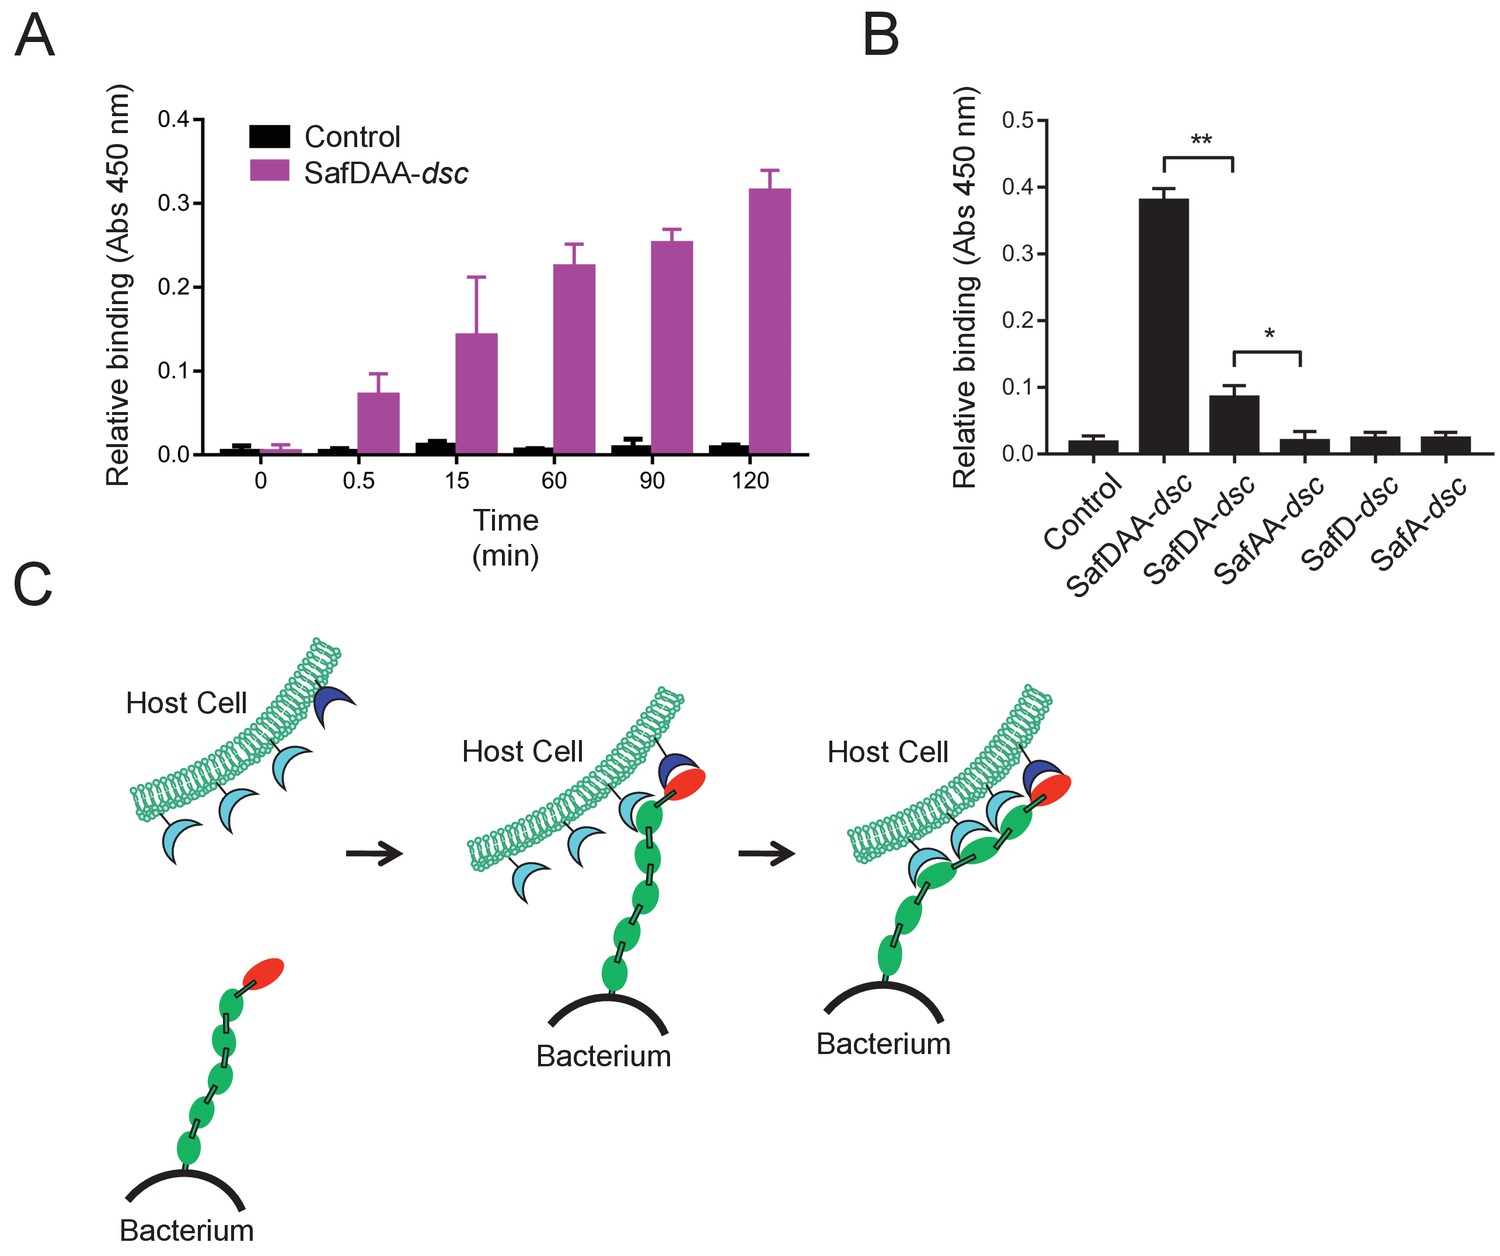
Host recognition by Salmonella Saf pili.
(A) Cell adherence assay. 3 μM SafDAA-dsc was incubated with IPEC-J2 cells and the relative biniding of SafDAA-dsc was monitored at different time points up to 2 hr. 3 μM recombinant protein His-SH3 was used as control. (B) The binding activities of SafDAA-dsc, SafDA-dsc, SafAA-dsc, SafD-dsc and SafA-dsc. 10 μM recombinant Saf proteins were incubated with IPEC-J2 cells for 1 hr prior to ELISA analysis. All experiments have been done at least with three independent replicates. Values are means ±S.E. *p<0.05 and **p<0.01 (derived from student t test) are used to show statistically significant between recombinant derivatives. (C) The poly-adhesive host recognition mechanism by Saf pili. In the first step, the SafD (red) located in the distal tip of the pilus can mediate the initial host recognition. The unkonwn host receptor is colored in blue. In the second step, an intimate host:bacerium association leading to bacterial colonization and diseases can be formed by the sequential binding of SafA subunits (green) with a separate set of host receptors (cyan).
-
Figure 4—source data 1
Source data for Figure 4A.
Cell adherence measured by OD450 absorance values (three replicates).
- https://doi.org/10.7554/eLife.28619.010
-
Figure 4—source data 2
Source data for Figure 4B.
Cell adherence for SafDAA-dsc and mutants measured by OD450 absorance values (three replicates).
- https://doi.org/10.7554/eLife.28619.011
Figure 5 with 1 supplement
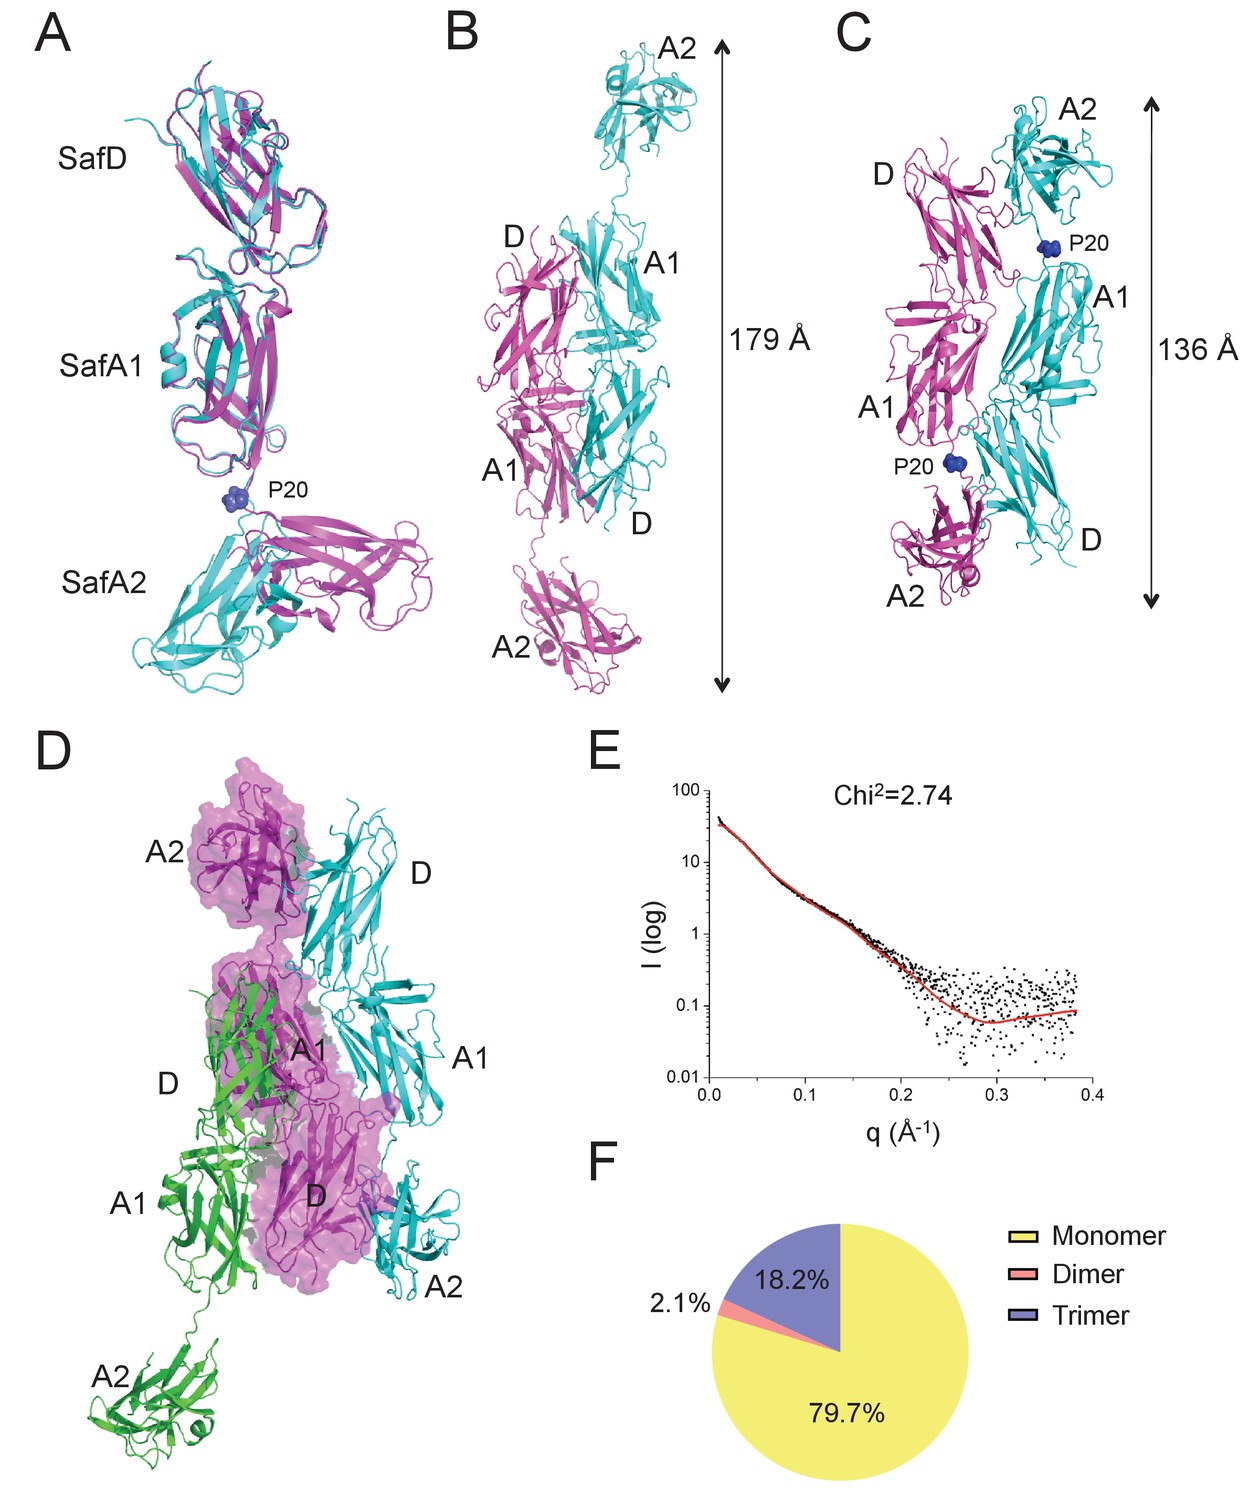
Self-associating SafDAA-SafDAA interaction.
(A) The superimposition between ‘I'- and ‘L’-like SafDAA-dsc. The two molecules are colored in cyan and magenta, respectively. The Pro20 residue in the linker LoopG-A between SafA1 and SafA2 is highlighted with sphere representation and colored in blue. (B) The Type I dimerization. SafD-SafA1 (molecule 1, magenta) interacts with a nerighbouring counterpart (molecule 2, cyan) in a head-to-tail configuration. The overall length of the Type I dimer is 179 Å. (C) The Type II dimerization. Two SafDAA molecules intertwine with each other, enabling the intermolecular interaction between SafD (molecule 1, magenta) and SafA2 (molecule 2, cyan). As a result, the dimerization appears to give rise to a more intimate ‘6–9’-like self-association. The overall length of Type II dimer is 136 Å. (D) The SafDAA trimer. For the purpose of clarity, the SafDAA molecule in the middle is shown with transparent surface and the other two are shown in cartoon representations. (E) The SAXS characterization. Black line, experimental data. Red line, the theoretical scattering pattern derived from SafDAA multimers. (F) Oligomeric distribution estimated by SAXS analysis.
-
Figure 5—source data 1
Source data for Figure 5E.
SAXS data were recorded a X-ray beam with the wavelength of 1.03 Å (BL19U2, SSRF, China).
- https://doi.org/10.7554/eLife.28619.015
Figure 5—figure supplement 1
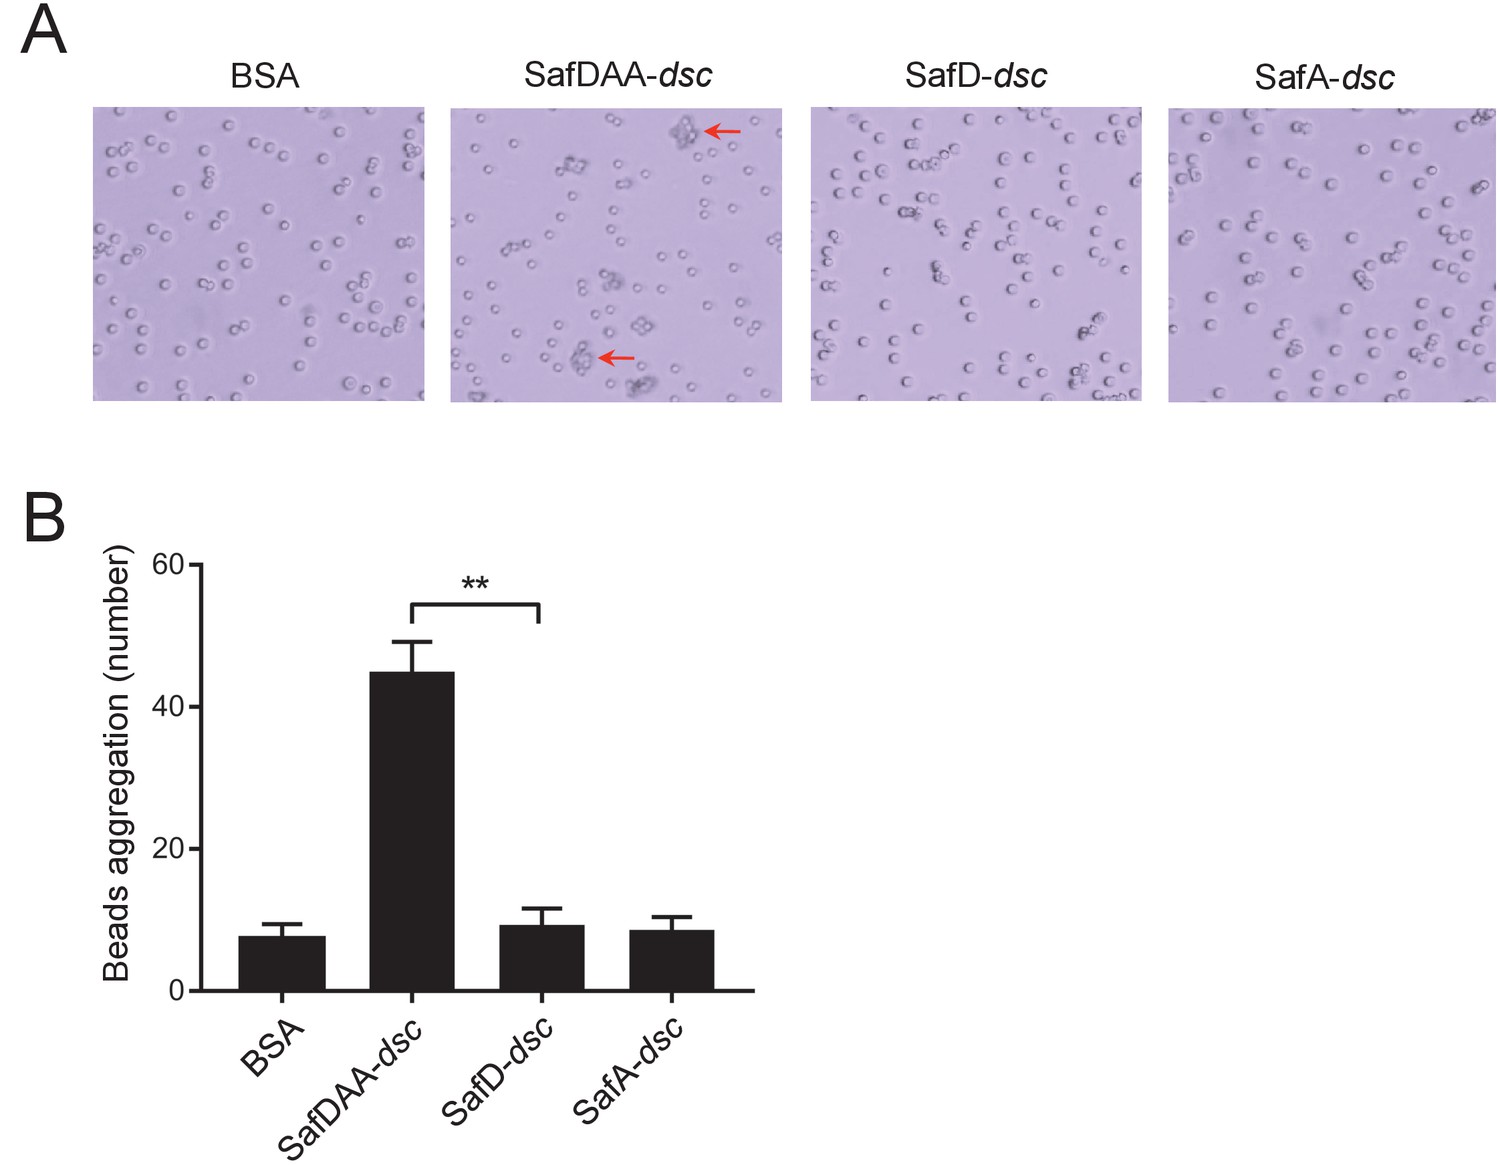
Visualization of the SafDAA-SafDAA self-association using the latex beads assay.
(A) The aggregates driven by SafDAA-dsc are highlighted with arrows in the right panel. The beads coated with recombinant SafD-dsc alone, SafA-dsc alone, and BSA remained much isolated. (B) Statistics analysis of beads aggregation. Beads aggregation was qauntified by the observation of bead clusters, of which the number of beads (n) was ≥3. Values are means ±S.E. from three independent experiments, in which 100 beads were choosen for statistics analysis. **p<0.01.
-
Figure 5—figure supplement 1—source data 1
Source data for Figure 5 Figure 5 – figure supplementar 1B.
Beads aggregation was qauntified by the observation of bead clusters, of which the number of beads (n) was ≥3. Values are means ±S.E. from three independent experiments.
- https://doi.org/10.7554/eLife.28619.014
Figure 6
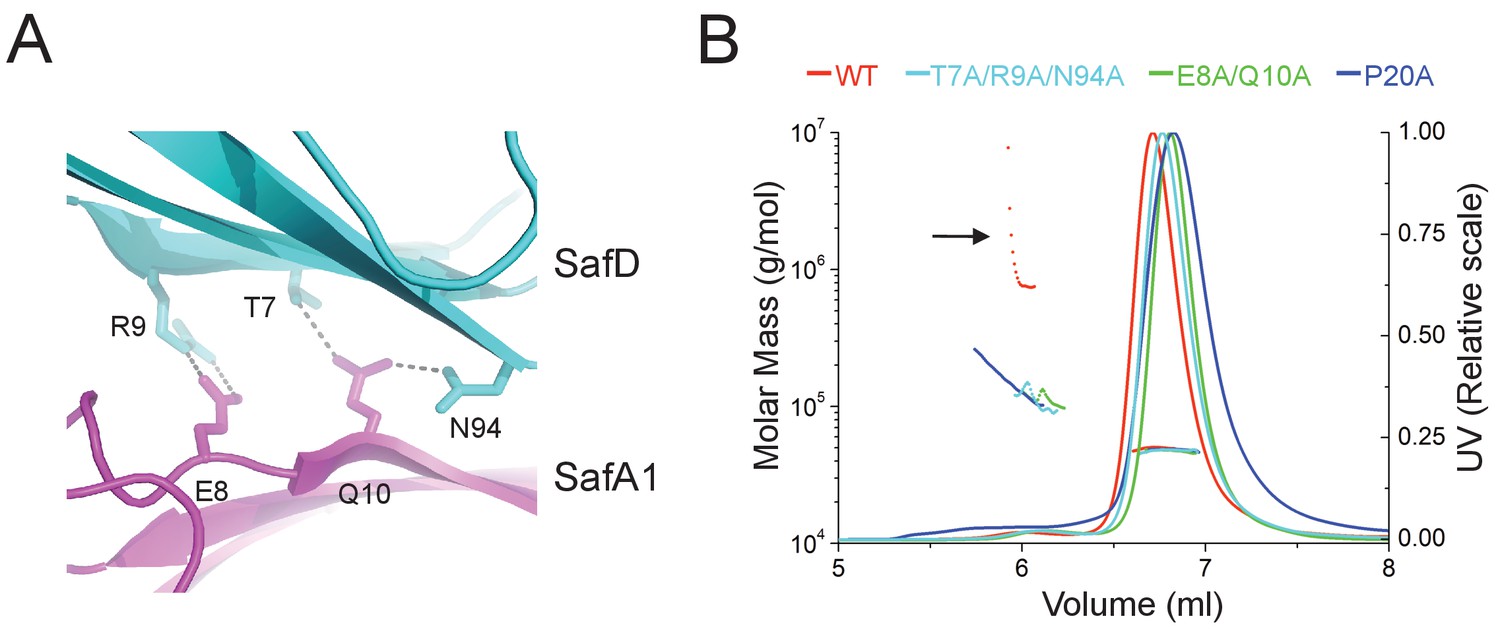
Structural determinants of SafDAA-SafDAA interaction.
(A) The inter-molecular hydrogen bonding network in the dimeric interface of SafDAA-SafDAA. As shown in Figure 5B, the SafD-SafA1 intermolecular interaction is repetitive in Type I dimerization. For the purpose of illustration, one dimeric interface is shown. The SafD residues, Thr7, Arg9, Asn94 form four inter-molecular hydrogen bonds with the SafA residues, Glu8, Gln10. The residues are shown in stick representations, and the hydrogen bonds are highlighted with dash lines. (B) SEC-MALS characterization of SafDAA-dsc (red) and mutants (cyan, green and blue) in solution. The elution traces of molecular weight and UV are shown with dashed and solid lines, respective. The self-associating activity, monitored by higher order oligomerization, is highlighted with arrow. The structure-based mutations targeting the dimeric interface and Pro20 significantly impair the SafDAA oligomerization activity.
-
Figure 6—source data 1
Source data for Figure 6B.
Elution volumes and estimatd molecular weights derived from SEC-MALS characterization for WT SafDAA-dsc and mutants.
- https://doi.org/10.7554/eLife.28619.017
Figure 7 with 1 supplement
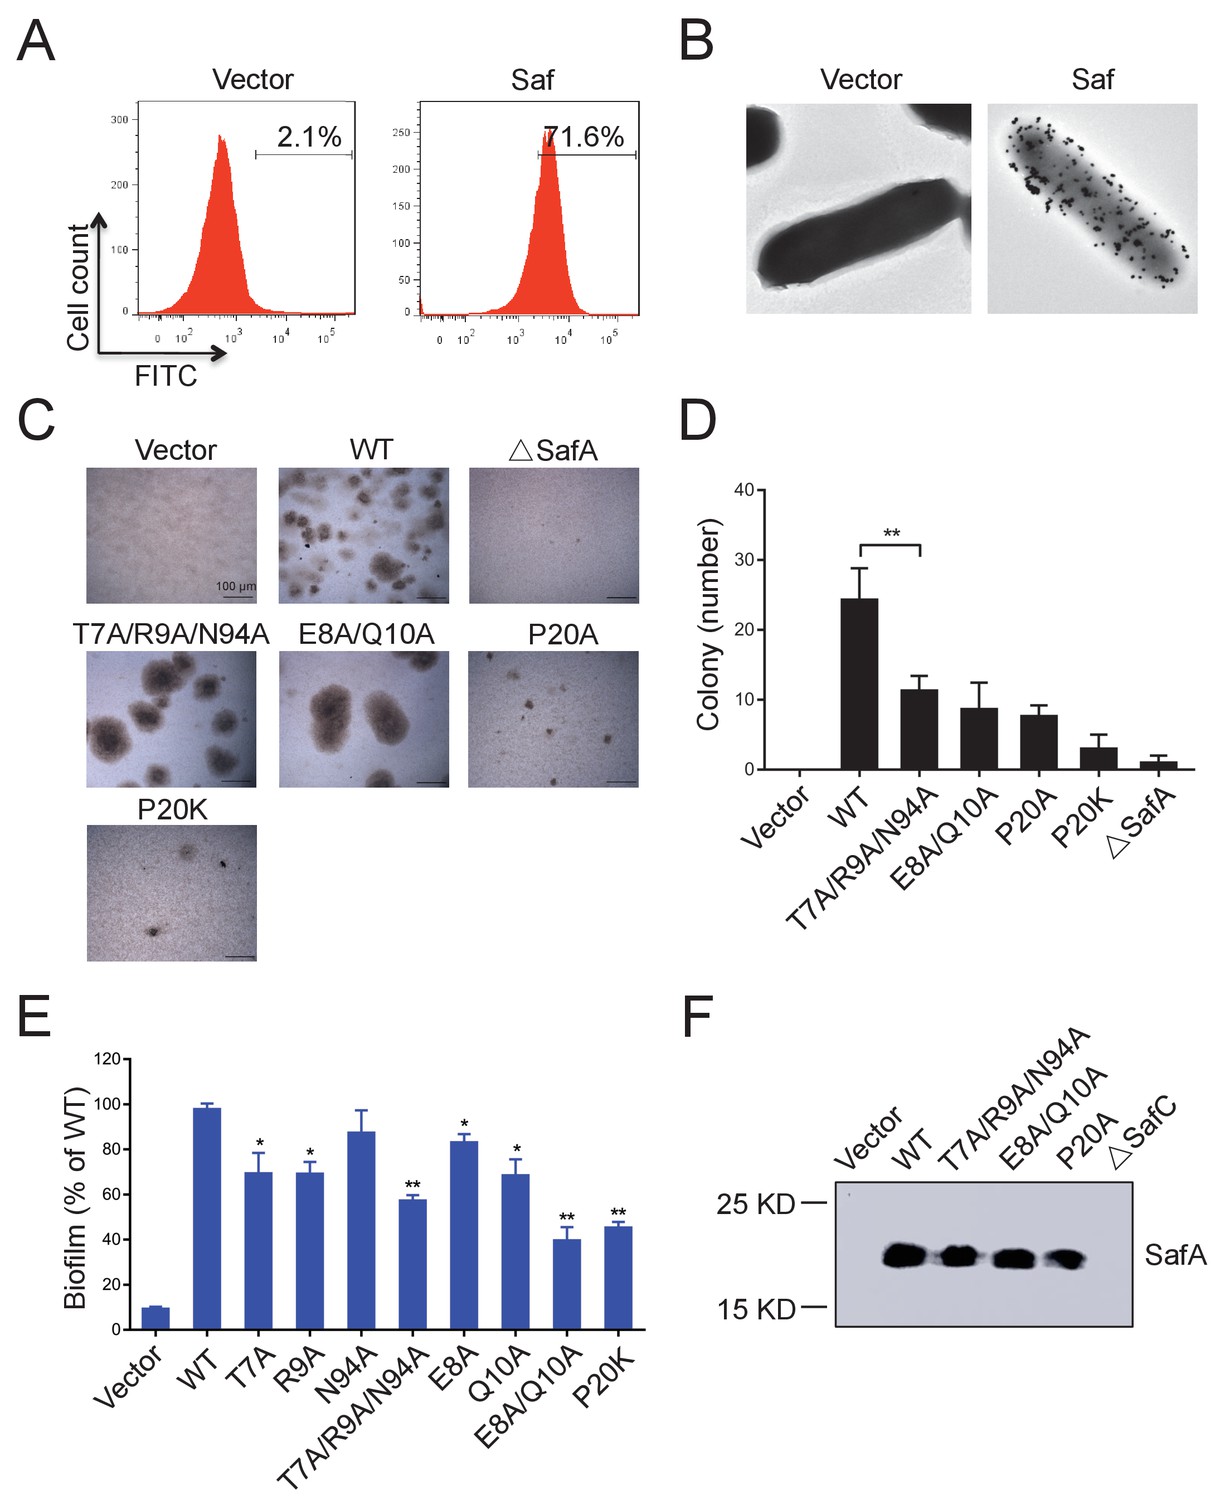
Inter-cellular SafDAA-SafDAA self-association drives biofilm formation.
(A) The flow cytometry assay was used to monitor the expression and surfacing of Saf pili in LB medium. The quantified surfacing efficiency of cells harboring pASK-IBA4-Saf was 71.6%, in comparison to the background value of 2.1% for the empty pASK-IBA4 vector. (B) EM visualization of Saf surfacing using anti-strep immunogold. Top left: control cells that contained empty pASK-IBA4 vector. Top right, E.coli cells harboring pASK-IBA4-Saf. Both sets of the cells are incubated with anti-strep immunogod particles (black dots) prior to EM inspection. (C) Saf-driven cell aggregation visualized by light microscopy. After induction with 2% AHT for 24 hr in a 96-well plate, the colonization ability of WT Saf pili and muants were visualized by light microscopy. (D) Quantitative analysis of cell aggregation assay (C). The average number of colony formation for WT and mutants were calculated from three independent experiments in a 96-well plate. **p<0.01, statistically significant compared with WT. (E) Structure-based mutagenesis and biofilm formation assay. The wild-type (WT) Saf pili and the mutants that target the self-association were expressed in E.coli DH5α using pASK-IBA-Saf. The biofilm formation was quantified using crystal violet staining. For the purpose of comparison, the self-associating/biofilm-formation activities of mutants were normalized against WT and showed in percentage values. All experiments have been done at least with three independent replicates. Values are means ±S.E. from three independent experiments. *p<0.05 and **p<0.01 are used for statistic analysis between WT and mutants. (F) The expression levels of WT Saf pili and mutants in E.coli. The bacterial outer membrane (OM) fraction harboring WT Saf or mutants was extracted and subjected to western blot analysis using antibody against strep-SafA. The pASK-IBA4-SafABD, that is, ΔSafC, was used as negative control.
-
Figure 7—source data 1
Source data for Figure 7D.
The average number of colony formation for WT Saf pili and mutants (three replicates).
- https://doi.org/10.7554/eLife.28619.020
-
Figure 7—source data 2
Source data for Figure 7E.
The biofilm formation acitivties of Saf pili and mutant quantified by OD570 absorance values (three replicates). For the purpose of comparison, the self-associating/biofilm-formation activities of mutants were normalized against WT and showed in percentage values.
- https://doi.org/10.7554/eLife.28619.021
Figure 7—figure supplement 1
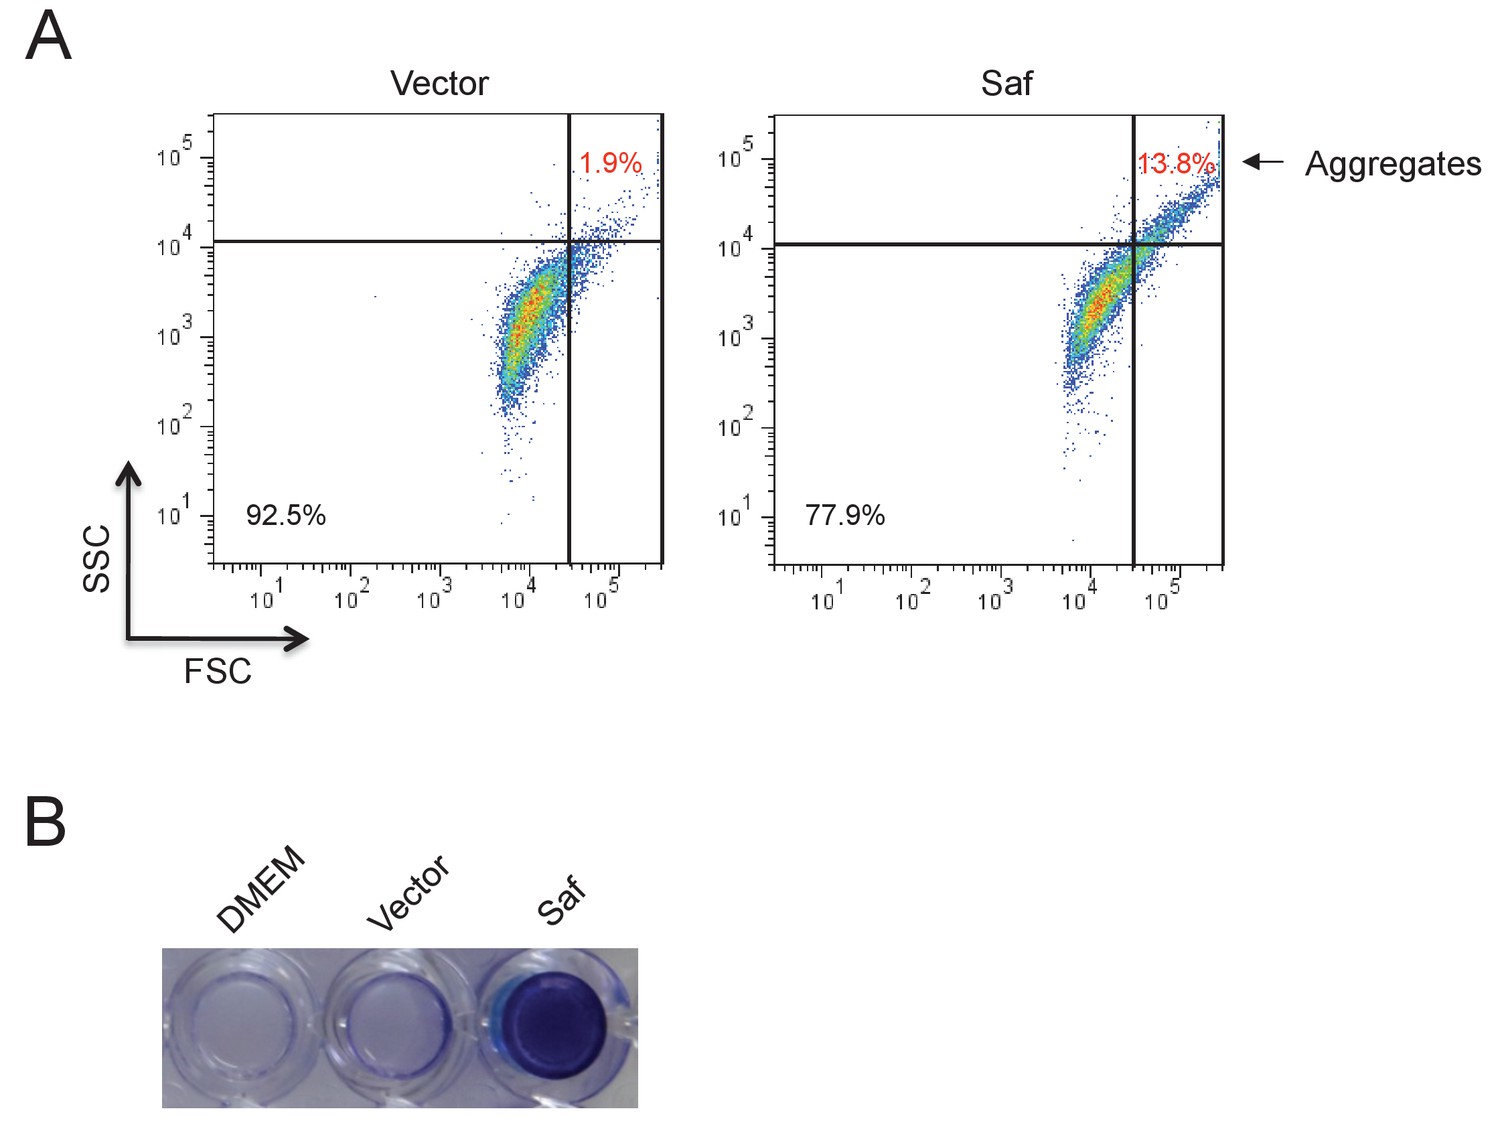
Saf-driven bacterial aggregation.
(A) Aggregation analysis by flow cytometry. The E.coli DH5α cells harboring Saf pili expression plasmid were induced in DMEM medium. The cell aggregations were registered and quantified by high values of FSC and SSC signals. The percentages of bacterial aggregation in Saf- or control-cells were highlighted with red color and arrow. (B) The Saf-driven biofilm formation in E.coli. The E.coli DH5α cells with the expression of Saf pili showed remarkable biofilm formation after incubation in DMEM medium. As controls, DMEM medium alone and E.coli DH5α with pASK-IBA4 empty vector displayed little biofilm activity.
Figure 8
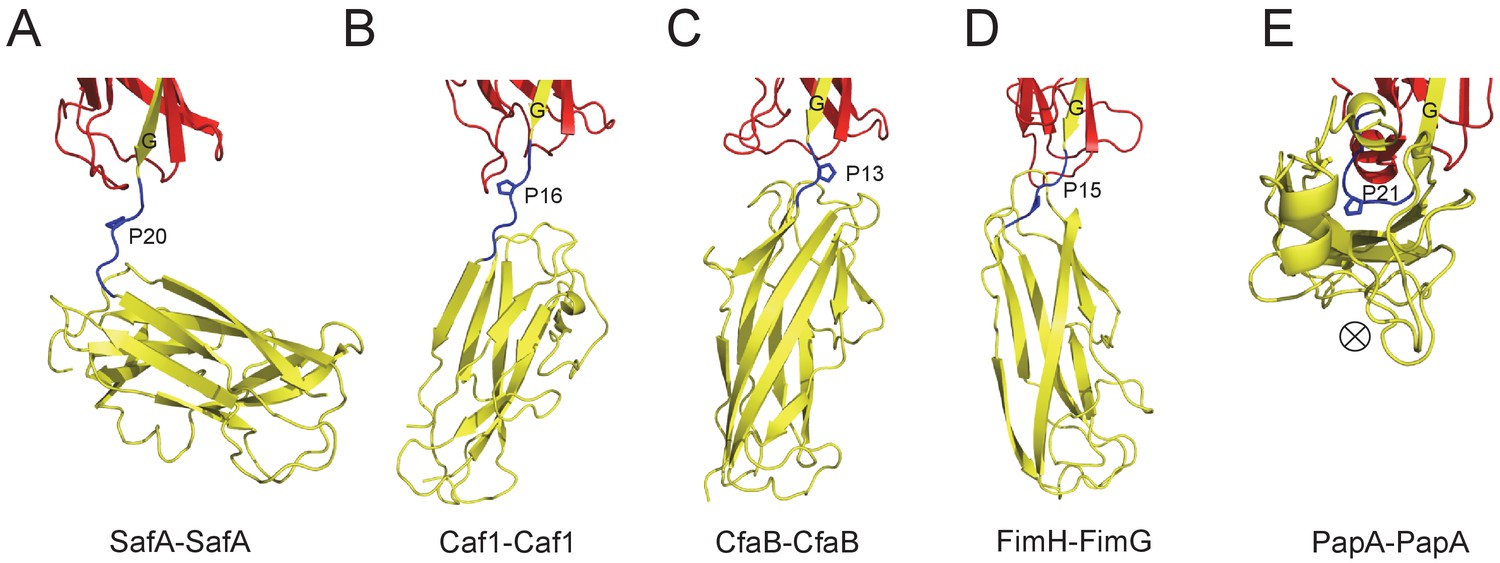
The Proline residue in LoopG-A controls the flexibility and overall architecture/shape of bacterial pilus.
The structures of SafA-SafA in Salmonella atypical fimbriae (A), Caf1-Caf1 in Capsular F1 antigen pili (Zavialov et al., 2003) (B), CfaB-CfaB in Class 5 fimbriae (Li et al., 2009) (C), FimH-FimG in Type 1 pili (Geibel et al., 2013) (D), and PapA-PapA in P pili (Hospenthal et al., 2016) (E) are shown in cartoon representation. The preceding subunits are colored in red with the donor G strand in yellow. The following subunits are colored in yellow and the linker, LoopG-A, are shown in blue with the proline residues highlighted with stick representation. In order to visualize the flexibility between subunits, all the structures are superimposed based on the coordinates of the preceding subunit (red). ⊗ indicates an inward Z direction of PapA.
Figure 9
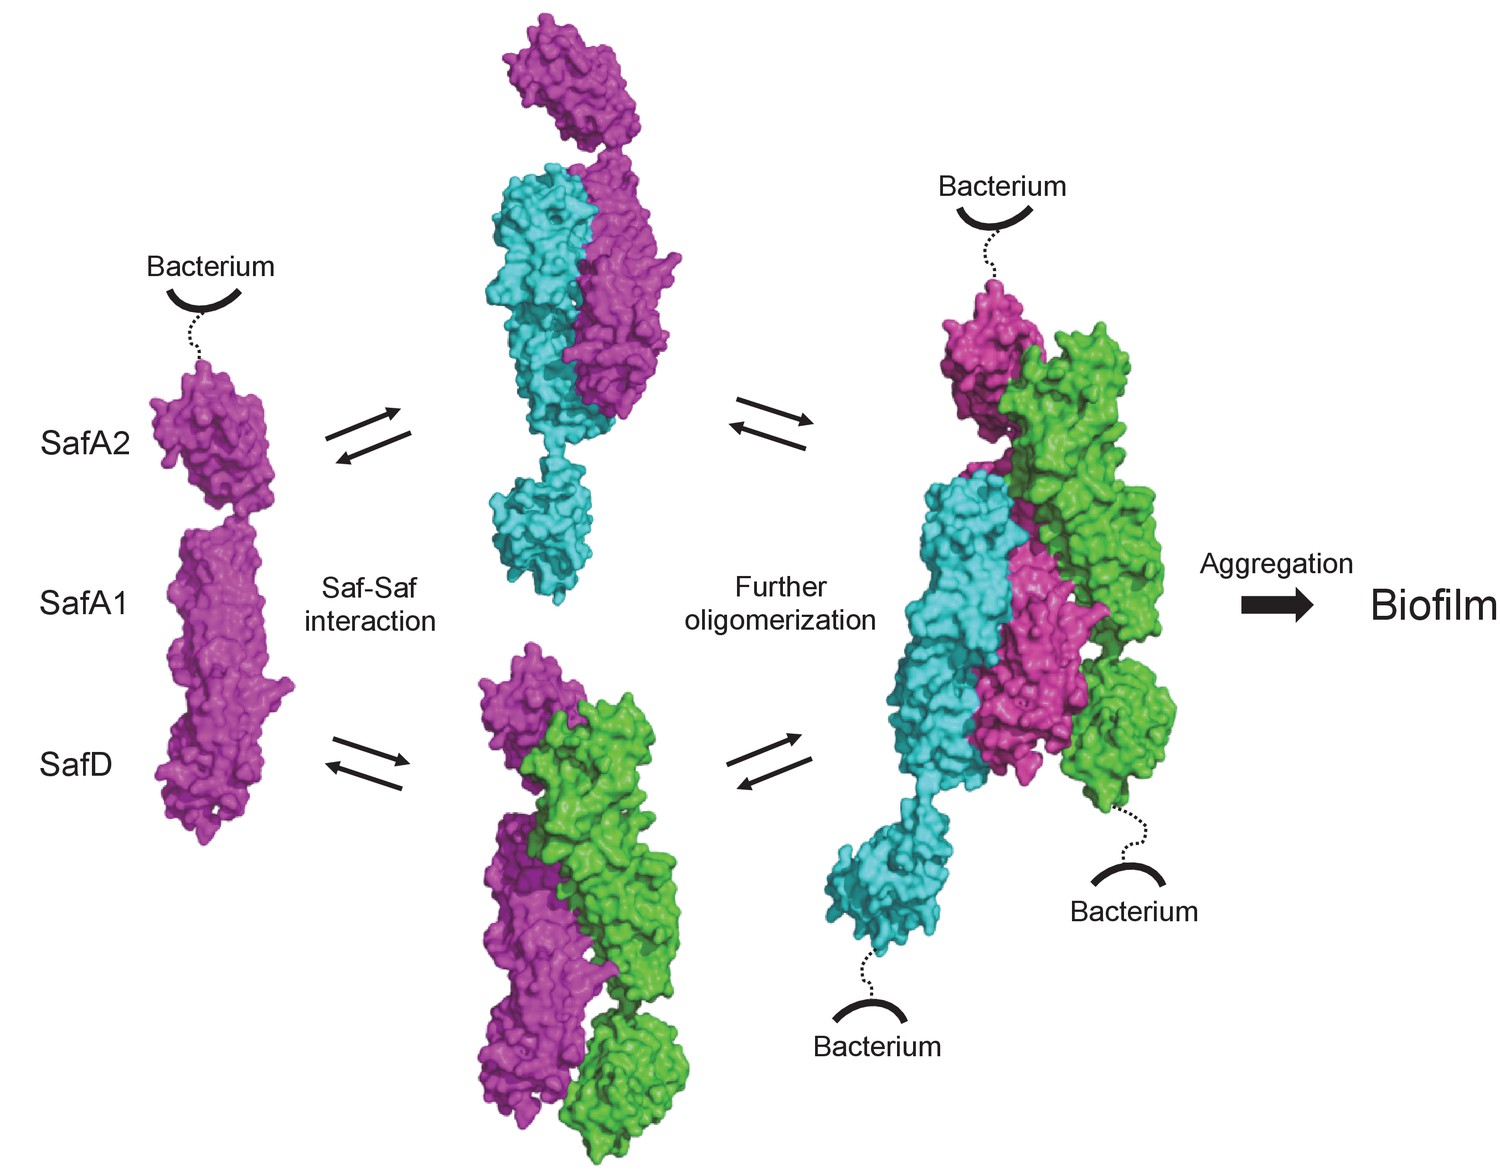
Structural and functional characterization of SafDAA-dsc reveal a novel Saf-driven self-associating mechanism for bacterial aggregation and biofilm formation.
In the initial stage, Saf pili can mediate cell-cell interaction via versatile SafDAA dimerizations. As the inter-cellular oligomerization proceeds further, Saf pili might intertwine against each other, enabling a higher order Saf pili oligomerization (n > 3) to generate necessary attractive forces for bacterial aggregation and ultimate biofilm formation.
Author response image 1
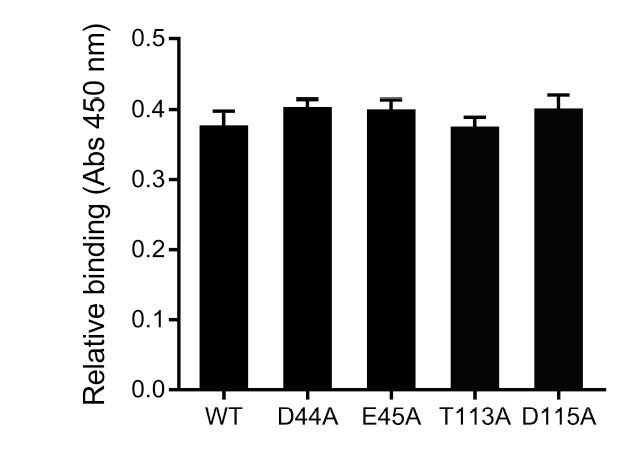
Preliminary characterization of the putative host binding site in SafD.
Author response image 2
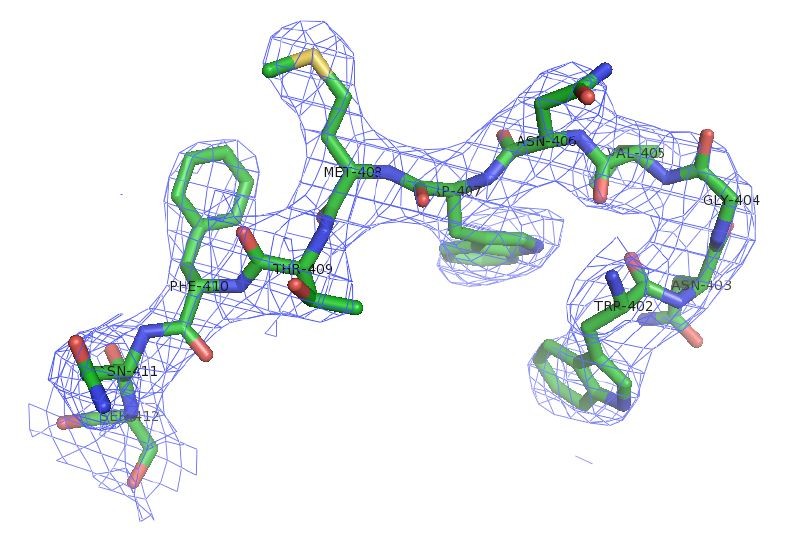
Electron density of SafDAA-dsc.
Author response image 3
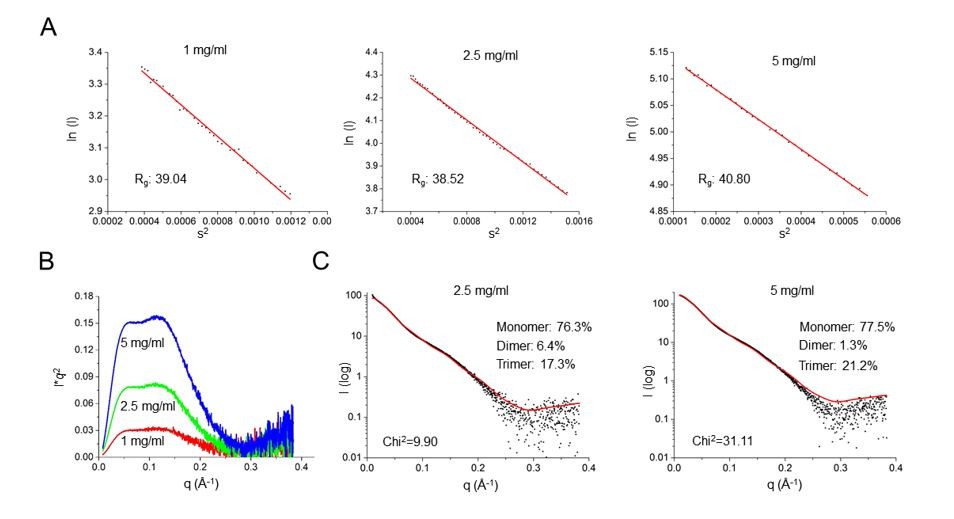
SAXS characterization of SafDAA-dsc at concentrations of 1, 2.5 and 5 mg/ml.
(A) The Guinier analysis. (B) The Kraky analysis. (C) The fitting between the SAXS experimental data and crystallographic structures of SafDAA-dsc monomer/dimer/trimer. The fitting result of SafDAA-dsc (1 mg/ml) was shown in the revised Figure 5E, F.
Tables
Table 1
Data collection and structure refinement statistics of SafD-dsc and SafDAA-dsc.
https://doi.org/10.7554/eLife.28619.006| Data collection | ||
|---|---|---|
| Protein | SafD-dsc | SafDAA-dsc |
| Space group | P2i2i2i | C2 |
| Unit cell dimension (A) | ||
| a | 32.5 | 133.3 |
| b | 49.7 | 66.1 |
| c | 148.8 | 187.7 |
| β (°) | 96.2 | |
| Molecule per ASU | 2 | 3 |
| Derivative | NativeNative | |
| Source/Station* | BL17U | BL17U |
| Wavelength (Å) | 0.979i | 0.9793 |
| Resolution range (Å) | 74.4 - 2.2 | 93.3 - 2.8 |
| Observations (1/s(1) > 0) | 48909 230250 | |
| Unique reflections (1/s(1) > 0) | 11971 (1640) | 38710 (5615) |
| High-resolution shell (Å) | 2.32 - 2.20 | 2.95 - 2.80 |
| Rsym (%)†,c: | 18.5 (67.9) | 14.0 (148.7) |
| <I/s(I)>‡: | 6.8 (2.2) | 8.1 (1.3) |
| Completeness‡ (%): | 92.9 (88.5) | 96.0 (96.1) |
| Redundancy‡: | 4.1 (4.3) | 5.9 (6.0) |
| CC1/2 | 0.98 (0.52) | 0.99 (0.44) |
| Structure refinement | ||
| Resolution range (Å) | 74.4 - 2.2 | 93.3 - 2.8 |
| R-factor (%) | 19.9 | 21.8 |
| R-factor (high resolution shell)§ | 25.7 | 36.3 |
| Rfree (%)# | 23.3 | 25.5 |
| Rfree (high-resolution shell) | 33.6 | 39.5 |
| Total number of non-hydrogen atoms | 2254 | 9593 |
| Protein atoms | 2129 | 9543 |
| Water molecules | 125 | 50 |
| R.m.s. deviations:¶ | ||
| Bond length (Å) | 0.003 | 0.006 |
| Bond angle (°) | 0.666 | 0.993 |
| Main chain B-factors (Å2) | 1.665 | 3.533 |
| Side chain B-factors (Å2) | 4.378 | 9.652 |
| Wilson B-factor (Å2) | 19.7 | 66.9 |
| Average B-factor protein atoms (Å2) | 26.2 | 93.2 |
| Ramachandran statistics (%) | ||
| Most favored region | 98.5 | 95.6 |
| Allowed regions | 1.1 | 4.1 |
| Outliers | 0.4 | 0.3 |
-
*Beamline designations refer to the Shanghai Synchrotron Radiation Facility, Shanghai, P. R. of China.
†Rsym=S(I-<I > )2/SI2.
-
‡overall, high resolution shell in parentheses.
§high resolution shell: 2.370–2.200 Å (SafD-dsc) and 2.870–2.800 Å (SafDAA-dsc).
-
#Rfree calculated using 5% of total reflections omitted from refinement.
¶R.m.s. deviations report root mean square deviations from ideal bond lengths/angles and of B-factors between bonded atoms (Engh and Huber, 1991).
Additional files
-
Transparent reporting form
- https://doi.org/10.7554/eLife.28619.024
Download links
A two-part list of links to download the article, or parts of the article, in various formats.
Downloads (link to download the article as PDF)
Open citations (links to open the citations from this article in various online reference manager services)
Cite this article (links to download the citations from this article in formats compatible with various reference manager tools)
Structural basis of host recognition and biofilm formation by Salmonella Saf pili
eLife 6:e28619.
https://doi.org/10.7554/eLife.28619


