Cooperative interactions enable singular olfactory receptor expression in mouse olfactory neurons
- Columbia University, United States
- New York Structural Biology Center, United States
- School of Medicine, University of California Irvine, United States
Figures
Figure 1 with 5 supplements

Greek Islands represent Lhx2 and Ebf co-bound regions residing in heterochromatic OR clusters.
(A) The top sequence motif identified for mOSN ChIP-seq peaks is shown above sequence motifs generated from previously reported Lhx2 (Folgueras et al., 2013) and Ebf (Lin et al., 2010) ChIP-seq data sets. mOSN ChIP-seq peaks were identified using HOMER and motif analysis was run on peaks present in both biological replicates. (B) Overlap between mOSN Lhx2 and Ebf bound sites genome-wide. See Figure 1—figure supplement 2 for analysis of ChIP-seq signal on Ebf and Lhx2 Co-bound sites within OR clusters. (C) Overlap between mOSN Lhx2 and Ebf bound sites within OR clusters. For each factor, co-bound sites are significantly more frequent within OR clusters than in the rest of the genome (p=5.702e−9 for Lhx2, p=1.6e−15 for Ebf, Binomial test). See Figure 1—figure supplement 2 for gene ontology analysis of peaks bound by Lhx2 and Ebf. (D) mOSN ATAC-seq and ChIP-seq signal tracks for three representative OR gene clusters. Values are reads per 10 million. Below the signal tracks, OR genes are depicted in red and non-OR genes are depicted in blue. Greek Island locations are marked. Anafi is a newly identified Greek Island, located in a small OR cluster upstream of the Sfaktiria cluster. See also Figure 1—figure supplement 3 and Supplementary file 1. For ATAC-seq, pooled data is shown from 4 biological replicates, for ChIP-seq, pooled data is shown from 2 biological replicates. For H3K9me3 ChIP-seq, input control signal is subtracted from ChIP signal prior to plotting. (E) mOSN ATAC-seq or ChIP-seq signal across 63 Greek Islands. Each row of the heatmap shows an 8 kb region centered on a Greek Island. Regions of high signal are shaded red. Mean signal across all elements is plotted above the heatmap, values are reads per 10 million. All heatmaps are sorted in the same order, based upon ATAC-seq signal. See also Figure 1—figure supplement 3 and Supplementary file 1. For ATAC-seq, pooled data is shown from 4 biological replicates, for ChIP-seq, pooled data is shown from 2 biological replicates. See Figure 1—figure supplement 4 for a comparison of newly and previously identified Greek Islands, and Figure 1—figure supplement 5 for RNA-seq analysis of ORs with Greek Islands near the TSS. (F) mOSN ATAC-seq and ChIP-seq signal tracks on OR genes. Each row of the heatmap shows an OR gene scaled to 4 kb as well as the 2 kb regions upstream and downstream. Plots and heatmap are scaled the same as in Figure 1E.
-
Figure 1—source code 1
R code for analysis of ChIP-seq data from mOSNs.r.
- https://doi.org/10.7554/eLife.28620.008
-
Figure 1—source code 2
R code for analysis of RNA-seq data from mOSNs.r.
- https://doi.org/10.7554/eLife.28620.009
-
Figure 1—source data 1
Lhx2 ChIP-seq signal by peak type.txt.
- https://doi.org/10.7554/eLife.28620.010
-
Figure 1—source data 2
Ebf ChIP-seq signal by peak type.txt.
- https://doi.org/10.7554/eLife.28620.011
-
Figure 1—source data 3
Transcript level of ORs grouped by presence of Greek Island in Promoter.txt.
- https://doi.org/10.7554/eLife.28620.012
Figure 1—figure supplement 1
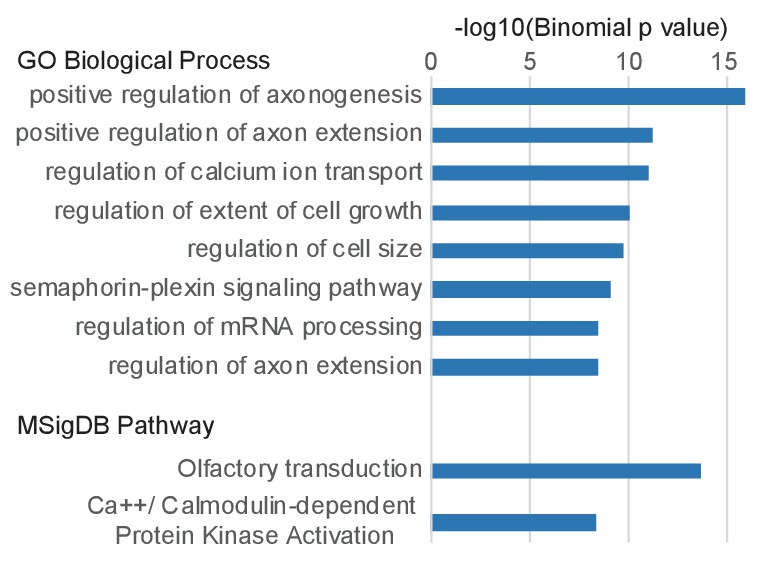
Gene Ontology terms associated with Ebf and Lhx2 co-bound sites.
Top Gene Ontology terms from the Biological Process and MSigDB Pathway categories associated with genes proximal to sites bound by both Ebf and Lhx2.
Figure 1—figure supplement 2

Co-binding of Ebf and Lhx2 within OR clusters.
(A) mOSN Lhx2 and Ebf ChIP-seq signal on OR Cluster Ebf +Lhx2 peaks (Greek Islands) compared to OR-cluster singly bound (Ebf or Lhx2) sites. Mean signal for each group is plotted above the heatmap, values are reads per 10 million. Both heatmaps are sorted in the same order, based upon ATAC-seq signal. Pooled data is shown from 2 biological replicates. (B) Density plot of the distribution of peaks over Lhx2 ChIP-seq peak strength (normalized number of reads in each peak) for different categories of peaks. ChIP signal is calculated by averaging normalized peak counts from two biological replicates. (C) Density plot of the distribution of peaks over Ebf ChIP-seq peak strength (normalized number of reads in each peak) for different categories of peaks. OR-cluster Ebf-only peaks are not included because there are only two peaks in this category. ChIP signal is calculated by averaging normalized peak counts from two biological replicates.
Figure 1—figure supplement 3
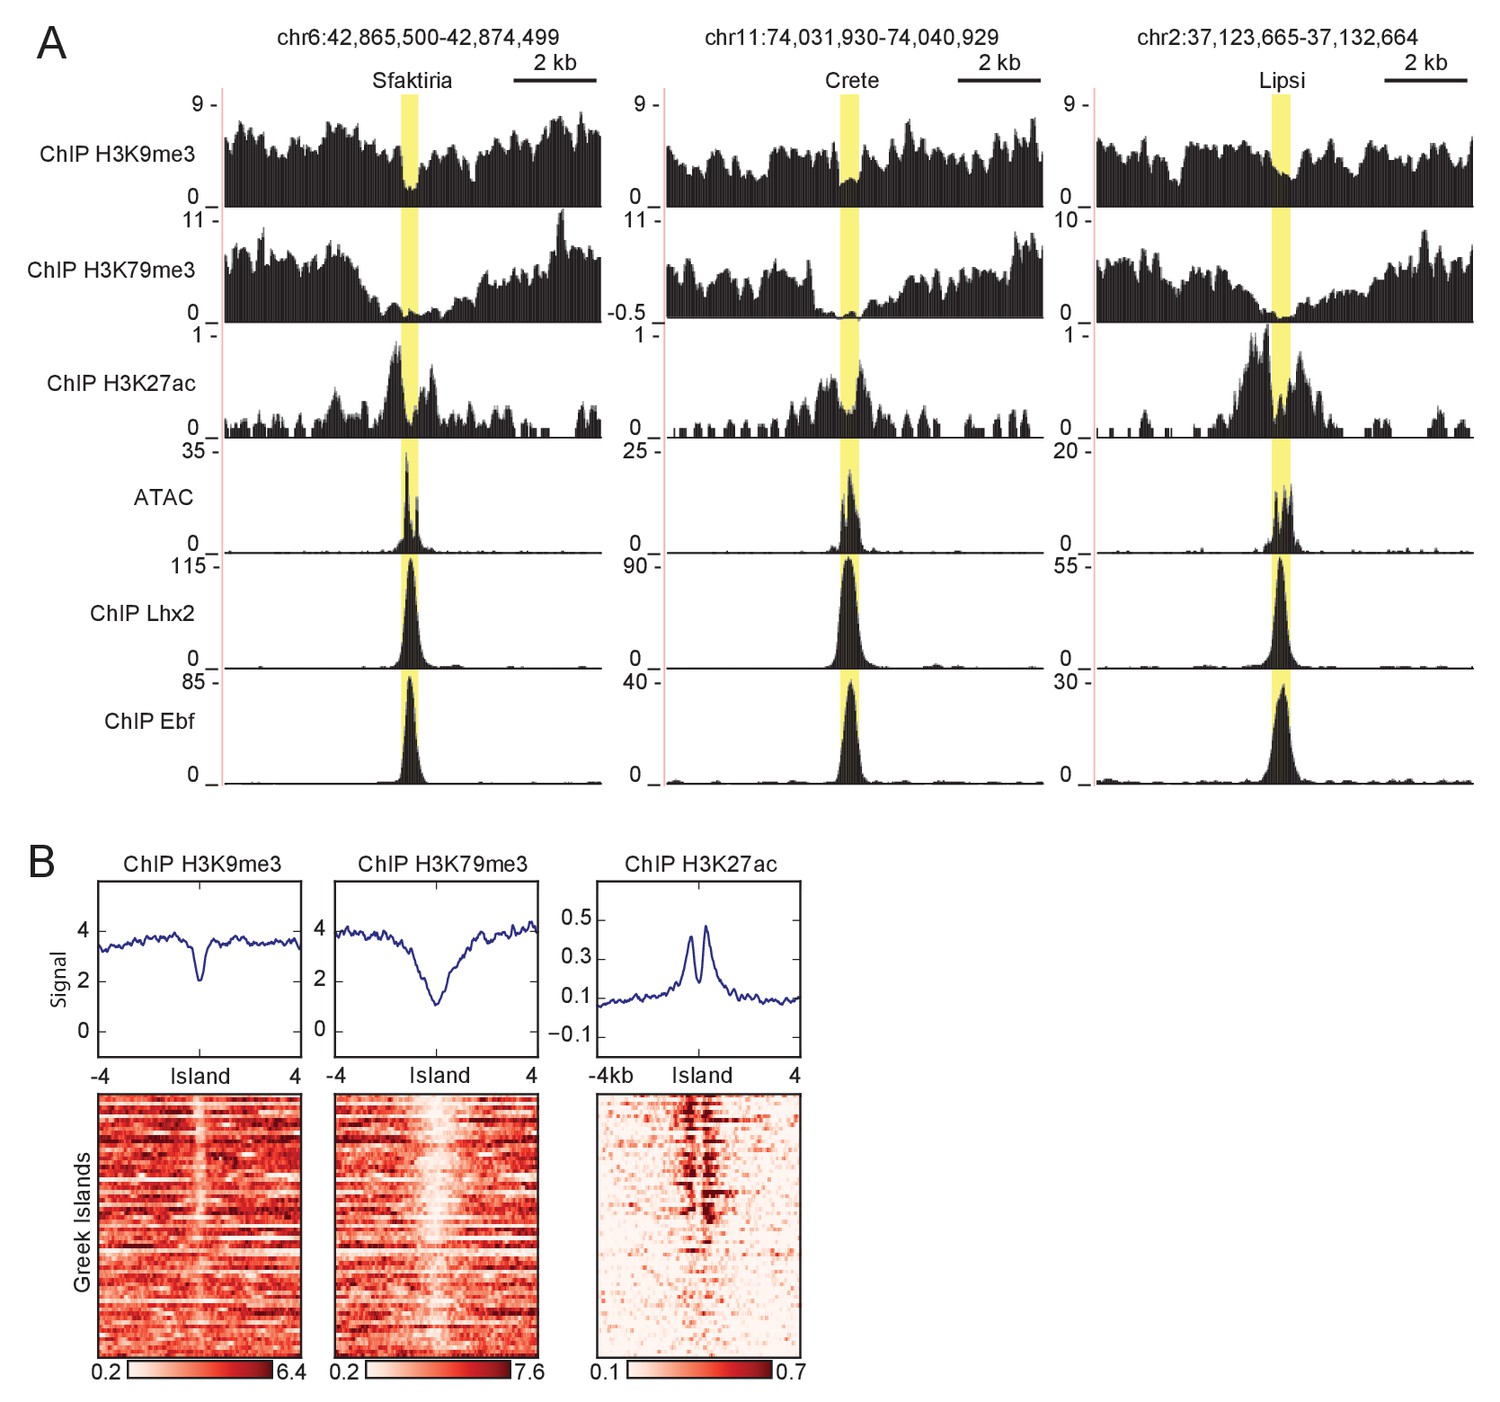
Histone modifications proximal to Greek Islands.
(A) ATAC-seq and ChIP-seq signal tracks for three Greek Islands, Sfaktiria, Crete and Lipsi. Greek Island position is highlighted in yellow. For heterochromatin modifications (H3K9me3 and H3K79me3), input control signal is subtracted from ChIP signal. Pooled data is shown from 4 biological replicates for ATAC-seq, 2 biological replicates for Lhx2, Ebf, H3K9me3, and H3K27ac, and one replicate for HeK79me3. (B) ChIP-seq signal for histone modifications associated with heterochromatin and active enhancers in the vicinity of Greek Islands. Pooled data is shown from 2 biological replicates for H3K9me3 and H3K27ac, and one replicate for HeK79me3.
Figure 1—figure supplement 4

Comparison of new and previously identified Greek Islands.
Mean ATAC-seq or ChIP-seq signal for previously identified Greek Islands (Markenscoff-Papadimitriou et al., 2014) (blue shaded) that are bound by Ebf and Lhx2 compared to newly identified Ebf and Lhx2 bound islands (green shaded). Pooled data is shown from 4 biological replicates for ATAC-seq, 2 biological replicates for Lhx2, Ebf, H3K9me3, and H3K27ac, and one replicate for HeK79me3.
Figure 1—figure supplement 5
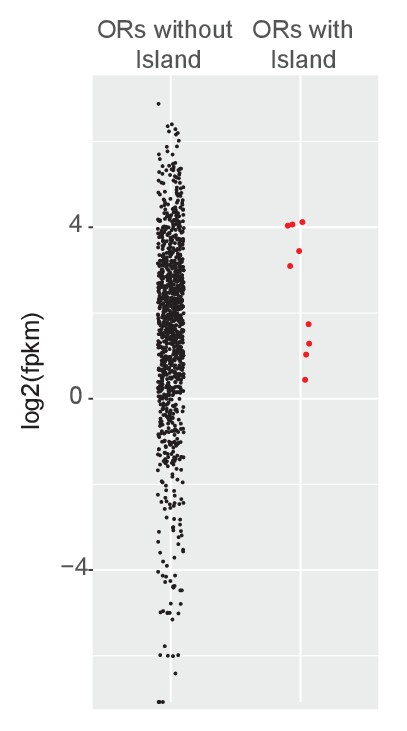
Greek Islands represent Lhx2 and Ebf co-bound regions residing in heterochromatic OR clusters.
Level of expression (FPKM) for OR genes in mOSNs determined by RNA-seq. ORs with a Greek Island within 500 bp of the annotated TSS are plotted separately and in red. FPKM is the mean of three biological replicates.
Figure 2 with 2 supplements
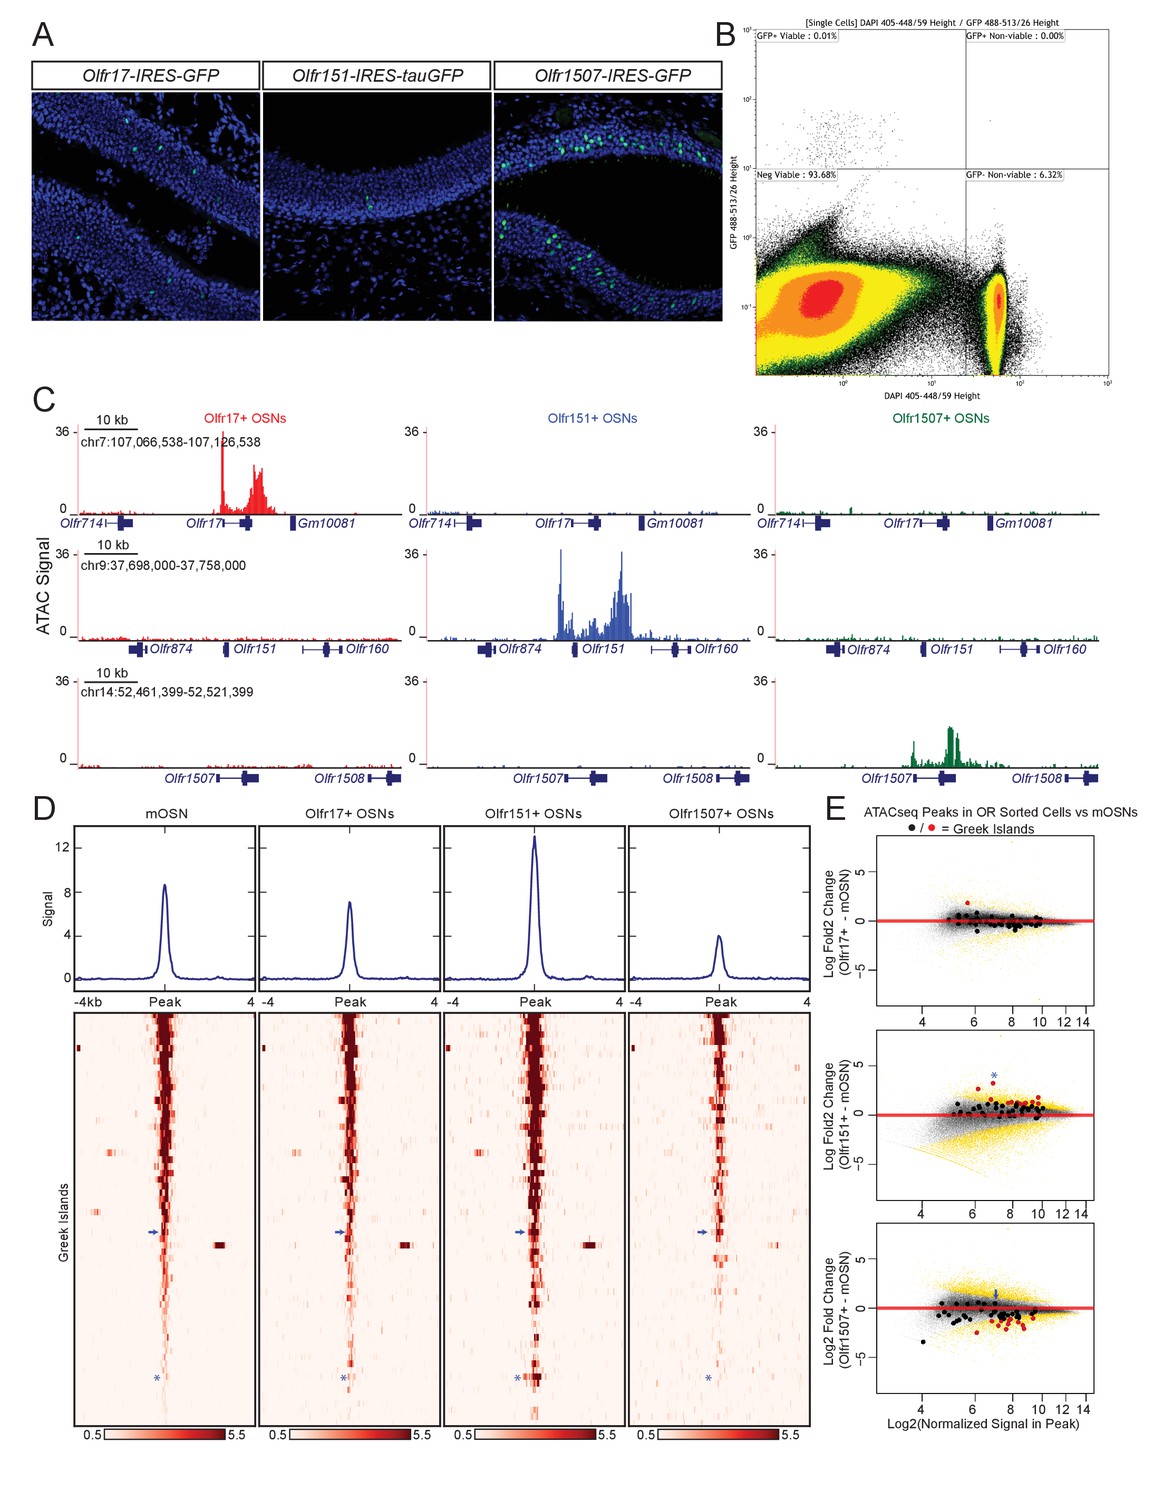
Greek island accessibility is independent of OR promoter choice.
(A) GFP fluorescence (green) in MOE tissue sections from adult mice bearing Olfr17-IRES-GFP, Olfr151-IRES-tauGFP, or Olfr1507-IRES-GFP alleles. Nuclei are stained with DAPI (blue). (B) Representative FACS data for Olfr-IRES-GFP mice. Data is shown from Olfr151-IRES-GFP mice. Viable (DAPI negative), GFP+ cells were collected for ATAC-seq. (C) ATAC-seq signal tracks from GFP+ cells sorted from Olfr17-IRES-GFP (red), Olfr151-IRES-GFP (blue), or Olfr1507-IRES-GFP (green) mice. Values are reads per 10 million. The region spanning each targeted OR is shown for all three lines. See also Figure 2—figure supplement 1. Pooled data is shown for 2 biological replicates. (D) ATAC-seq signal over Greek Islands is shown for mOSNs and each Olfr-IRES-GFP line. All samples are sorted by signal in mOSNs. A blue arrow marks the H Enhancer, which is the Greek Island proximal to Olfr1507. A blue asterisk marks Kimolos, the Greek Island proximal to Olfr151, which has the strongest change in signal relative to mOSNs. See also Figure 2—figure supplement 2. Pooled data is shown for 4 biological replicates for mOSNs, and 2 biological replicates for each Olfr-IRES-GFP sorted population. (E) MA-plots showing fold change in ATAC-seq signal for each sorted Olfr-IRES-GFP population compared to mOSNs. Peak strength (normalized reads in peak) and fold change are shown for all ATAC-seq peaks; peaks that are not significantly changed are black and peaks that are significantly changed (FDR < 0.001) are gold. Greek Islands are plotted as larger dots and are shown in red if significantly changed. Kimolos is marked with an asterisk in Olfr151 expressing cells, and H is marked with an arrow in Olfr1507 expressing cells. See also Figure 2—figure supplement 2.
-
Figure 2—source code 1
R code for analysis of ATAC-seq data from OR-IRES-GFP.r.
- https://doi.org/10.7554/eLife.28620.016
-
Figure 2—source data 1
ATAC-seq MA plot of mOSN versus Olfr17-ires-GFP.txt.
- https://doi.org/10.7554/eLife.28620.017
-
Figure 2—source data 2
ATAC-seq MA plot of mOSN versus Olfr151-ires-tauGFP.txt.
- https://doi.org/10.7554/eLife.28620.018
-
Figure 2—source data 3
ATAC-seq MA plot of mOSN versus Olfr1507-ires-GFP.txt.
- https://doi.org/10.7554/eLife.28620.019
Figure 2—figure supplement 1
High Accessibility near the OR transcription end site.
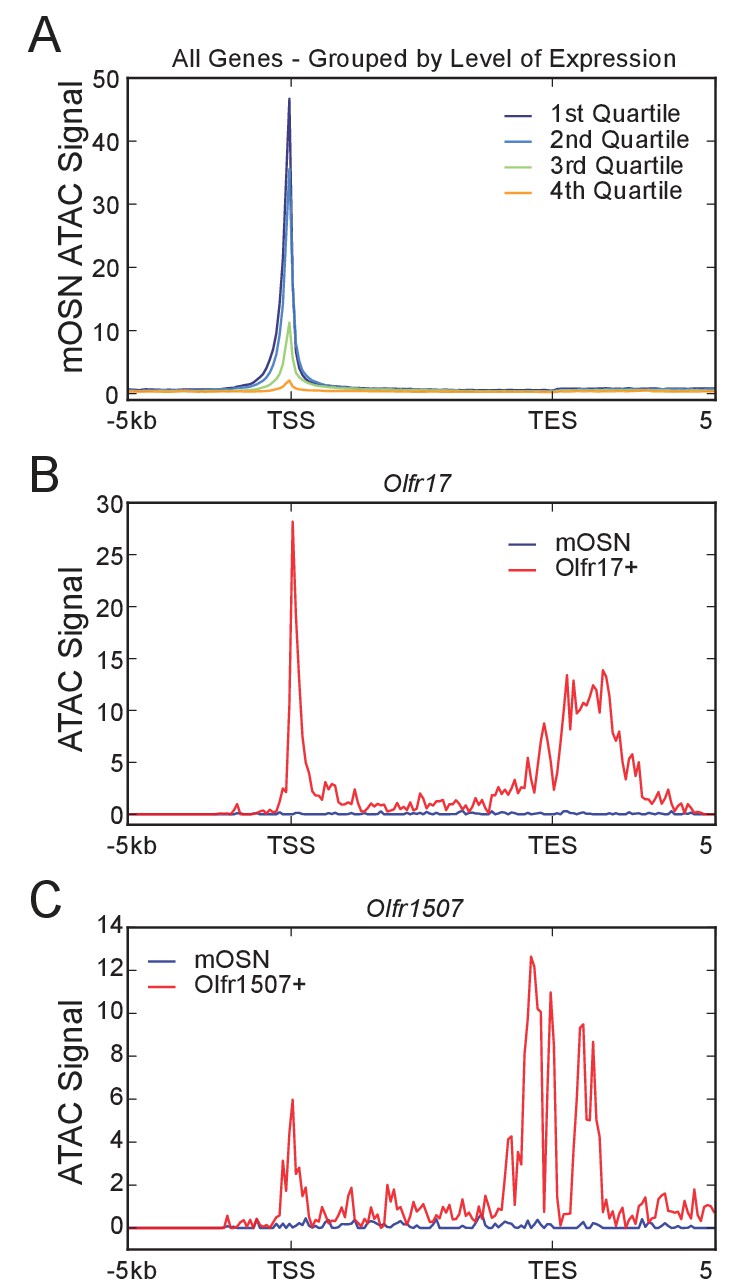
Signal plots are from pooled data from 4 biological replicates for mOSNs and 2 replicates each for Olfr17-IRES-GFP+, and Olfr1507-IRES-GFP+cells. (A) Profile of mean mOSN ATAC-seq signal over all genes. Genes are grouped into quartiles by level of expression in mOSNs. (B) Profile of ATAC-seq signal over Olfr17 in all mOSNs and Olfr17-IRES-GFP expressing OSNs. (C) Profile of ATAC-seq signal over Olfr1507 in all mOSNs and Olfr1507-IRES-GFP expressing OSNs.
Figure 2—figure supplement 2
Greek island accessibility is independent of OR promoter choice.
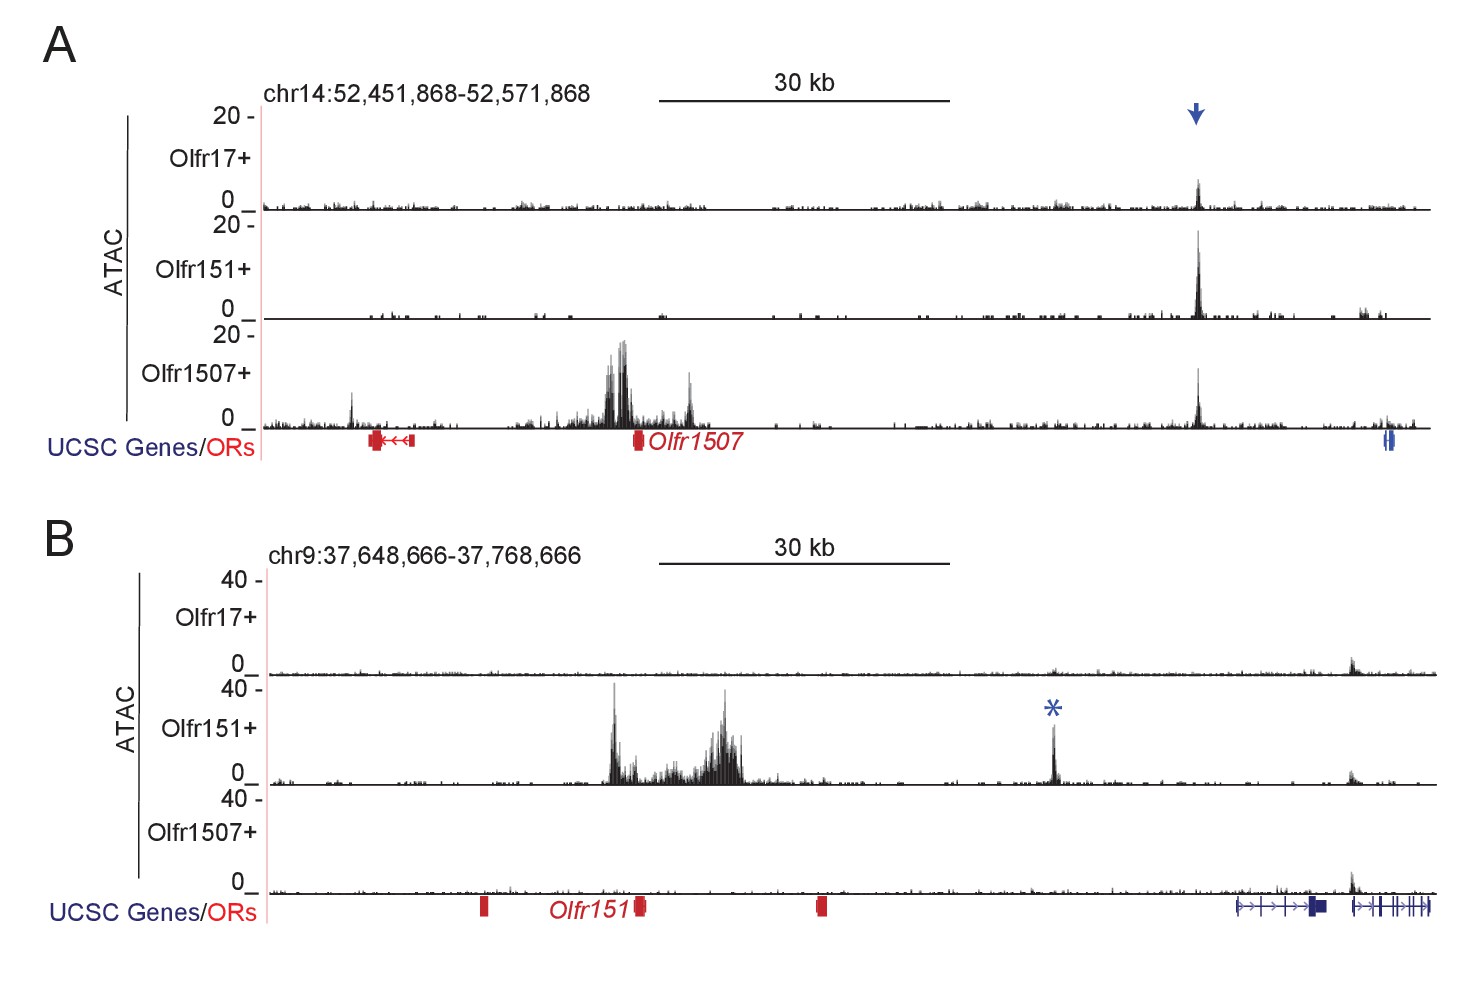
Signal plots are from 2 replicates each for Olfr17-IRES-GFP+, Olfr151-IRES-GFP+, and Olfr1507-IRES-GFP+cells. (A) ATAC-seq signal in the vicinity of Olfr1507 for each Olfr-IRES-GFP population. A blue arrow marks the location of H. (B) ATAC-seq signal in the vicinity of Olfr151 for each Olfr-IRES-GFP population. A blue asterisk marks Kimolos, the Greek Island with greatly increased signal in Olfr151-IRES-GFP expressing cells relative to mOSNs.
Figure 3 with 1 supplement

Greek Islands have stereotypically proximal Lhx2 and Ebf motifs.
(A) Sequence logo of the Greek Island composite motif (center). The mOSN ChIP-seq derived Lhx2 and Ebf motifs logos are positioned above and below the corresponding regions of the composite motif. (B) Cumulative distribution plot of the score of the best composite motif site found in each of the 63 Greek Islands. Also plotted are cumulative distributions for co-bound sites outside of OR clusters and OR gene promoters. A score of 10 was selected as a stringent threshold for motif identification, and a score of 5 was selected for permissive motif identification. This motif is significantly enriched in Greek Islands relative to co-bound sites outside of OR clusters at both of these score cut-offs (Binomial test). See also Supplementary file 2. (C) Plot of the density of ATAC-seq fragment ends in the vicinity of Greek Island composite motifs sites scoring over 10. Plot shows mean signal and standard error in 5 bp windows centered on 43 composite motif sites (yellow). (D) Multiple alignment of composite motif sequences from Greek Islands together with 20 bp of flanking sequence. Each base is shaded by nucleotide identity: A = green, C = blue, G = yellow, T = red. Top panel depicts composite with score over 10 and bottom panel depicts composites with score between 5 and 10, together with a sequence logo of the motif present in those sequences. See Figure 3—figure supplement 1 for sequences of strong and weak Greek Island composite motifs. (E) As in (D), except purines are shaded red and pyrimidines are shaded blue. (F) For each site, the distance (in base pairs) between the closest Ebf-Lhx2 motif pair was determined. For each set of sites, the distribution of distances is shown as a boxplot. Sets of sites comprising Greek Islands with a strong composite motif, Greek Islands without a strong composite motif, Ebf and Lhx2 co-bound sites genome-wide, and OR gene promoters are compared. Sites without an Ebf motif are excluded. The distribution of distances between Ebf and Lhx2 motifs was significantly smaller for Greek Islands without a composite motif than for Ebf and Lhx2 bound sites genome-wide (two-sample, one-sided Kolmogorov–Smirnov test) See also Supplementary file 2. n = 25 for Greek Islands with Composite Score greater than 10; n = 21 for Greek Islands with Composite Score less than 10; n = 3805 for Co-bound sites genome wide; n = 521 for OR promoters.
-
Figure 3—source code 1
R code for Motif Analysis.r.
- https://doi.org/10.7554/eLife.28620.022
-
Figure 3—source data 1
Composite Motif Score Cumulative Distribution.txt.
- https://doi.org/10.7554/eLife.28620.023
-
Figure 3—source data 2
Motif Proximity.txt.
- https://doi.org/10.7554/eLife.28620.024
Figure 3—figure supplement 1
Greek Islands have stereotypically proximal Lhx2 and Ebf motifs.
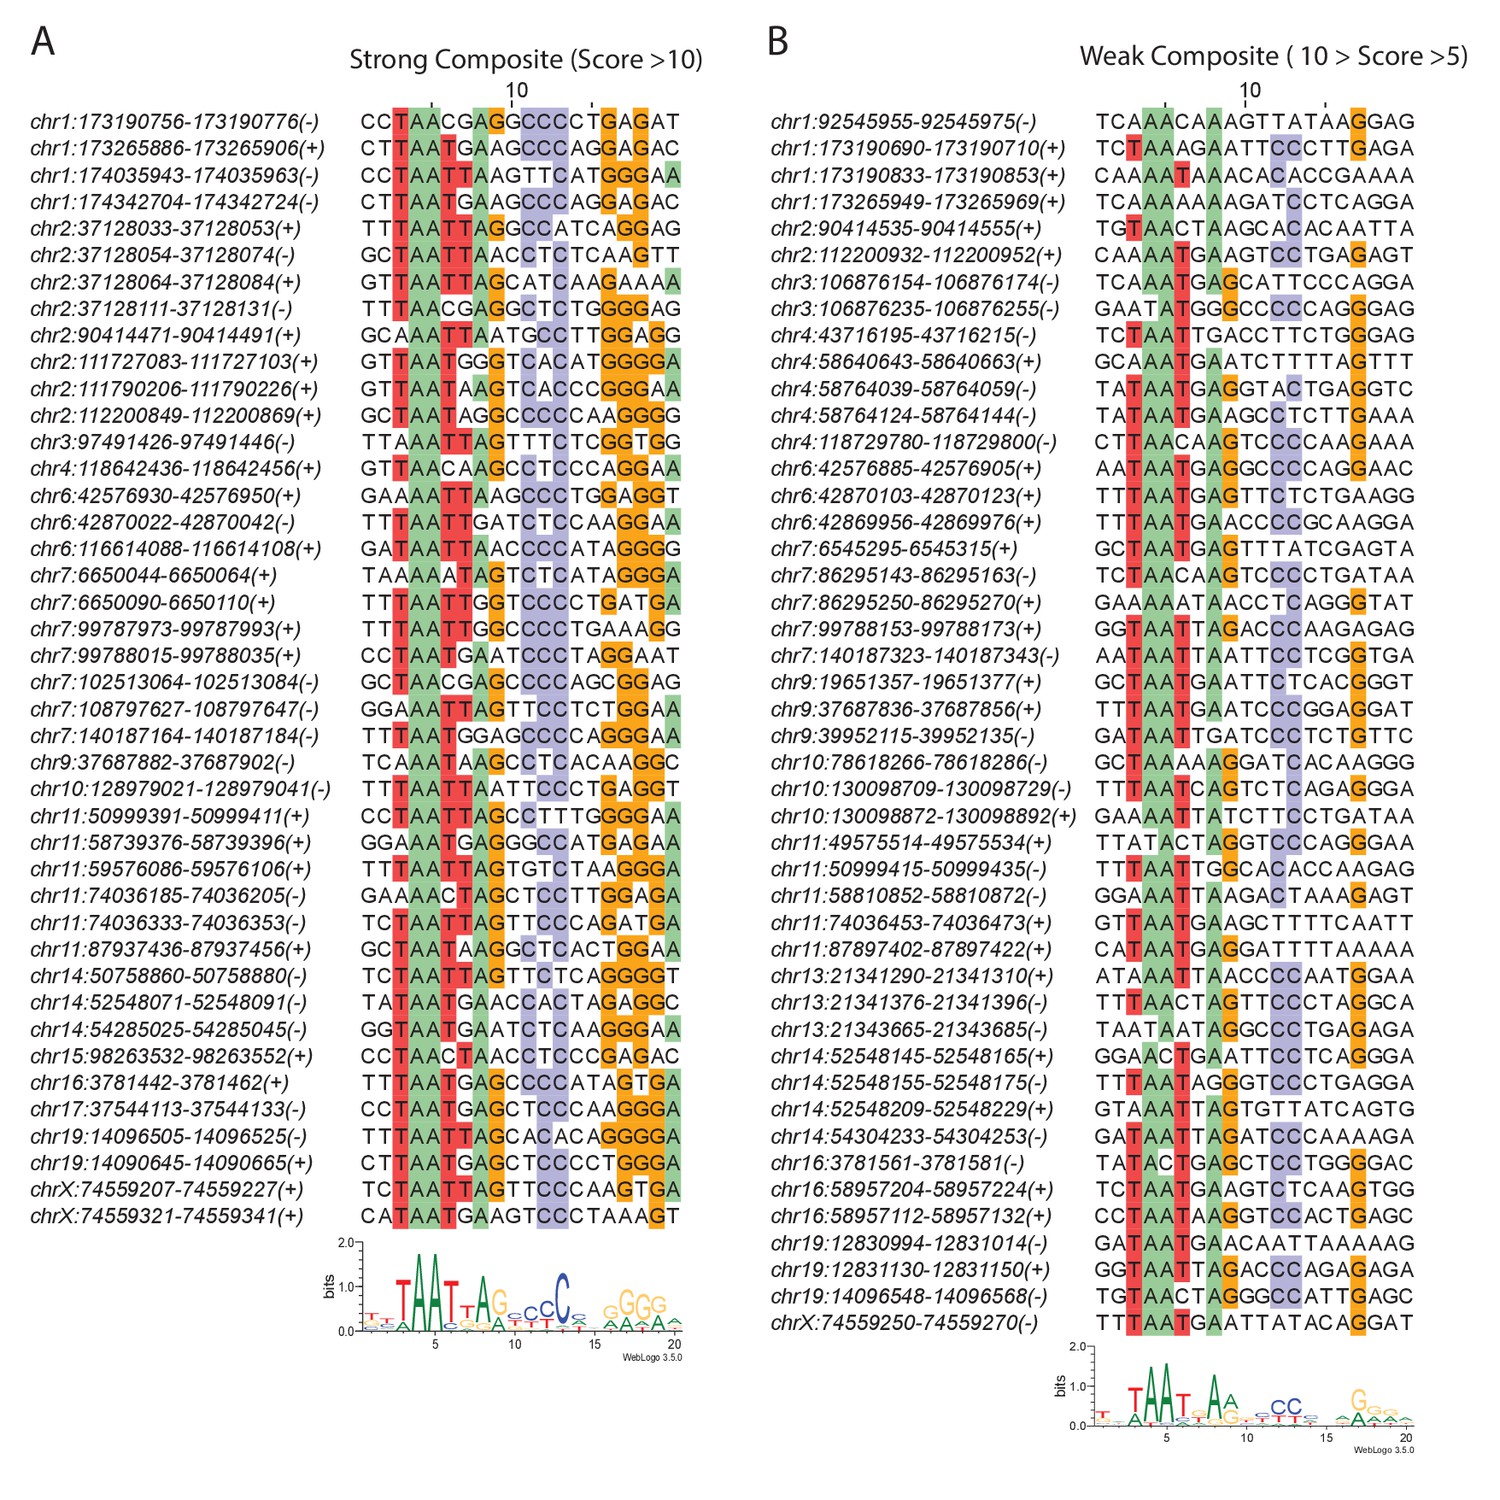
(A) Multiple alignment of composite motif sequences found in Greek Islands using a stringent cutoff (motif score >10). Positions with at least 50% identity are shaded by nucleotide. A motif logo of the included sequences is shown below the alignment. (B) Multiple alignment of weak composite motif sequences found in Greek Islands using a loose cutoff (10 > motif score > 5). Positions with at least 50% identity are shaded by nucleotide. A motif logo of the included sequences is shown below the alignment.
Figure 4 with 3 supplements
Lhx2 is required for Ebf binding predominantly on Greek Islands.
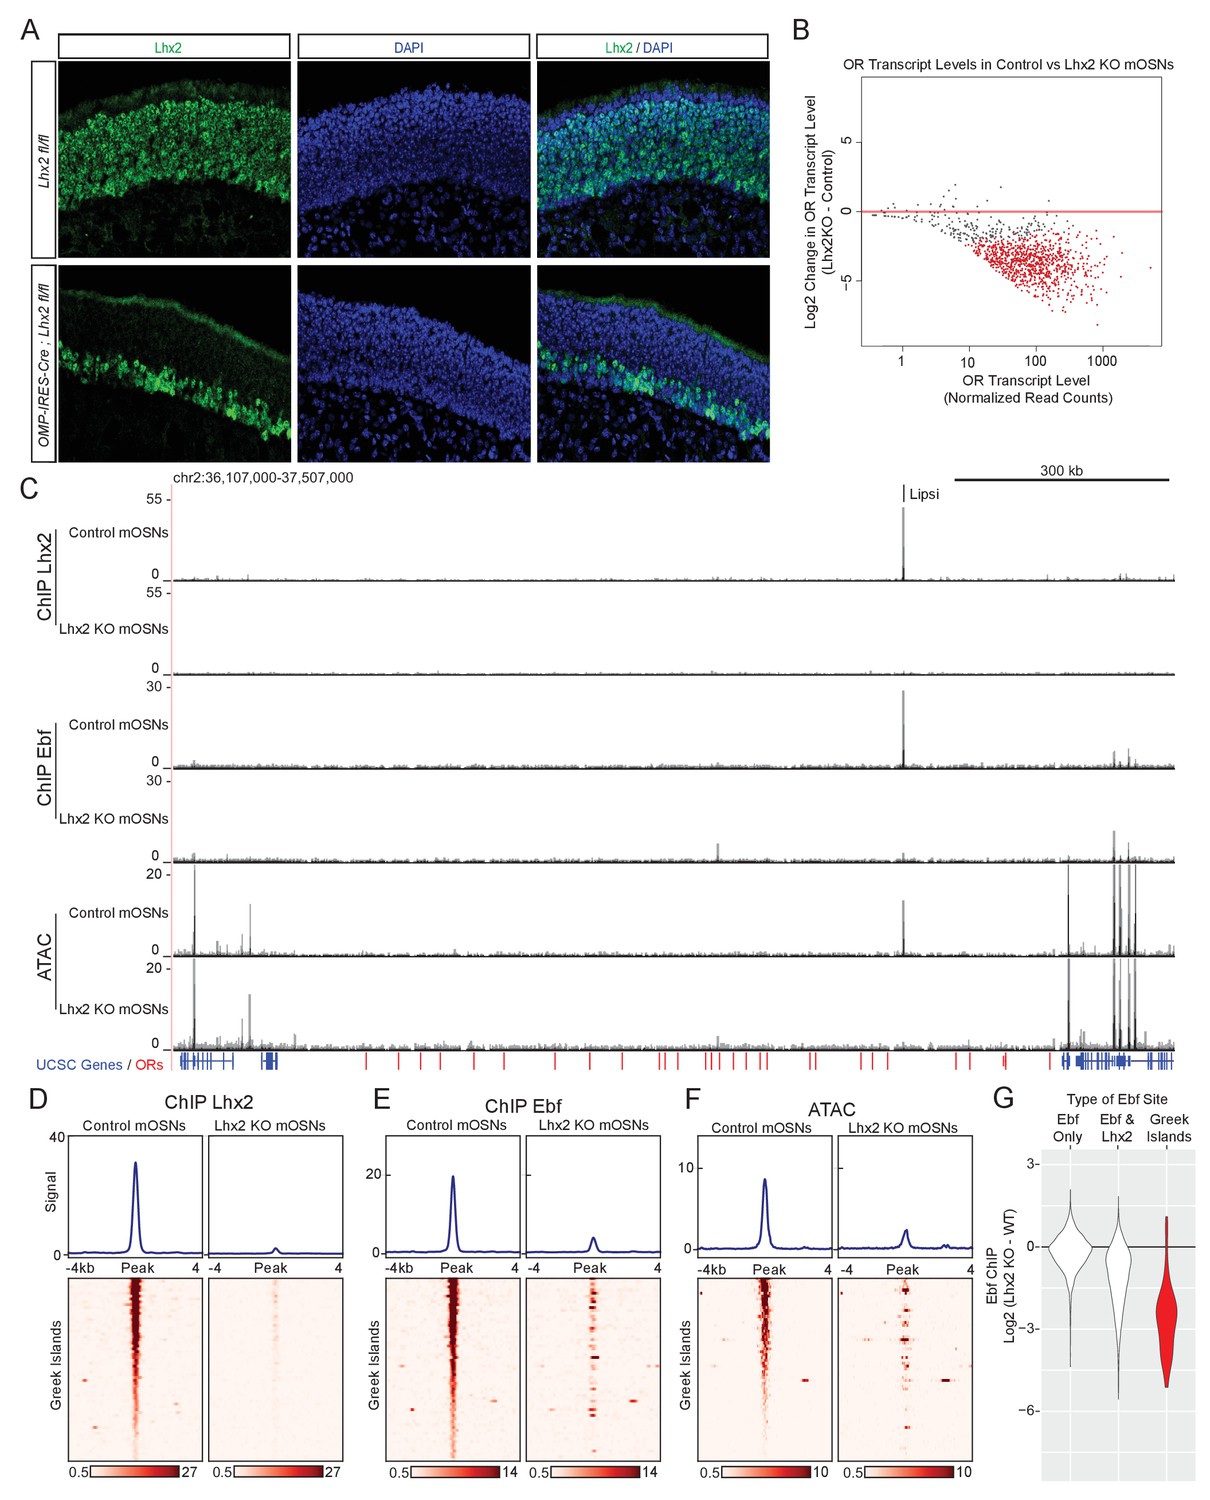
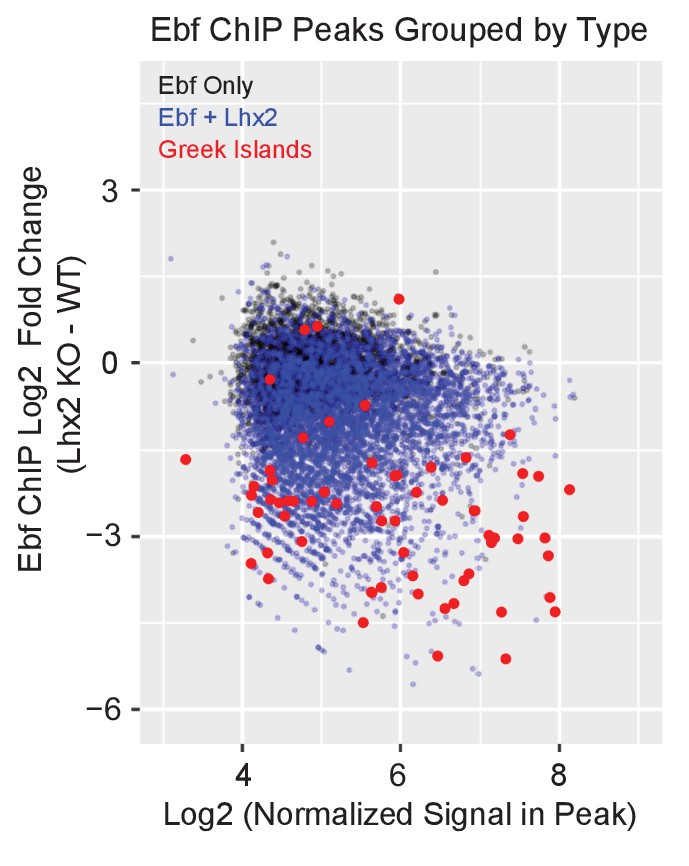
(A) Lhx2 immunofluorescence (IF) (green) in MOE sections from 3 week old control (Lhx2 fl/fl) and Lhx2 KO (Omp-IRES-Cre; Lhx2fl/fl) mice. Nuclei are stained with DAPI (blue). The Lhx2 immunoreactive cells on the basal layers of the MOE represent immature OSNs and progenitors that have not yet turned on OMP (and thus Cre) expression. See also Figure 4—figure supplement 1 for demonstration of the Cre induced deletion at the mRNA level. (B) MA-plot of OR transcript levels in FAC-sorted Lhx2 KO mOSNs (Omp-IRES-Cre; Lhx2fl/fl; tdTomato) compared to FAC-sorted control mOSNs (Omp-IRES-GFP). Red dots correspond to OR genes with statistically significant transcriptional changes (adjusted p-value<0.05). Three biological replicates were included for control mOSNs and 2 biological replicates were included for Lhx2 KO mOSNs. (C) ChIP-seq and ATAC-seq signal tracks from FAC-sorted control mOSNs (Omp-IRES-GFP) and Lhx2 KO mOSNs (Omp-IRES-Cre; Lhx2fl/fl; tdTomato) for the OR cluster containing the Greek Island Lipsi. Values are reads per 10 million. For ATAC-seq, pooled data from 4 biological replicates for control mOSNs are compared to data from 2 biological replicates for Lhx2 KO mOSNs. For ChIP, pooled data is shown from 2 biological replicates. (D–F) Heatmaps depicting Lhx2 and Ebf ChIP-seq and ATAC-seq signal across Greek Islands for FAC-sorted control and Lhx2 KO mOSNs for the samples described in C. (G) Log2 fold change in normalized Ebf ChIP-seq signal in Lhx2 KO mOSNs relative to control mOSNs for Greek Islands (red), compared to sites genome-wide that are bound by Ebf-only or both Ebf and Lhx2 in wild-type mOSNs. Fold change was calculated using data from 2 biological replicates each of control mOSNs and Lhx2 KO mOSNs.. See also Figure 4—figure supplement 2 for MA-plot showing data for all peaks in each set and Figure 4—figure supplement 3 for RNA-seq analysis of the effect of Lhx2 KO on ORs with and without a promoter Lhx2 motif.
-
Figure 4—source code 1
R Code for analysis of ChIP-seq data from Lhx2KO mOSNs.r.
- https://doi.org/10.7554/eLife.28620.029
-
Figure 4—source code 2
R code for analysis of RNA-seq data from Lhx2KO mOSNs.r.
- https://doi.org/10.7554/eLife.28620.030
-
Figure 4—source data 1
RNA-seq MA plot of Olfr Expression in mOSNs versus Lhx2KO.txt.
- https://doi.org/10.7554/eLife.28620.031
-
Figure 4—source data 2
Effect of Lhx2KO on Ebf ChIPSeq signal.txt.
- https://doi.org/10.7554/eLife.28620.032
-
Figure 4—source data 3
MA-plot of Ebf ChIP-seq in control mOSNs versus Lhx2KO mOSNs.txt.
- https://doi.org/10.7554/eLife.28620.033
-
Figure 4—source data 4
Change in OR expression in Lhx2KO mOSNs versus promoter motifs.txt.
- https://doi.org/10.7554/eLife.28620.034
Figure 4—figure supplement 1
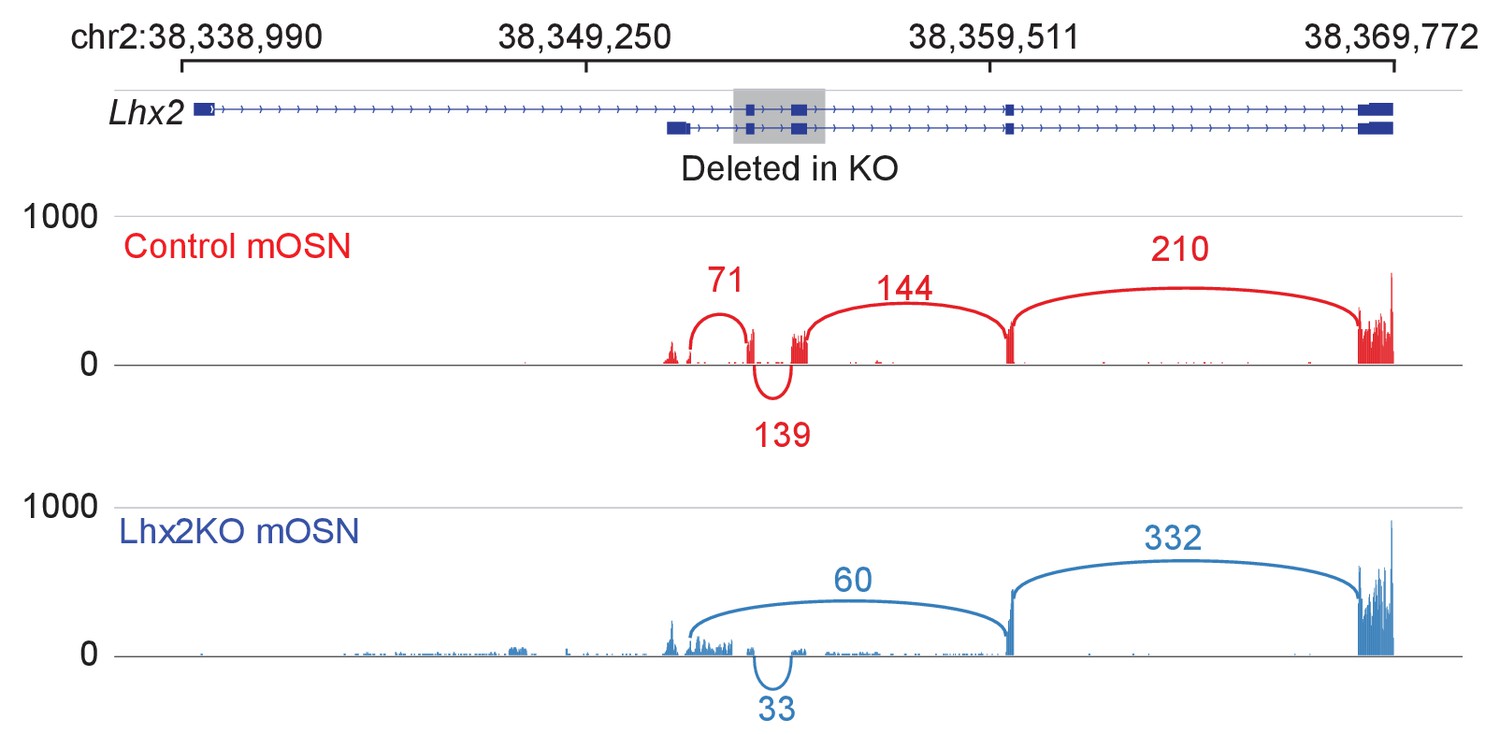
Effect of Lhx2 deletion on Lhx2 expression and splicing.
Sashimi plot (Katz et al., 2010) of Lhx2 RNA-seq signal and splicing junctions in control and Lhx2 KO mOSNs. A schematic of Lhx2 and the region affected by the conditional knockout is shown at the top. Representative data is shown for one replicate from each condition.
Figure 4—figure supplement 2
Lhx2 is required for Ebf binding predominantly on Greek Islands.
MA-plots showing fold change in Ebf ChIP-seq signal for Lhx2 KO mOSNs compared to control mOSNs. Peak strength (normalized reads in peak) and fold change are shown for all mOSN Ebf ChIP-seq peaks. Peaks are color coded by type; peaks that do not overlap a control mOSN Lhx2 peak are black, peaks that overlap an Lhx2 peak are blue, and Greek Islands are red. Fold change was calculated using data from 2 biological replicates each of control mOSNs and Lhx2 KO mOSNs.
Figure 4—figure supplement 3
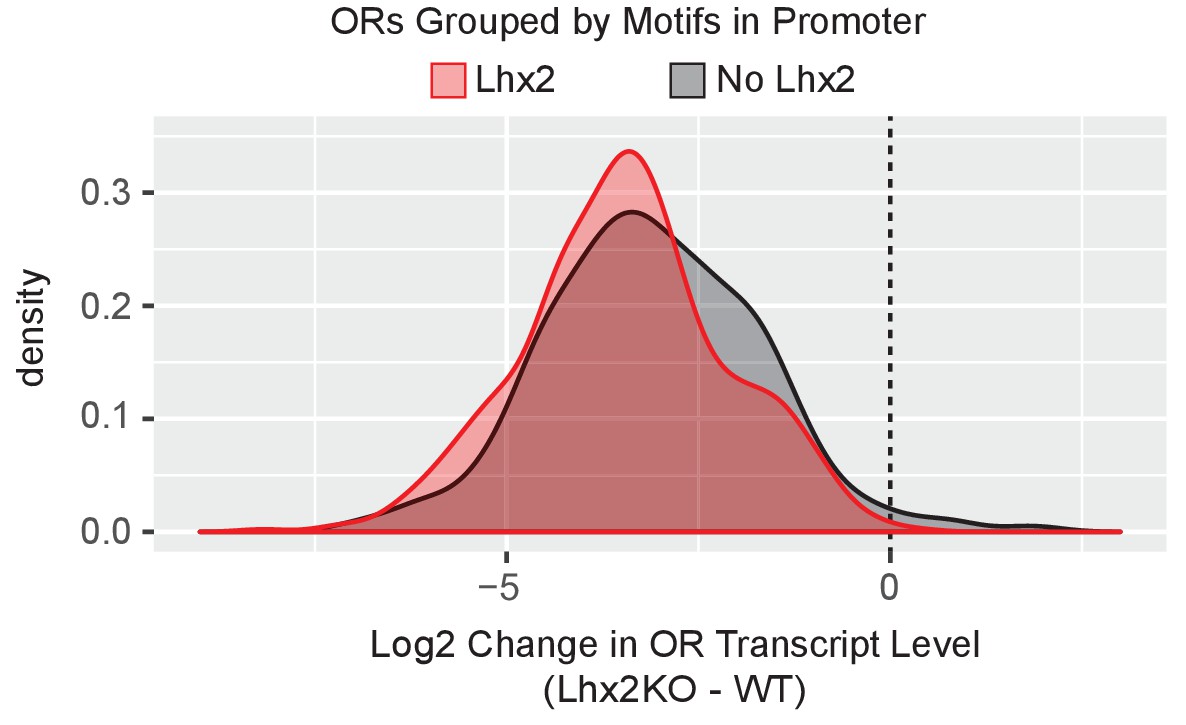
Lhx2 deletion downregulates ORs that do not have Lhx2 promoter motfis.
Density plot of Log2 fold change in OR transcript levels in Lhx2 KO mOSNs compared to control mOSNs, with ORs grouped based upon the motifs present in the promoter region (−500 bp to the TSS). ORs with a very low level of expression (OR transcript level <5 in Figure 4B) are not included. Three biological replicates were included for control mOSNs and 2 biological replicates were included for Lhx2 KO mOSNs.
Figure 5 with 3 supplements
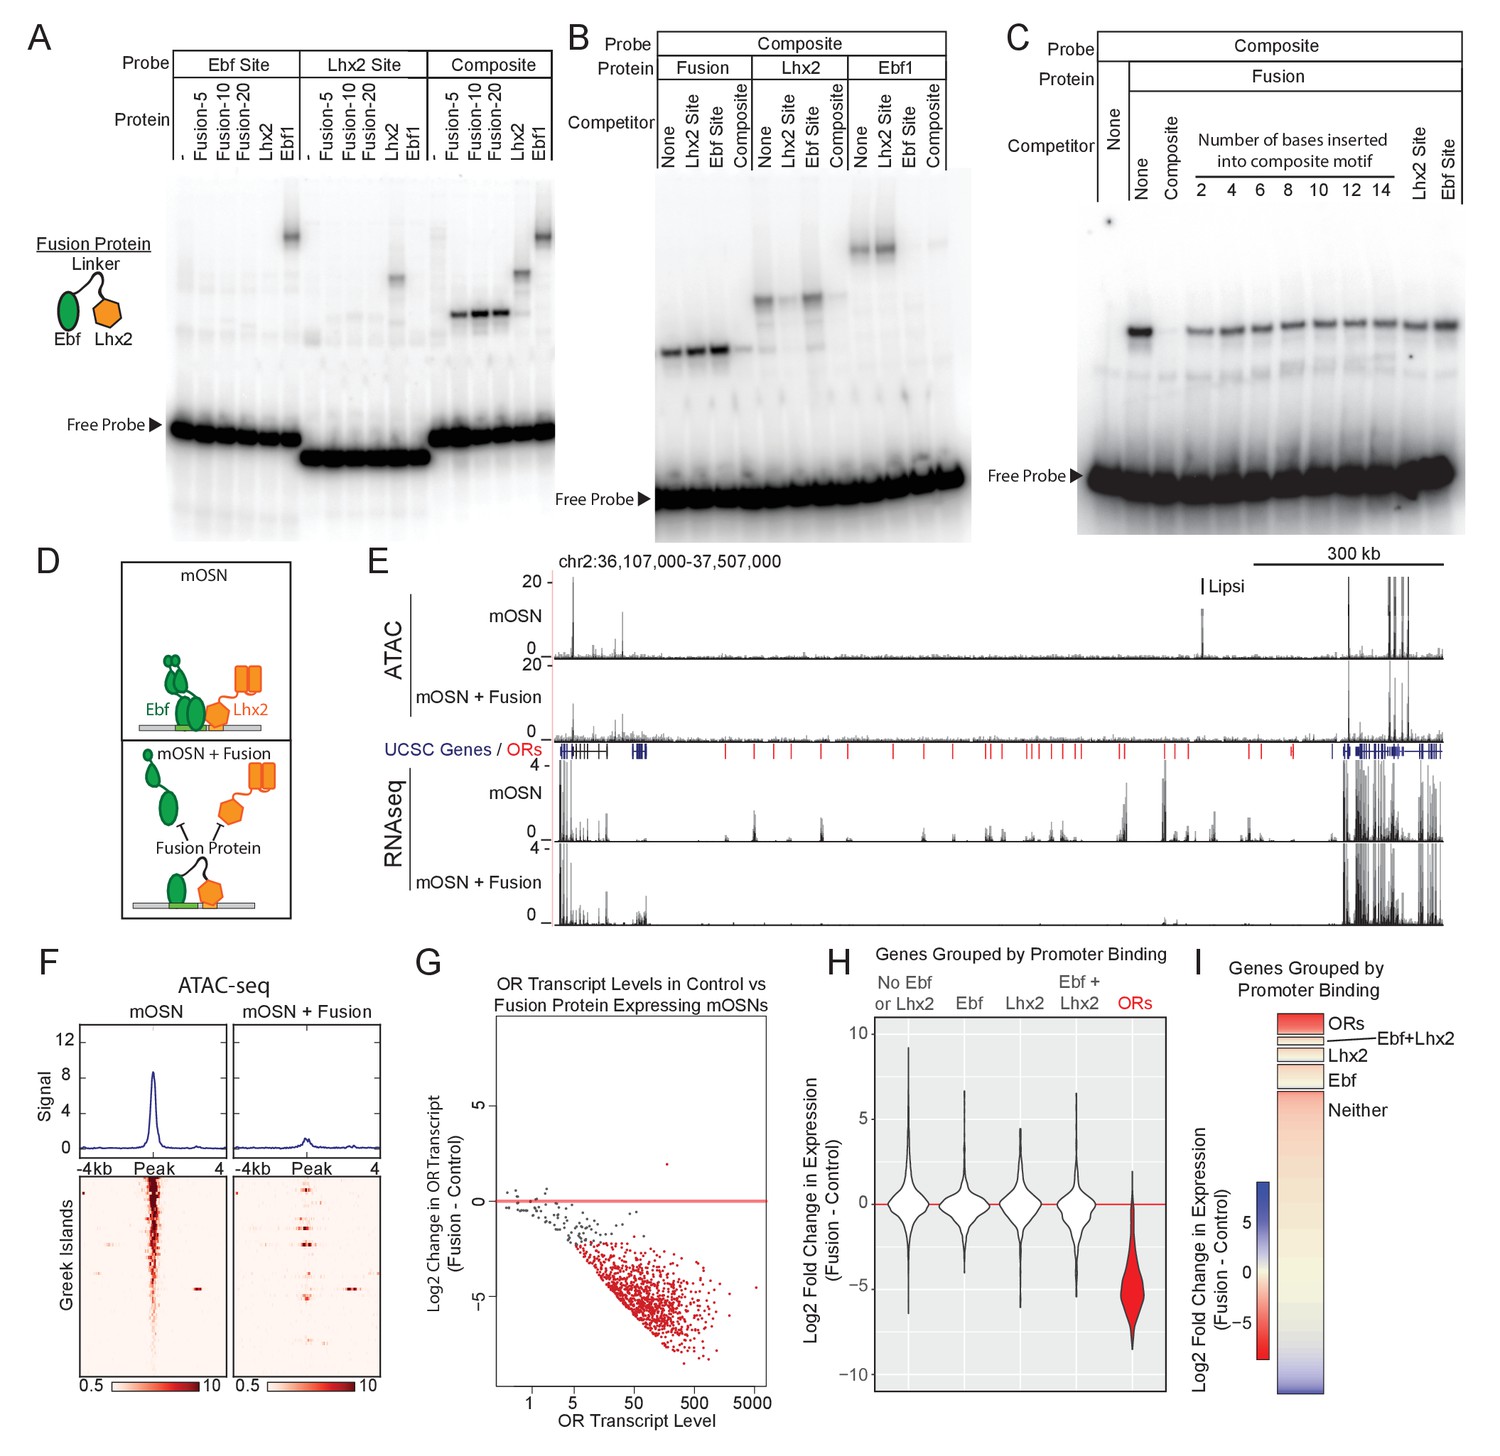
Displacement of Lhx2 and Ebf from Greek Islands shuts off OR transcription.
(A) Electrophoretic Mobility Shift Assay (EMSA) for binding of in vitro translated protein to DNA probes containing either an Ebf site, an Lhx2 site, or a composite site. Binding of three versions of the Fusion protein with either 5, 10, or 20 amino acid linker peptides were compared to full length Lhx2 or full length Ebf1. (B) EMSA for sequence selectivity of in vitro translated proteins. Binding of Fusion protein (20aa linker), Ebf1, and Lhx2 to composite motif probe was competed with a 20-fold molar excess of unlabeled oligo containing either an Lhx2 site, Ebf site, or composite site. (C) EMSA for motif-spacing selectivity of in vitro translated proteins. Binding of Fusion protein (20aa linker) was competed with 100-fold molar excess of unlabeled oligo containing either wild type composite sequence or mutant composite generated by the insertion of 2–14 base pairs in two base pair increments. In the last two lanes the competitors are either a single Lhx2 or a single Ebf site. (D) Schematic illustrating the proposed dominant-negative activity of the fusion protein for composite motif sites. See also Figure 5—figure supplement 1 for depiction of the genetic strategy for mOSN overexpression. (E) ATAC-seq and RNA-seq signal tracks from FAC-sorted control mOSNs and Fusion protein-expressing mOSNs for the OR cluster containing the Greek Island Lipsi. ATAC-seq values are reads per 10 million. RNA-seq values are reads per million. For ATAC-seq, pooled data from 4 biological replicates for control mOSNs are compared to data pooled from 2 independent founders of the Fusion Protein transgene. For RNA-seq, representative tracks are shown for one of three biological replicates for control mOSNs and for one of 2 independent founders for the Fusion Protein transgene. (F) ATAC-seq signal across the Greek Islands for control mOSNs and Fusion protein-expressing mOSNs. Pooled data from 4 biological replicates for control mOSNs are compared to data pooled from 2 independent founders of the Fusion Protein transgene. See Figure 5—figure supplement 2 for the effect of Fusion Protein expression on Ebf and Lhx2 sites genome-wide. (G) MA-plot (Dudoit and Fridlyand, 2002) of OR transcript levels in FAC-sorted mOSNs expressing fusion protein (Omp-IRES-tTA; tetO-Fusion-2a-mcherry) compared to FAC-sorted control mOSNs (Omp-IRES-GFP). Red dots correspond to OR genes with statistical significant transcriptional changes (adjusted p-value<0.05). Three biological replicates were included for control mOSNs and data from 2 independent founders were included for the Fusion Protein transgene. See Figure 5—figure supplement 3 for analysis of effect of Fusion Protein expression on ORs grouped by the presence of Ebf and Lhx2 promoter motifs. (H) Violin plot of Log2 fold change in transcript levels of ORs (red) in mOSNs expressing fusion protein compared to control mOSN. ORs are compared to additional sets of genes: genes with Ebf and Lhx2 bound within 1 kb of the TSS, genes with Lhx2-only bound within 1 kb of the TSS, genes with Ebf-only bound within 1 kb of the TSS, and non-OR genes without Ebf or Lhx2 binding. (I) As in (H), with Log2 fold change in transcript levels shown as a heatmap for each set of genes.
-
Figure 5—source code 1
R code for analysis of ATAC-seq data from Fusion Protein mOSNs.r.
- https://doi.org/10.7554/eLife.28620.039
-
Figure 5—source code 2
R code for analysis of RNA-seq data from Fusion Protein mOSNs.r.
- https://doi.org/10.7554/eLife.28620.040
-
Figure 5—source data 1
RNA-seq MA plot of Olfr Expression in mOSNs versus Fusion Protein expressing mOSNs.txt.
- https://doi.org/10.7554/eLife.28620.041
-
Figure 5—source data 2
RNA-seq Log2 fod change in mOSNs versus Fusion Protein Expressing mOSNs.txt.
- https://doi.org/10.7554/eLife.28620.042
-
Figure 5—source data 3
Change in ATAC-seq signal in Fusion Protein expressing mOSNs by peak type.txt.
- https://doi.org/10.7554/eLife.28620.043
-
Figure 5—source data 4
Change in OR expression in Fusion Protein expressing mOSNs versus promoter motifs.txt.
- https://doi.org/10.7554/eLife.28620.044
Figure 5—figure supplement 1
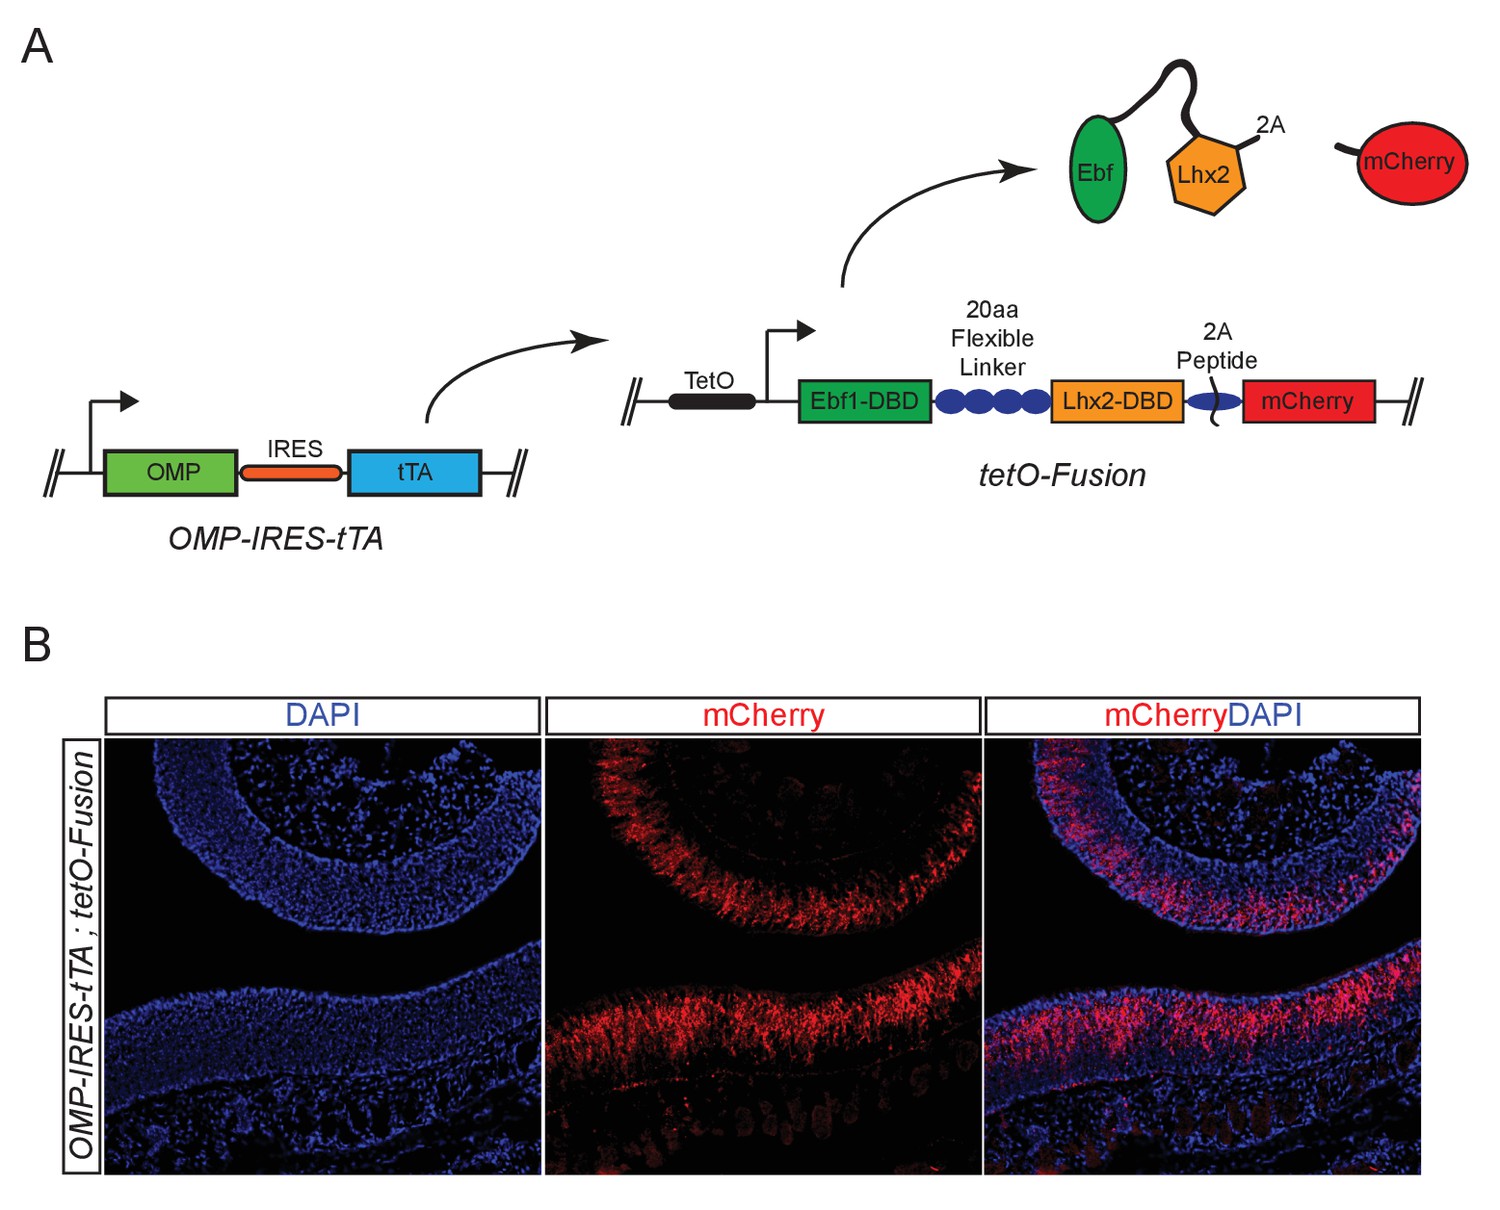
Genetic strategy for expression of Fusion Protein.
(A) Schematic of OMP-IRES-tTA driven expression of Fusion protein and mCherry in mOSNs. (B) mCherry fluorescence (red) in MOE tissue sections from animals bearing an Omp-IRES-tTA; tetO-Fusion-2A-mCherry transgene. Nuclei are stained with DAPI (blue).
Figure 5—figure supplement 2
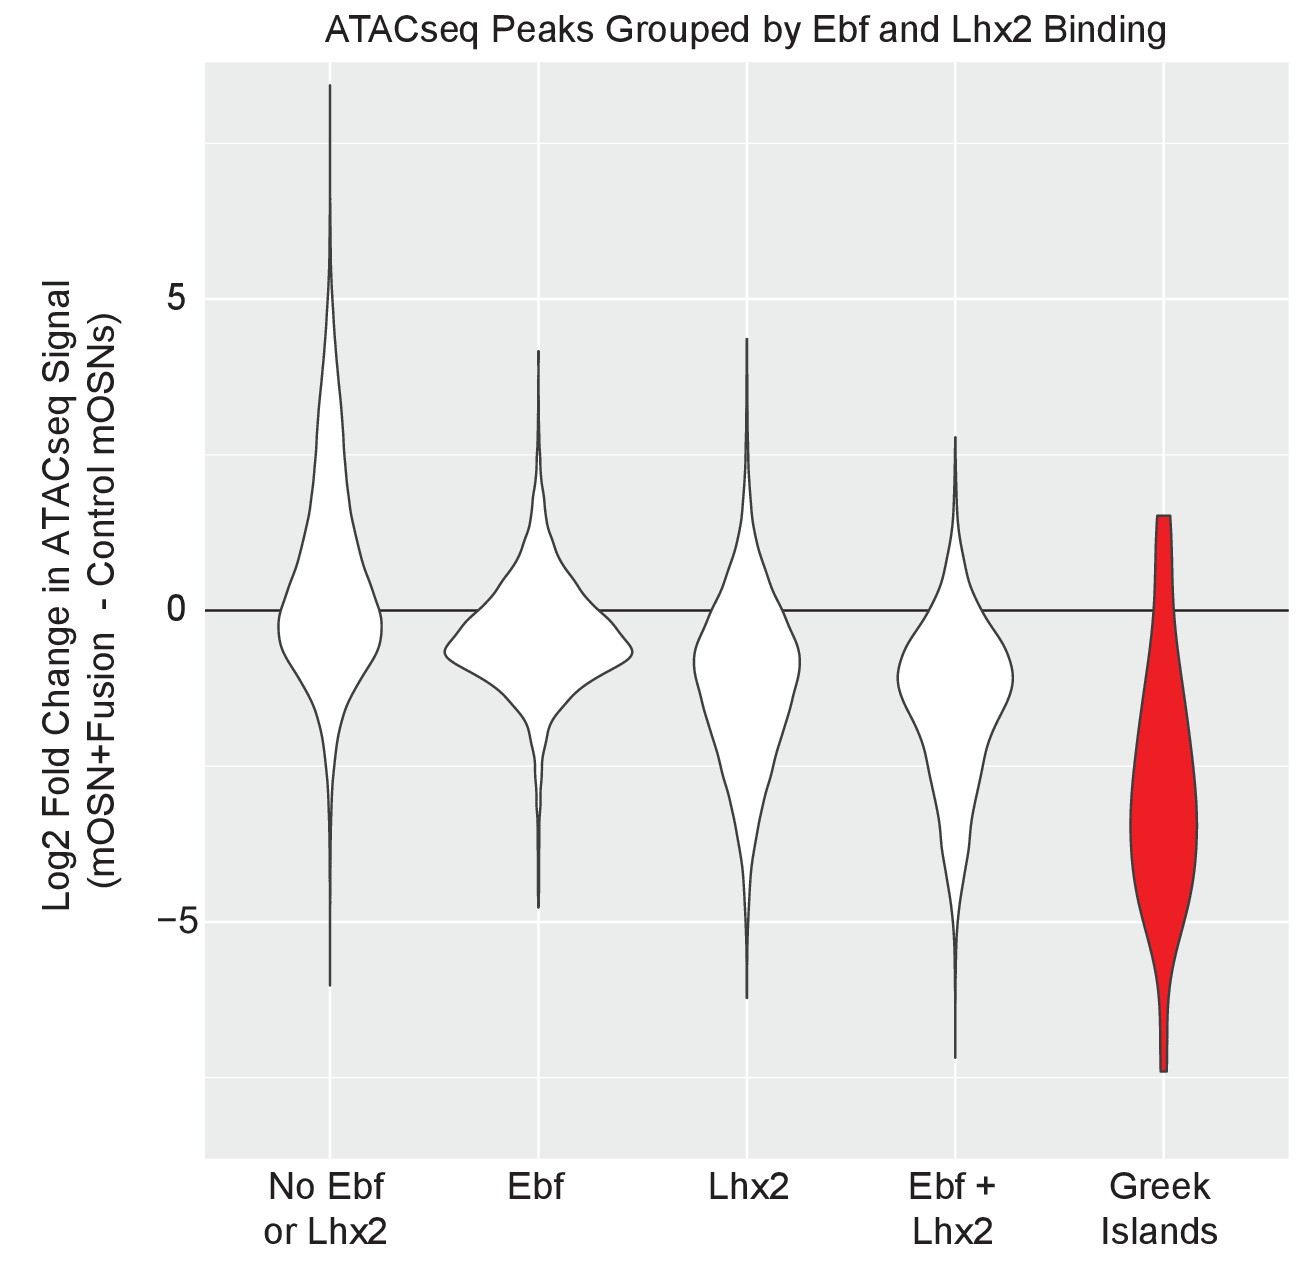
Fusion protein expression most strongly affects ATAC-seq signal on Greek Islands.
Violin plot of Log2 fold change in normalized ATAC-seq signal in mOSNs expressing fusion protein compared to control mOSNs. ATAC-seq peaks on Greek Islands (red), are compared to ATAC-seq peaks genome-wide that are grouped by the presence of an overlapping Ebf and/or Lhx2 ChIP-seq peak in wild type OSNs.
Figure 5—figure supplement 3

Fusion protein expression downregulates OR expression irrespective of presence of Lhx2 or Ebf promoter motifs.
Density plots of Log2 fold change in OR transcript levels in Fusion protein expressing mOSNs compared to control mOSNs, with ORs grouped based upon the motifs present in the promoter region (−500 bp to the TSS). ORs with a very low level of expression (OR transcript level <5 in Figure 5G) are not included. Three biological replicates were included for control mOSNs and data from 2 independent founders were included for the Fusion Protein transgene.
Figure 6 with 1 supplement
Downregulation of OR expression over large genomic distances.
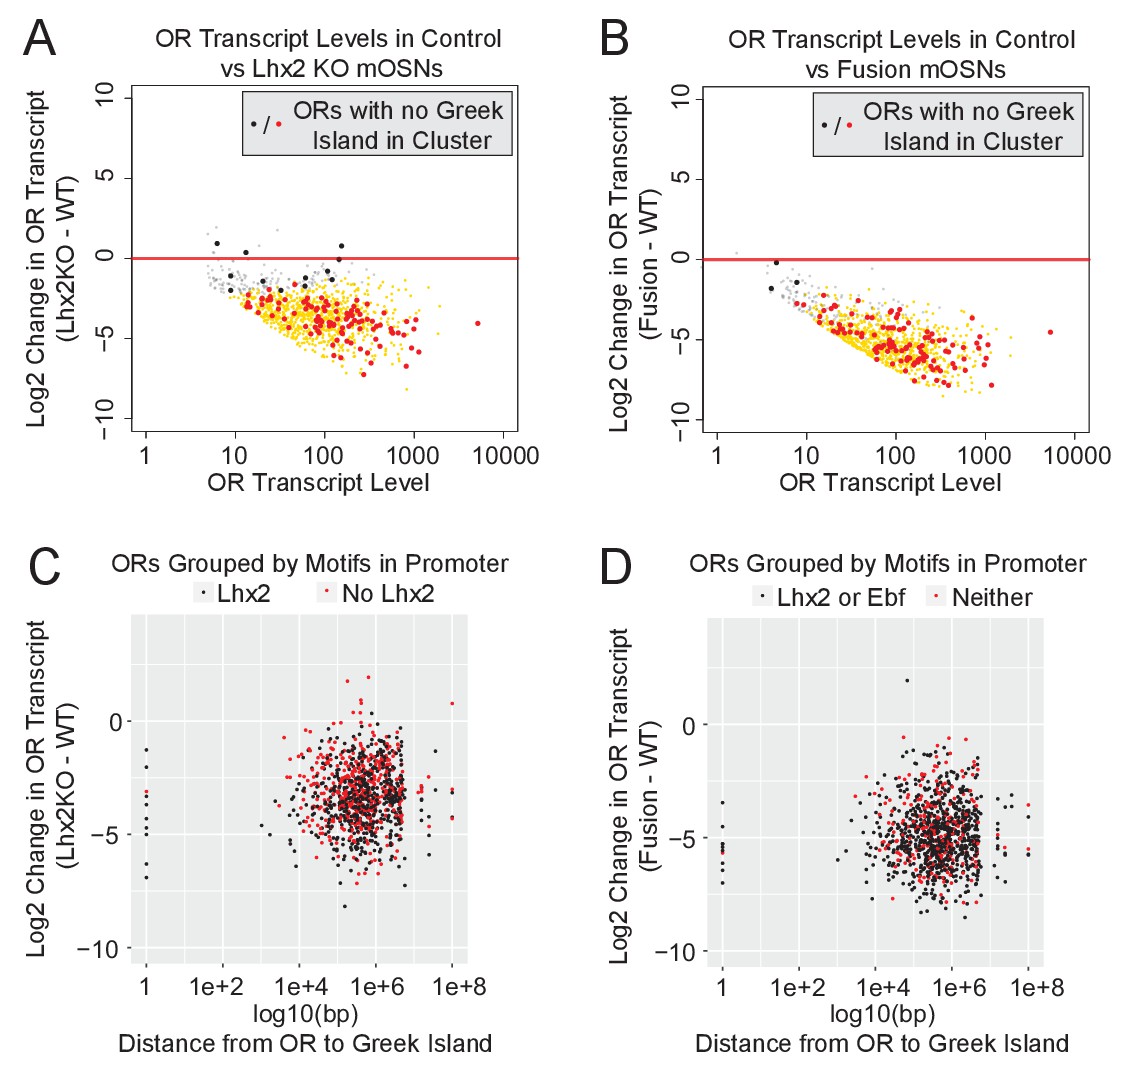
(A) MA-plot of OR transcript levels in FAC-sorted Lhx2 KO (Omp-IRES-Cre; Lhx2fl/fl; tdTomato) mOSNs compared to FAC-sorted control mOSNs (Omp-IRES-GFP). Gold dots correspond to OR genes with statistical significant transcriptional changes. ORs in clusters without a Greek Island are shown as large dots, with significantly changed ORs in red. Three biological replicates were included for control mOSNs and 2 biological replicates were included for Lhx2 KO mOSNs. (B) MA-plot of OR transcript levels in FAC-sorted Fusion protein expressing (Omp-IRES-tTA; tetO-Fusion-2a-mcherry) mOSNs compared to FAC-sorted control mOSNs (Omp-IRES-GFP). Gold dots correspond to OR genes with statistical significant transcriptional changes. ORs in clusters without a Greek Island are shown as large dots, with significantly changed ORs in red. Three biological replicates were included for control mOSNs and data from 2 independent founders were included for the Fusion Protein transgene. See Figure 6—figure supplement 1 for an example OR cluster without a Greek Island. (C) Plot of OR distance from a Greek Island compared to Log2 Fold change in Lhx2 KO mOSNs. ORs overlapping a Greek Island have distance set to 1. ORs on a chromosome without a Greek Island have distance set to 1e + 08. (D) Plot of OR distance from a Greek Island compared to Log2 Fold change in Fusion Protein expressing mOSNs. ORs overlapping a Greek Island have distance set to 1. ORs on a chromosome without a Greek Island have distance set to 1e + 08.
-
Figure 6—source code 1
R code for analysis of RNA-seq data from Lhx2KO mOSNs.r.
- https://doi.org/10.7554/eLife.28620.047
-
Figure 6—source code 2
R code for analysis of RNA-seq data from Fusion Protein mOSNs.r.
- https://doi.org/10.7554/eLife.28620.048
-
Figure 6—source data 1
RNA-seq MA-plot of OR expression in Lhx2KO versus presence of Greek Island.txt.
- https://doi.org/10.7554/eLife.28620.049
-
Figure 6—source data 2
RNA-seq MA-plot of OR expression in Fusion Protein versus presence of Greek Island.txt.
- https://doi.org/10.7554/eLife.28620.050
-
Figure 6—source data 3
OR expression in Lhx2KO versus promoter motifs and distance to Greek Island.txt.
- https://doi.org/10.7554/eLife.28620.051
-
Figure 6—source data 4
OR expression in Fusion Protein mOSNs versus promoter motifs and distance to Greek Island.txt.
- https://doi.org/10.7554/eLife.28620.052
Figure 6—figure supplement 1
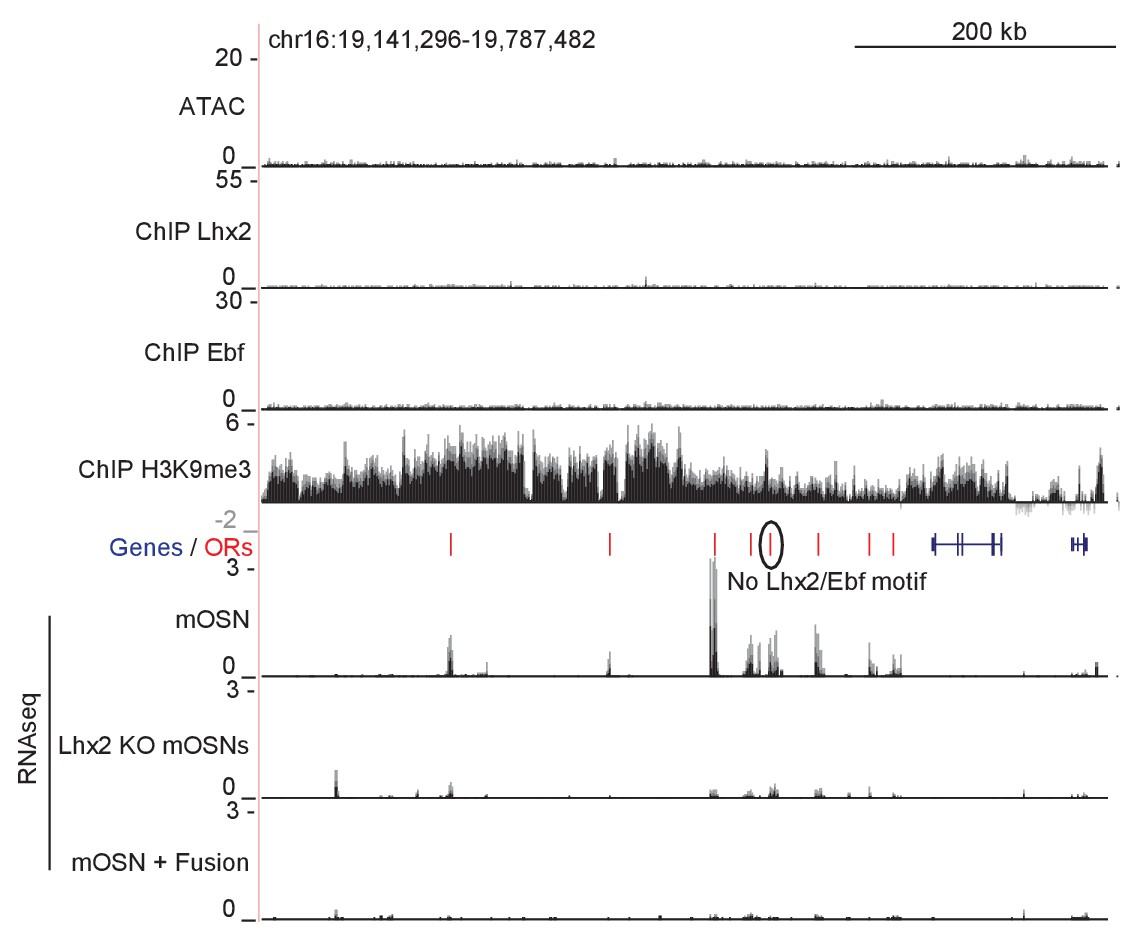
Fusion Protein and Lhx2 KO downregulate ORs in a cluster without a Greek Island.
mOSN ATAC-seq and ChIP-seq signal tracks are shown for an OR gene cluster without a Greek Island, scaled as in Figure 1A. Below the annotation, RNA-seq tracks show signal for control mOSNs, Lhx2 KO mOSNs, and mOSNs expressing fusion protein. RNA-seq values are reads per million. An OR without Ebf or Lhx2 motifs in its promoter is circled. For ATAC-seq, pooled data from 4 biological replicates of control mOSNs is shown. For ChIP-seq, pooled data from 2 biological replicates of control mOSNs is shown. For RNA-seq, representative tracks are shown for one biological replicate from each condition.
Figure 7 with 1 supplement
Multi-enhancer hubs activate OR transcription.
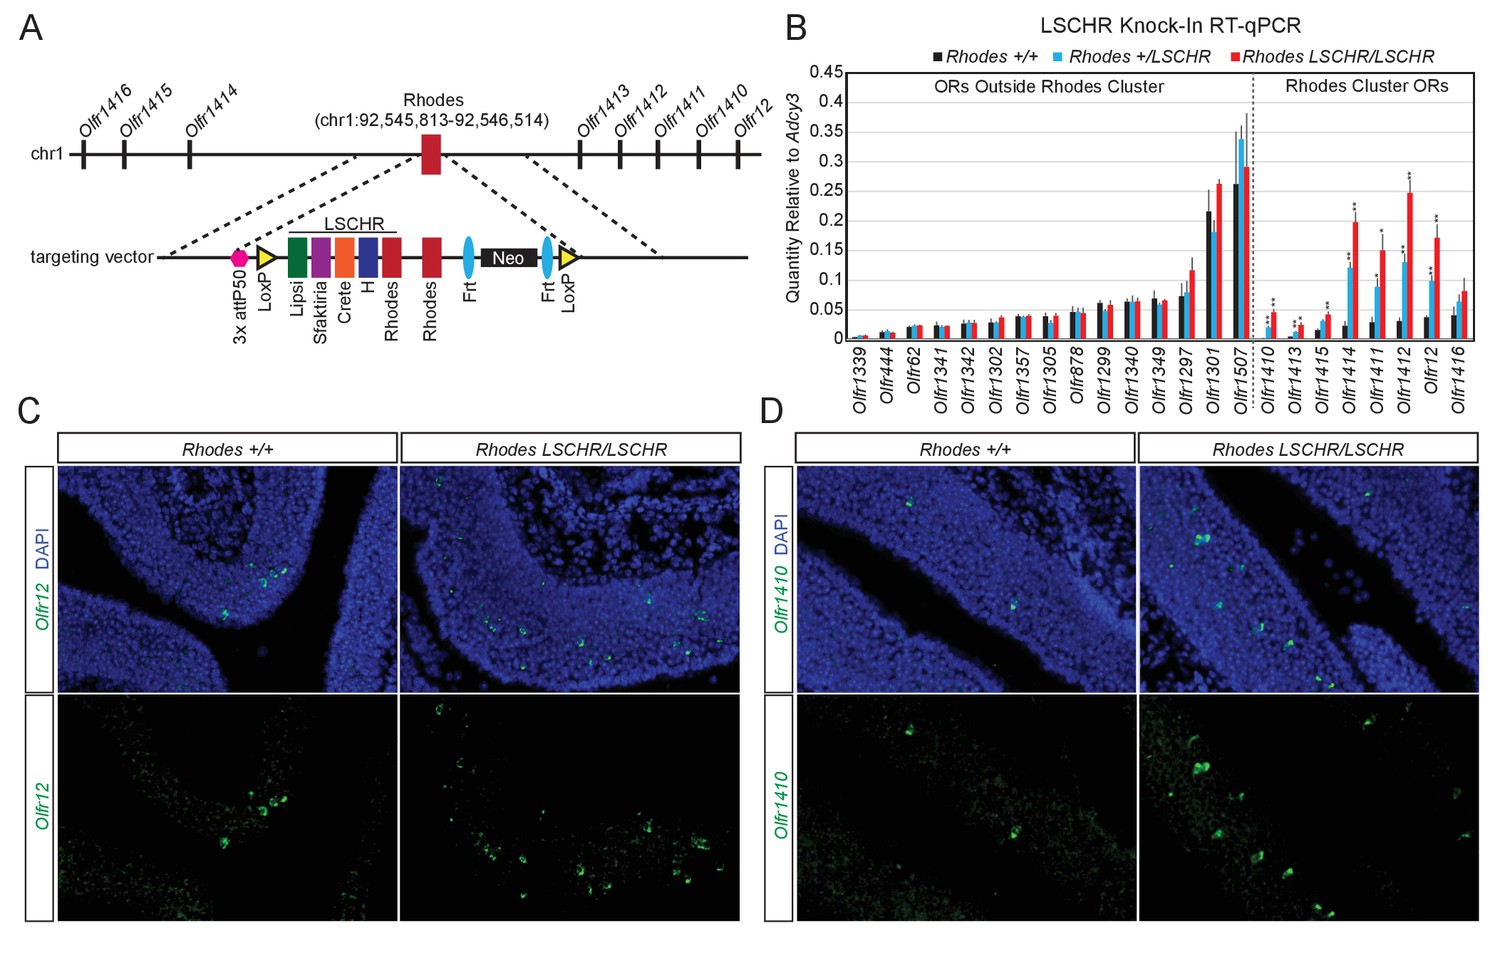
(A) Targeted insertion of 5 Greek Islands (LSCHR) adjacent to Rhodes. Coordinates are mm10. See Figure 7—figure supplement 1 for ChIP qPCR analysis of Lhx2 binding to the inserted Greek Islands. (B) RT-qPCR of OR transcript levels in MOEs of 3 week old LSCHR mice and wild-type littermate controls. Transcript levels are expressed as quantity relative to Adcy3, error bars are SEM. ORs are grouped by presence inside or outside the OR cluster containing Rhodes, and within each group ORs are ordered by level of expression in wild-type mice. *p<0.05, **p<0.01, two-tailed student’s t-test. For wild-type mice n = 3, for LSCHR heterozygous and homozygous mice n = 4. (C) Fluorescent RNA in situ hybridization with probe for Olfr12 (green) in LSCHR homozygous and wild-type littermate control MOE at 2 weeks of age. Nuclei are labeled with DAPI (blue). (D) Fluorescent RNA in situ hybridization with probe for Olfr1410 (green) in LSCHR homozygous and wild-type littermate control MOE at 2 weeks of age. Nuclei are labeled with DAPI (blue).
Figure 7—figure supplement 1
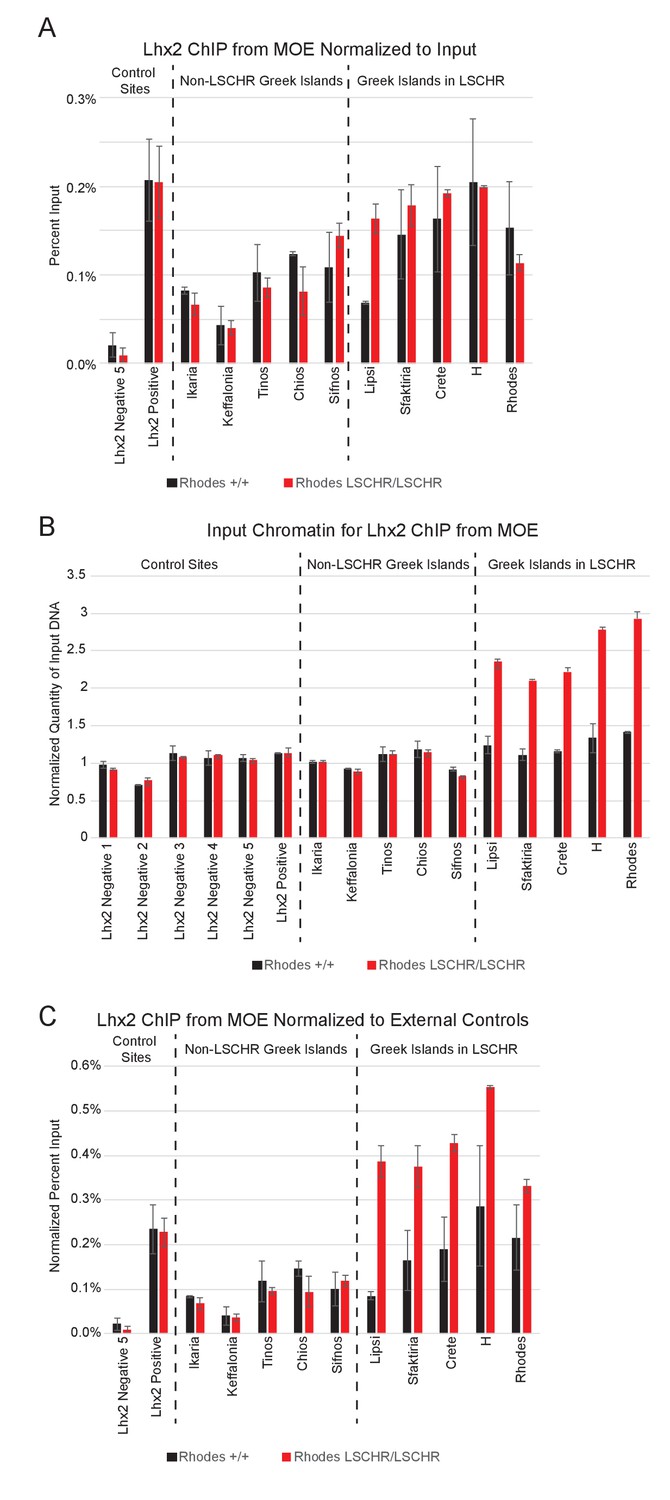
Lhx2 binds to inserted Greek Islands.
(A) Quantitative PCR analysis of Lhx2 ChIP performed on MOE chromatin from wild-type and Rhodes LSCHR/LSCHR mice. Data is shown for control Lhx2 negative and Lhx2 positive sites located outside OR clusters, for 5 Greek Islands that were not included in the LSCHR knock-in, and for the 5 Greek Islands included in the knock-in. For four additional negative control primer sets ChIP signal was not detectable; these are not shown. Percent recovery of input DNA was calculated for each sample. Plots show the mean and error bars show the range for two biological replicates for each genotype. (B) Quantitative PCR analysis of input chromatin for MOE Lhx2 ChIP experiments. For each sample, signal observed with each primer set is normalized to the mean signal observed at 6 external control sites located outside OR clusters. Plots show the mean and error bars show the range for two biological replicates for each genotype. (C) Quantitative PCR analysis of MOE Lhx2 ChIP normalized to control sites located outside of OR clusters. For each site, percent recovery of DNA was calculated relative to the mean input signal observed at non-OR external control sites, rather than the input control for that site, which is shown in (B).
Figure 8
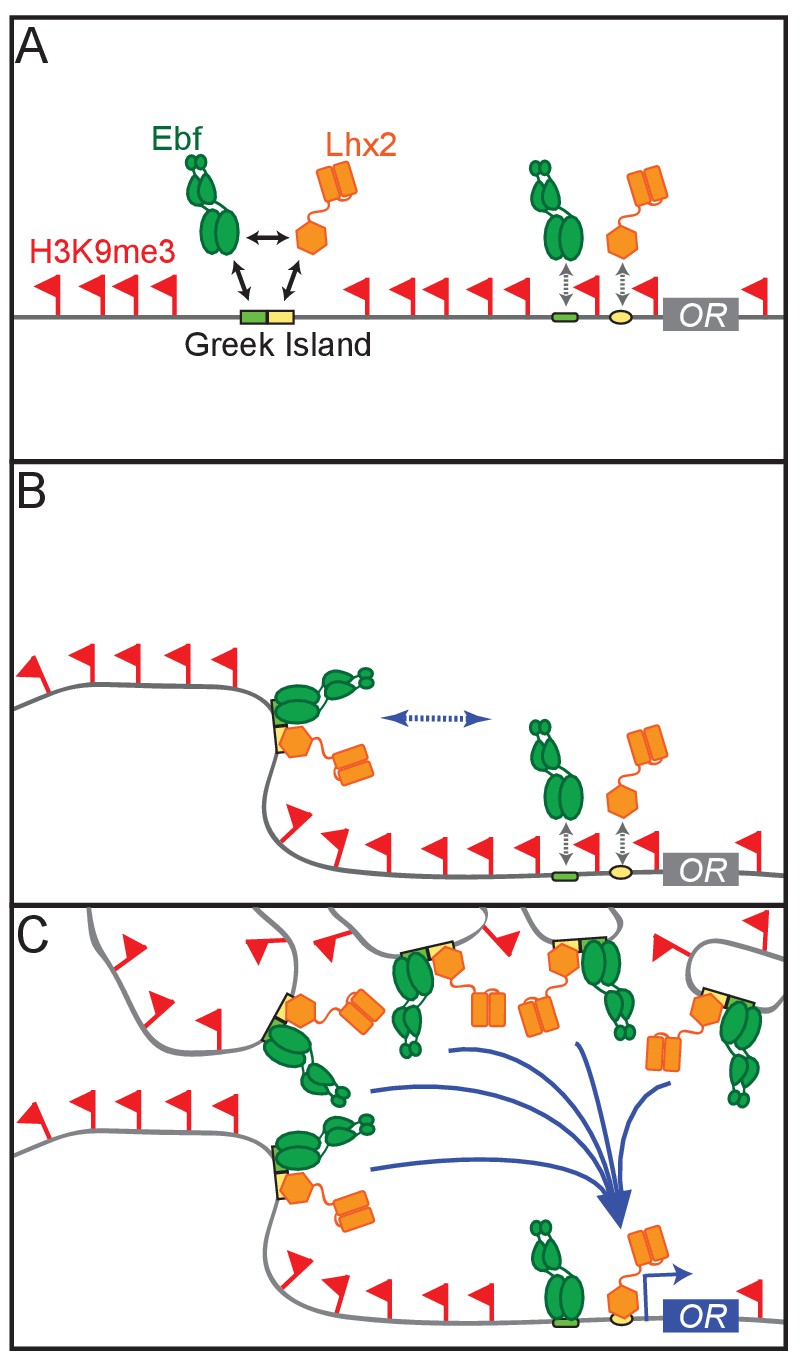
A Hierarchical Model for OR gene choice.
(A) Lhx2 and Ebf bind in a functionally cooperative fashion on the composite motifs of the Greek Islands. Because these motifs are not juxtaposed in most OR promoters, Lhx2 and Ebf cannot overcome the heterochromatic silencing of OR promoters, thus their binding is restricted to the OR enhancers. (B) Lhx2/Ebf bound OR enhancers are not strong enough to activate proximal OR alleles on their own and to facilitate stable transcription factor binding on their promoters. (C) Lhx2/Ebf bound Greek Islands form an interchromosomal, multi-enhancer hub that recruits coactivators essential for the de-silencing of OR promoters and robust transcriptional activation of the OR allele that would be recruited to this hub.
Additional files
-
Supplementary file 1
New versus Old Greek Islands.xlsx
- https://doi.org/10.7554/eLife.28620.056
-
Supplementary file 2
Greek Island Composite Motifs.xlsx
- https://doi.org/10.7554/eLife.28620.057
-
Supplementary file 3
Olfactory Recpetor Clusters.xlsx
- https://doi.org/10.7554/eLife.28620.058
-
Supplementary file 4
ATAC-seq Samples.xlsx
- https://doi.org/10.7554/eLife.28620.059
-
Supplementary file 5
Deep Sequencing Samples.xlsx
- https://doi.org/10.7554/eLife.28620.060
-
Supplementary file 6
Recombinant DNA.xlsx
- https://doi.org/10.7554/eLife.28620.061
-
Supplementary file 7
EMSA Probe Sequences.xlsx
- https://doi.org/10.7554/eLife.28620.062
-
Supplementary file 8
Primer Sequences.xlsx
- https://doi.org/10.7554/eLife.28620.063
-
Transparent reporting form
- https://doi.org/10.7554/eLife.28620.064
Download links
A two-part list of links to download the article, or parts of the article, in various formats.
Downloads (link to download the article as PDF)
Open citations (links to open the citations from this article in various online reference manager services)
Cite this article (links to download the citations from this article in formats compatible with various reference manager tools)
Cooperative interactions enable singular olfactory receptor expression in mouse olfactory neurons
eLife 6:e28620.
https://doi.org/10.7554/eLife.28620


