Antimicrobial peptide expression in a wild tobacco plant reveals the limits of host-microbe-manipulations in the field
- Max Planck Institute for Chemical Ecology, Germany
- National Institute for Interdisciplinary Science and Technology, India
Figures
Figure 1 with 1 supplement

Nicotiana attenuata plants were transformed to ectopically express an antimicrobial peptide (AMP) and planted into a research field plot in the plants´ native environment.
(A) Overview scheme of the experimental approach. AMP expression was used to target bacteria in planta as an ecological tool to unravel microbiome function under field conditions regarding contribution to plant performance, fitness and defense against herbivores. (B) Location of the experimental field plot at the Lytle Ranch Preserve in Utah (USA), which was used for the field releases in 2011, 2012 and 2013. Figure composed with maps provided by d-maps.com (http://d-maps.com/m/america/usa/utah/utah/utah09.pdf; http://d-maps.com/m/america/usa/arizona/arizona/arizona13.pdf; http://d-maps.com/m/america/usa/nevada/nevada/nevada09.pdf). (C) Larger view of the plants planted at the field plot.
Figure 1—figure supplement 1
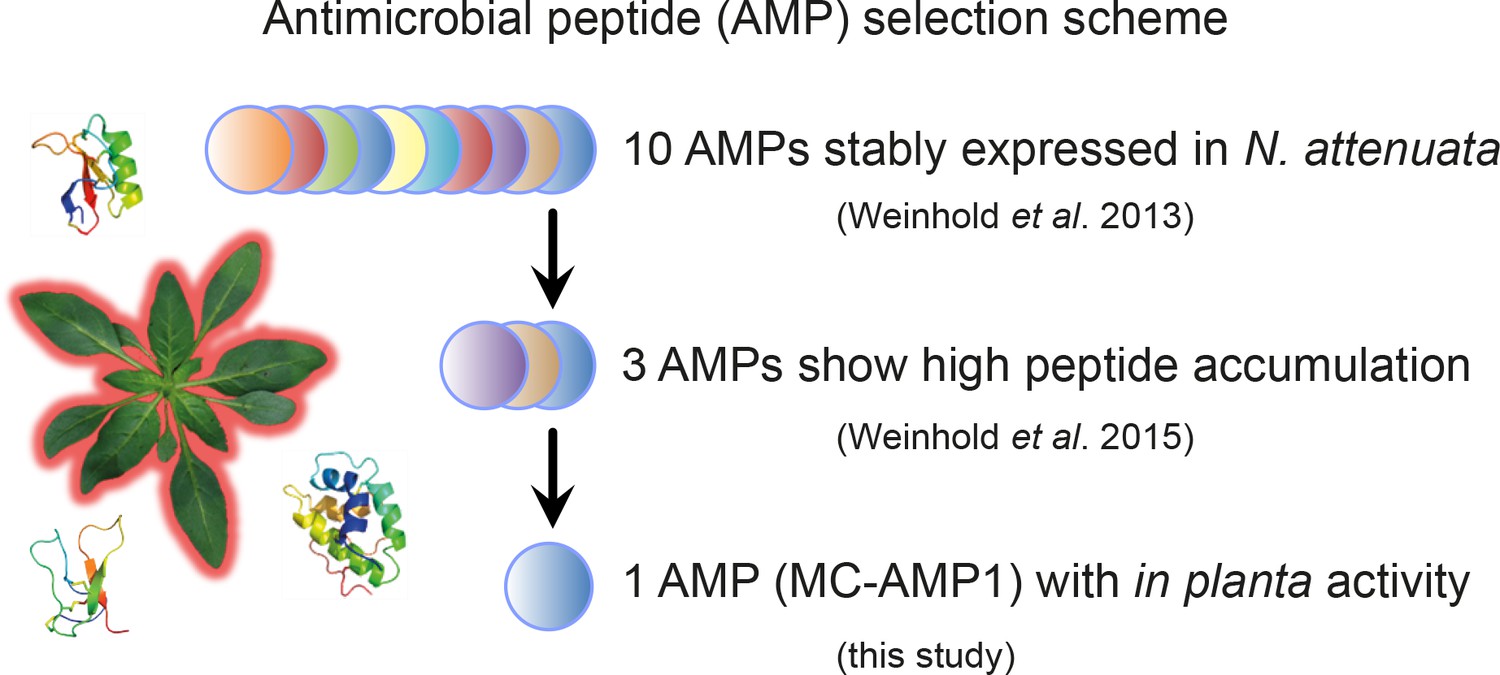
Antimicrobial peptide (AMP) selection scheme for the identification of eligible candidates for host-microbe manipulation studies in the field.
Wild tobacco plants (N. attenuata) were transformed for the ectopic expression of various different AMPs (Gase et al., 2011). Ten antimicrobial peptides showed reliable gene expression levels within the transgenic plants over multiple generations (Weinhold et al., 2013). Among these, three peptides showed particularly high accumulation levels within the leaf apoplast (Weinhold et al., 2015). Finally, plants transformed with Mc-AMP1 from the common ice plant demonstrated in planta activity against bacteria (this study).
Figure 2 with 3 supplements

Overview of the expression casette used for plant transformation and the gene expression strength of the transformed Nicotiana attenuata plants.
(A) The peptide Mc-AMP1 (‘ICE’) from the common ice plant (Mesembryanthemum crystallinum) was constitutively expressed under a 35S promoter. The amino acid sequence of the pro-peptide is shown with the signal peptide in red and the mature domain in blue. Connection pattern of the conserved cysteine residues are indicated. (B) Uniformity in gene expression strength in rosette leaves of independently transformed N. attenuata ICE lines in the T4 generation. Bars indicate the log2 fold AMP expression levels which were 23.1 fold (±6.0) higher relative to actin as the reference gene (±SD, n = 4 plants). (C) The ICE lines showed no pleiotropic effects on plant morphology associated with AMP expression.
Figure 2—figure supplement 1

Multiple sequence alignments of knottin-like peptides.
The peptide (Mc-AMP1) from the common ice plant was used for ectopic expression and showed sequence similarities to other peptides from plants (all within the Caryophyllales) insects (Coleoptera; Hemiptera) and fungi (Hypocreales). Sequences were retrieved from GenBank and signal peptides were removed using the SignalP 4.1 Server before alignment in Geneious version 6.0.5 (http://www.geneious.com) using the ClustalW algorithm. Accession numbers: Mc-AMP1 [AF069321], MJ-AMP2 [U15539], MJ-AMP1 [U15538], AFPS-1 [AF048745], Alo-1 [P83651], Alo-2 [P83652], Alo-3 [P83653], Btk-4 [ABC40572], C. militaris antifungal_toxin [XP_006665522], B. bassiana hypothetical protein [XP_008602399].
Figure 2—figure supplement 2
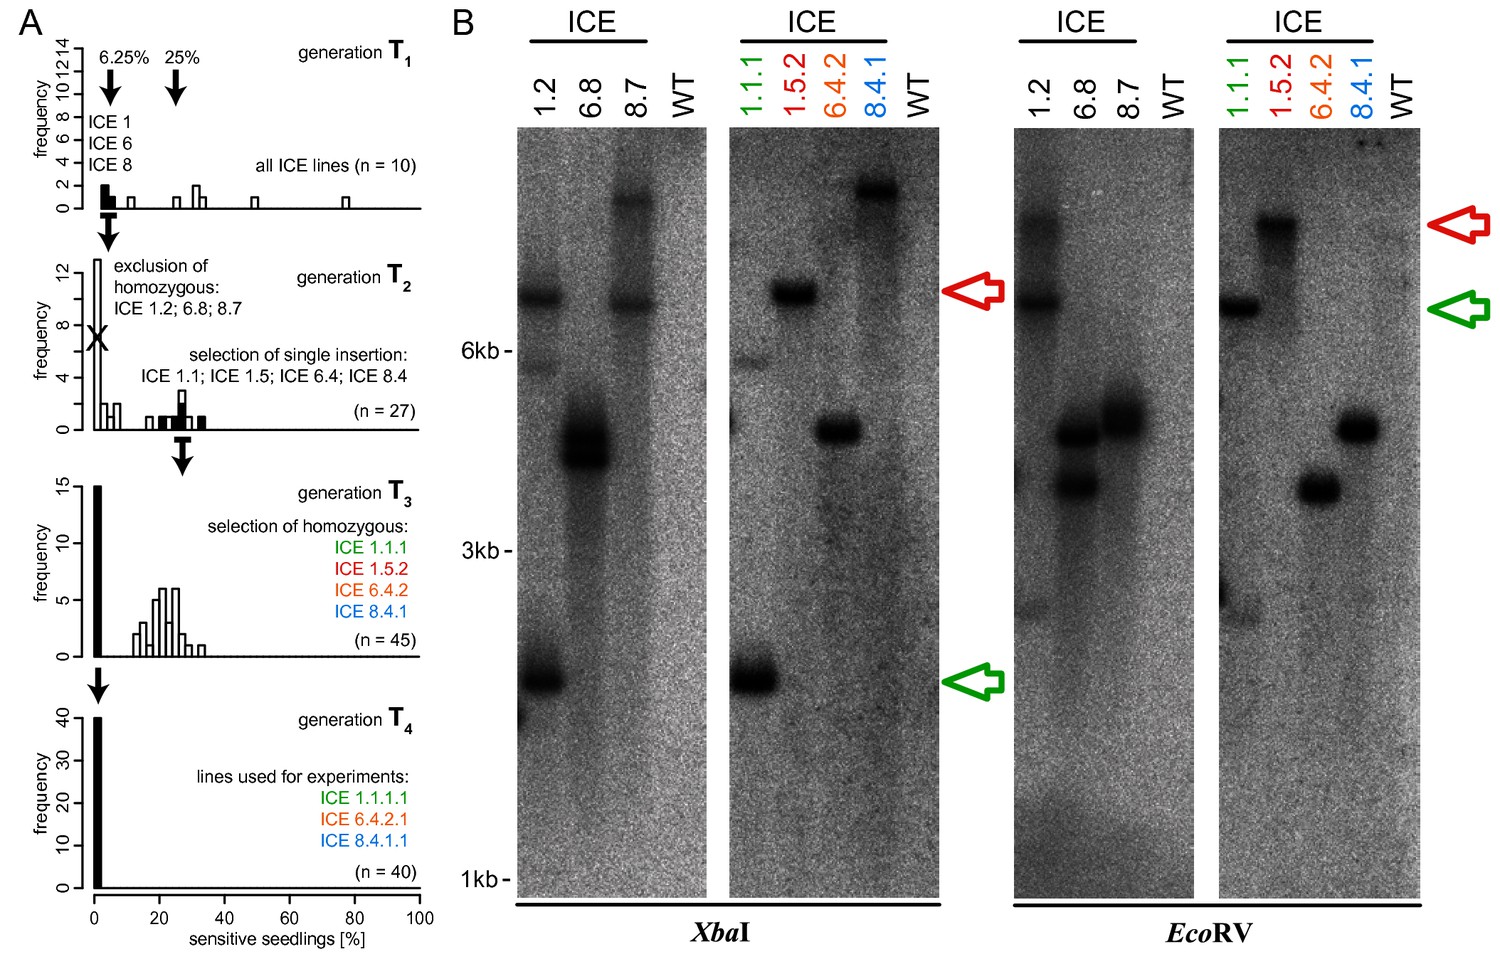
Selection scheme for ICE overexpression lines harboring a single copy of the transgene.
(A) Segregation analysis of the resistance marker loci was determined by germinating seedlings of N. attenuata on antibiotic containing medium. Three lines from independent regeneration events (ICE 1, ICE 6 and ICE 8) indicated the presence of two T-DNA loci (T1 segregation rate aproximating 6.25%). The first homozygous generation (T2) harbored multiple insertions and was excluded from further analysis. Alternatively selected T2 plants with hemizygous segregation patterns (25% sensitive seedlings) were further propagated and resulted in plants with single T-DNA insertions that were used for experiments (T4 generation). (B) Southern blot analysis for the determination of T-DNA copy numbers as performed in Weinhold et al., 2013. Genomic DNA was isolated from homozygous seedlings and digested in separate reactions with XbaI or EcoRV. A radiolabeled fragment of the hygromycin resistance gene (hptII) served as probe. All plants used for experiments showed single T-DNA insertions. Coincidently, the two loci of line ICE 1.2 were separated by segregation and resulted in plants with insertions at different positions (ICE 1.1.1 and ICE 1.5.2 highlighted with a red and green arrow).
Figure 2—figure supplement 3
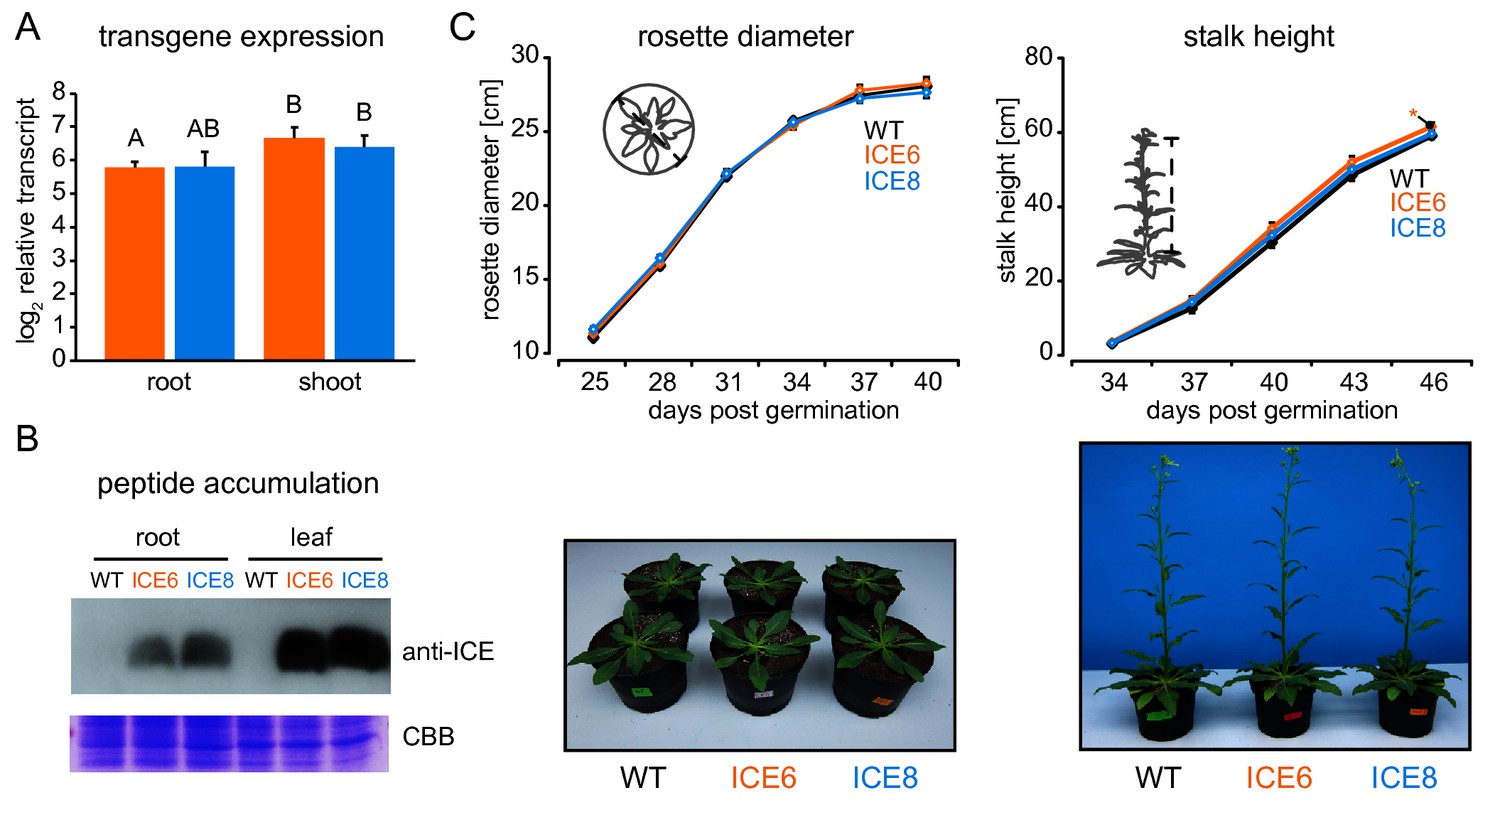
Transgene expression and peptide accumulation had no pleiotropic effects on plant growth and development in the glasshouse.
(A) Transgene expression strength from seedlings shown as log2 fold expression to actin (±SD, n = 4 plates a 30 seedlings). Different letters indicate significant differences (p≤0.05, Mann-Whitney U Test, following Kruskal-Wallis Test). (B) Immunoblot detection of the ectopically expressed peptide within roots and leaves of transgenic N. attenuata plants. For each sample a total of 40 µg protein was used for gel-electrophoresis. Coomassie Brilliant Blue staining (CBB) was used as loading control. (C) Transgenic plants (line ICE 6 and ICE 8) showed no growth reduction compared to WT in the glasshouse. Rosette diameter and stalk height were quantified in the glasshouse until 46 d post germination. Plants were distributed in a randomized design. Pictures depict plants at 30 and 40 d post germination (±SEM, n = 28 plants, Mann-Whitney U Test, following Kruskal-Wallis Test; *p≤0.05).
Figure 3 with 1 supplement
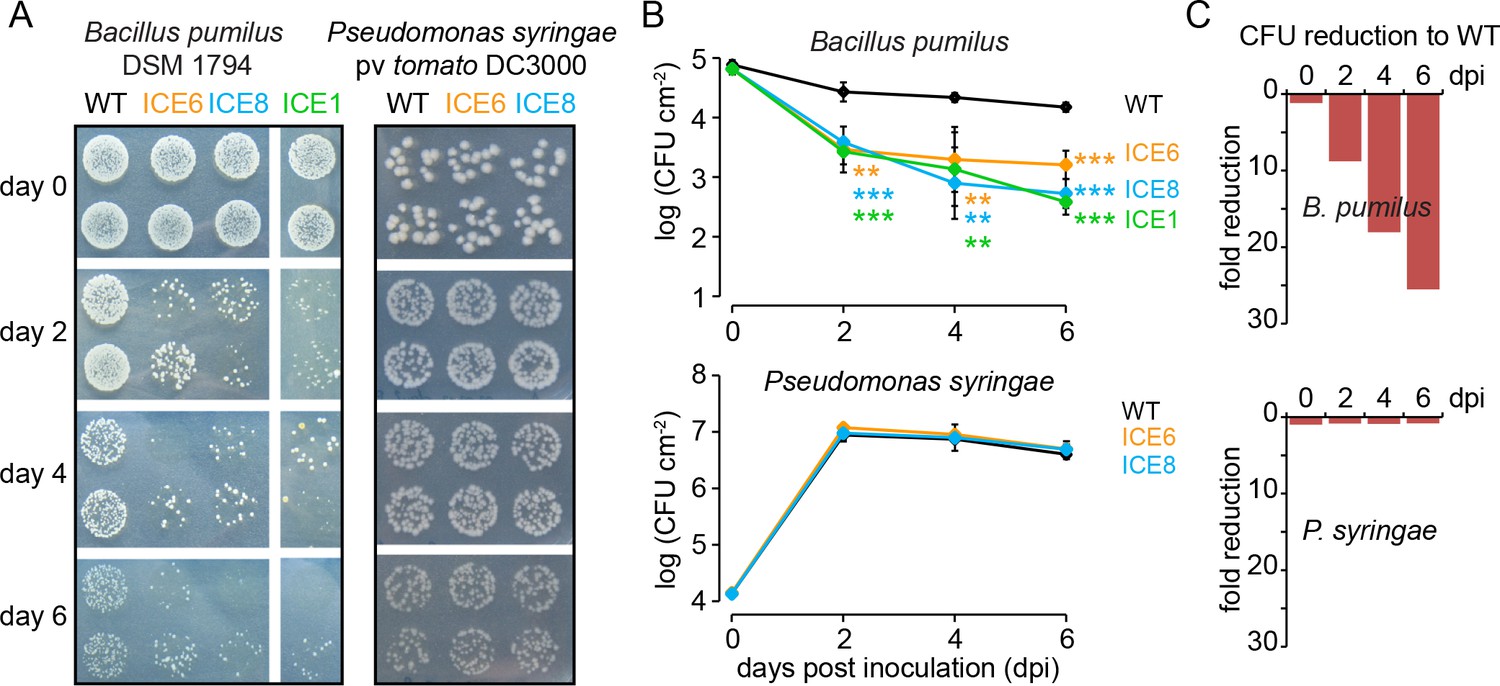
Transgenic N. attenuata plants showed in planta antimicrobial activity against Bacillus pumilus DSM 1794, but not against Pseudomonas syringae pv tomato DC3000.
(A) Bacteria were pressure infiltrated into fully expanded rosette-stage leaves and re-isolated at 0, 2, 4 and 6 d post infiltration (dpi). The pictures show two technical replicates per genotype from a dilution series. (B) The mean colony forming units (CFU) were plotted as log CFU cm−2 leaf area (±SD, n = 4 plants). Asterisks indicate statistically significant differences between WT and the transgenic plants (students t-test; **p≤0.01; ***p≤0.001). (C) Summary of the CFU fold reduction (non-log scale) compared to WT averaged among genotypes.
Figure 3—figure supplement 1
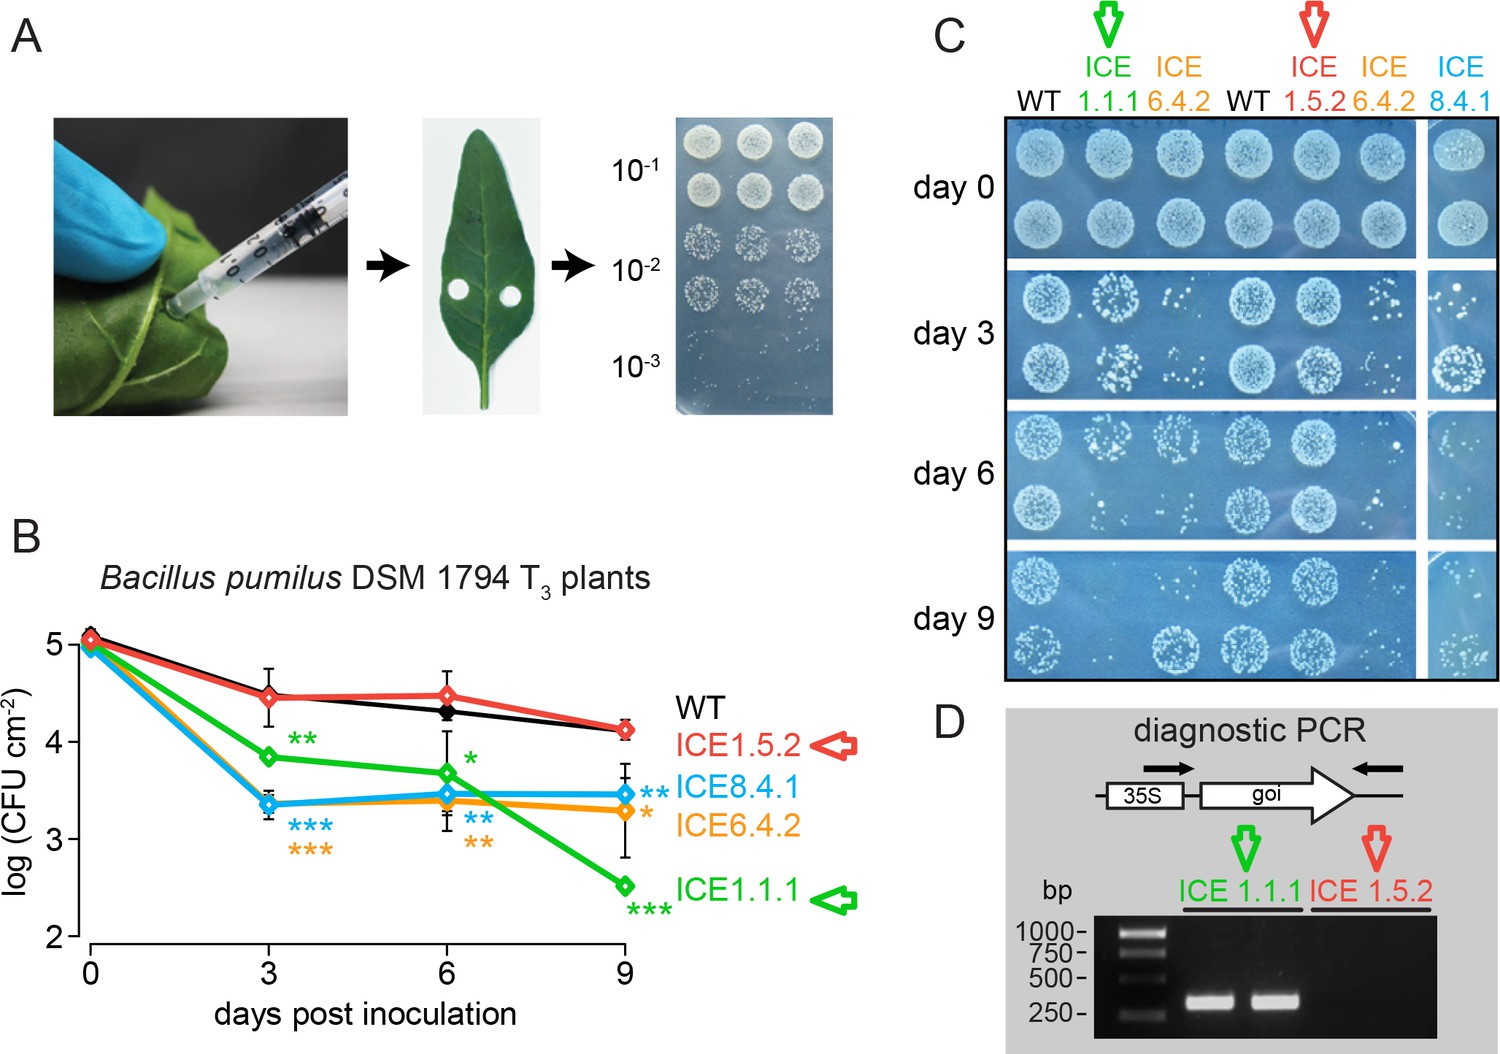
Leaf infiltration method for the determination of in planta antimicrobial activity against Bacillus pumilus DSM 1794.
(A) Illustration of the pressure infiltration procedure. About 300–400 µL bacterial solution were injected into fully expanded leaves on both sides of the midrib. The infiltrated area was marked with a pen and bacteria re-isolated using a cork borer. Leaf disks were squeezed with a pestle and serial dilutions of 10−1 to 10−3 were spotted on LB media for CFU counting. (B) The lines ICE 1.1.1, ICE 6.4.2 and ICE 8.4.1 showed antimicrobial activity from 3 to 9 d post infiltration (dpi). ICE 1.5.2 plants showed a lack of antibacterial activity (red arrow). The mean colony forming units (CFU) were plotted as log CFU cm−2 leaf area (±SD, n = 4; ICE 1 and ICE 8 n = 2). Asterisks indicate statistically significant differences between WT and transgenic plants (t-test;*, p≤0.05; **p≤0.01; ***p≤0.001). (C) Serial dilutions of re-isolated B. pumilus infiltrated into the first homozygous generation (T3) of the single insertion ICE lines. (D) A diagnostic PCR as described in Gase et al. (2011) revealed an incomplete expression cassette for line ICE 1.5.2 (red arrow) which explains the lack in activity.
Figure 4 with 2 supplements
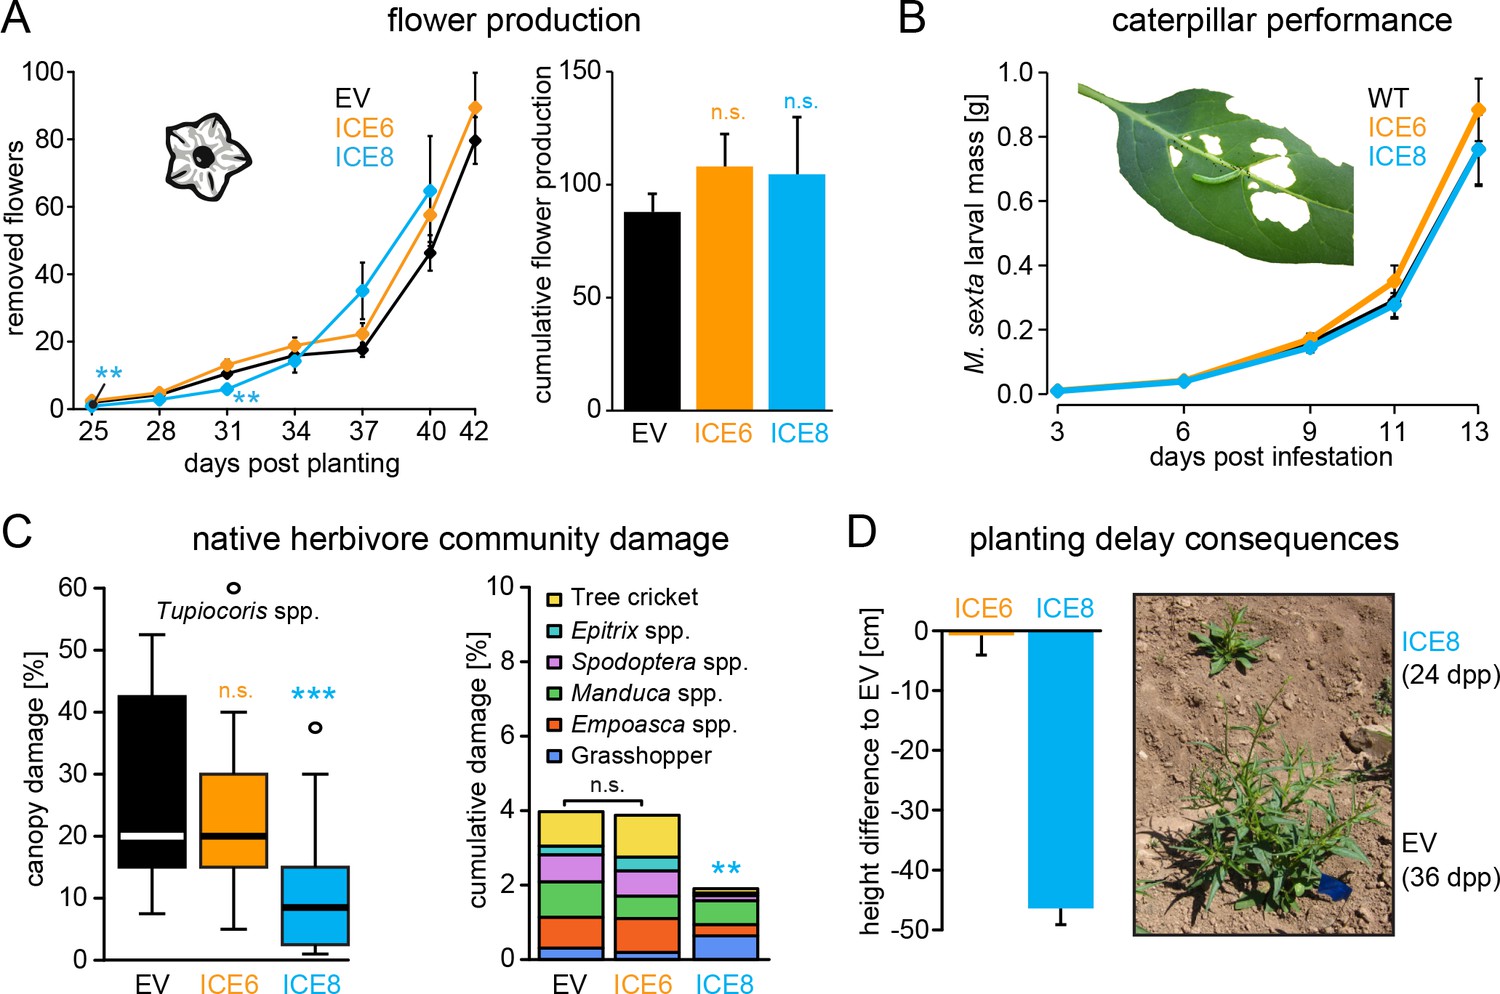
Antimicrobial peptide expression had no negative fitness consequences for field-grown plants.
N. attenuata ICE-lines were compared with empty vector controls (EV) in a field experiment at the Lytle ranch preserve Utah (USA). (A) Elongated flowers and flower buds were removed before opening in a three-day interval and normalized against days post planting to compensate the planting delay of 12 days for the ICE 8 plants. For the cumulative flower production all removed flowers per genotype were summed from 25 to 40 dpp (±SEM, n = 20 plants; Mann-Whitney U Test following Kruskal-Wallis Test: **p≤0.01, n.s. = not significant). (B) Larval performance of the tobacco hornworm (Manduca sexta) did not differ in WT and transgenic ICE lines in the glasshouse (±SEM, n = 18–22 larvae). (C) Herbivore damage from the native herbivore community did not differ among EV and ICE 6 plants. The graphs show the estimated % canopy damage averaged from the assessments of two independent researchers (±SEM, n = 20 plants). Except for the sap-sucking herbivore Tupiocoris spp. (Heteroptera: Miridae) most herbivores showed damage with low abundance (<1%). The median is shown as the centered line, limited by the 25th and 75th percentiles and 1.5 times extended whiskers after Tukey. Only line ICE 8 (planted with delay) showed significantly less herbivore damage compared to EV (Mann-Whitney U test following Kruskal-Wallis Test; **p≤0.01; ***p≤0.001). (D) At the time of the herbivore screening ICE 8 and EV plants showed an average height difference of 46.5 cm (±2.7 cm) due to the delay in planting, EV and ICE 6 plants did not differ.
Figure 4—figure supplement 1
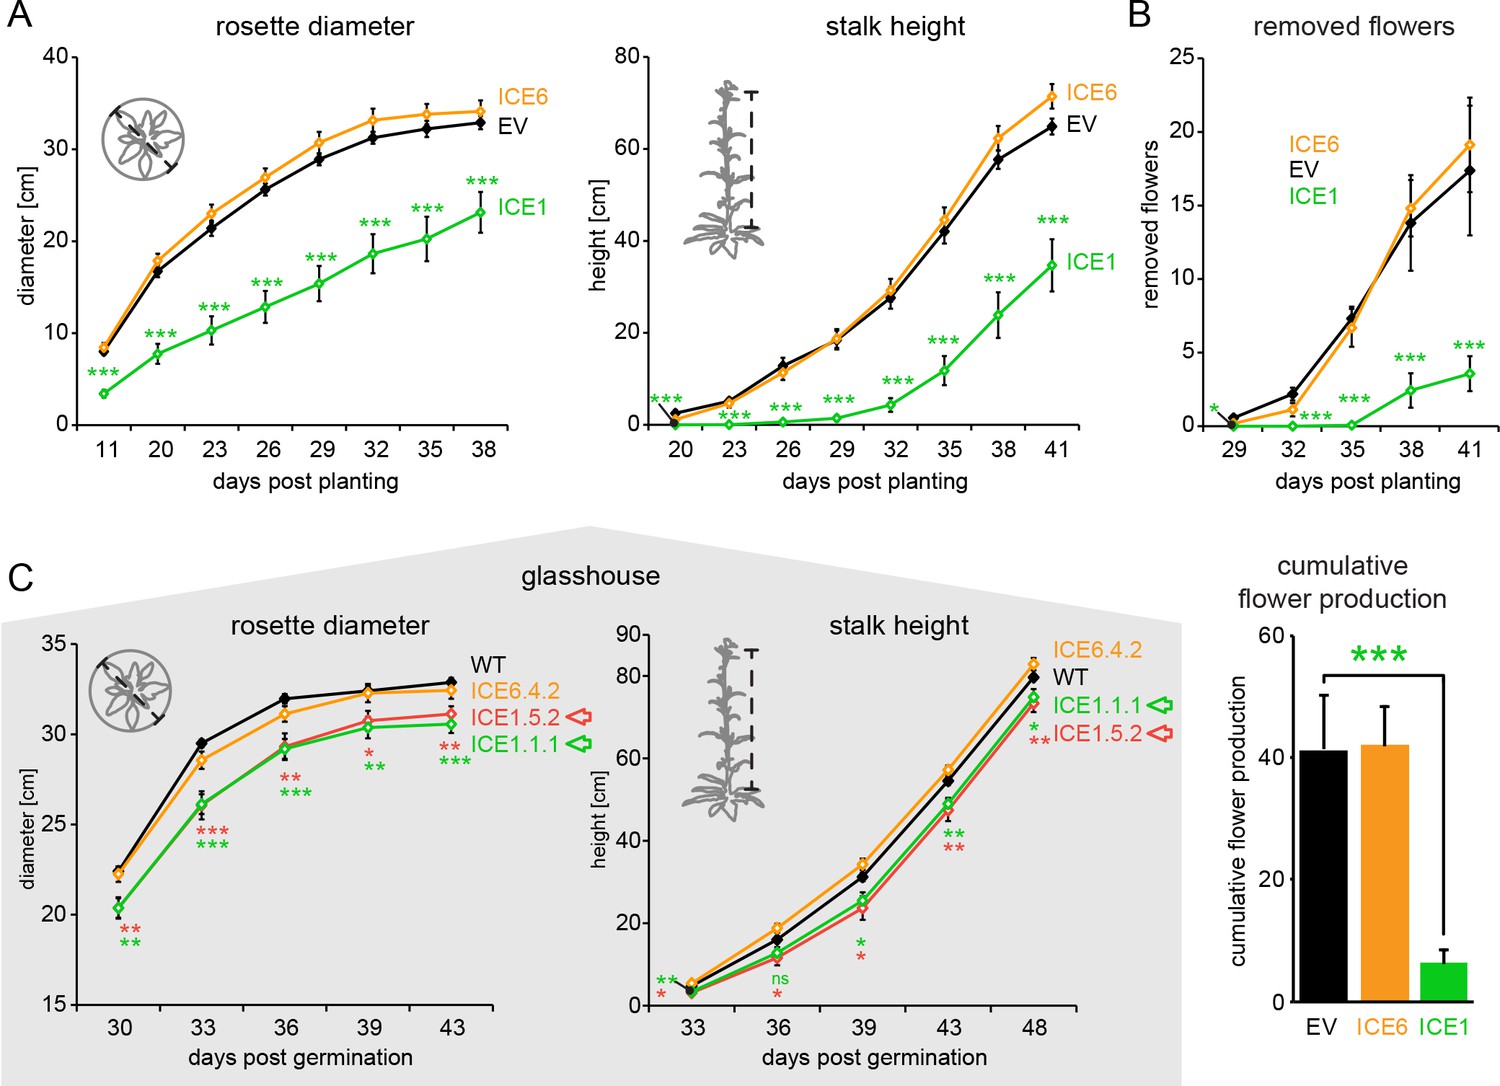
Off-target effects of the plant transformation process dominate growth performance of line ICE 1.
Growth comparisons of transgenic N. attenuata ICE 1 and ICE 6 in the field and the glasshouse. (A) During the first field season, ICE 1 plants showed a severe reduction in rosette diameters and stalk heights compared to the controls (EV) (±SEM, n = 14–16 plants). Asterisks indicate statistically significant differences. (Mann-Whitney U Test, following Kruskal-Wallis Test; ***p≤0.001). (B) Elongated flowers and flower buds were removed and counted every 3 d before opening. For total flower numbers, the cumulative flower productions per genotype was summed from 29 to 41 d post planting (dpp). ICE 1 showed significant reductions in flower numbers. Asterisks indicate statistically significant differences to the controls (Mann-Whitney U Test; ***p≤0.001) (C) Glasshouse experiments comparing diameter and stalk height of transgenic plants to WT controls. Both ICE 1 lines (from a single regeneration event) showed a minor reduction in growth (red and green arrow) (±SEM, n = 8 plants, WT and ICE 6 n = 16). Asterisks indicate statistically significant differences compared to the controls (Mann-Whitney U Test, following Kruskal-Wallis Test; *p≤0.05; **p≤0.01; ***p≤0.001).
Figure 4—figure supplement 2

Growth performance of transgenic N. attenuata ICE 6 and ICE 8 lines did not differ from the controls in the field.
Growth performances of N. attenuata ICE-lines were compared with empty vector controls (EV) in a field experiment at the Lytle ranch preserve Utah (USA). (A) Due to a mishap in germination the ICE 8 plants had been planted with a delay of 12 d compared to the controls and all growth parameters were normalized against days post planting (dpp), as illustrated with the rosette diameter. (B) Normalized rosette diameter and stalk heights of the transgenic plants showed no difference to the controls (±SEM, n = 20 plants). (C) The plant shoot and root fresh biomass was determined 43 dpp and did not differ in the ICE 6 plants compared to the controls (±SEM, n = 20 plants) (Mann-Whitney U test p>0.3, n.s. = not significant).
Figure 5
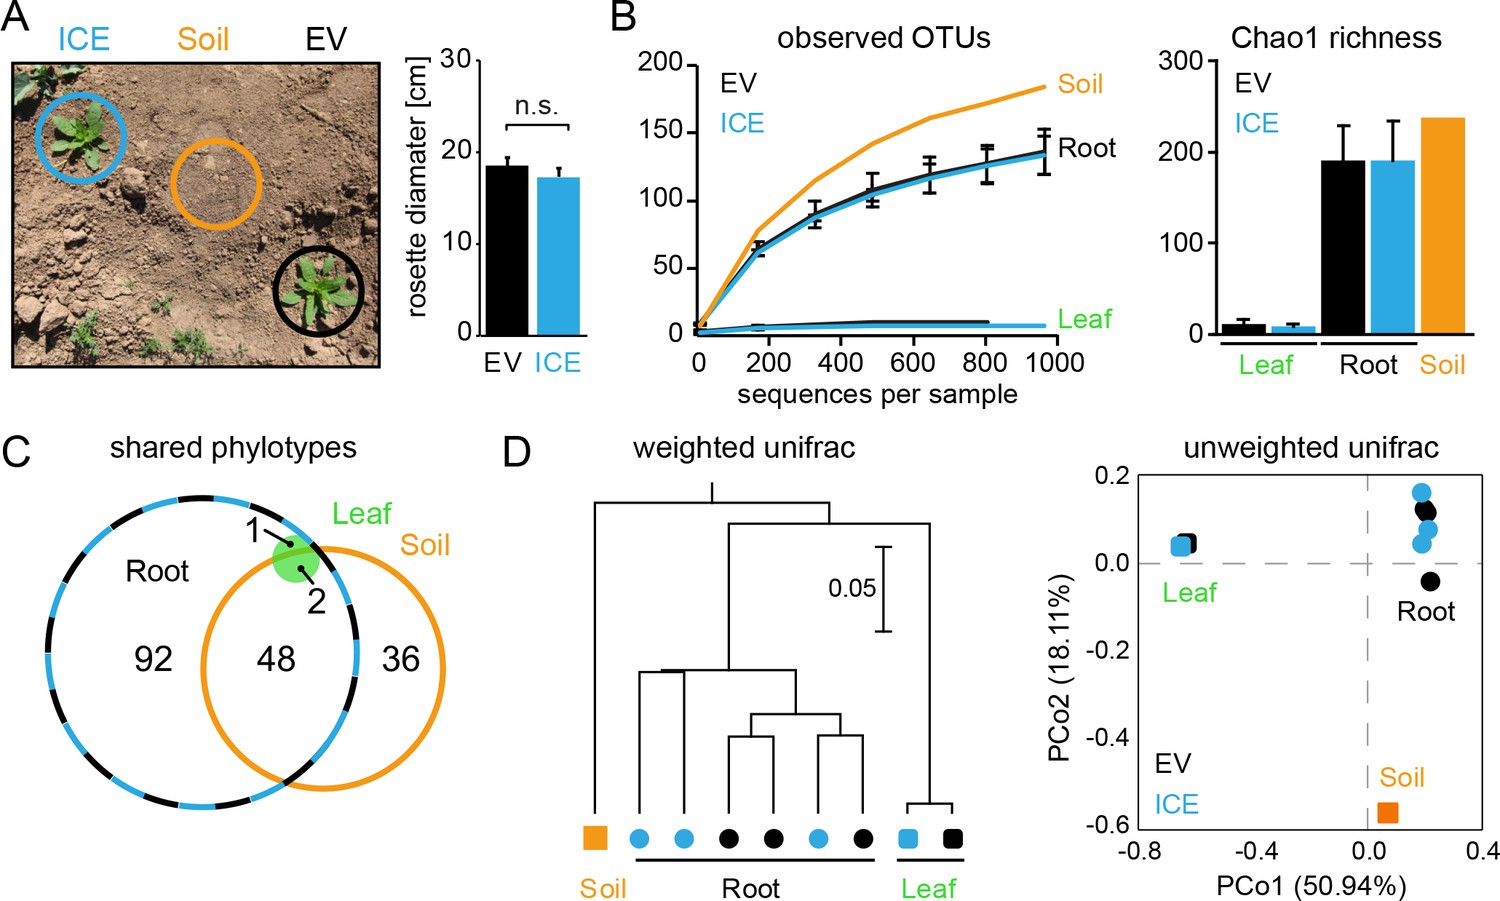
Bacterial communities from field-grown plants showed differences in species richness between the root and the leaf compartments.
(A) Empty vector control (EV) and ICE 8 plants were planted in a paired design at the field plot on the Lytle Ranch Preserve in Utah (USA). Plant pairs showed equal growth and were harvested during the rosette stage of growth (22 dpp). Leaf and root samples were analyzed for the pilot sequencing as pooled samples from five individual plants compared to bulk soil. (B) Alpha diversity measures of the bacterial communities in the pilot sequencing showed an extreme low species richness within the leaf compartment (EV = black, ICE 8 = blue). For subsequent analyses, all samples were rarefied to 800 reads per sample (excluding low coverage leaf samples). (C) Venn diagram showing the shared phylotypes (genus level) of the rarefied communities (areas proportional). (D) Bacterial communities from roots were distinct from leaf and bulk soil as shown by hierarchical clustering by the Unweighted Pair Group Method with Arithmetic Mean (UPGMA) and principal coordinates analysis (PCoA) using the weighted and unweighted UniFrac as a distance measure.
Figure 6 with 3 supplements
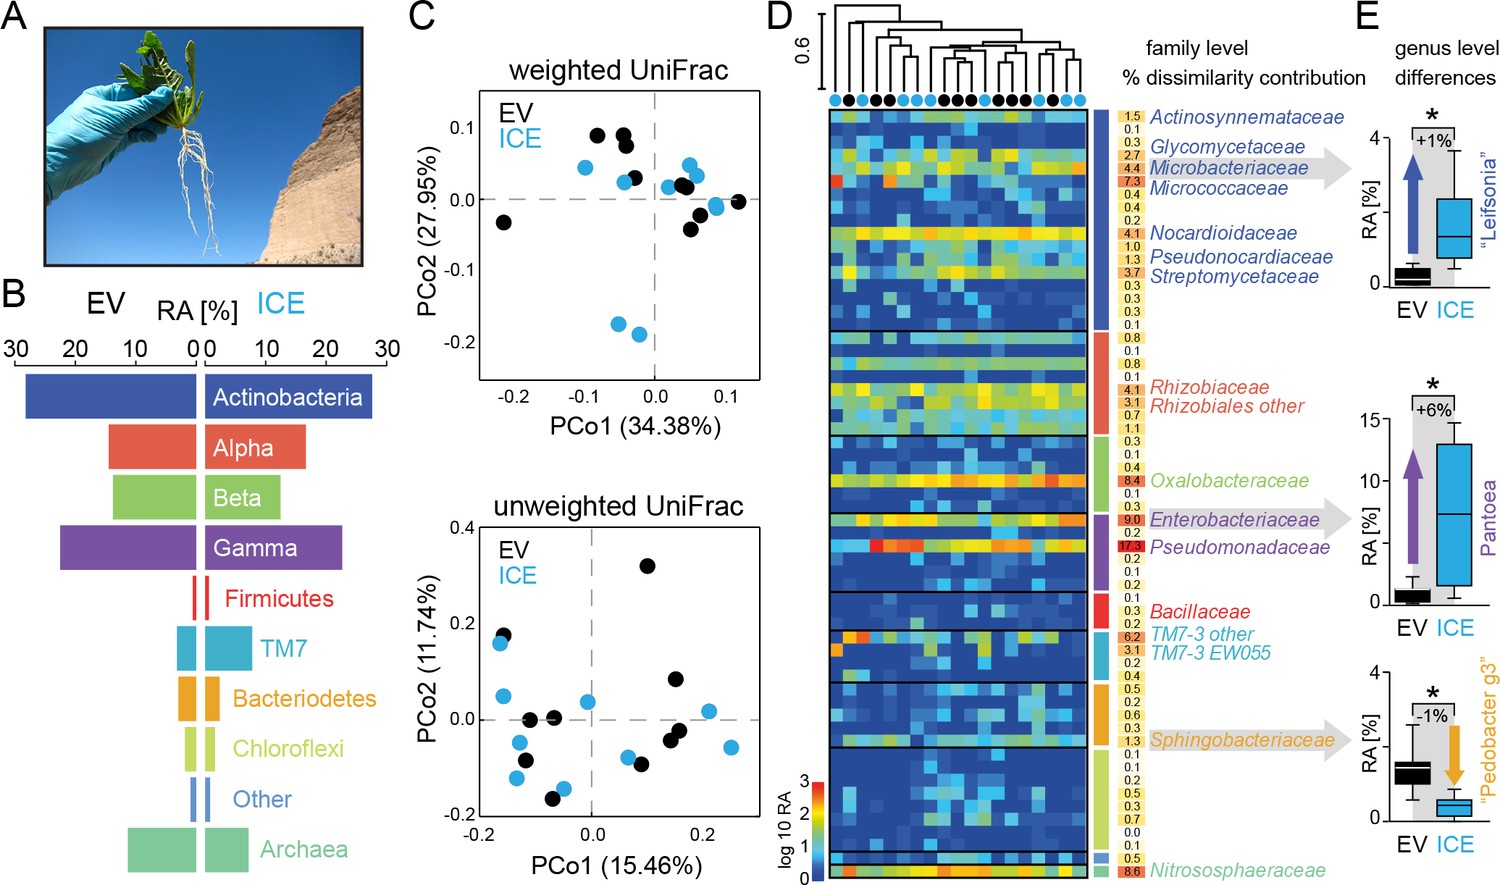
The overall composition of the root-associated microbial communities from field-grown plants did not differ between genotypes and showed marginal effects at the genus level.
(A) Root samples from ten equal sized plant pairs of empty vector control (EV) and ICE 8 plants were used for sequencing. (B) Comparison of the relative abundances of the major phyla (respective classes for Protobacteria) of the root-associated microbial communities of field-grown plants. (C) Communities were clustered by principal coordinates analysis (PCoA) using the weighted and unweighted UniFrac as a distance measure (genotype: EV = black, ICE 8 = blue). (D) The filtered community data was used to visualize the distribution of all 59 families in a heatmap showing log10 (+1) transformed abundance. Samples were clustered hierarchically by UPGMA based on Bray–Curtis dissimilarity. Similarity percentage analysis (SIMPER) was performed to evaluate sample dissimilarity contribution [%] for each family based on their relative abundance. Only families with >1% dissimilarity contribution are indicated by name. Color coding of the bars indicate higher phyla and classes as used in B. (E) Group significance tests revealed significant differences between control and antimicrobial peptide expressing plants at the genus level for ‘Leifsonia’ (Microbacteriaceae), Pantoea (Enterobacteriaceae) and ‘Pedobacter_g3’ (Sphingobacteraceae) (non-parametric t-test, *p<0.05 after correcting for a false discovery rate of 10%).
-
Figure 6—source data 1
Group significance comparisons from phylum to genus level.
- https://doi.org/10.7554/eLife.28715.018
Figure 6—figure supplement 1
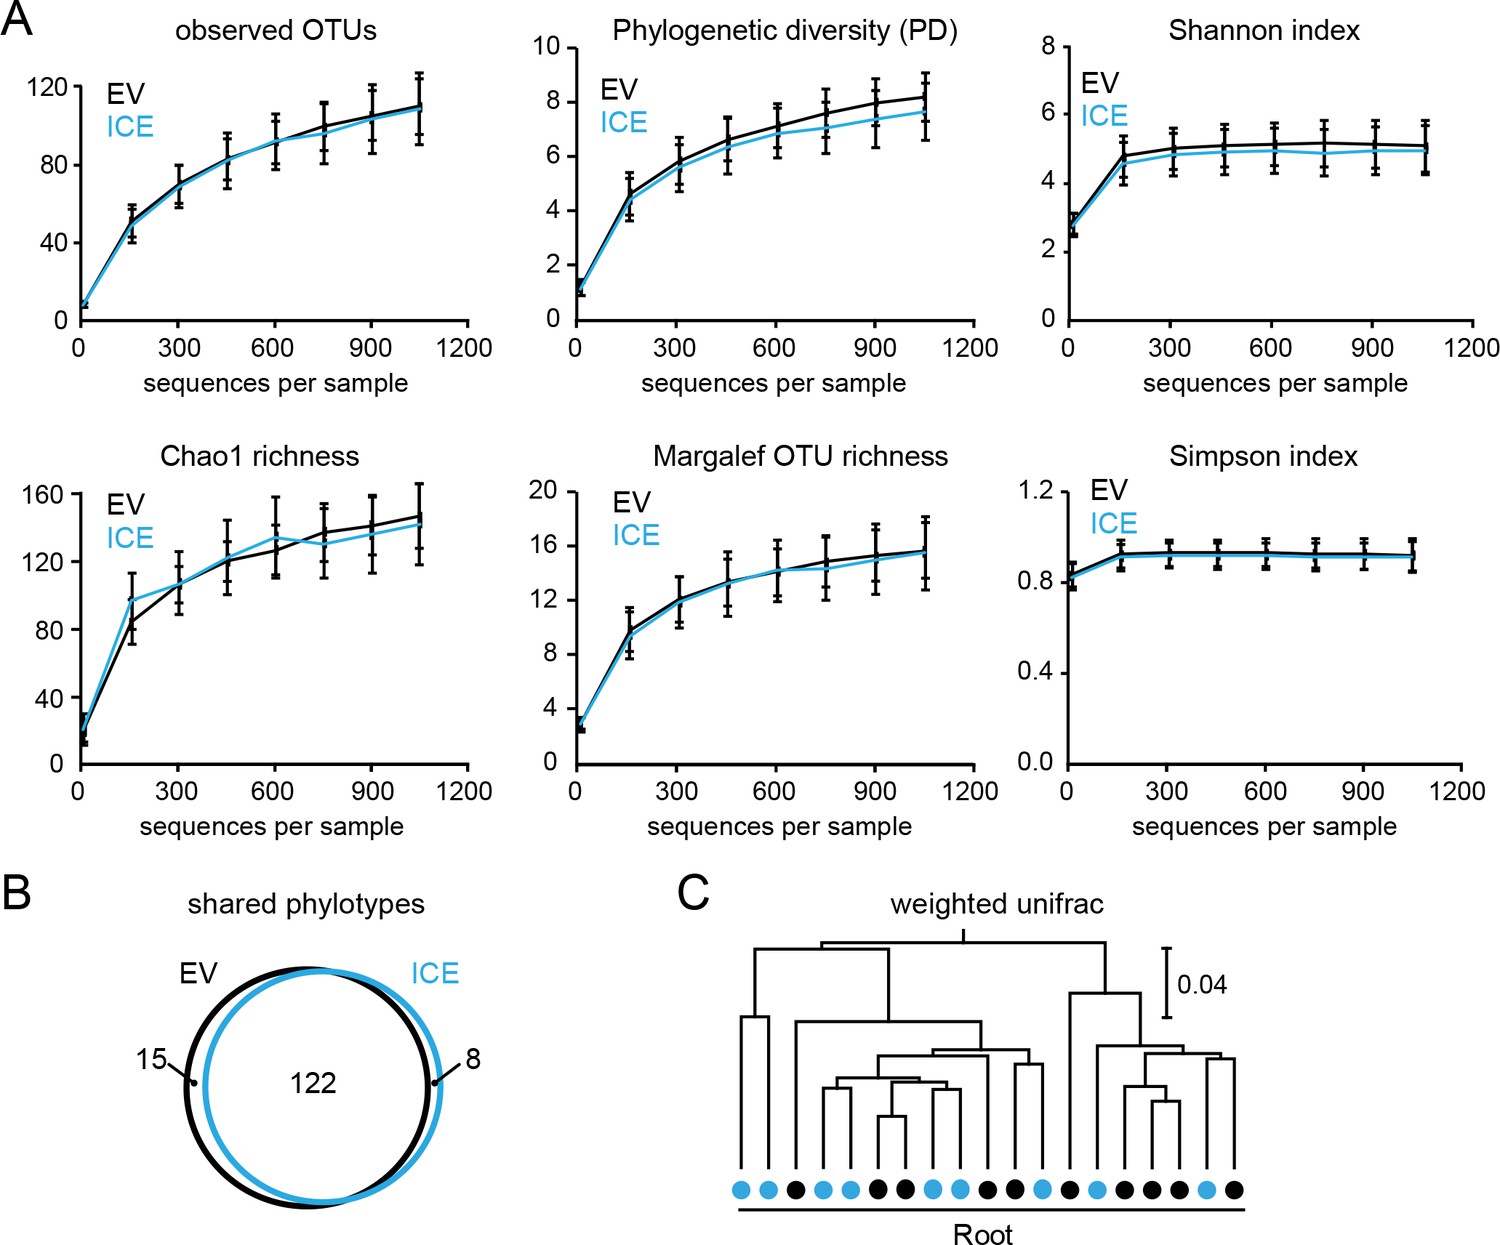
Diversities of the root-associated microbial communities did not differ between genotypes in field-grown plants.
(A) Rarefaction analysis of the root-associated microbial communities using different alpha diversity measures indicates no genotype differences (EV = black, ICE 8 = blue). (B) Venn diagram showing the shared phylotypes (genus level) of the rarefied root communities (areas proportional). (C) Hierarchical clustering of the root-associated communities from ten individual plant pairs using the weighted UniFrac as a distance measure indicates no separation by genotype (EV = black, ICE 8 = blue).
Figure 6—figure supplement 2
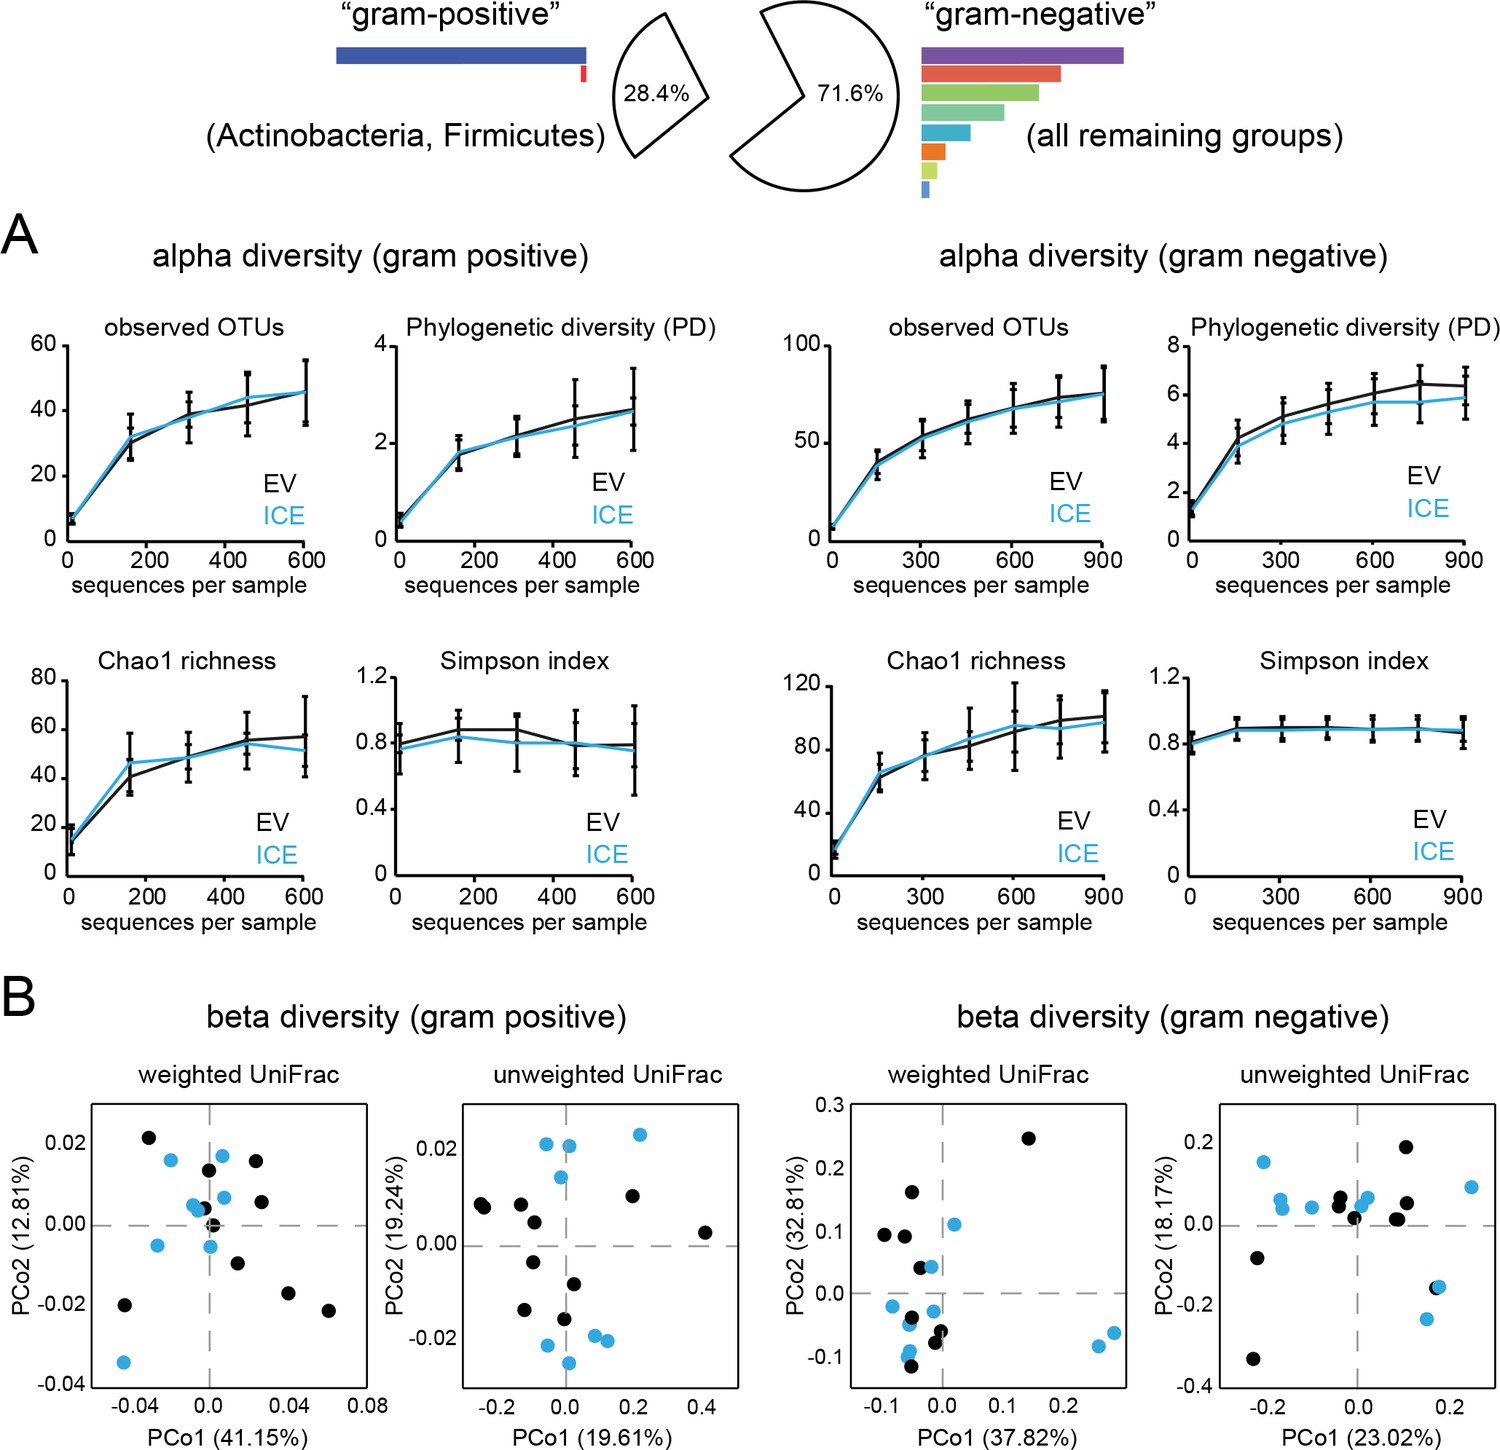
Diversity analysis of the root-associated microbial communities from field-grown plants separated by gram type.
The root-associated communities were divided into ‘gram-positive’ (Actinobacteria and Firmicutes) and ‘gram-negative’ taxa (all remaining groups) for separate analysis. (A) Rarefaction analysis of the root-associated microbial communities separated by gram-positive and gram-negative groups using different alpha diversity measures. (B) Beta diversity as principal coordinates analysis (PCoA) using the weighted and unweighted UniFrac as a distance measure (EV = black, ICE 8 = blue).
Figure 6—figure supplement 3
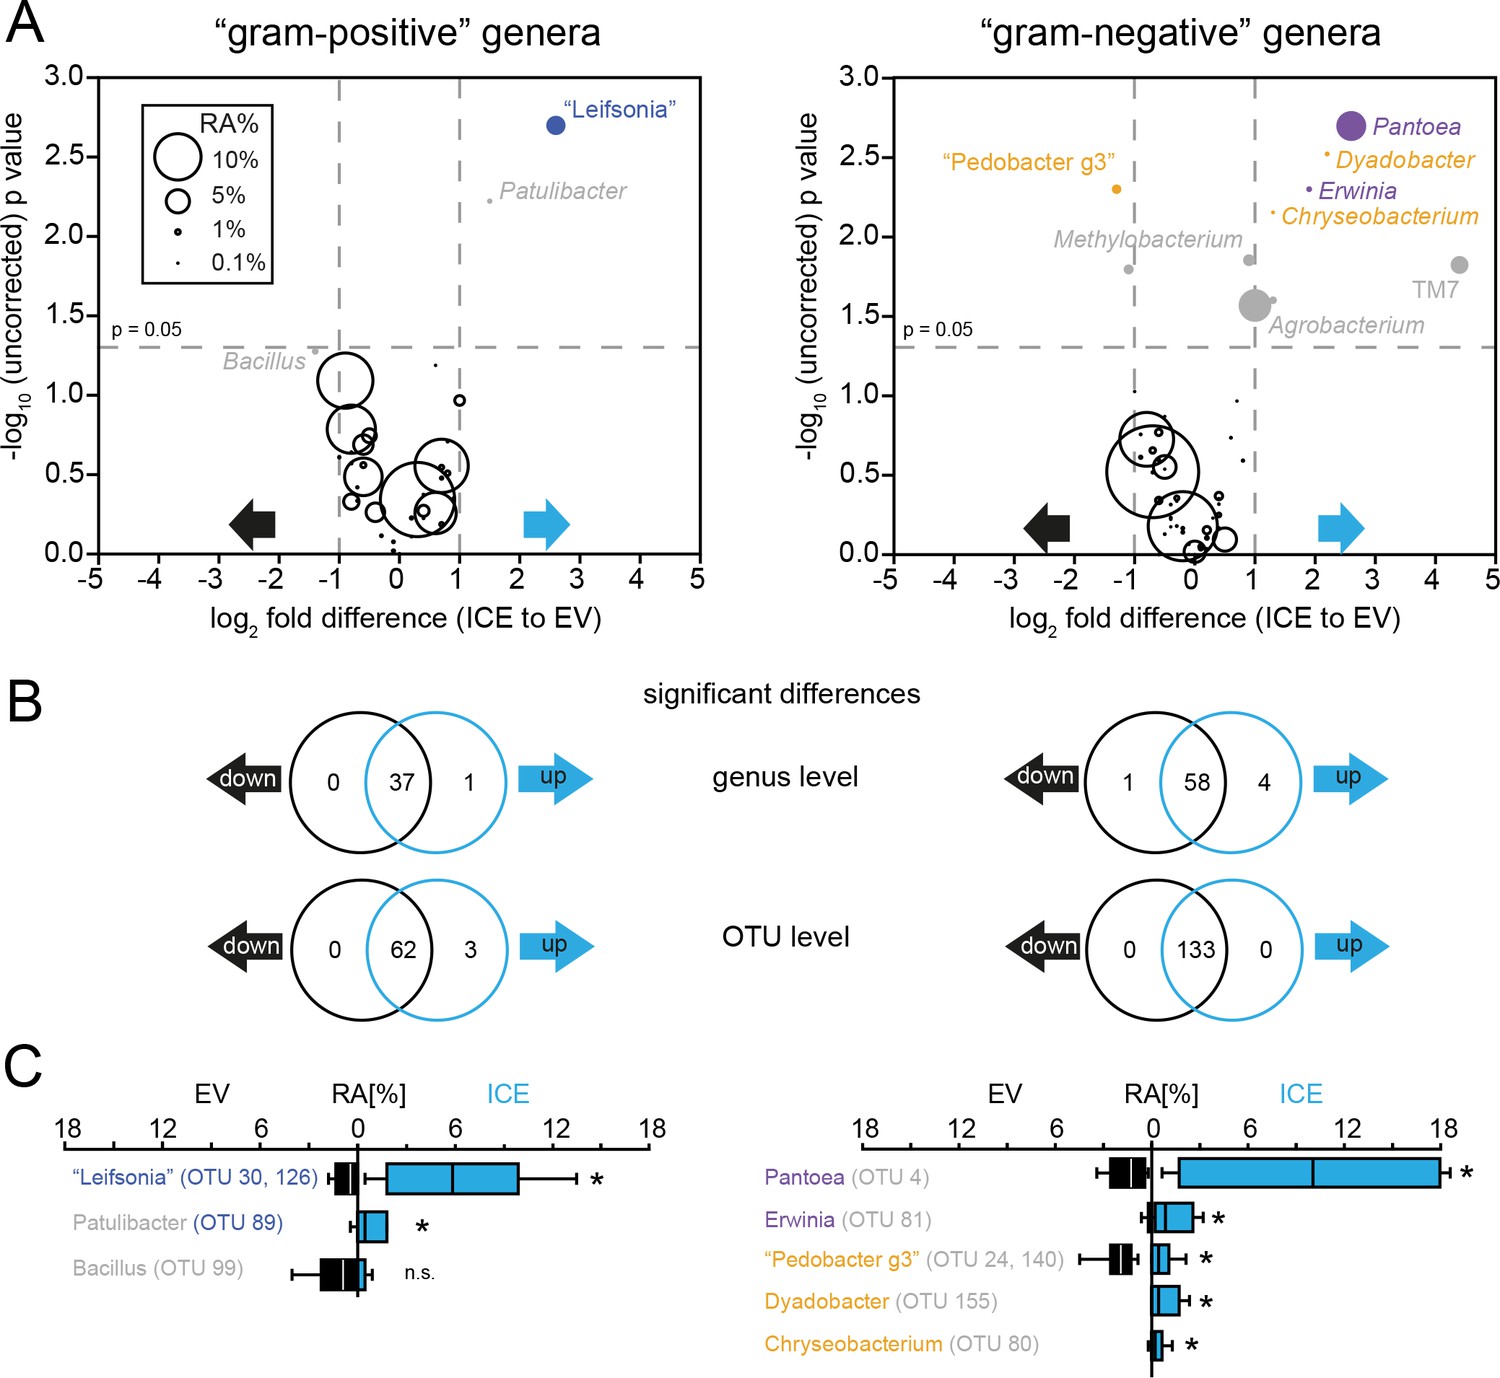
Genotype differences of the root-associated communities at genus and OTU level separated by gram type.
(A) Volcano plot showing genera with differences in relative abundance among the genotypes on the x-axis (as log2 fold difference) and the -log10 (uncorrected) p value on the y-axis. Bubble size indicates relative abundance averaged from both genotypes. Genera which remained significant after correcting for a false discovery rate (FDR) of 10% are shown in color. Actinobacteria are shown in blue, Gammaproteobacteria in purple and Bacteroidetes in orange. (B) Venn diagrams showing significant differences at genus and at OTU-levels separated by gram type (up and down refers to an increase or decrease in the ICE genotype). (C) Relative abundances of the genera that showed significant differences among the genotypes. Patulibacter was only significant at OTU level. (non-parametric t-test with FDR correction of 10%).
Figure 7 with 3 supplements
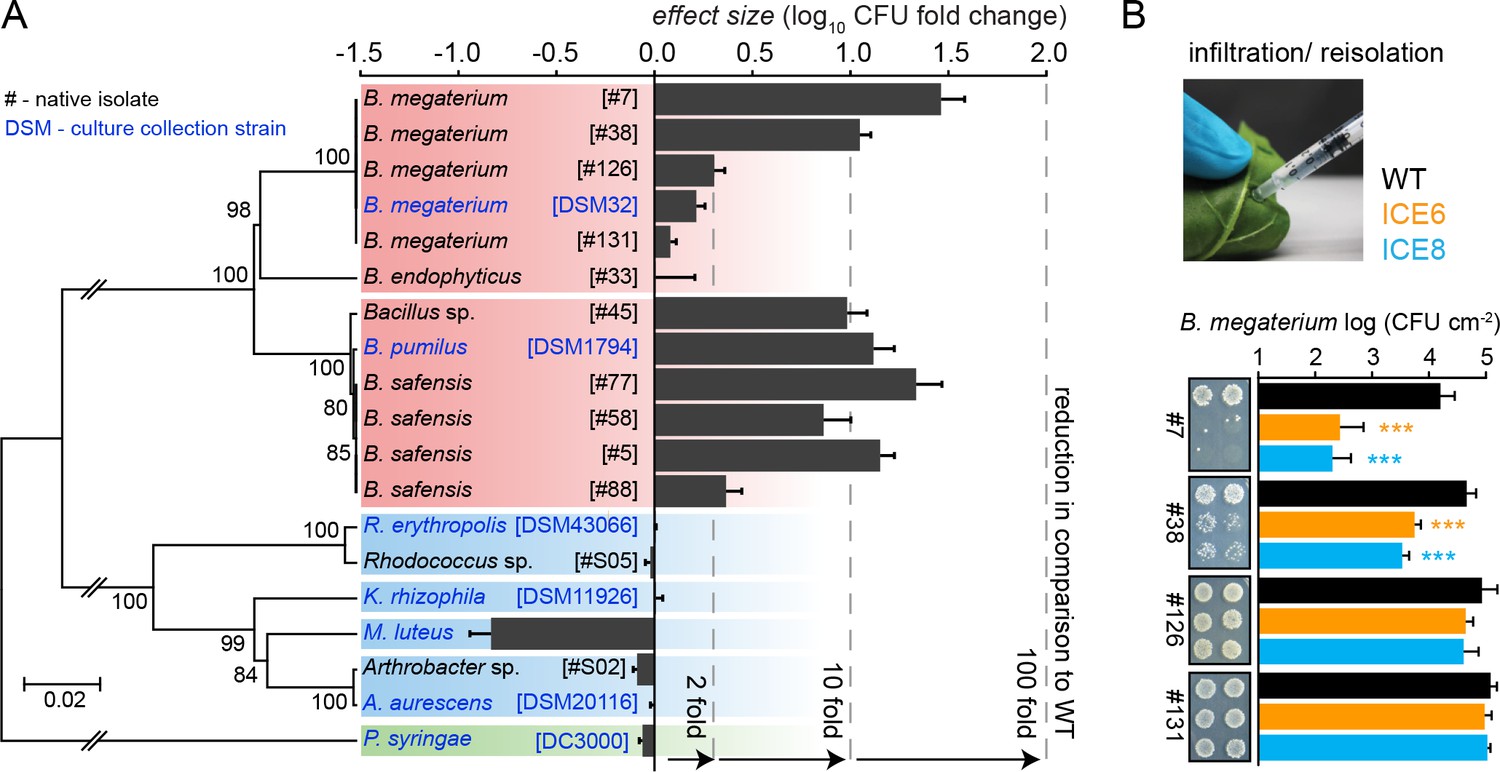
Experimental infiltrations of bacterial isolates from different taxa demonstrate the specificity of the antimicrobial activity.
(A) Summary of the in planta antimicrobial effects obtained by individual infiltrations of bacterial isolates into transgenic and control plants, as shown in Figure 7—figure supplement 1 and Figure 7—figure supplement 2. Bars represent the effect size (averaged log10 CFU fold reduction to WT) calculated by dividing the CFUs obtained from WT by the CFUs obtained from the transgenic plants (ICE 6 and ICE 8) from 2 to 6 dpi or 6 hpi (only B. megaterium). The relative phylogenetic grouping of the bacterial strains is illustrated by a neighbor-joining tree, generated from the alignment of the nearly complete 16S rDNA sequences (Figure 7—source data 1). Bootstrap supported values (1000 replicates) are indicated on individual nodes. The theoretical OTU clustering (97% similarity of the pyrosequencing amplicon) is indicated by the gaps in the background color (Firmicutes in red, Actinobacteria in blue and Proteobacteria in green). (B) Native isolates of Bacillus megaterium showed strain specific susceptibilities to the transgenic plants. Bacteria were injected in the leaves by pressure infiltration and re-isolated after 6 hr (±SD, n = 4 plants). Asterisks indicate statistically significant differences between WT and transgenic plants (students t-test; ***p≤0.001).
-
Figure 7—source data 1
Table of bacterial isolates and culture collection strains used for experimental infiltrations.
- https://doi.org/10.7554/eLife.28715.027
Figure 7—figure supplement 1
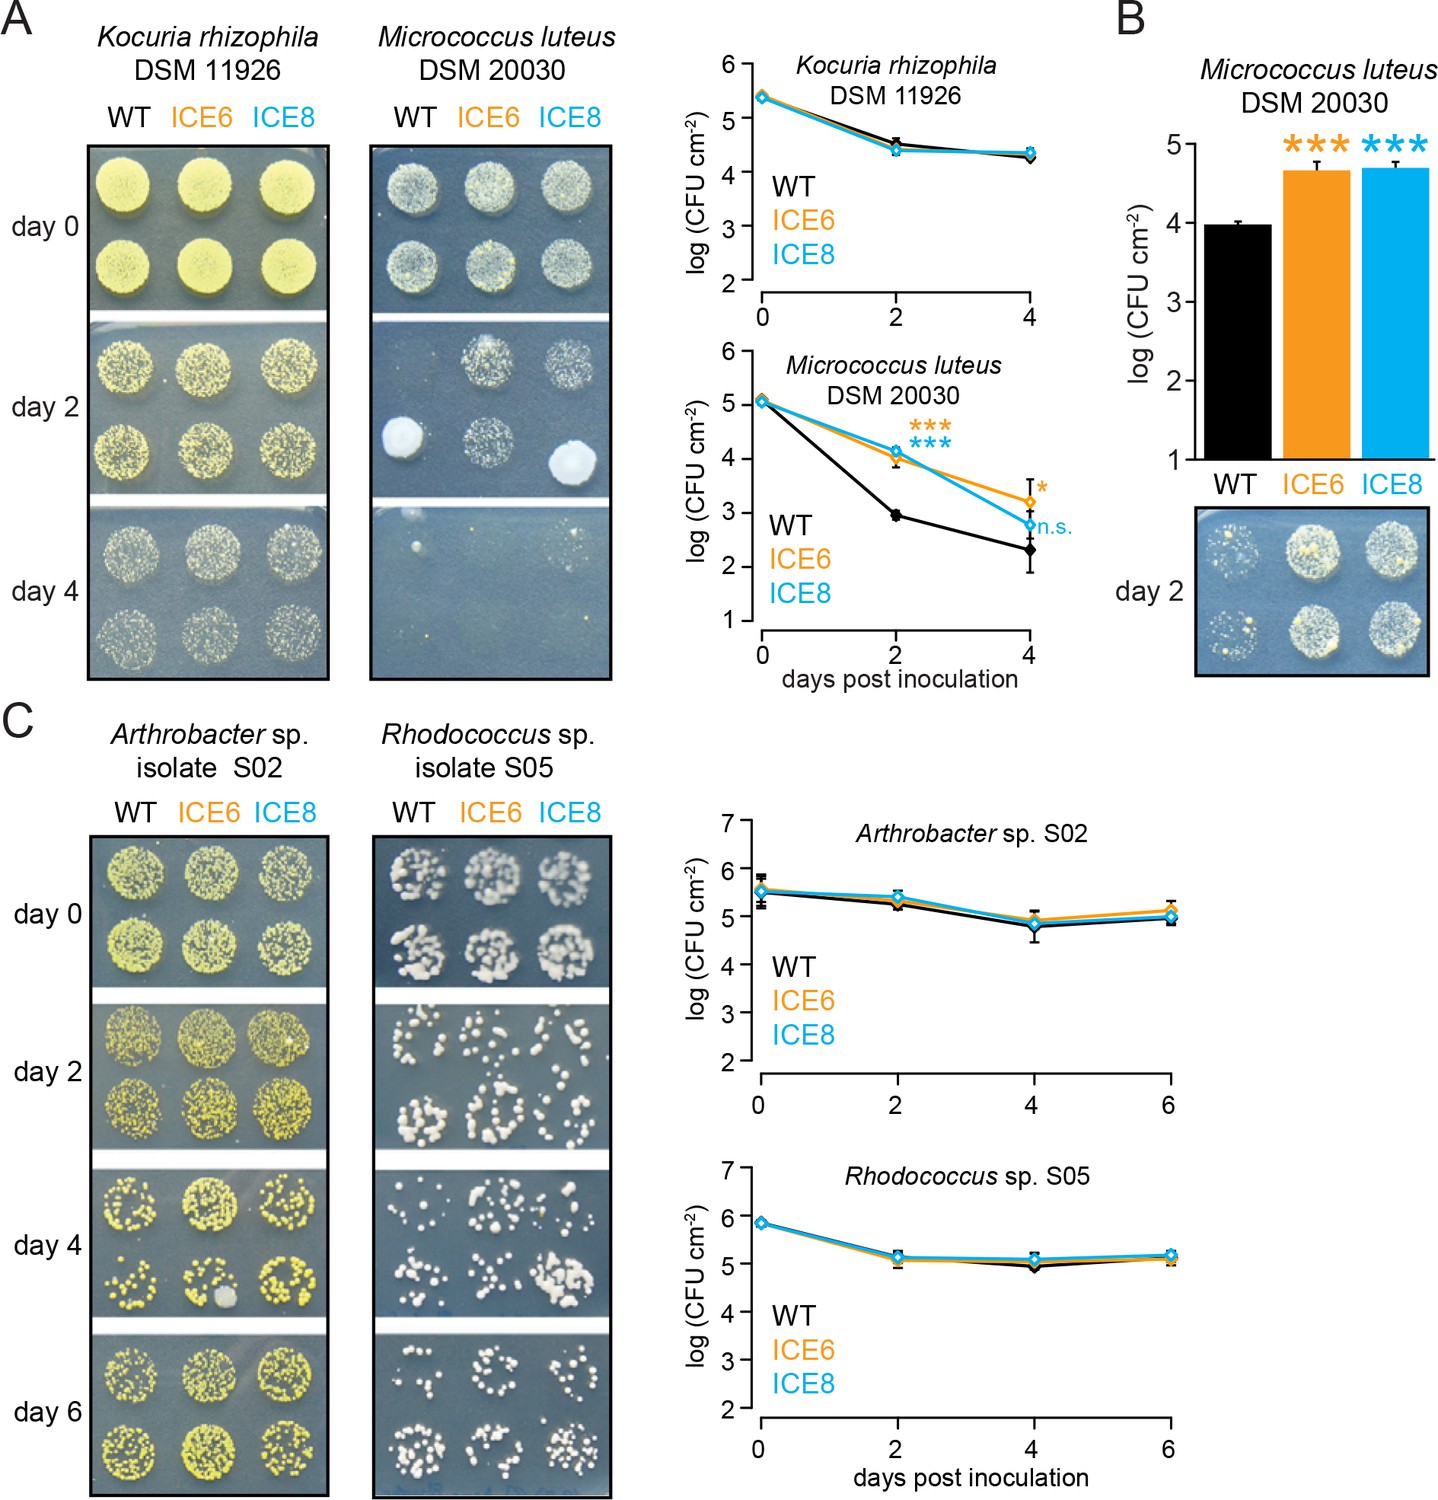
In planta activity of N. attenuata ICE lines against Actinobacteria.
(A) Kocuria rhizophila DSM 11926 and Micrococcus luteus DSM 20030 were injected by pressure infiltration into fully expanded rosette-stage leaves (OD600 = 0.2). The mean colony forming units (CFU) were plotted as log CFU cm−2 leaf area (±SD, n = 4 plants). M. luteus showed a CFU increase in the transgenic lines. Asterisks indicate statistically significant differences between WT and the transgenic plants (students t-test; *p≤0.05; ***p≤0.001; n.s. = not significant). (B) Repetition of the M. luteus infiltration using a higher cell number (OD600 = 0.4) resulting in a similar outcome at 2 dpi with an increased CFU number in the transgenic lines (students t-test; p<0.001). (C) Arthrobacter sp. #S02 and Rhodococcus sp. #S05 isolates were injected by pressure infiltration into fully expanded rosette-stage leaves. The mean colony forming units (CFU) were plotted as log CFU cm−2 leaf area (±SD, n = 4 plants) indicating no CFU reduction for the tested bacteria.
Figure 7—figure supplement 2

In planta activity of N. attenuata ICE lines against Bacillus isolates.
Different endophytic isolates were injected by pressure infiltration into fully expanded rosette-stage leaves and re-isolated at 0, 2, 4 and 6 dpi. The pictures show two technical replicates per genotype and time point. The mean colony forming units (CFU) were plotted as log CFU cm−2 leaf area (±SD, n = 4 plants). Asterisks indicate statistically significant differences between WT and transgenic plants (t-test; *p≤0.05; **p≤0.01; ***p≤0.001; n.s. = not significant). (A) For the isolates of the Bacillus pumilus/safensis clade #5, #58, #77, #45 and #88 the consolidated results indicated stronger CFU fold reductions for line ICE 8 compared to line ICE 6. Dots represent average values at 2–6 dpi with the medians as the centered lines limited by 25th and 75th percentiles and 1.5 times extended whiskers after Tukey (n = 18 sample points; paired t-test; p<0.002). (B) Infiltration of the Bacillus megaterium type strain DSM32, isolates #131 and #38.
Figure 7—figure supplement 3
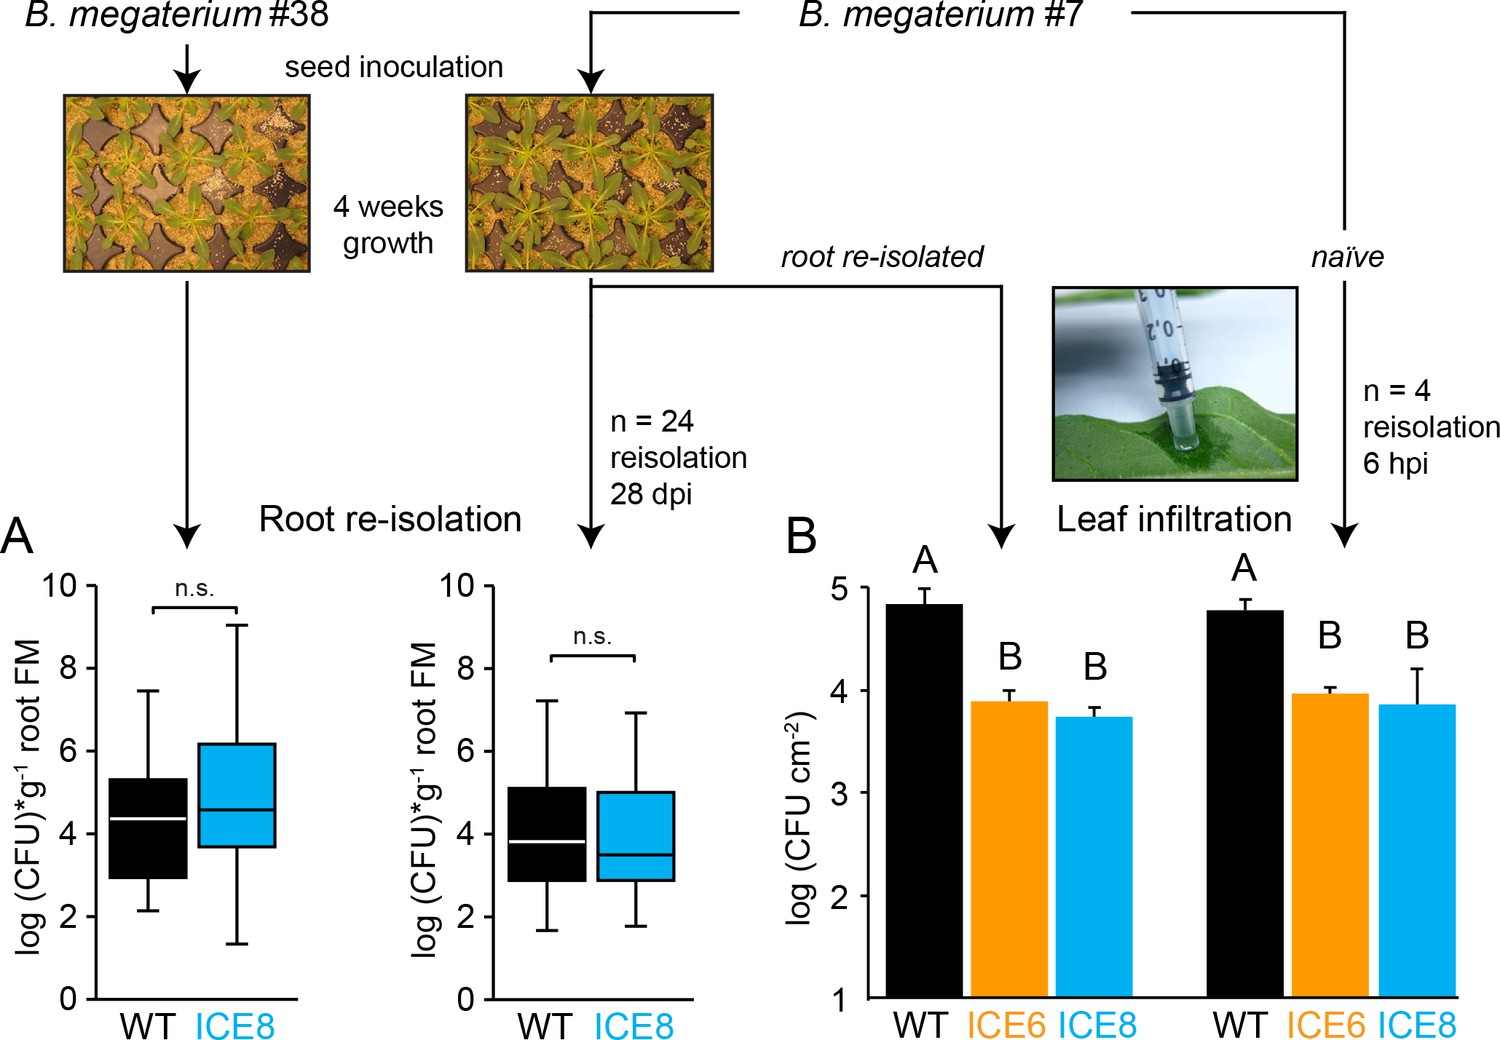
Long-term inoculations showed no difference in root colonization for B. megaterium nor evidence of AMP resistance development in the transgenic plants.
(A) Surface sterilized seeds were inoculated overnight in bacterial solution (B. megaterium isolate #38 or isolate #7 OD600 1.0). Plants were grown in sand and bacteria re-isolated at 28–30 days post inoculation (dpi) from surface sterilized roots (n = 24 plants). The median is shown as the centered line, limited by the 25th and 75th percentiles and 1.5 times extended whiskers after Tukey. (n.s. = not significant, Mann-Whitney U Test). (B) To test if bacteria might develop peptide tolerance, the root re-isolated strain (grown for 4 weeks within the transgenic plants) was re-infiltrated into leaves and re-isolated 6 hr post infiltration (hpi) (±SD, n = 4 plants). The re-isolated strain showed no differences to the naïve strain. Different letters indicate significant differences (p≤0.05, Mann-Whitney U Test, following Kruskal-Wallis Test).
Additional files
-
Transparent reporting form
- https://doi.org/10.7554/eLife.28715.022
Download links
A two-part list of links to download the article, or parts of the article, in various formats.
Downloads (link to download the article as PDF)
Open citations (links to open the citations from this article in various online reference manager services)
Cite this article (links to download the citations from this article in formats compatible with various reference manager tools)
Antimicrobial peptide expression in a wild tobacco plant reveals the limits of host-microbe-manipulations in the field
eLife 7:e28715.
https://doi.org/10.7554/eLife.28715


