Cerebral mGluR5 availability contributes to elevated sleep need and behavioral adjustment after sleep deprivation
- University of Zürich, Switzerland
- University of Lausanne, Switzerland
- University Hospital Zürich, Switzerland
- Center for Radiopharmaceutical Sciences of ETH, Switzerland
- Paul Scherrer Institut, Switzerland
- University Hospital of Zürich, Switzerland
- Psychiatric Hospital, University of Zürich, Switzerland
- University of Zürich and ETH Zürich, Switzerland
Figures
Figure 1

Sleep deprivation and imaging protocol and representative 1H-MR spectroscopy.
(A) Randomized, cross over study design, with PET imaging after 9 and 33 hr of wakefulness. MR-spectroscopy was performed directly after PET, with a delay of 45–100 min. Polysomnographic recordings of 8 hr baseline and recovery nights are illustrated by red boxes. (B–C) Prototypical projections in one representative healthy individual of two-dimensional J-resolved single-voxel 1H-magnetic resonance spectroscopy spectra acquired in the bilateral pregenual anterior cingulate cortex (pgACC; red overlay) in sleep control (B) and sleep deprived (C) condition. Red lines represent the Profit 2.0 model fit, blue lines raw data, and the green lines the residuals (error). Gly: Glycine, mi: myo-inositol, Cho: choline, Cr: total creatine and phosphocreatine, Gln: glutamine, Glu: glutamate, GABA: gamma-Aminobutyric acid, NAA: N-acetylaspartate.
Figure 2 with 3 supplements
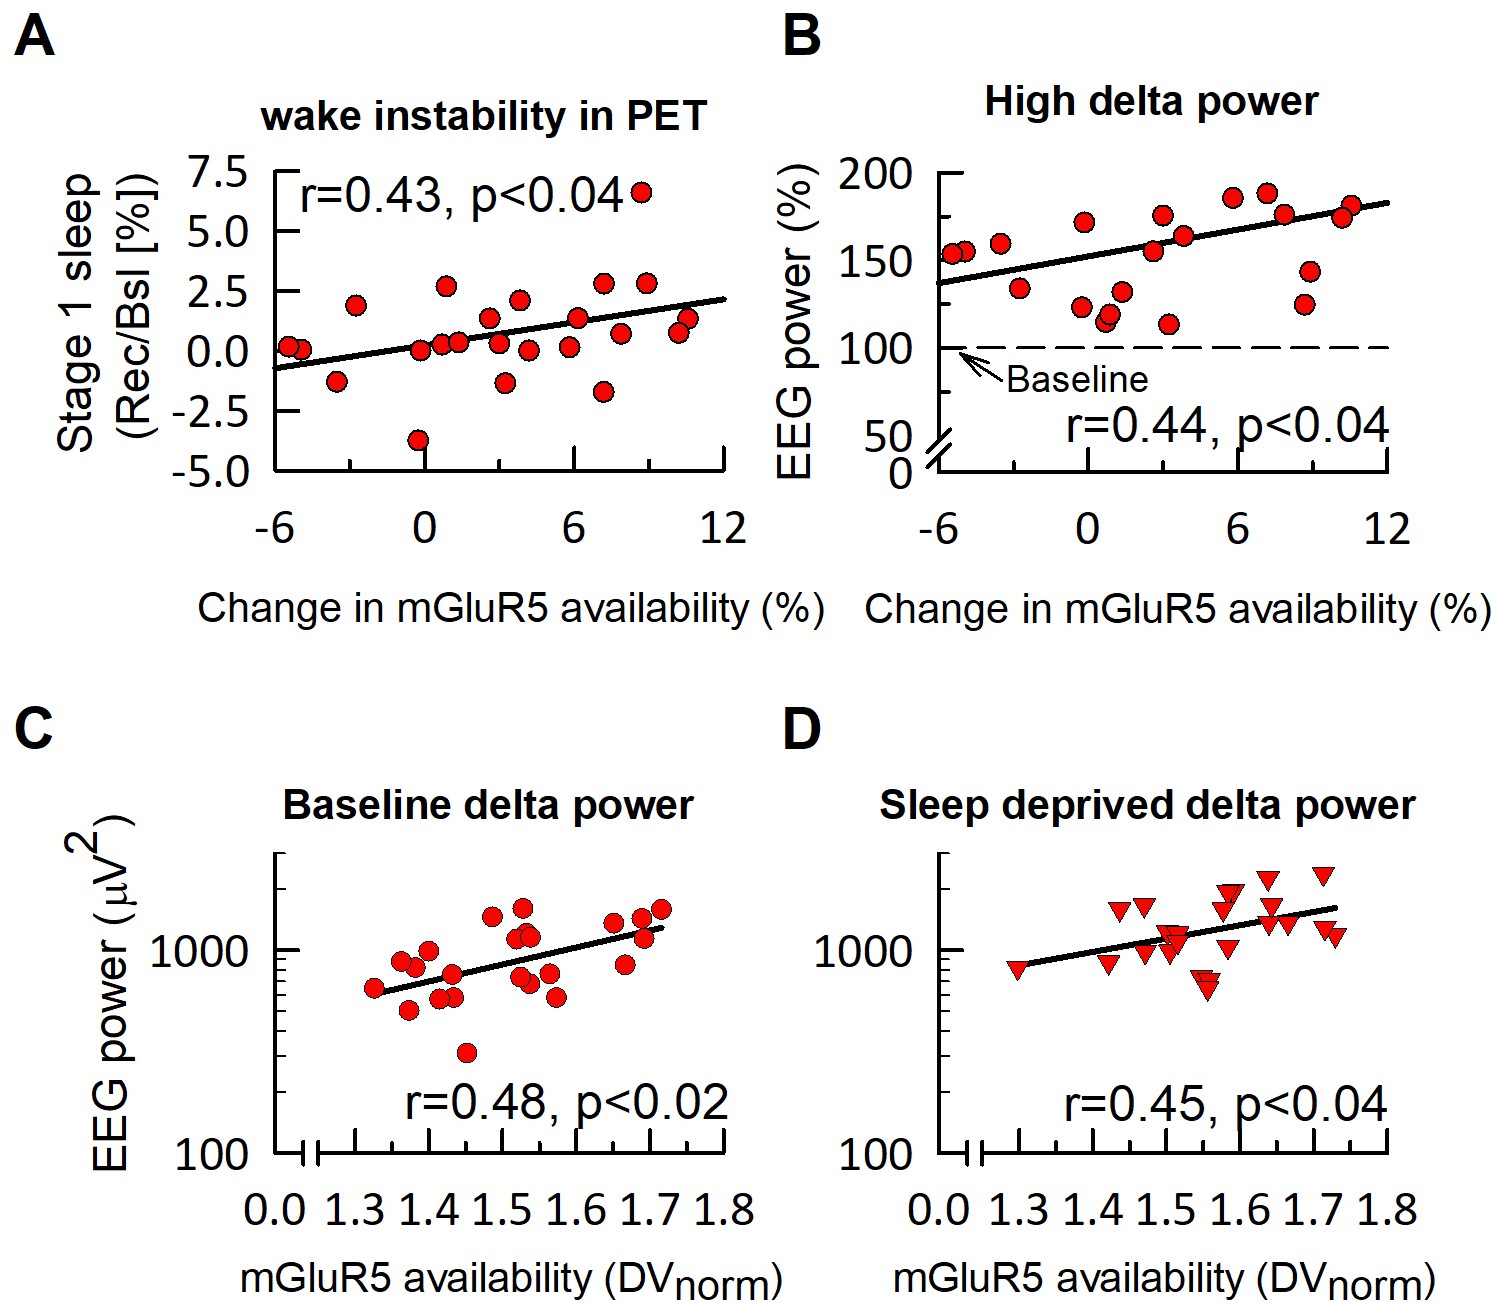
mGluR5 availability in humans is associated with EEG delta activity in NREM sleep.
The relative change in global mGluR5 availability after sleep deprivation is significantly associated with the increase in intermittent stage one sleep (‘wake instability’) during PET imaging (A) and 2–4 Hz (‘high delta’) activity in subsequent NREM sleep in the recovery night (B). In both, baseline (C) and sleep deprivation (D) conditions, EEG delta activity (0.5–4.5 Hz, log scale) in the first NREM episode is positively associated with global mGluR5 availability. Statistics indicate Spearman rank correlation coefficients (r).
Figure 2—figure supplement 1
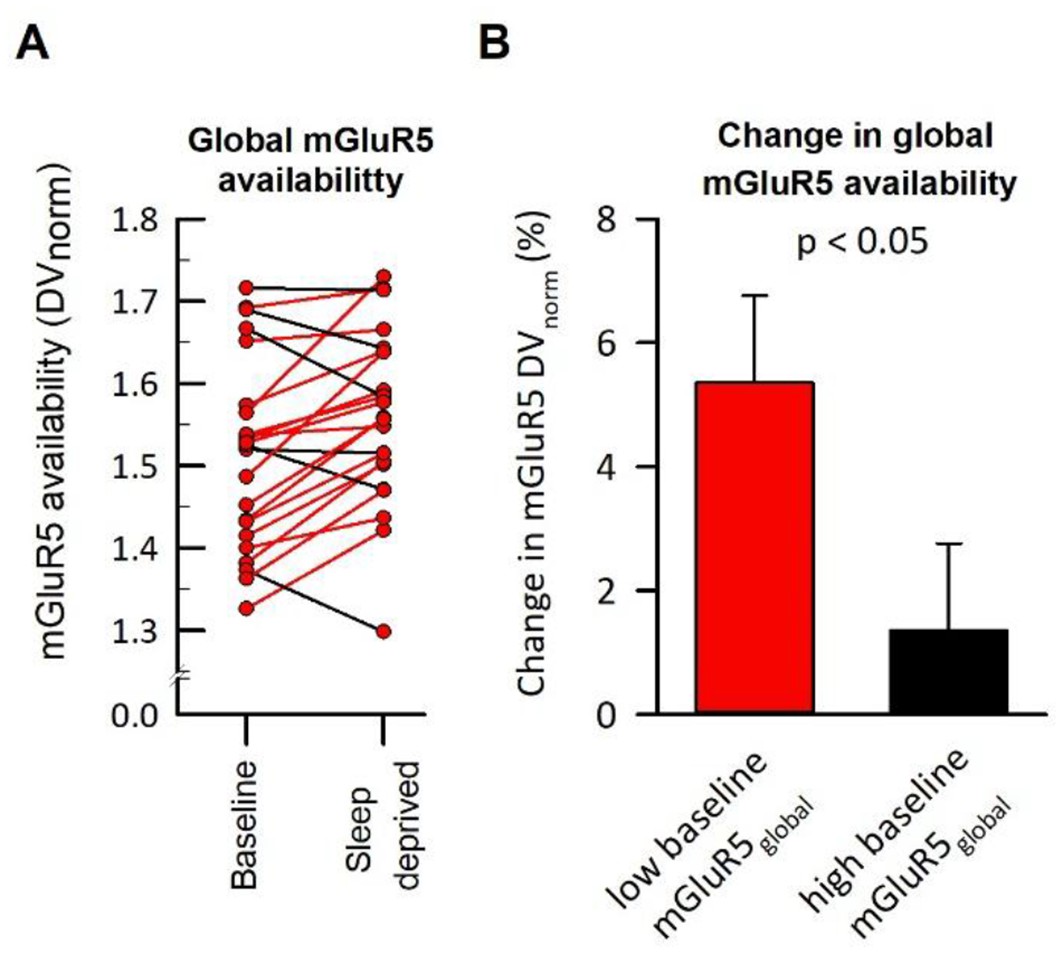
Individual change in mGluR5 availability as a function of baseline mGluR5 expression.
(A) The individual global mGluR5 availability at baseline and sleep deprivation. (B) The change in mGluR5 by sleep deprivation, plotted in subjects stratified by median split as either expressing low (n = 11) or high (n = 12) global mGluR5 availability at baseline. Statistics: two-sided t-test (t21 = −2.18).
Figure 2—figure supplement 2
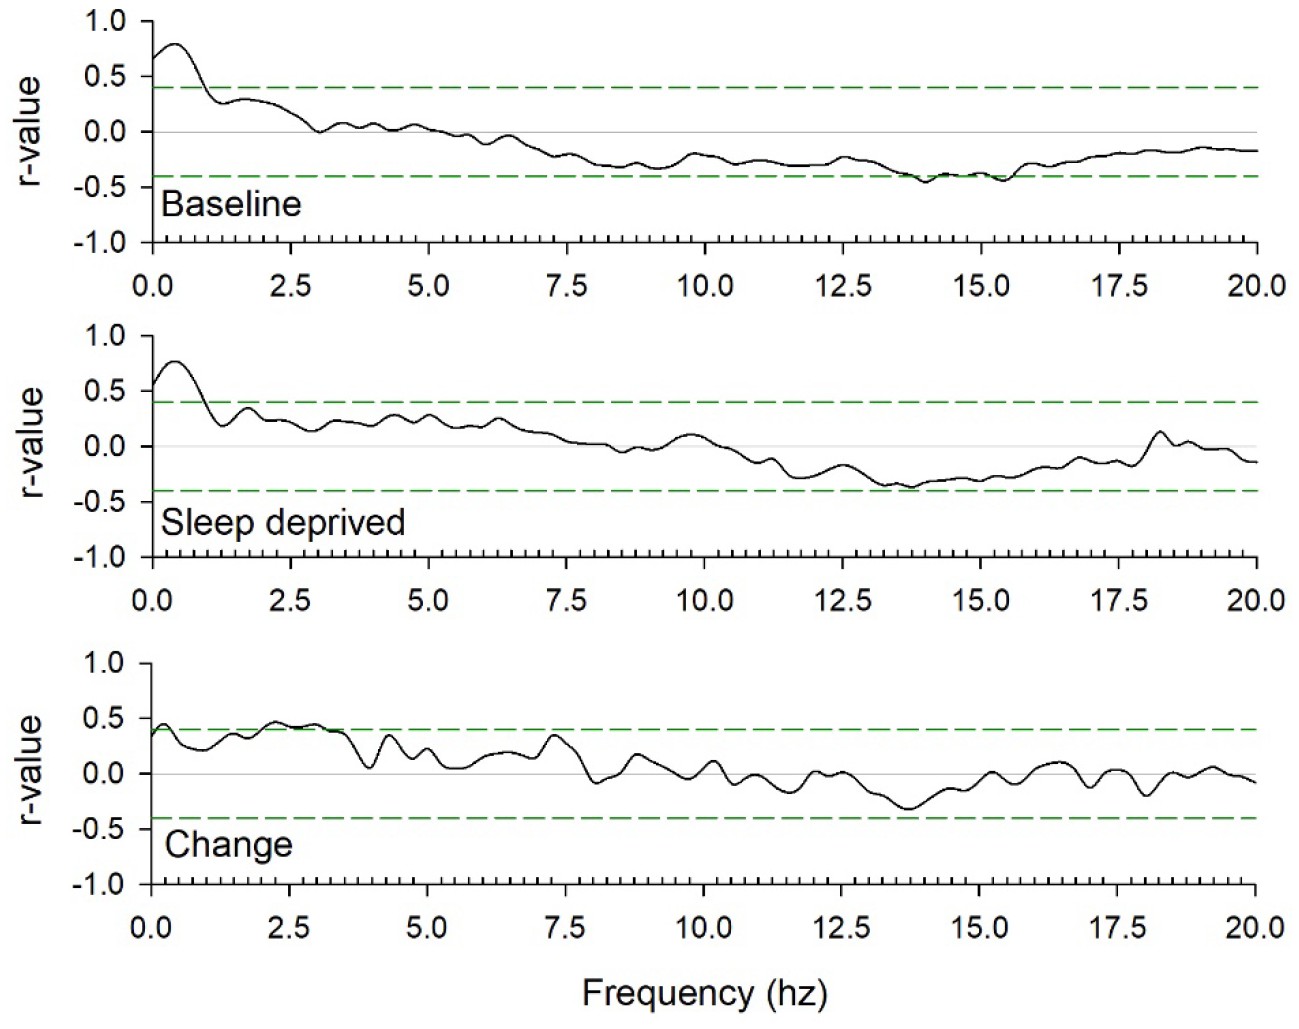
Spearman rank correlation coefficients between global mGluR5 availability and EEG power between 0 and 20 Hz in baseline and sleep deprivation conditions, and the change caused by sleep loss.
The green lines indicate r-values that are above (or below) the α < 0.05 significance threshold.
Figure 2—figure supplement 3
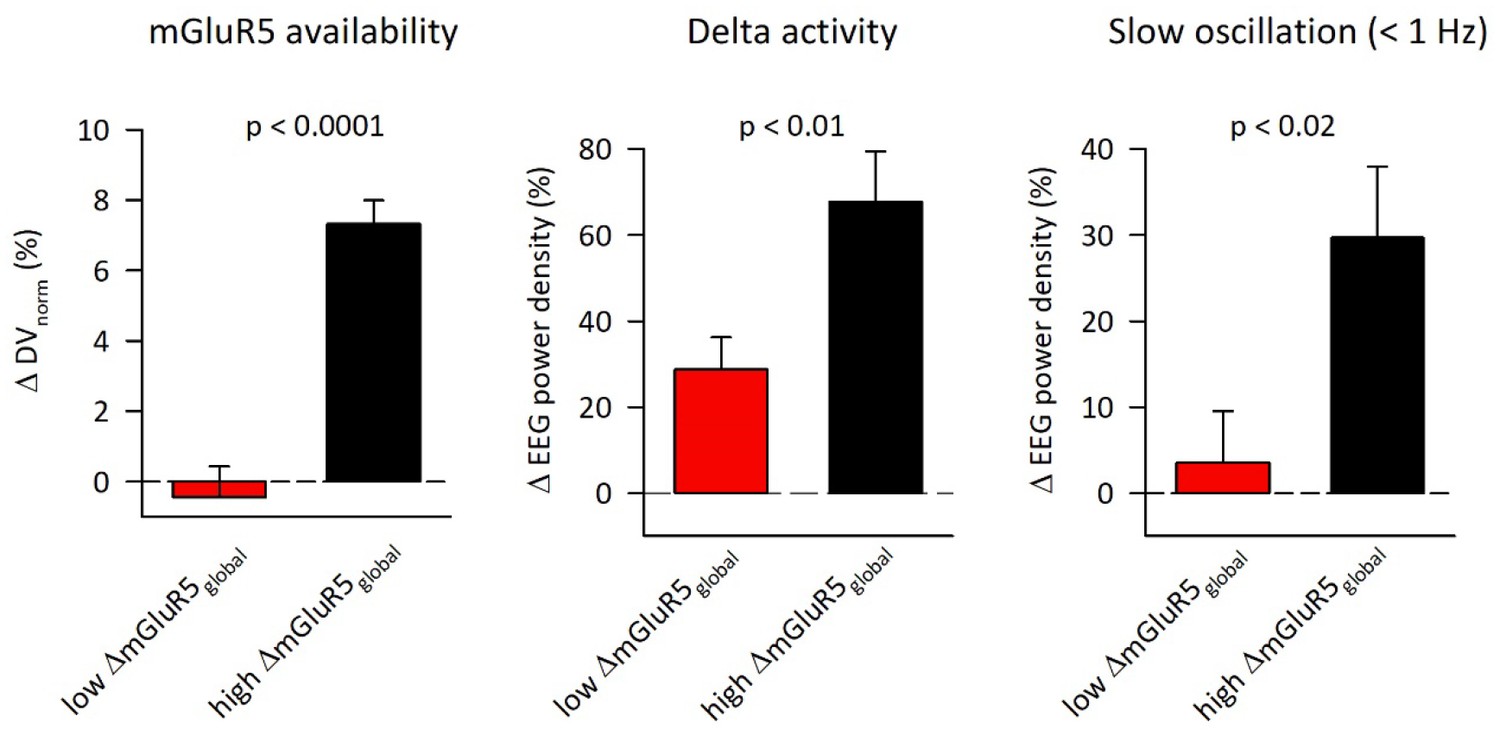
Enhanced rebound after sleep deprivation in EEG delta (0.5–4.5 Hz) and <1 Hz activity in individuals with high change in global mGluR5 availability after sleep deprivation.
The EEG data were quantified in NREM sleep episode 1. Red bars: low mGluR5 responder group (n = 12); black bars: high mGluR5 responder group (n = 11). Data represent means ±SEM.
Figure 3 with 1 supplement
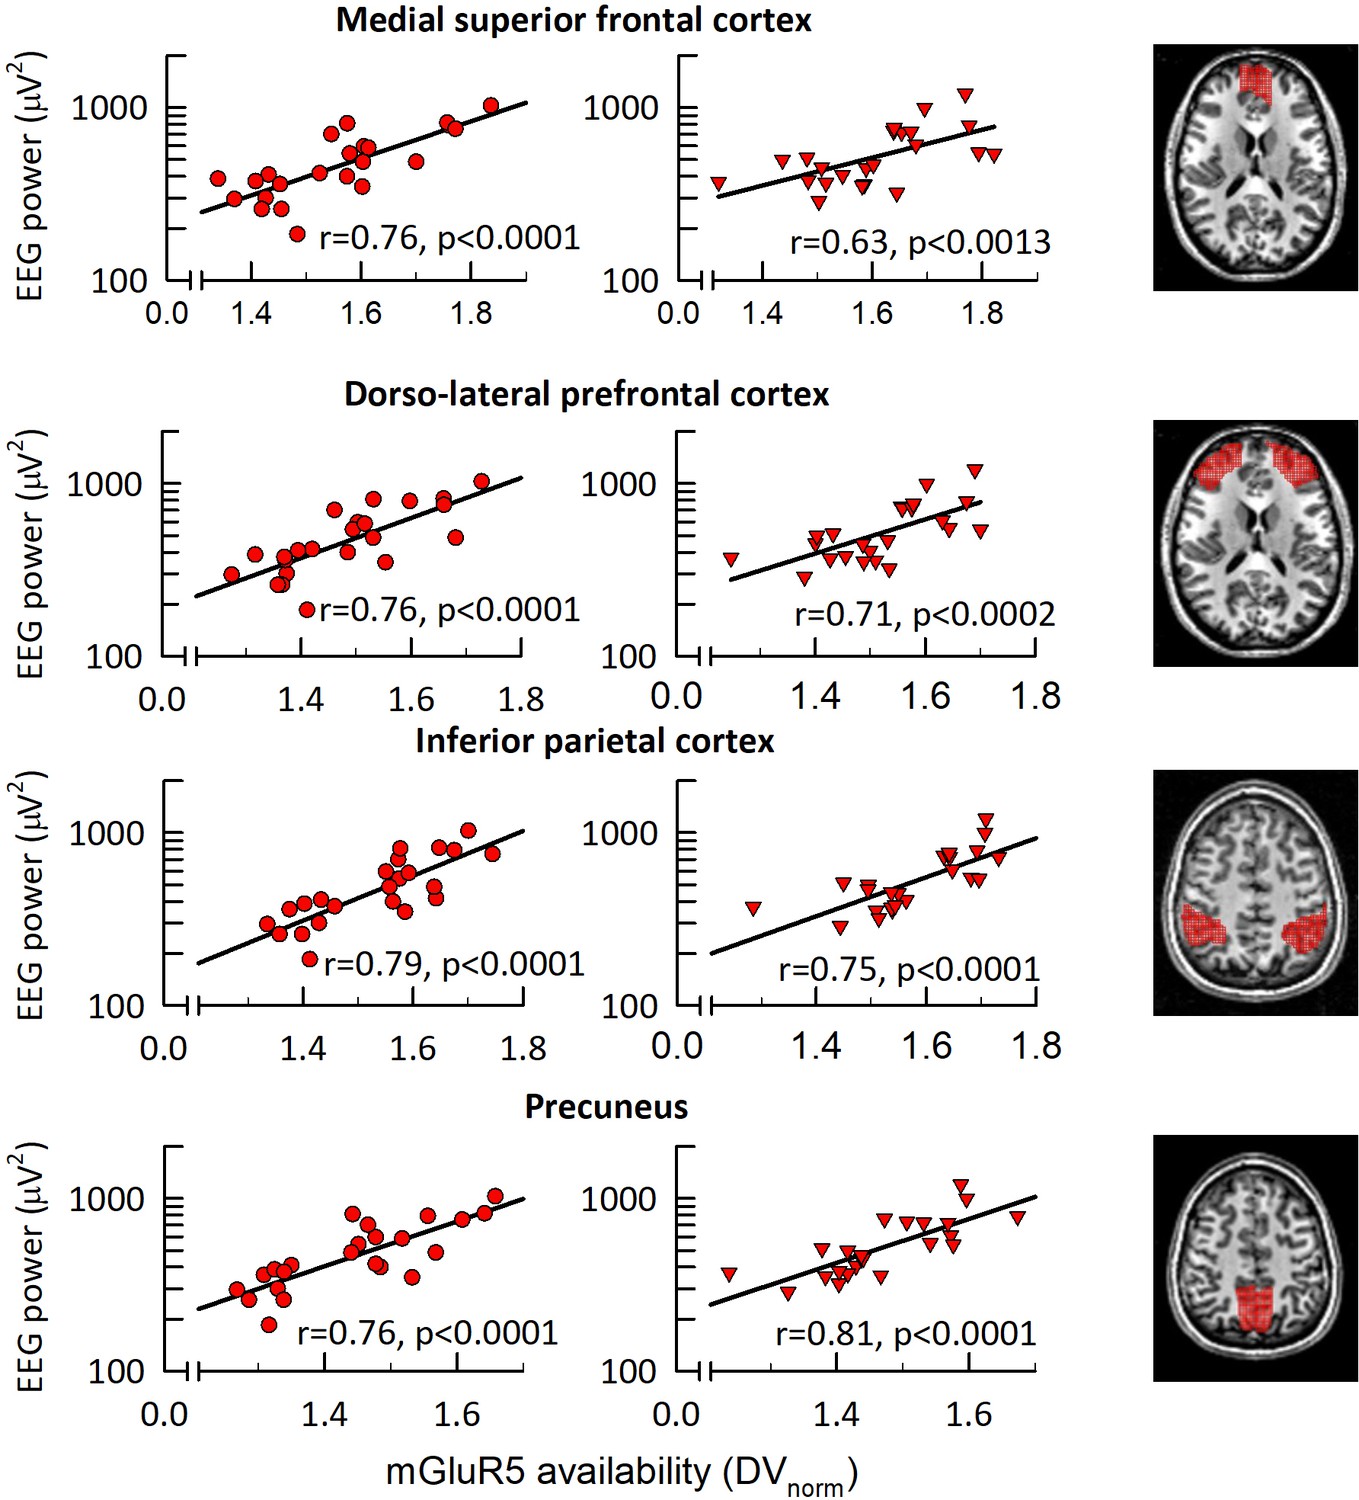
mGluR5 availability in fronto-parietal network correlates with EEG <1 Hz activity in NREM sleep.
Association between the EEG slow oscillation activity (0.25–1.0 Hz) in the first NREM sleep episode of sleep control (left) and sleep deprivation (middle) conditions. Correlation plots: Significant (pall < 0.0015) Spearman rank correlation coefficients (r) between absolute EEG <1 Hz activity (C3M2 derivation) and regional mGluR5 availability in medial superior frontal cortex, dorso-lateral-prefrontal cortex, inferior parietal cortex, and precuneus. Right column: Axial slices illustrating the brain regions (red overlay) showing a significant association between EEG <1 Hz activity and mGluR5 availability. Z-coordinates according to the MNI brain atlas: medial superior frontal cortex, z = 16; dorso-lateral-prefrontal cortex, z = 16; inferior parietal cortex, z = 50; precuneus, z = 48.
Figure 3—figure supplement 1
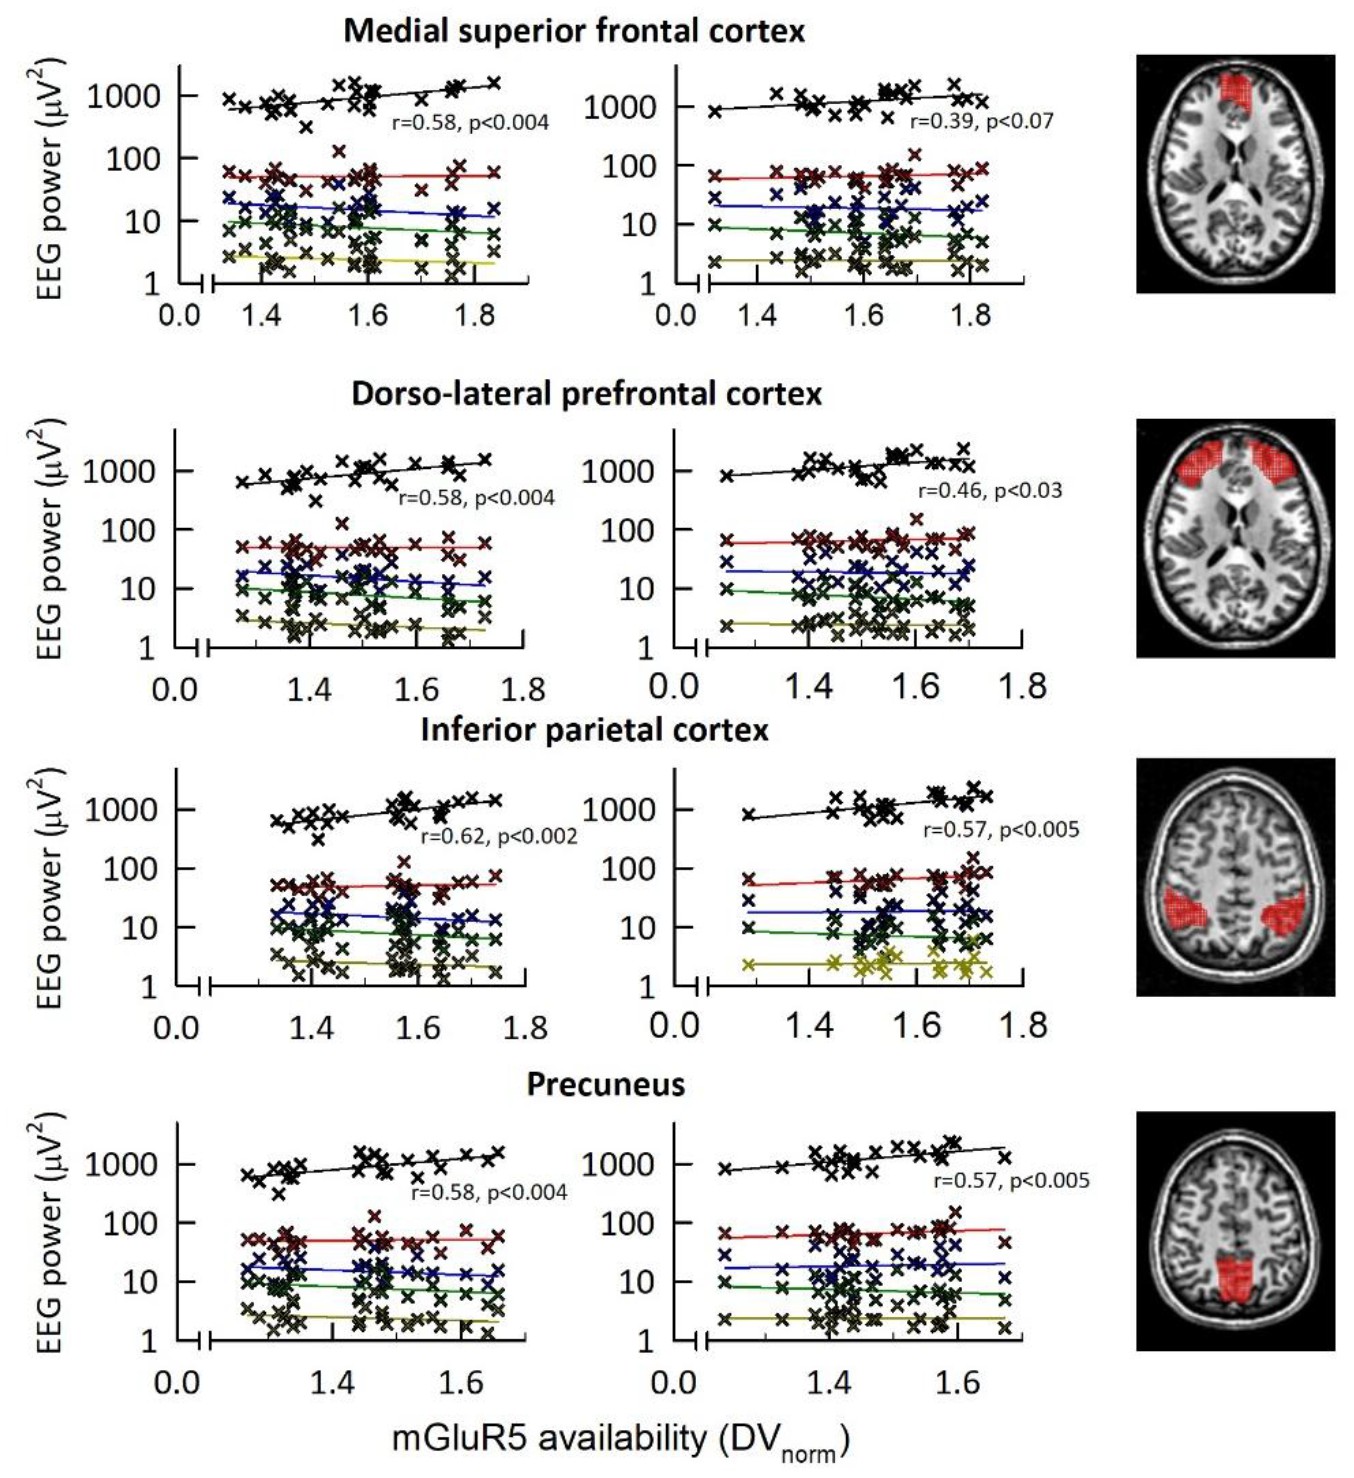
Correlations between EEG power bands and regional mGluR5 availability.
EEG power (C3M2 derivation) plotted on a logarithmic scale for delta (0.5–4.5 Hz; black), theta (4–8 Hz; red), alpha (8–12 Hz; blue), sigma (12–15 Hz; green) and beta (15–20 Hz; yellow) ranges in the first NREM sleep episode of sleep control (left) and sleep deprivation (middle) conditions. Spearman rank correlation coefficients (r) and p-values of significant correlations are presented. Regions and right column are the same as in Figure 3.
Figure 4
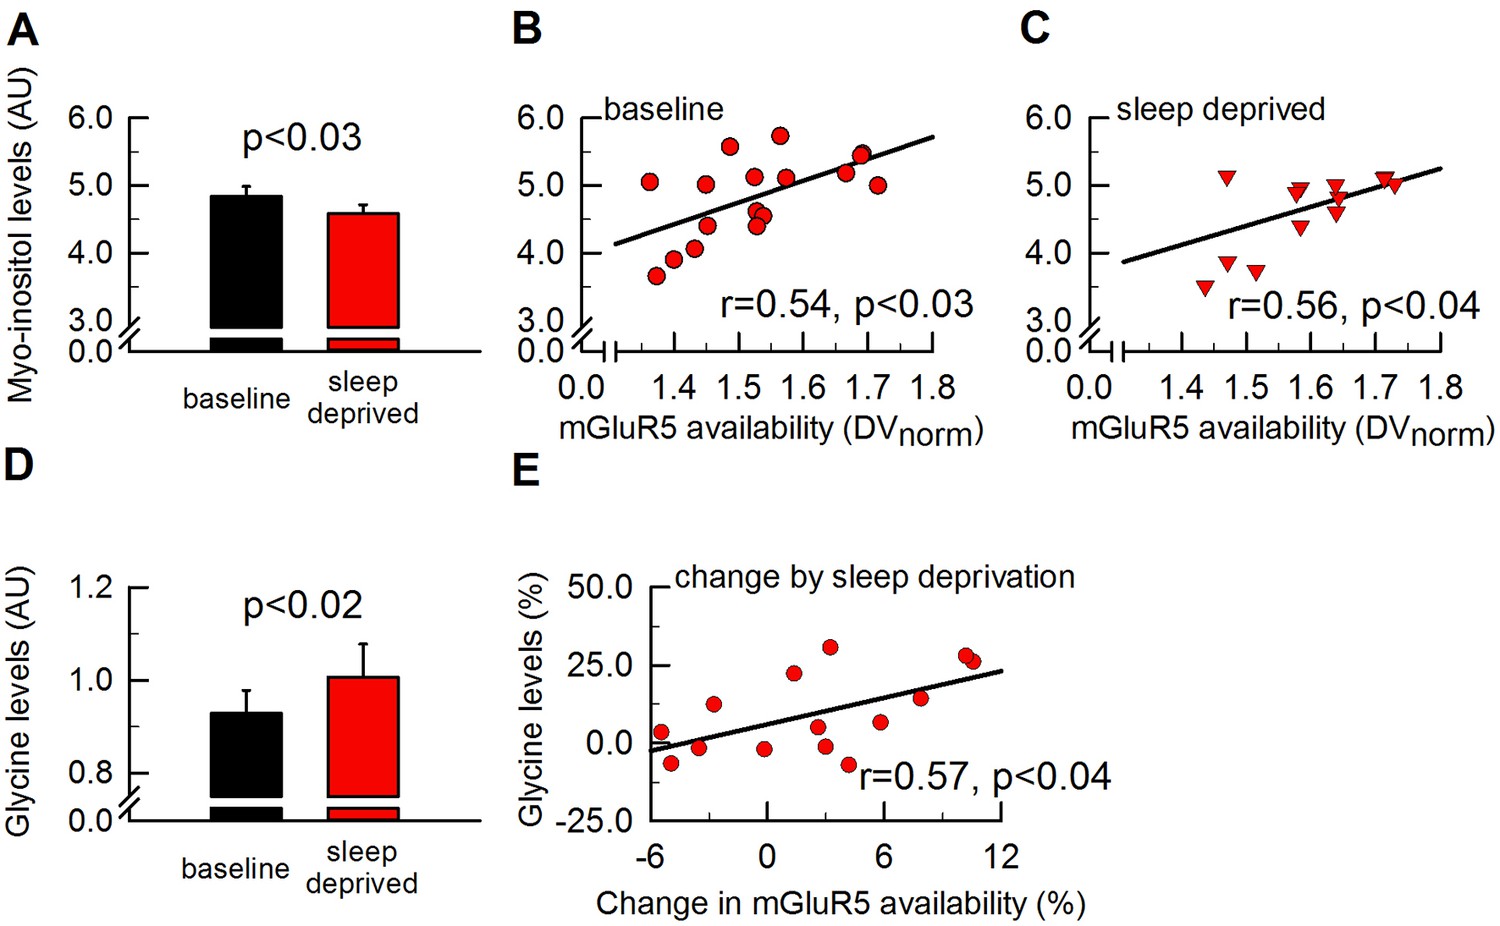
Myo-inositiol and glycine levels are altered by sleep deprivation in parallel with mGluR5 availability.
To assess cerebral metabolic changes that are altered in synchrony with global mGluR5 availability by sleep deprivation, 17 metabolites measured in the pgACC (see Figure 2 for further details) were investigated. Whereas neither glutamate, glutamine nor GABA were found to be altered by sleep loss, myo-inositol was decreased by ~5.5% by sleep deprivation (A) and significantly associated with global mGluR5 availability in both sleep conditions (B-C). Glycine was enhanced by ~8.5% by sleep deprivation (D) and the increase in glycine positively correlated with the increase in global mGluR5 availability (E). Error bars represent standard errors of the mean (SEM), p-values indicate paired two-tailed Student’s t-tests and Spearman rank correlation coefficients (r).
Figure 5
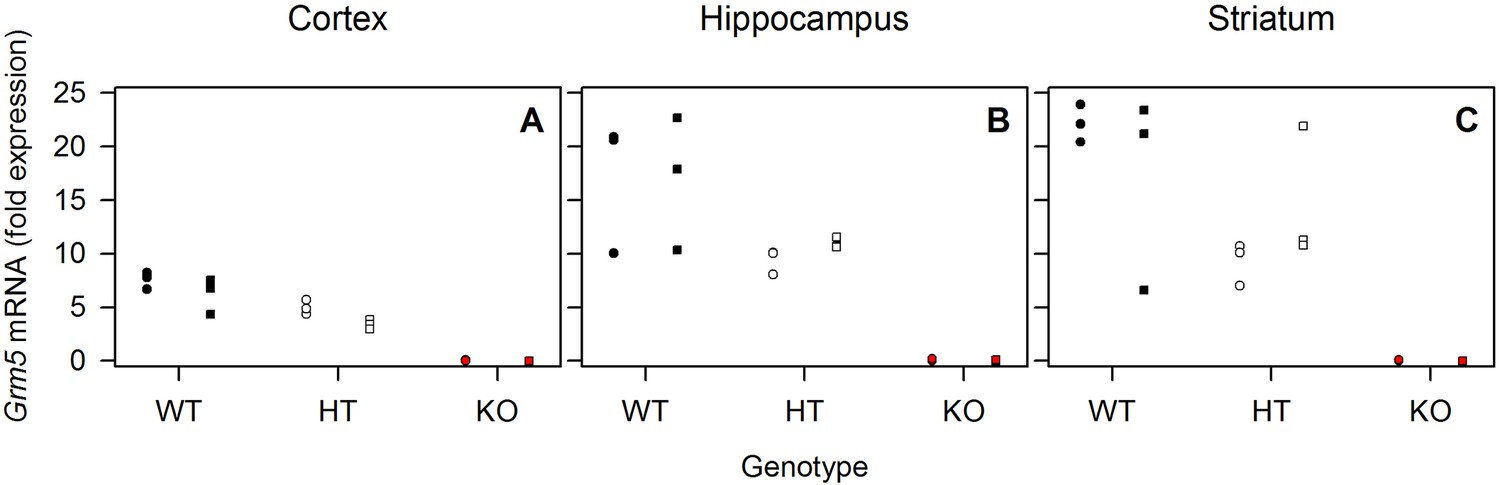
Sleep deprivation has no consistent effect on Grm5 mRNA expression in mice.
qPCR of Grm5 mRNA extracted from cortex (A), hippocampus (B) and striatum (C) of n = 3 WT (black), HT (white) and KO (red) mice in sleep control (circles) and sleep deprivation conditions (squares). Individual data points are depicted. Grm5 mRNA was expressed in allele dose-dependent manner. Significant ‘genotype’ effect (F2,12 > 26.9, pall <0.0001) in two-way ANOVA with ‘genotype’ and ‘condition’ in all brain regions. No significant main effect of ‘condition’ and ‘condition’ x ‘genotype’ interaction were observed.
-
Figure 5—source data 1
Excel file with one data sheet containing the numerical values of each figure panel (A-C) of Figure 5.
- https://doi.org/10.7554/eLife.28751.012
Figure 6 with 2 supplements
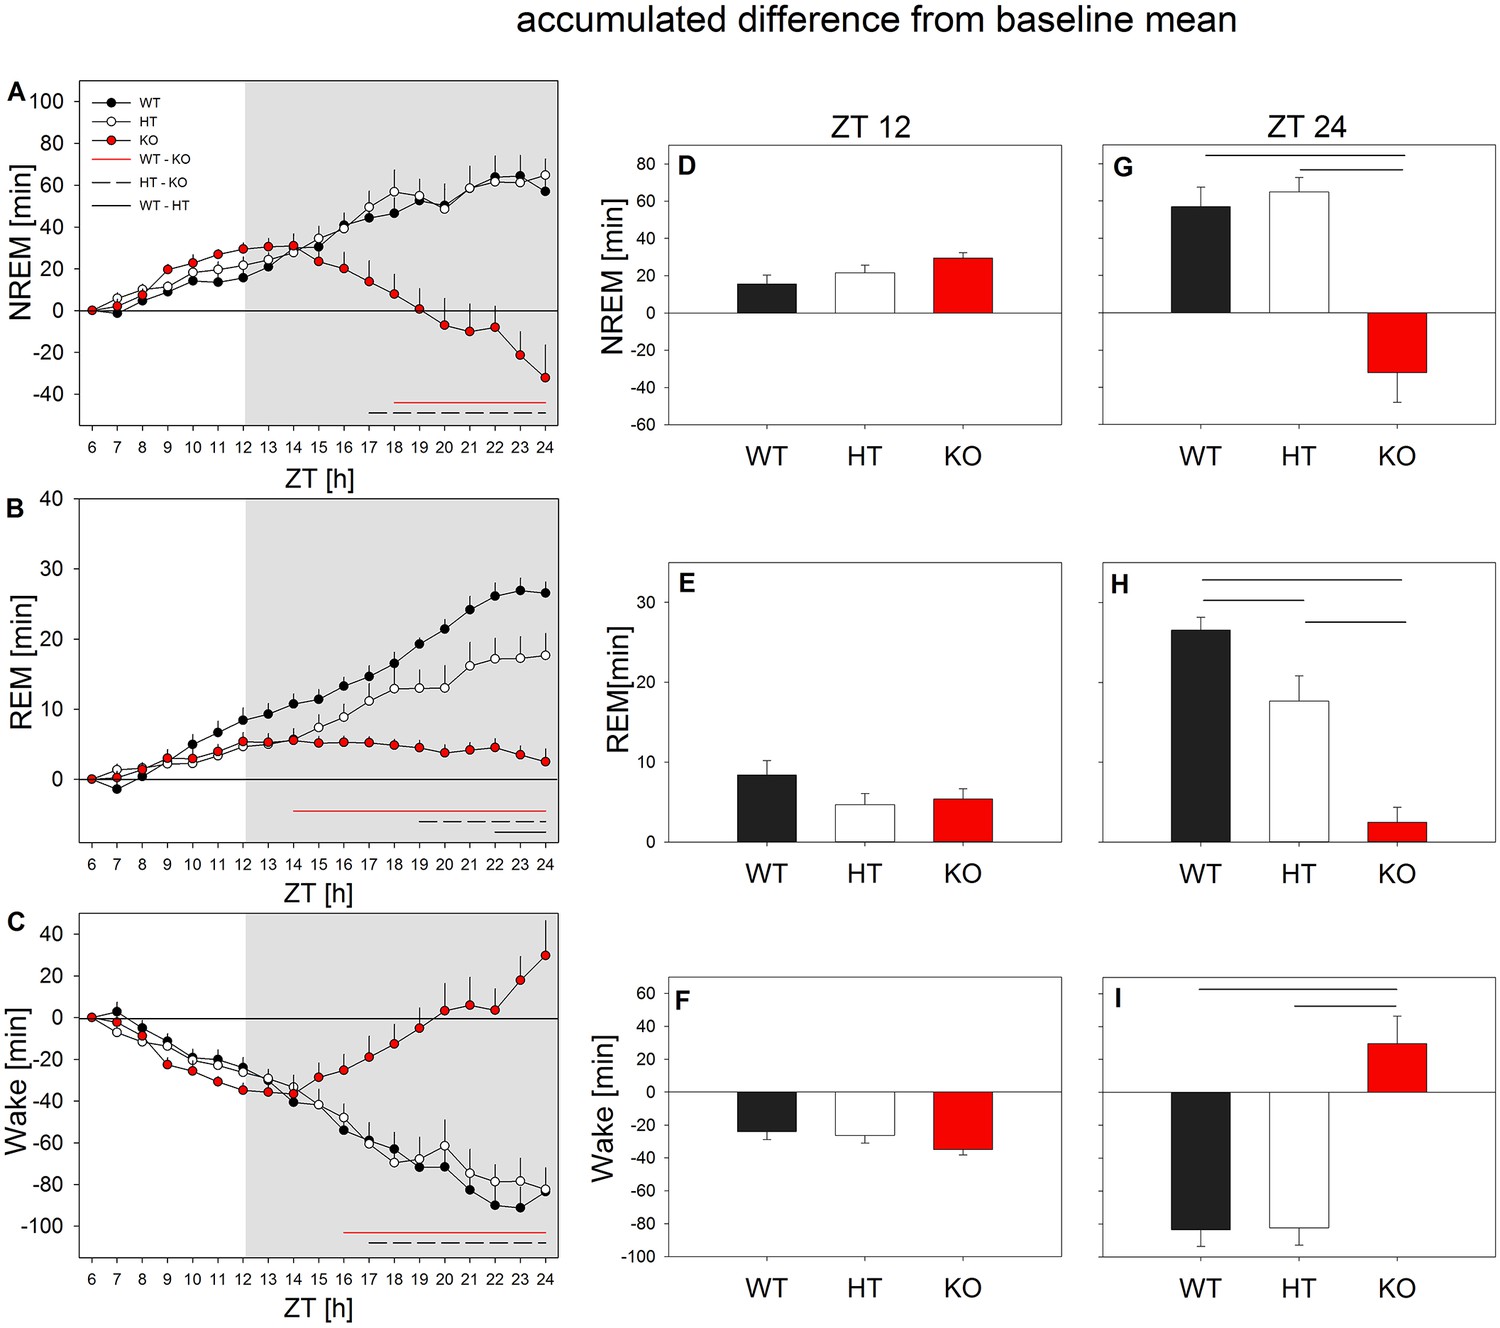
mGluR5 modulate the response to sleep deprivation in mice.
All mice showed a NREM and REM sleep rebound at the cost of wakefulness in the 6 hr light phase of recovery. During the recovery dark phase, KO mice (red circles) lost NREM and REM sleep, while increasing wakefulness. Left panel: Accumulated difference from baseline (i.e. mean of baselines) across the 18 hr recovery period. Hourly differences in NREM sleep (A), REM sleep (B) and wakefulness (C) from the baseline value were continuously summed up to achieve the accumulated difference from baseline (n = 8 mice/genotype, mean + SEM). Horizontal lines represent Holm-corrected t-tests (p < 0.05), following significant ‘genotype’ effects in one-way ANOVAs performed at each time point (p < 0.05); WT vs. KO (red line), HT vs. KO (dotted line), WT vs. HT (black line). Middle and right panels: Accumulated mean changes in NREM sleep, REM sleep and wakefulness from baseline to recovery at the end of the 6 hr light phase (ZT12; i.e. accumulated differences of ZT7 – ZT12) (D-F) and at the end of the 18 hr recovery period (ZT24; i.e. accumulated differences of ZT7 – ZT24) (G-I). No significant effects were observed during the light period. During the dark period of recovery KO mice (red bars) differed significantly from the littermates in their response to sleep deprivation. Horizontal lines represent significant differences between genotypes in Holm-corrected t-test following significant ‘genotype’ effect in one-way ANOVA: NREM sleep: p < 0.002 for WT vs. KO and p < 0.001 for HT vs. KO; REM sleep: p < 1e-6 for WT vs. KO, p < 0.004 for HT vs. KO and p < 0.04 for WT vs. HT; Wake: p < 0.0004 for WT vs. KO and for HT vs. KO.
-
Figure 6—source data 1
Excel file with one data sheet containing the numerical values of each figure panel (A-I) of Figure 6.
- https://doi.org/10.7554/eLife.28751.016
Figure 6—figure supplement 1
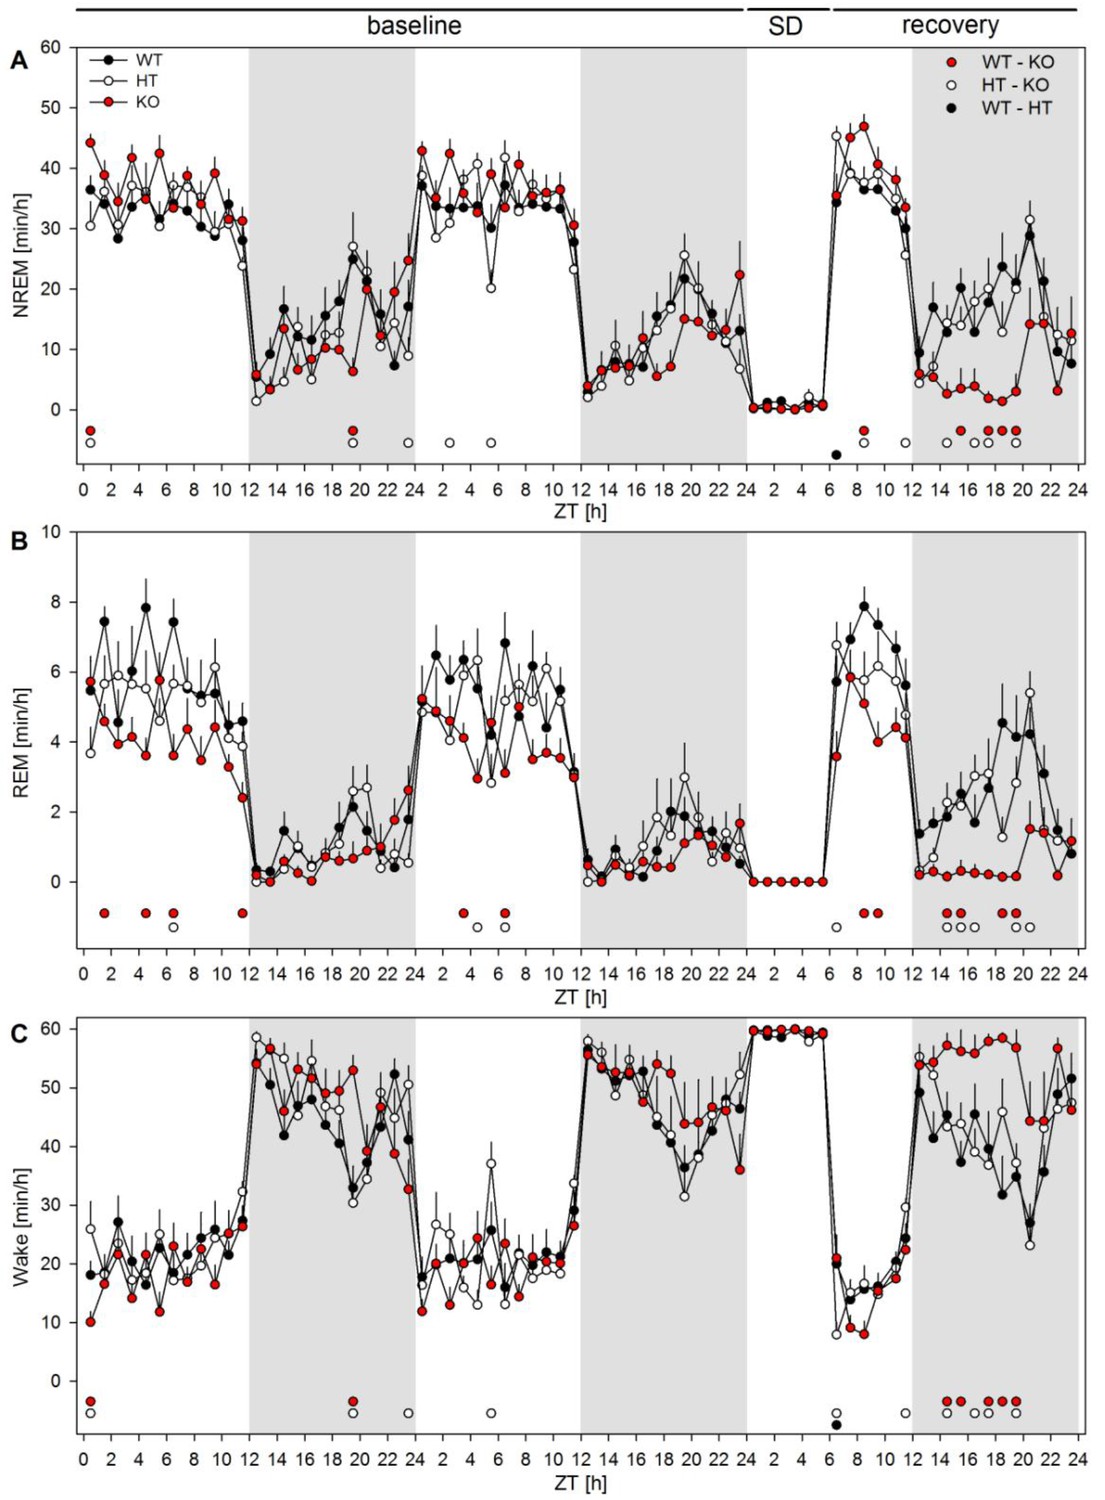
The effect of mGluR5 genotype across vigilance states and sleep deprivation in mice.
The figure illustrates the time spent in each of the three vigilance states NREM sleep (top) REM sleep (middle) and wakefulness (bottom) in minutes per hour of recording in wild type (WT, black), heterozygote (HT, white) and Grm5 knock-out (KO, red) mice. After two baseline days 6 hr of sleep deprivation started at the beginning of the light phase and was followed by 18 hr recovery. Significant differences between the genotypes were observed at several time points across the 72 hr protocol. After sleep deprivation the KO mice showed a clear suppression of NREM sleep and increase of wakefulness. This effect is in sharp contrast to the NREM and REM sleep rebound observed in WT and HT mice at the cost of wakefulness. Overall repeated measures 2-way ANOVAs revealed significant ‘genotype x hour’ interaction for all three vigilance states (F46,483 > 2.38, pall < 0.0001), n = 8 mice/genotype. Post-hoc testing was performed by hourly one-way ANOVAs with factor ‘genotype’, followed by Holm corrected t-tests; baseline 1: NREM sleep F2,21 > 3.8, p all < 0.04, WT – KO (red dots) and HT – KO (white dots) pall < 0.04; REM sleep F2,21 > 5.7, p all < 0.02, WT – KO p all <0.02, HT – KO p all <0.05; Wake F2,21 > 4.0, pall <0.04, WT – KO and HT – KO pall < 0.04; baseline 2: NREM sleep F2,21 > 3.8, pall < 0.04, HT – KO pall < 0.04; REM sleep F2,21 > 3.9, pall < 0.04, WT – KO pall < 0.02, HT – KO pall < 0.05; Wake F2,21 > 6.8, HT – KO p<0.003; recovery: NREM sleep F2,21 > 3.8, pall < 0.04, WT – KO pall < 0.05, HT – KO pall < 0.03, WT – HT (black dots) pall < 0.01; REM sleep F2,21 > 4.9, pall < 0.02, WT – KO pall < 0.05, HT – KO pall < 0.03; Wake F2,21 > 3.8, pall < 0.04, WT – KO pall < 0.05, HT – KO pall < 0.04, WT – HT pall < 0.02.
Figure 6—figure supplement 2
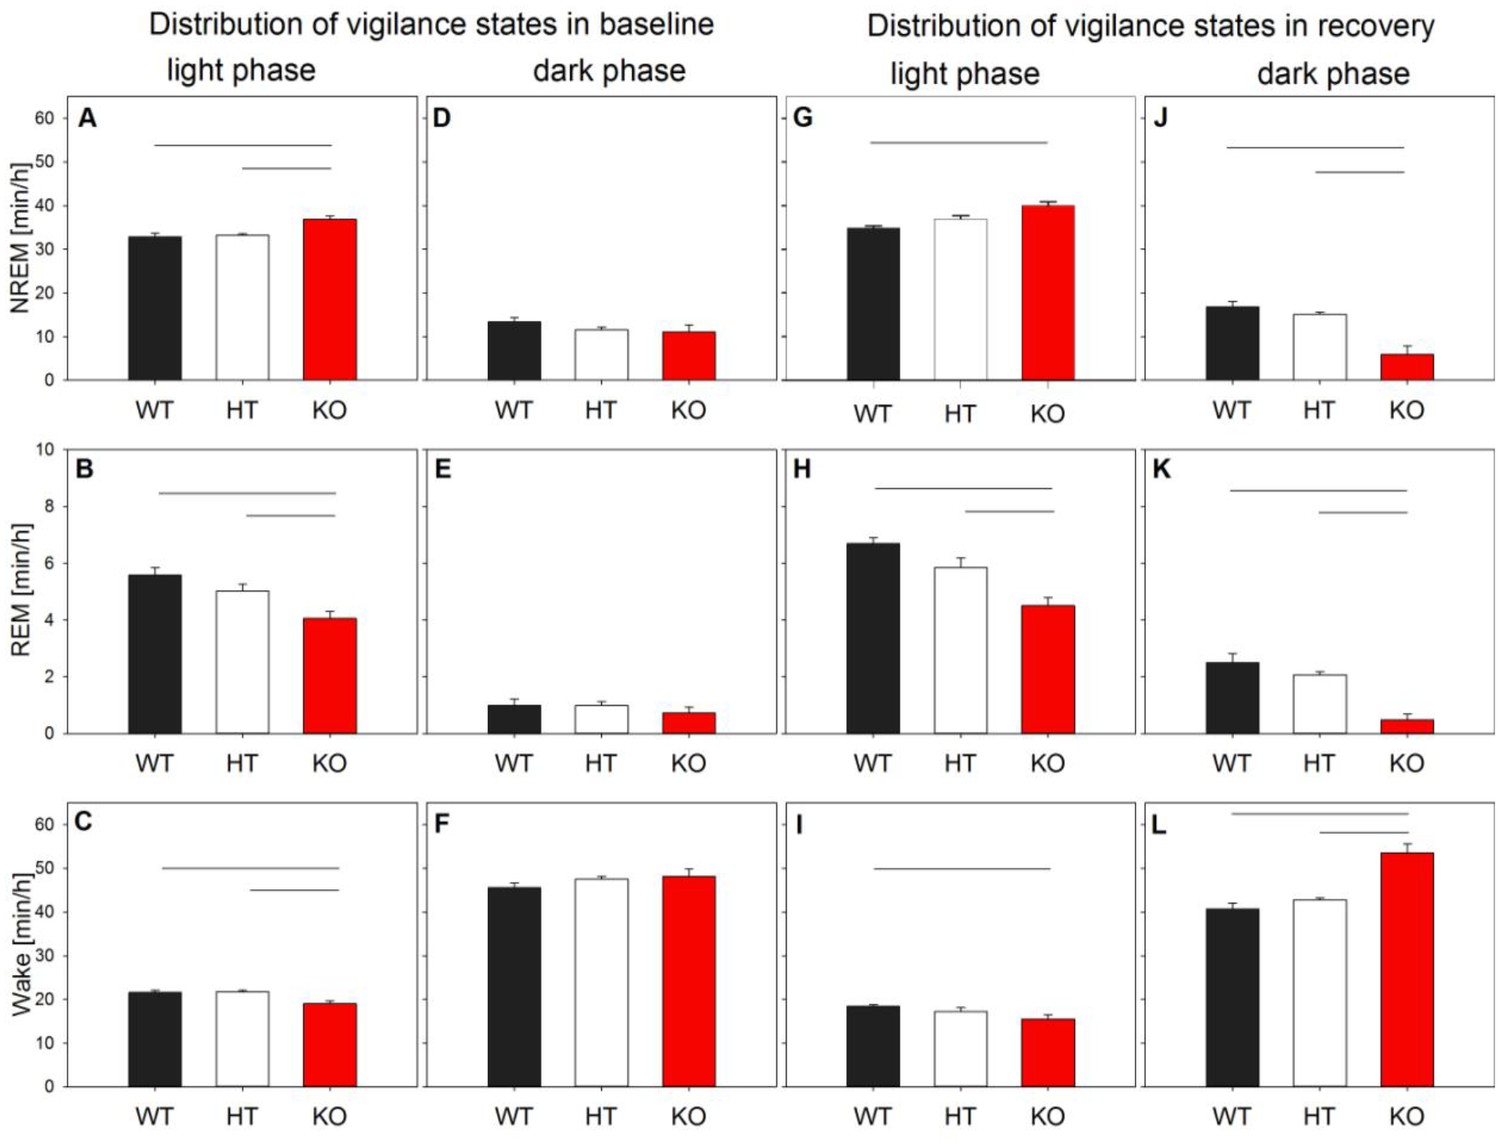
Duration of vigilance states in Grm5 KO, HT and WT mice at baseline and recovery light and dark phases.
Mean amounts of NREM sleep, REM sleep and wakefulness over the 12 hr light and 12 hr dark phase of baseline mean (left panel, A–F) and the 6 hr light and 12 hr dark phase of recovery (right panel, G–L). During the baseline light period, KO mice show slightly more NREM sleep and slightly less REM sleep and wakefulness than their littermates (A–C). No significant differences in the dark phase were observed (D-E). During the light phase of recovery, KO mice show slightly more NREM sleep and slightly less REM sleep and wakefulness than their WT littermates (G–I). In the dark phase, KO spent less time in NREM and REM sleep than their littermates and more time in wakefulness (J–L). Statistics represent Holm corrected t-tests (lines), following significant ‘genotype x hour’ interactions or ‘genotype’ effect in overall two-way ANOVAs (pall <0.03 for WT vs. KO and HT vs. KO). Data represent means + SEM in n = 8 mice/genotype.
Figure 7
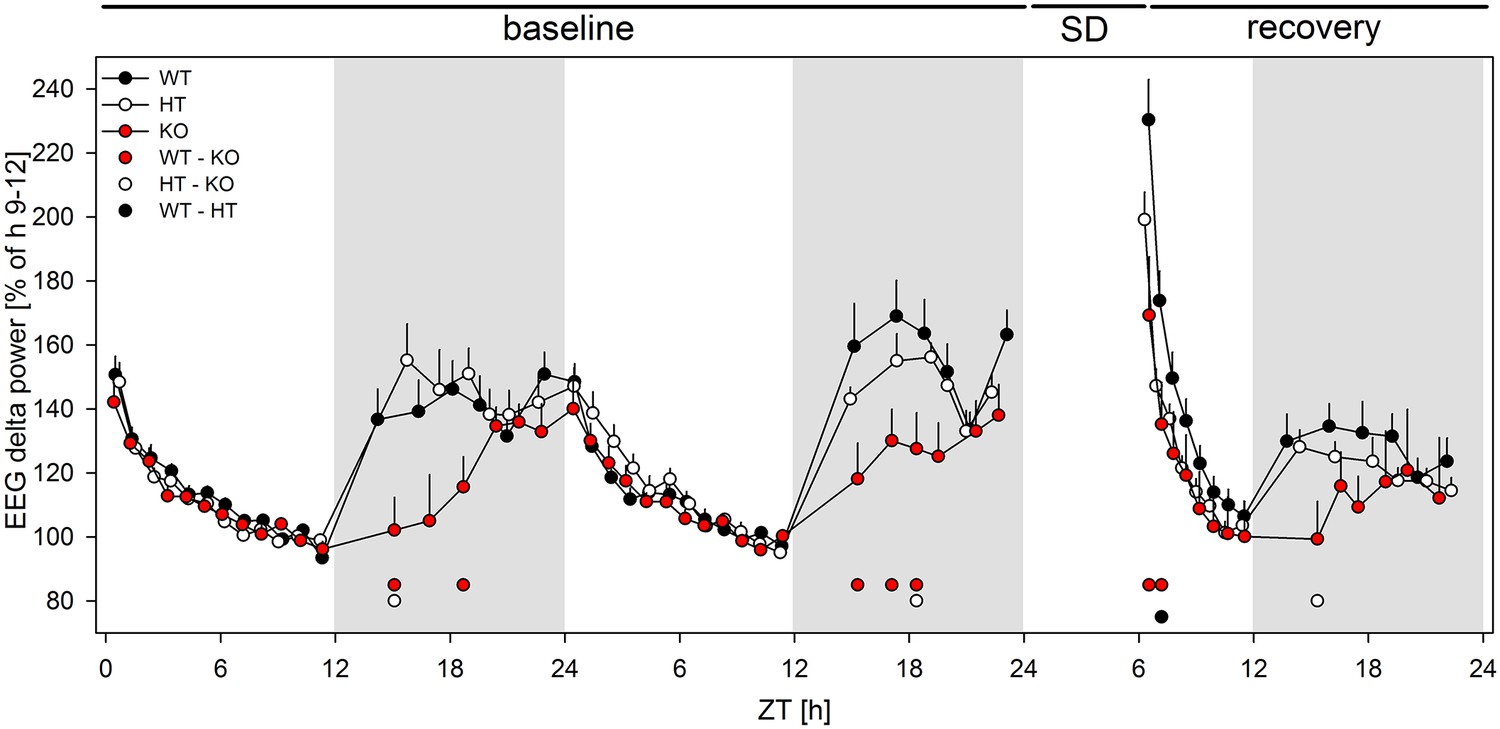
Lack of mGluR5 causes marked changes in EEG marker of sleep homeostasis in mice.
Time course of the EEG delta power across the 48 hr baseline and 18 hr of recovery (n = 7–8/genotype), expressed as a percentage of the genotype-specific mean reference value at baseline (ZT8 - ZT12). Dots above the x-axes denote significant differences between WT and KO animals (red), HT and KO (white) animals, and WT and HT animals (black), respectively. pall < 0.05 (2-sided t-tests), following significant one-way ANOVAs (per time point, factor 'genotype').
-
Figure 7—source data 1
Excel file with one data sheed containing the numerical values of Figure 7.
- https://doi.org/10.7554/eLife.28751.018
Figure 8 with 1 supplement
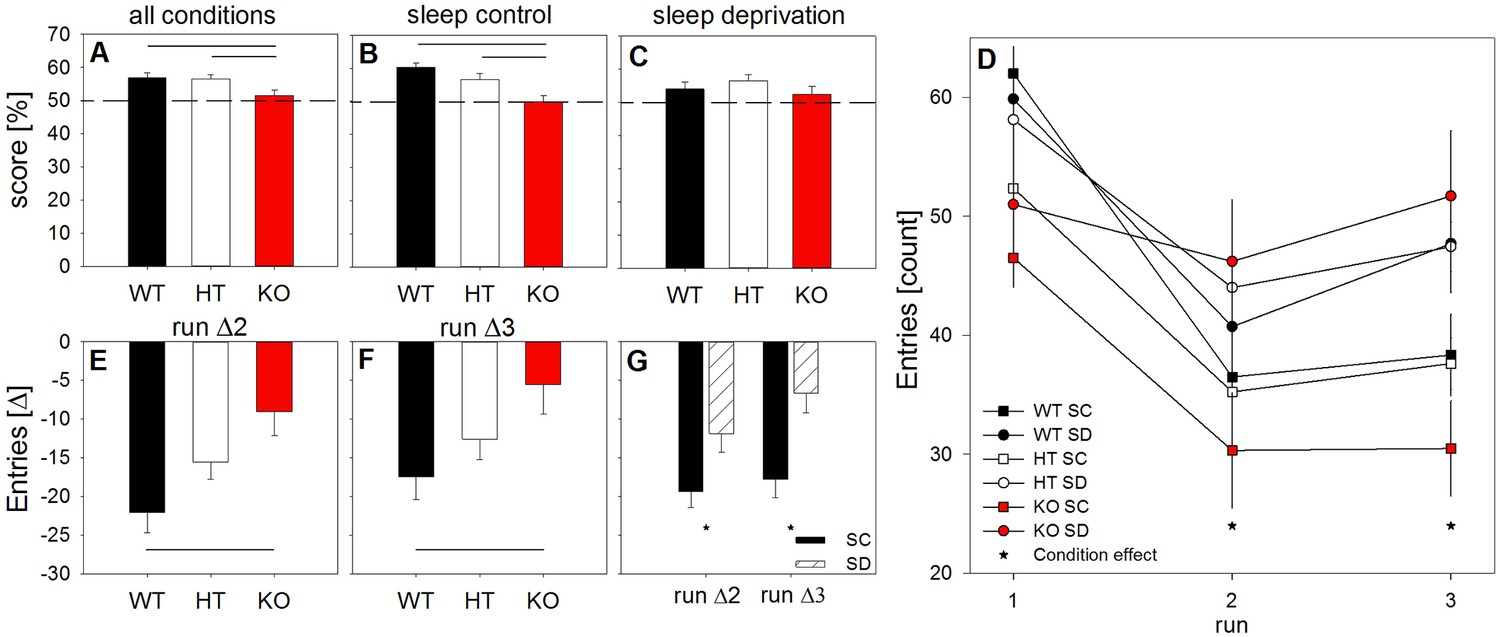
Lack of mGluR5 deteriorates working memory and habituation to a novel environment after sleep deprivation.
Spontaneous alternation behavior scores in Y-maze expressed as a percentage of successful alternation trials (A-C), absolute number of total arm entries (D), and differences from the number of entries in the first maze encounter as a measure of habituation to the novel environment (E-G). Across all runs and conditions, KO mice (red bars) showed compromised working memory when compared to their littermates (‘genotype’: F2,26 = 4.29, p < 0.03). While the WT and HT mice performed above the 50% chance level in all conditions, the KO animals did not (A-C). Horizontal black lines indicate significant differences between genotypes (p < 0.03; Holm-corrected t-tests). In run 1, KO animals showed fewer total arm entries than their WT littermates. When studied after sleep deprivation (circles), mice displayed higher overall exploration than mice under control conditions (squares) (‘condition’: F1,26 > 12.1, p < 0.002). This effect of sleep deprivation on arm entries was modulated by genotype and test run (‘run’, ‘genotype’ x ‘run’, and ‘run’ x ‘condition’: Fall > 3.0, pall < 0.03). In runs 2 and 3, sleep-deprived mice lacking mGluR5 produced significantly more arm entries than control mice without mGluR5 (stars: tall < −2.3, pall < 0.05; Welch two-sample t-tests) (D). Normalization of the number of arm entries in runs 2 and 3 to run 1, confirmed the effects of sleep deprivation (‘condition’: F1,40 > 5.0, pall < 0.04) and genotype (F2,40 > 4.0, pall < 0.03) on habituation across the three test trials. More specifically, sleep deprivation attenuated habituation to the Y-maze compared to the sleep control condition, as reflected in the reduced decrease in arm entries in runs 2 and 3 relative to run 1 (stars: pall < 0.03; two-samples t-tests) (G). Finally, the sleep-deprived KO animals showed a less pronounced reduction in exploratory activity than the sleep-deprived WT animals. Horizontal black lines indicate significant differences between WT and KO mice (pall < 0.05) (E-F). All data points represent means ± SEM (n = 6–10 mice per condition and genotype).
-
Figure 8—source data 1
Excel file with one data sheet containing the numerical values of each figure panel (A-G) of Figure 8.
- https://doi.org/10.7554/eLife.28751.021
Figure 8—figure supplement 1

Change of exploratory activity across trials.
Number of entries relative to the first maze exposure. The observed overall genotype effect (Figure 7) is restricted to the sleep deprivation condition. Main effect of ‘genotype’ in one-way ANOVA: control condition: Δrun2 and Δrun3: F2,17 > 2, pall > 0.1; sleep deprivation condition: Δrun2: F2,23 = 3.8, p < 0.04; Δrun3: F2,23 = 3.1, p = 0.06. the horizontal line indicates the significant difference between WT and KO animals (p < 0.05; Holm-corrected t-test).
Tables
Table 1
Correlation between mGluR5 availability in distinct brain regions and the EEG <1 Hz activity.
https://doi.org/10.7554/eLife.28751.009| Brain region | Correlation between mGluR5 availability and EEG < 1 Hz activity | ||||
|---|---|---|---|---|---|
| Baseline | Sleep deprivation | ||||
| rP, p | rS, p | rP, p | rS, p | ||
| Medial superior frontal cortex * | Left | 0.75,<0.0001 | 0.73, <0.0001 | 0.60, 0.0022 | 0.63, 0.0011 |
| Right | 0.79,<0.0001 | 0.76, <0.0001 | 0.60, 0.0024 | 0.66, 0.0006 | |
| Orbitofrontal cortex | Left | 0.60, 0.0027 | 0.60, 0.0026 | 0.58, 0.0036 | 0.57, 0.0046 |
| Right | 0.68, 0.0003 | 0.69, 0.0002 | 0.57, 0.0046 | 0.56, 0.0051 | |
| Dorsolateral prefrontal cortex * | Left | 0.76, <0.0001 | 0.77, <0.0001 | 0.67, 0.0005 | 0.66, 0.0006 |
| Right | 0.75, 0.0001 | 0.76, <0.0001 | 0.67, 0.0004 | 0.72, 0.0001 | |
| Anterior cingulate cortex | Left | 0.67, 0.0004 | 0.70, 0.0002 | 0.51, 0.0126 | 0.59, 0.0032 |
| Right | 0.66, 0.0007 | 0.64, 0.001 | 0.55, 0.0061 | 0.61, 0.0021 | |
| Inferior parietal cortex * | Left | 0.80, <0.0001 | 0.79, <0.0001 | 0.77, <0.0001 | 0.76, <0.0001 |
| Right | 0.79, <0.0001 | 0.78, <0.0001 | 0.71, 0.0002 | 0.75, <0.0001 | |
| Precuneus * | Left | 0.82, <0.0001 | 0.77,<0.0001 | 0.78, <0.0001 | 0.80, <0.0001 |
| Right | 0.77, <0.0001 | 0.76, <0.0001 | 0.76, <0.0001 | 0.82, <0.0001 | |
| Insula | Left | 0.63, 0.0014 | 0.63, 0.0012 | 0.47, 0.0244 | 0.41, 0.0532 |
| Right | 0.69, 0.0003 | 0.67, 0.0004 | 0.58, 0.0041 | 0.58, 0.004 | |
| Striatum | Left | 0.62, 0.0016 | 0.63, 0.0013 | 0.50, 0.0147 | 0.49, 0.0176 |
| Right | 0.68, 0.0004 | 0.66, 0.0006 | 0.52, 0.0104 | 0.58, 0.0037 | |
| Parahippocampal gyrus | Left | 0.41, 0.0536 | 0.46, 0.0267 | 0.33, 0.1296 | 0.28, 0.1897 |
| Right | 0.53, 0.0093 | 0.53, 0.01 | 0.38, 0.0728 | 0.40, 0.0585 | |
| Hippocampus | Left | 0.52, 0.0101 | 0.47, 0.0245 | 0.36, 0.0886 | 0.37, 0.0853 |
| Right | 0.53, 0.009 | 0.48, 0.0198 | 0.43, 0.0413 | 0.37, 0.0835 | |
-
rP = Pearson Product Moment Correlation coefficient; rS = Spearman Rank Correlation coefficient. Those brain regions that showed a significant (pcorr <0.00278) correlation between mGluR5 availability and EEG <1 Hz activity on left and right hemisphere in both baseline and sleep deprivation conditions are highlighted by a star (*).
Additional files
-
Transparent reporting form
- https://doi.org/10.7554/eLife.28751.022
Download links
A two-part list of links to download the article, or parts of the article, in various formats.
Downloads (link to download the article as PDF)
Open citations (links to open the citations from this article in various online reference manager services)
Cite this article (links to download the citations from this article in formats compatible with various reference manager tools)
Cerebral mGluR5 availability contributes to elevated sleep need and behavioral adjustment after sleep deprivation
eLife 6:e28751.
https://doi.org/10.7554/eLife.28751


