Inhibition of cholesterol biosynthesis through RNF145-dependent ubiquitination of SCAP
- Howard Hughes Medical Institute, University of California, Los Angeles, United States
- University of California, Los Angeles, United States
- University of Kentucky, United States
- CSIC-Universidad Autónoma de Madrid, Unidad de Biomedicina-Universidad de Las Palmas de Gran Canaria (Unidad asociada al CSIC), Spain
- Universidad de Las Palmas de Gran Canaria, Spain
Figures
Figure 1 with 1 supplement
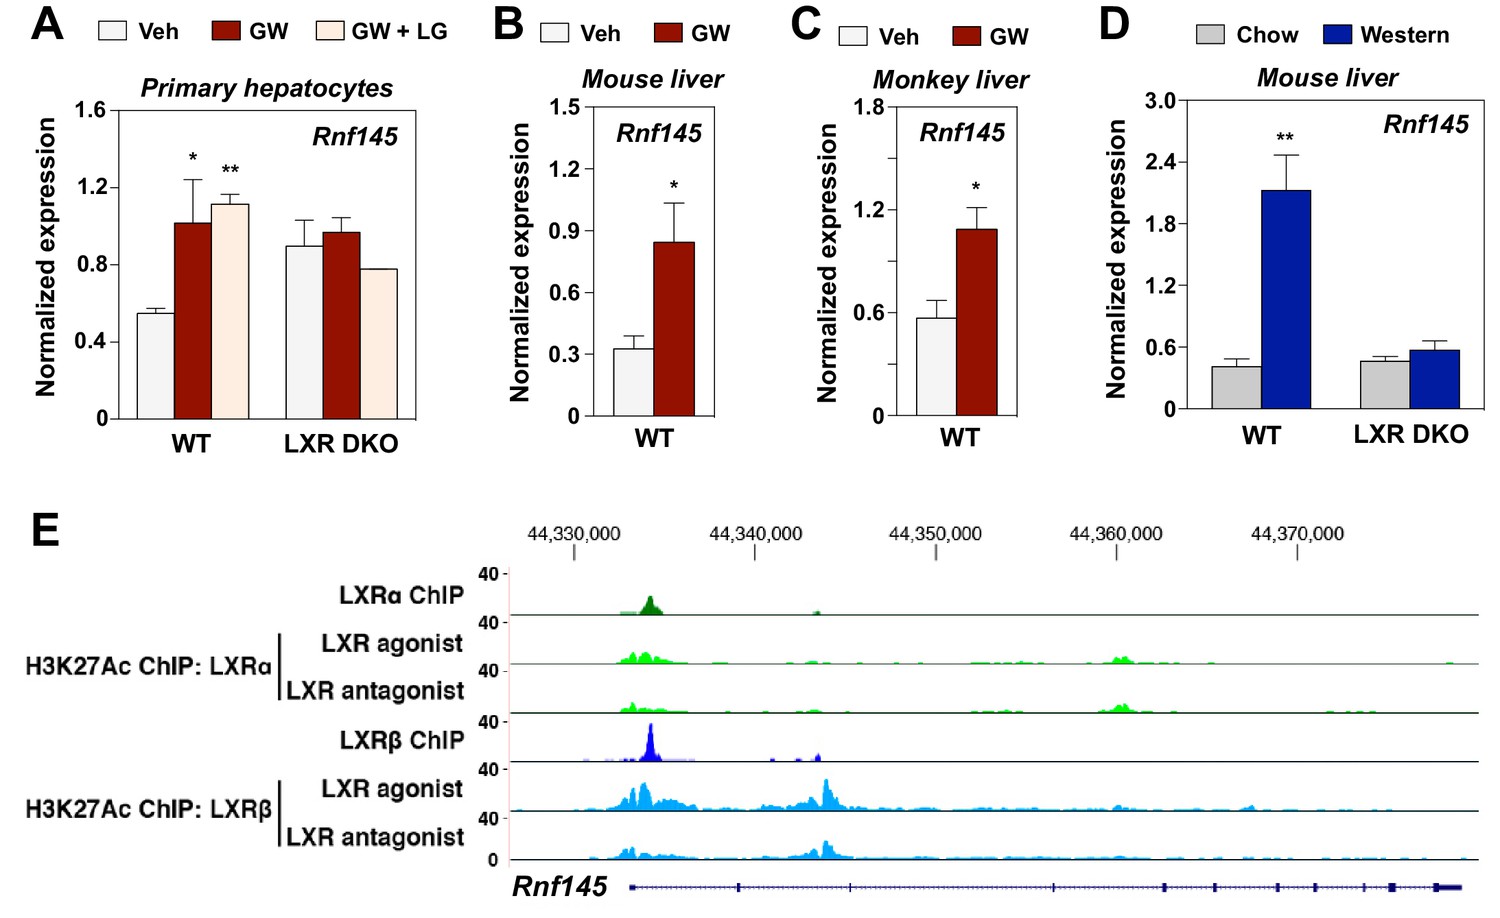
RNF145 is an LXR-regulated ubiquitin E3 ligase gene.
(A) Expression levels of Rnf145 as determined by real-time PCR analysis in primary hepatocytes from wild type or LXR DKO mice treated overnight with DMSO control, GW3965 (1 μM) or the combination of GW3965 (1 μM) and LG268 (50 nM). Results were presented as mean ± standard deviation (SD). (B) Expression levels of Rnf145 in the liver tissue of mice orally gavaged with GW3965 (40 mg/kg/day) for 3 days. N = 5 per group. (C) Expression levels of RNF145 in the liver tissue of cynomolgus monkeys orally gavaged with GW3965 (10 mg/kg/day) for 2 days. N = 5 per group. (D) Expression levels of Rnf145 in the liver tissue of wild-type or LXR DKO mice placed on Western diet for 2 weeks. N = 8 per group. (E) ChIP-seq analysis showing the Rnf145 gene locus in mouse peritoneal macrophages. ChIP was performed with antibodies against FLAG, or acetylated H3K27 in LXR DKO immortalized mouse bone marrow macrophages reconstituted with FLAG-LXRα or FLAG-LXRβ. *p<0.05; **p<0.01 by student’s t-test.
Figure 1—figure supplement 1
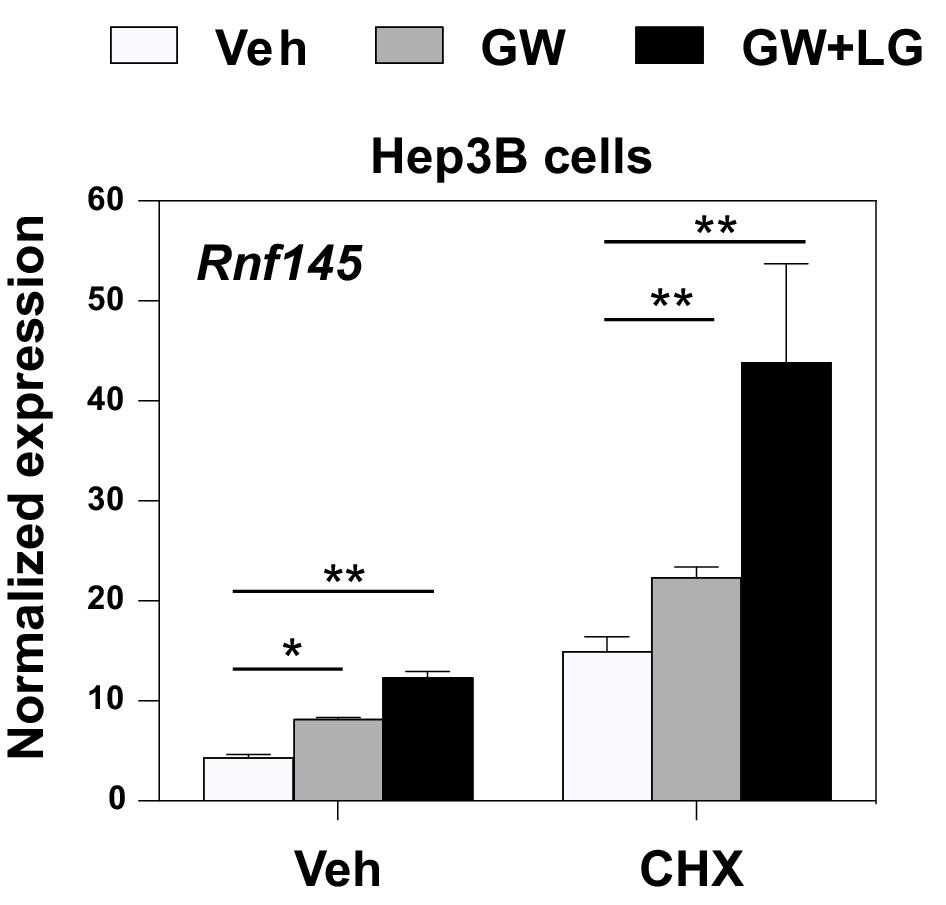
Induction of Rnf145 by LXRs does not require protein synthesis.
Real-time PCR analysis of RNF145 expression in Hep3B cells treated overnight with DMSO control, GW3965 (1 μM) or the combination of GW3965 (1 μM) and LG268 (50 nM), in the presence or absence of the protein synthesis inhibitor cycloheximide (CHX, 1 mg/ml). *p<0.05; **p<0.01 by student’s t-test.
Figure 2

Rnf145 encodes an ER-localized ubiquitin E3 ligase.
Immunofluorescence staining of HEK293T cells transfected with FLAG-tagged RNF145 with antibodies against the FLAG tag or the ER markers calnexin and Sec26, or the mitochondrial marker Tom20.
Figure 3 with 1 supplement
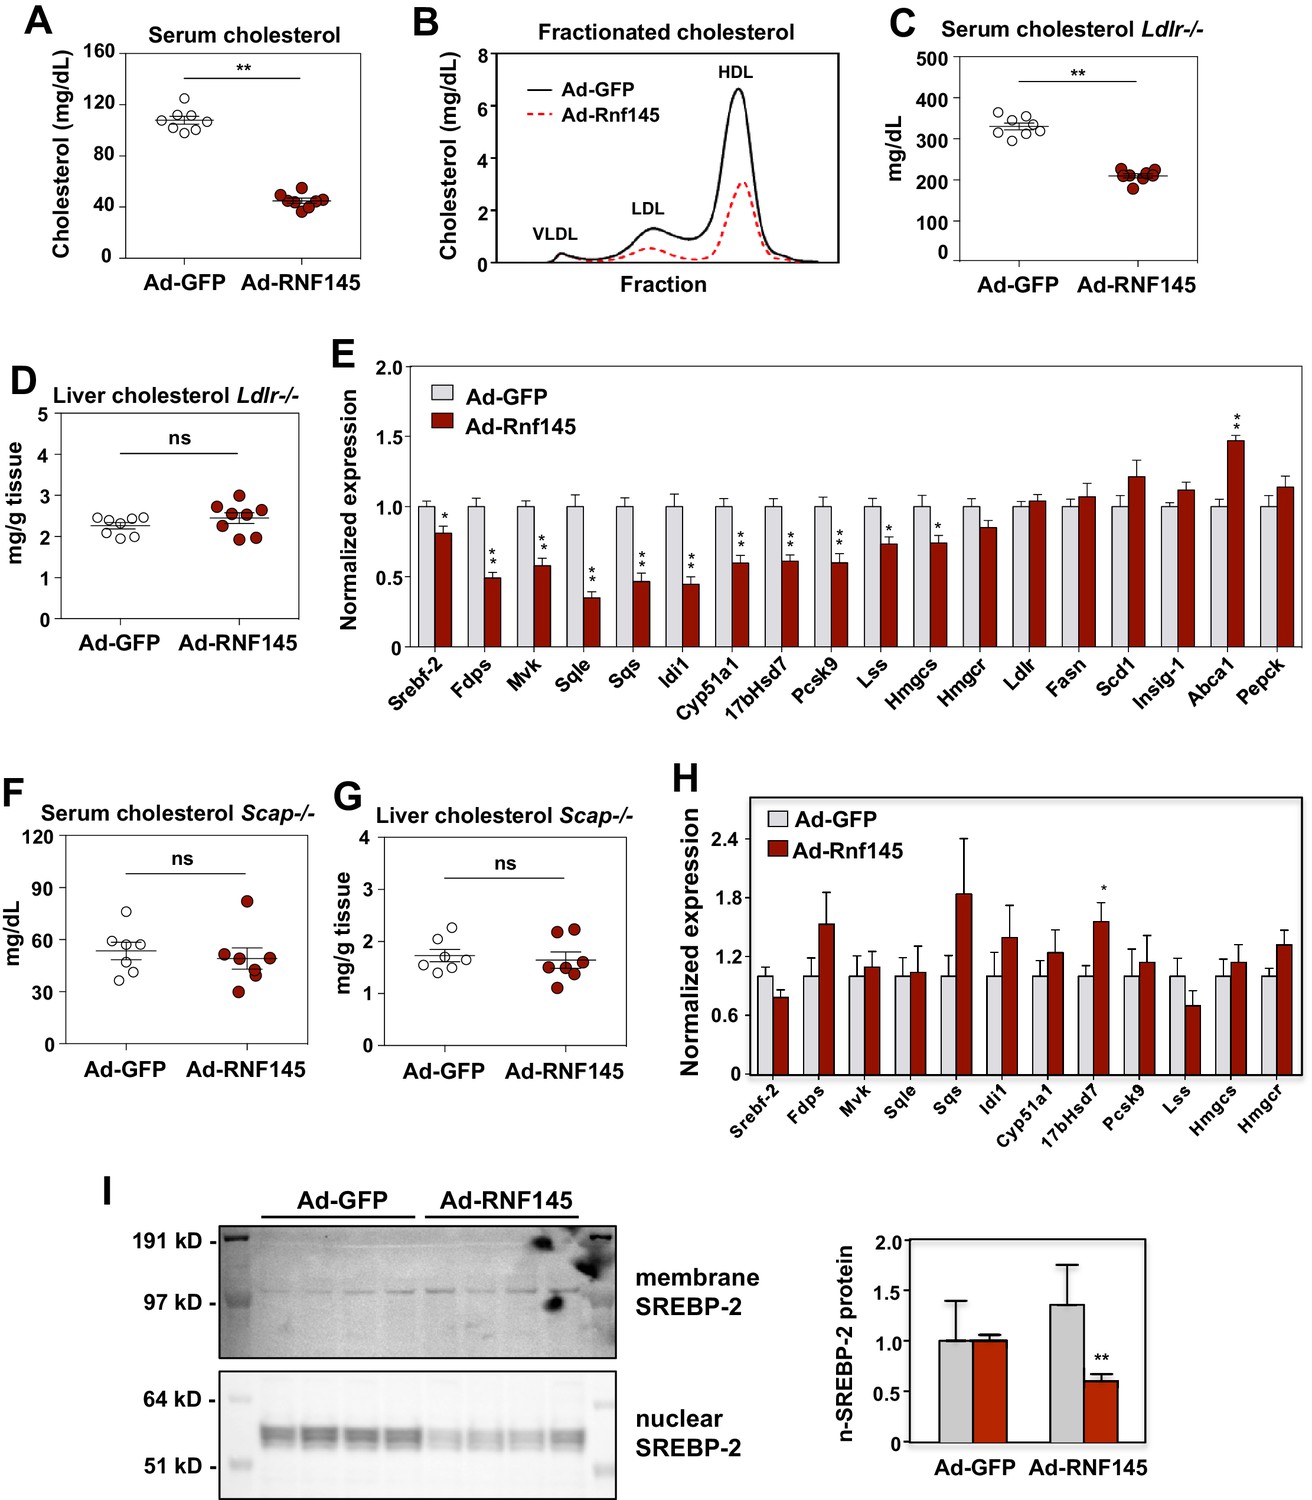
RNF145 reduces serum cholesterol levels and inhibits cholesterol biosynthesis.
(A) Serum cholesterol levels in mice 6 days after injecting with adenovirus expressing GFP or RNF145, N = 8 per group. (B) Serum lipoproteins fractionated by FPLC in mice 6 days after inject with adenovirus expressing GFP or RNF145. (C) Serum cholesterol levels in Ldlr–/– mice 6 days after transduction with adenovirus expressing GFP or RNF145. (D) Cholesterol content in the liver tissue of Ldlr–/– mice 6 days after transduction. (E). Real-time PCR analysis of gene expression in the liver tissue of mice 6 days after transduction with adenovirus expressing GFP or RNF145. N = 8 per group. (F) Serum cholesterol levels in liver-specific Scap knockout (Scap–/–) mice 6 days after transduction with adenovirus expressing GFP or RNF145. N = 8 per group. (G) Cholesterol content in the liver tissue of liver-specific Scap–/– mice 6 days after transduction. (H) Expression levels of the indicated genes in the liver tissue of liver-specific Scap–/– mice 6 days after transduction with adenovirus expressing GFP or RNF145. N = 8 per group. (I) Immunoblot analysis of membrane and nuclear SREBP-2 protein levels in livers from mice transduced with adenovirus expressing GFP or RNF145. Densitometry quantification of the blot is shown at right. *p<0.05; **p<0.01 by student’s t-test.
Figure 3—figure supplement 1
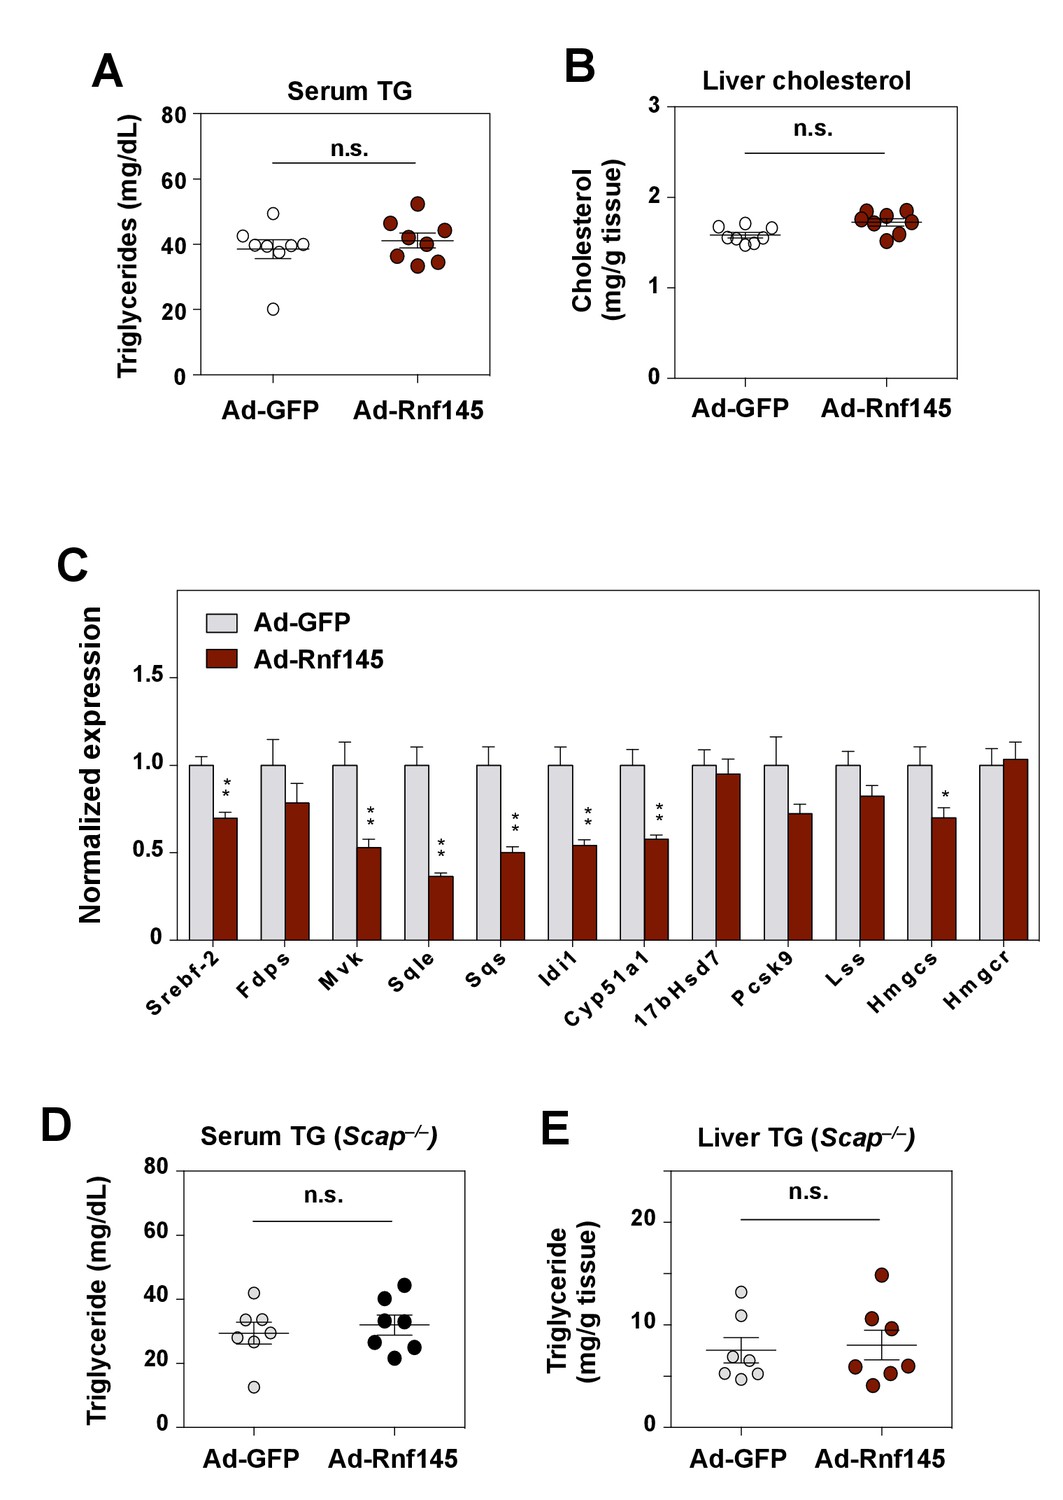
Effects of RNF145 expression in LDLR- or SCAP-deficient mice.
(A) Serum triglyceride levels in mice 6 days after injecting with adenovirus expressing GFP or RNF145. N = 8 per group. (B) Cholesterol content in the liver tissue of mice in A. (C) Real-time PCR analysis of gene expression in the liver tissue of Ldlr–/– mice 6 days after transduction with adenovirus expressing GFP or RNF145. N = 8 per group. (D) Serum triglyceride levels in liver-specific Scap–/– mice 6 days after transduction with adenovirus expressing GFP or RNF145. N = 8 per group. (E) Triglyceride content in the liver tissue of mice in D. *p<0.05; **p<0.01 by student’s t-test.
Figure 4
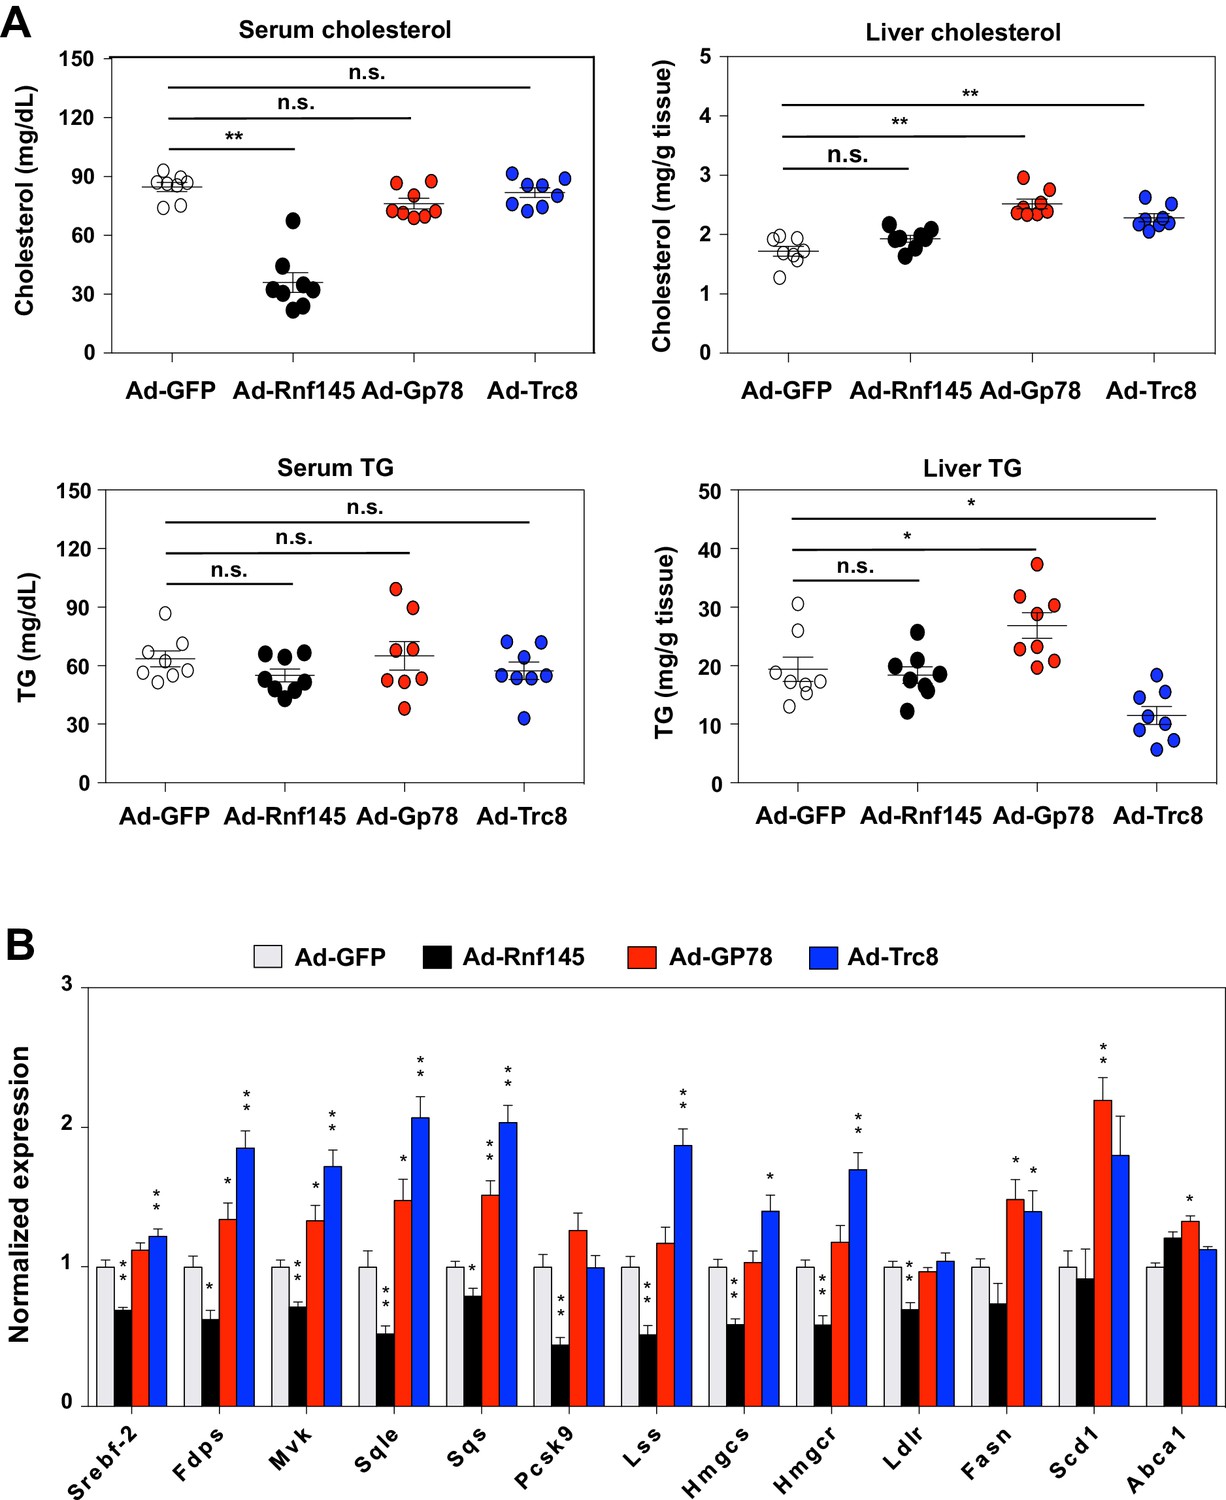
Differential effects of hepatic E3 ubiquitin ligases on metabolism.
(A) Serum and liver cholesterol and triglyceride levels in mice 6 days after transduction with adenovirus expressing GFP, RNF145, GP78 or TRC8. N = 8 per group. (B) Real-time PCR analysis of gene expression in liver tissue from mice 6 days after transduction with adenovirus expressing GFP, RNF145, GP78 or TRC8. N = 8 per group. *p<0.05; **p<0.01.
Figure 5 with 1 supplement
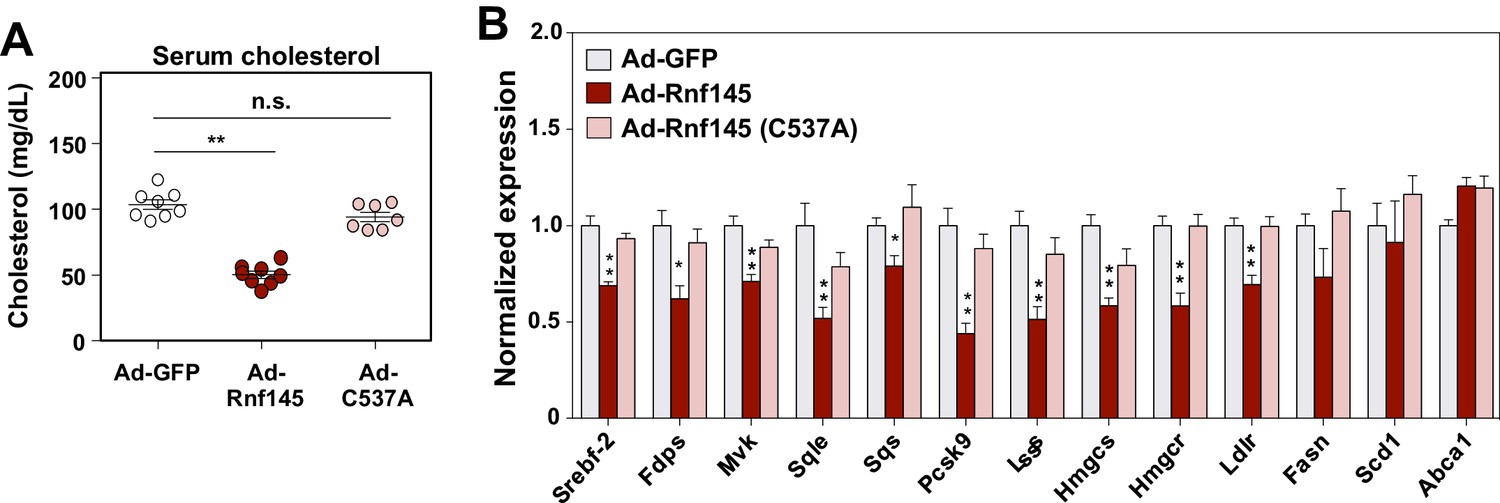
The E3 ligase activity of RNF145 is required for its effects on hepatic metabolism.
(A) Serum cholesterol levels in mice 6 days after transduction with adenovirus expressing GFP, RNF145, or RING-mutant RNF145 (C537A). N = 8 per group. (B) Real-time PCR analysis of gene expression in the liver tissue of mice 6 days after adenoviral transduction. N = 8 per group. *p<0.05; **p<0.01.
Figure 5—figure supplement 1
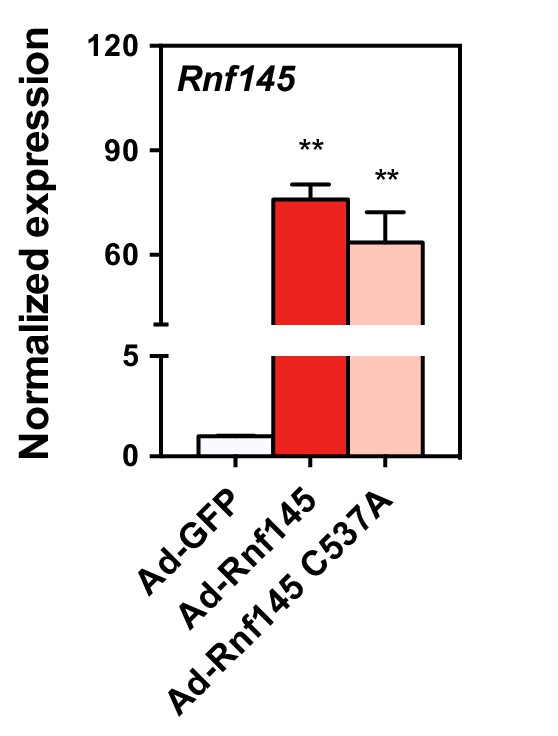
Real-time PCR analysis of gene expression in the liver tissue of mice 6 days after transduction with adenovirus expressing GFP, RNF145, or RING-mutant RNF145 (C537A).
N = 8 per group. **p<0.01.
Figure 6 with 1 supplement
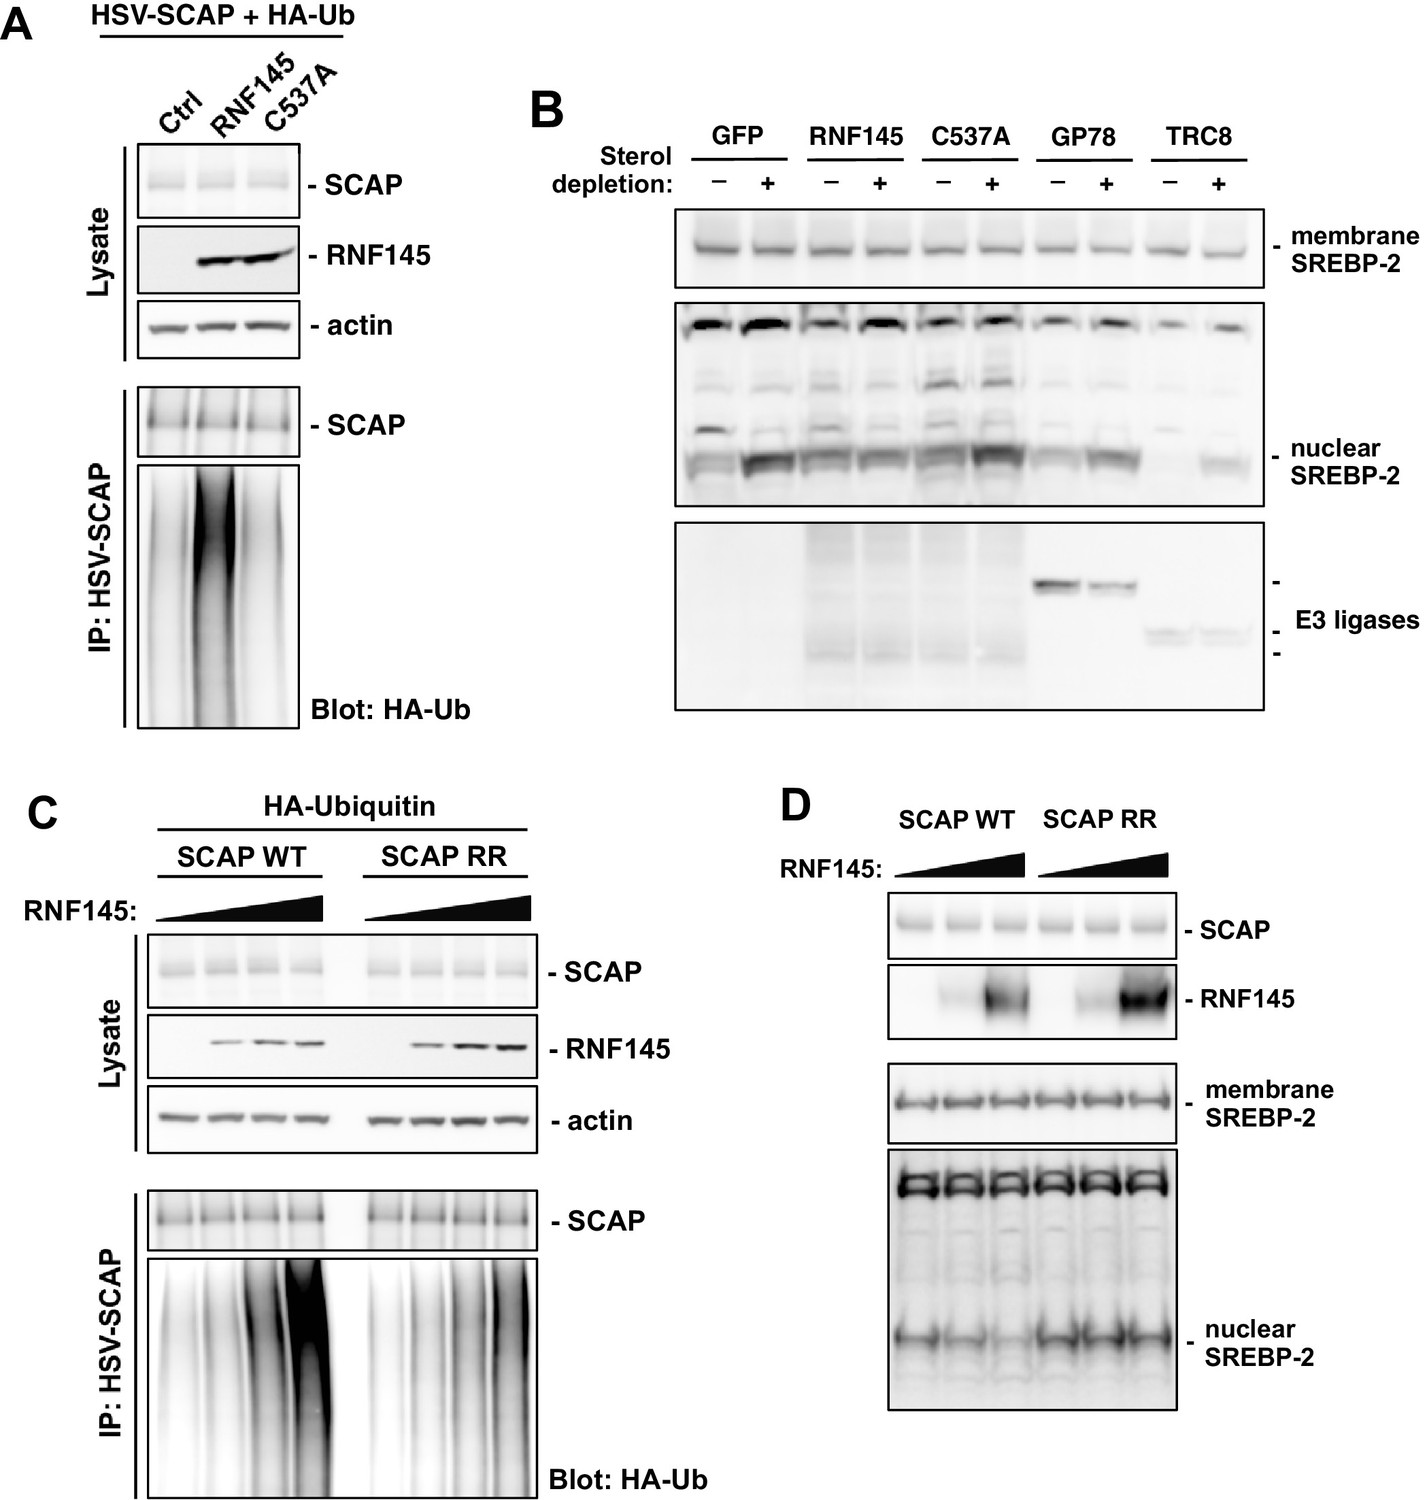
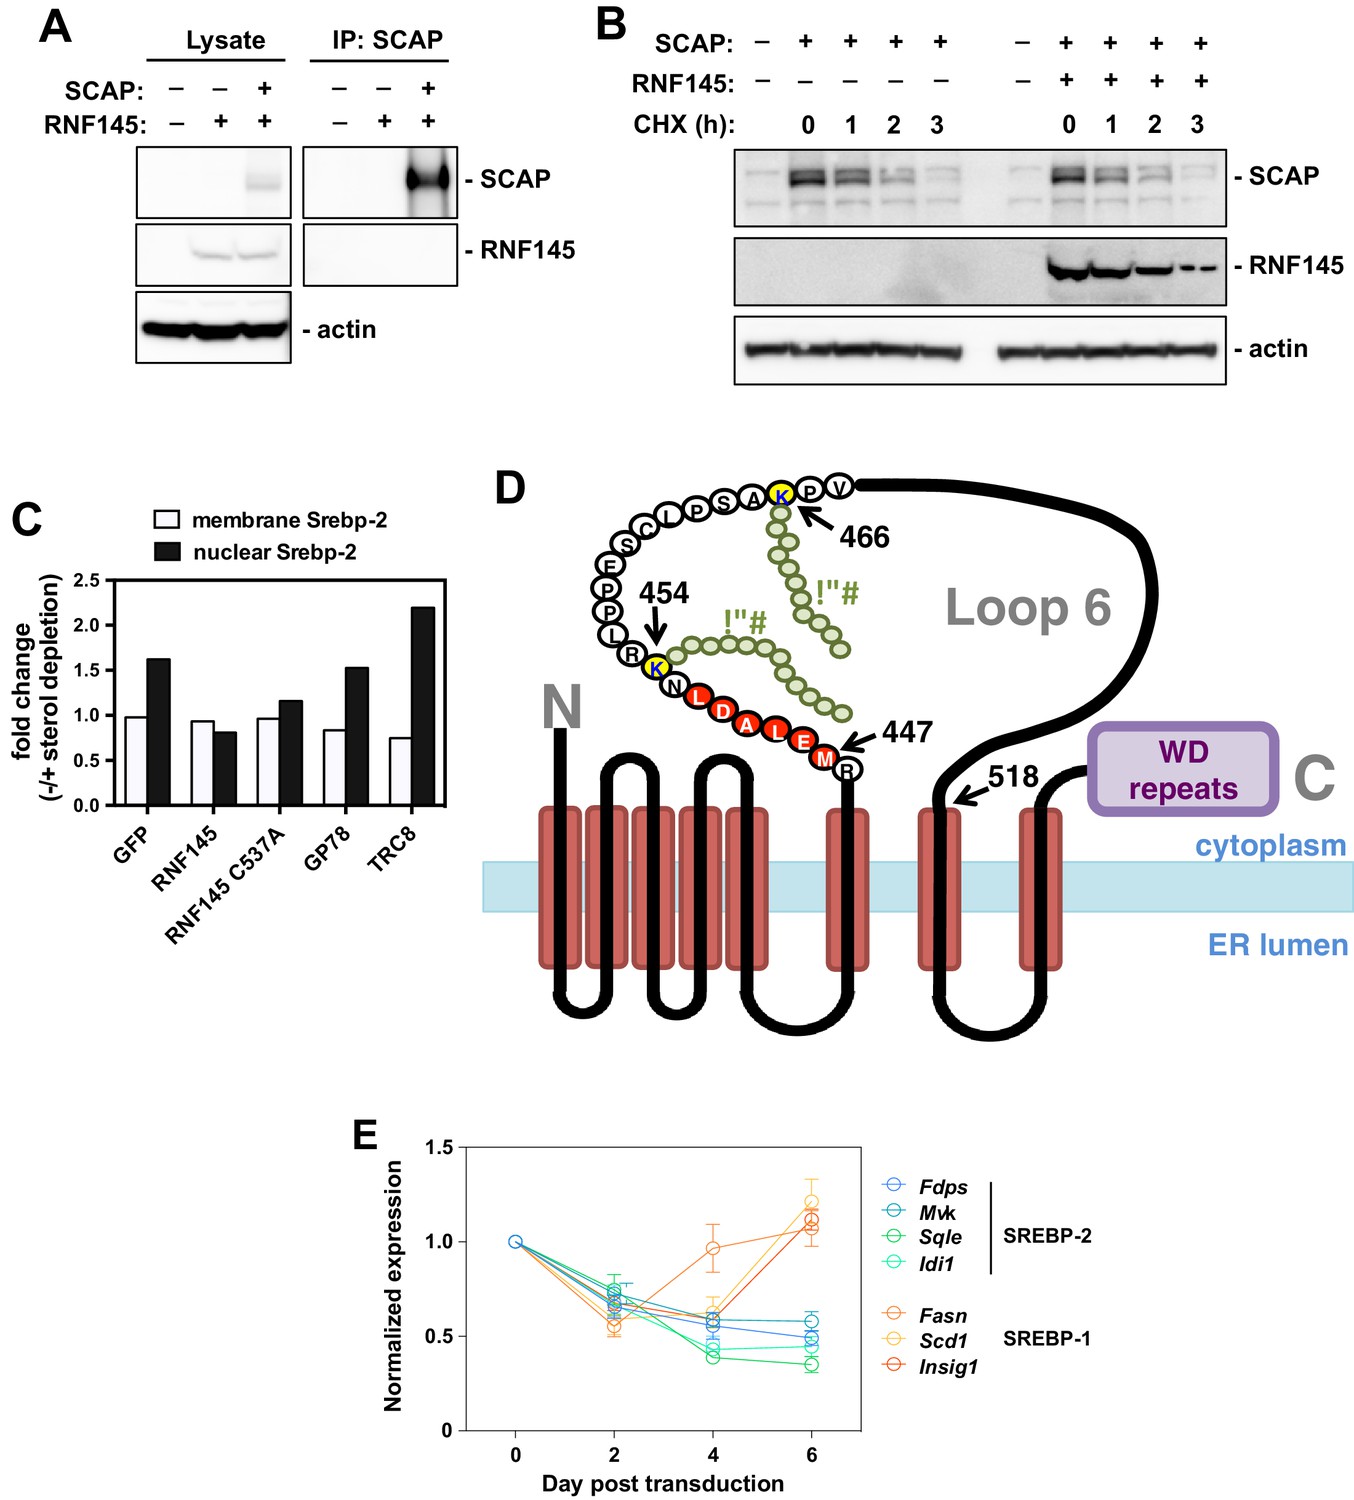
RNF145 ubiquitinates SCAP to inhibit SREBP processing.
(A) CHO cells were transfected with plasmids encoding HSV-tagged SCAP and HA-tagged ubiquitin, together with RNF145 or RING-mutant RNF145 (C537A). Cell lysates were blotted with the indicated antibodies. Cell lysates were also immunoprecipitated with HSV antibody, and the precipitated proteins were blotted with HA antibody. (B) HEK293T cells were transfected with plasmids encoding HSV-tagged SREBP-2 under the control of a TK promoter, together with GFP control, RNF145 or RING-mutant RNF145, GP78, or TRC8. Cells were cultured in DMEM medium supplemented with 10% FBS, or in DMEM medium supplemented with 10% lipoprotein-deficient serum and 25 μM simvastation overnight to deplete sterol, and then treated for 4 hr with MG132 (25 μM). Membrane and nuclear protein fractions of the cells were then isolated and blotted with the indicated antibodies. (C) CHO cells were transfected with plasmids encoding RNF145 and HA-tagged ubiquitin, together with HSV-tagged SCAP or mutant SCAP (K454R, K466R). Cell lysates were blotted with the indicated antibodies. Cell lysates were also immunoprecipitated with HSV antibody, and the precipitated proteins were blotted with HA antibody. (D) SCAP-knockout HEK293 cells were transfected with plasmids encoding HSV-tagged SREBP-2 under the control of a TK promoter and RNF145, together with V5-tagged SCAP or ubiquitination-site mutant SCAP (K454R, K466R). Cells were cultured in DMEM medium supplemented with 10% lipoprotein-deficient serum and 25 μM simvastation overnight to deplete sterol, and then treated for 4 hr with MG132 (25 μM). Membrane and nuclear protein fractions were isolated and blotted with the indicated antibodies.
Figure 6—figure supplement 1
Interaction between RNF145 and the SCAP pathway.
(A) Immunoblot analysis of CHO cells transfected with plasmids encoding HSV-tagged SCAP and FLAG-RNF145. Cell lysates were blotted with the indicated antibodies. Cell lysates were also immunoprecipitated with HSV antibody, and the precipitated proteins were blotted with FLAG antibody. (B) Immunoblot analysis of CHO cells transfected with plasmids encoding HSV-tagged SCAP and FLAG-RNF145 and treated with cycloheximide (10 µg/ml) as indicated. (C) Quantification of the immunoblot signals from Figure 6B. (D) Schematic diagram of the SCAP protein, showing the relative location of the lysine residues ubiquitinated by RNF145 (yellow) and the COPII-binding amino acid sequence (red) within cytoplasmic loop 6 of SCAP. (E) Real-time PCR analysis of gene expression in mice transduced with RNF145 for the indicated times. Gene expression normalized to expression levels in GFP-transduced controls.
Figure 7
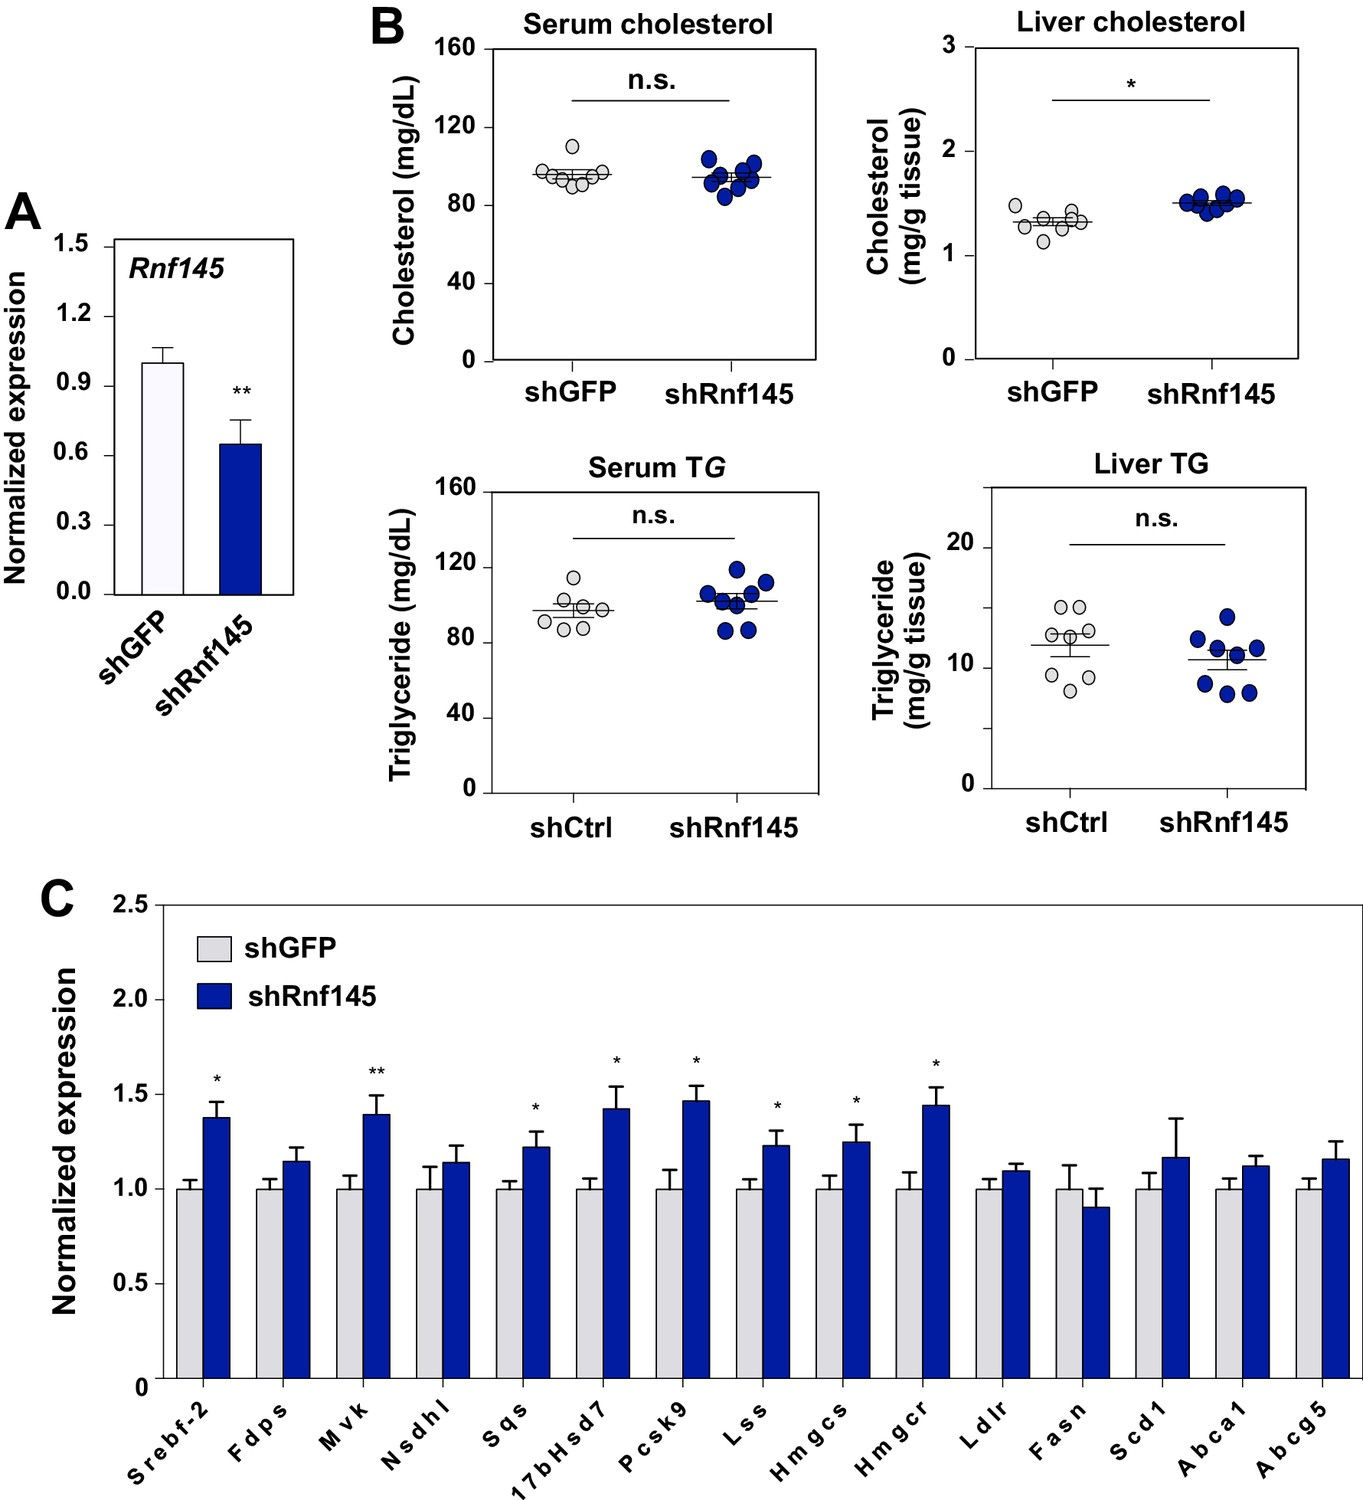
Acute deficiency of RN145 modulates hepatic sterol metabolism.
(A) Expression levels of Rnf145 in mice 6 days after injecting with adenovirus expressing control shRNA or shRNA targeting Rnf145. N = 8 per group. (B) Serum cholesterol levels in mice in A. (C) Cholesterol content in the liver tissue of mice in A. (D) Expression levels of the indicated genes in the liver tissue of mice 6 days after transduction with adenovirus expressing control shRNA or shRNA targeting Rnf145. N = 8 per group.
Figure 8
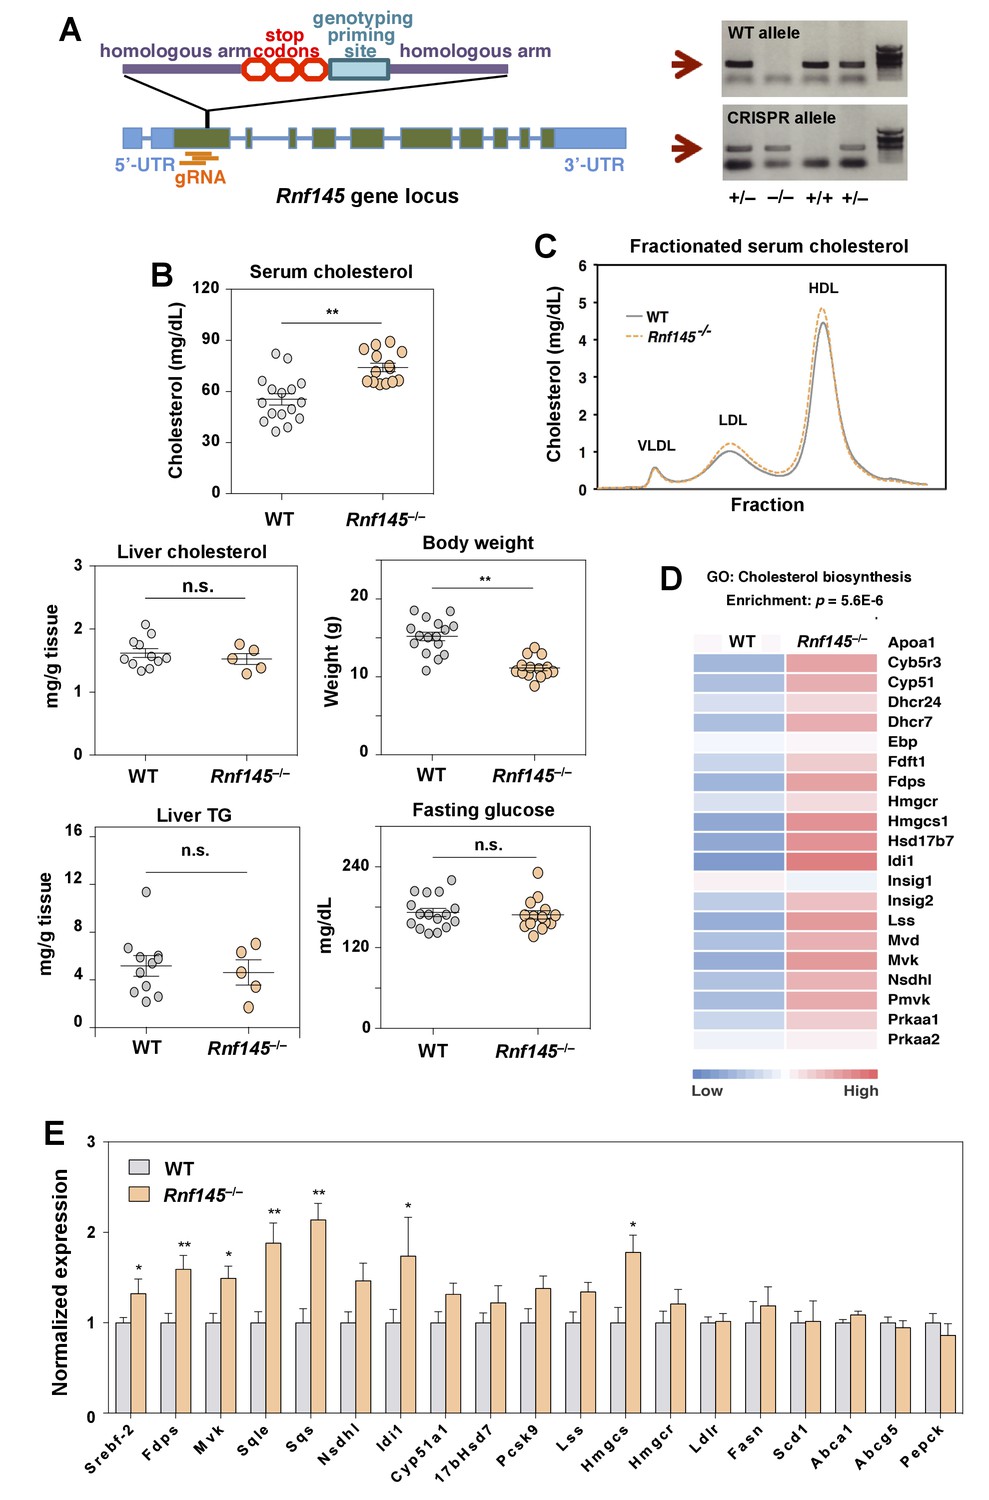
Genetic deficiency of Rnf145 affects cholesterol metabolism.
(A) Schematic diagram showing the strategy used to generate the Rnf145 knockout mouse line (Rnf145–/–) by CRISPR/Cas9-mediated gene editing. (B) Serum and liver cholesterol levels, liver triglyceride levels, body weight and fasting blood glucose in 4 week-old Rnf145 knockout (Rnf145–/–) mice and WT littermates following a 6 hr fast. N = 16 and 14 for WT and Rnf145–/– mice, respectively. (C) Cholesterol levels in FLPC-fractionated serum from mice in B. (D) Heatmap representation of the expression levels of genes categorized to the cholesterol biosynthetic pathway from microarray-based gene expression profiling of the liver tissue of 4 week-old Rnf145–/– mice and WT littermates following a 6 hr fast. (E) Real-time PCR analysis of gene expression in the liver tissue of 4 week-old Rnf145–/– mice and WT littermates following a 6 hr fast. N = 11 and 5 for WT and Rnf145–/– mice, respectively. *p<0.05; **p<0.01 by student’s t-test.
Additional files
-
Transparent reporting form
- https://doi.org/10.7554/eLife.28766.014
Download links
A two-part list of links to download the article, or parts of the article, in various formats.
Downloads (link to download the article as PDF)
Open citations (links to open the citations from this article in various online reference manager services)
Cite this article (links to download the citations from this article in formats compatible with various reference manager tools)
Inhibition of cholesterol biosynthesis through RNF145-dependent ubiquitination of SCAP
eLife 6:e28766.
https://doi.org/10.7554/eLife.28766


