Nodal patterning without Lefty inhibitory feedback is functional but fragile
- Harvard University, United States
- Harvard Medical School, United States
- Massachusetts General Hospital, United States
- Broad Institute of MIT and Harvard University, United States
Figures
Figure 1 with 2 supplements
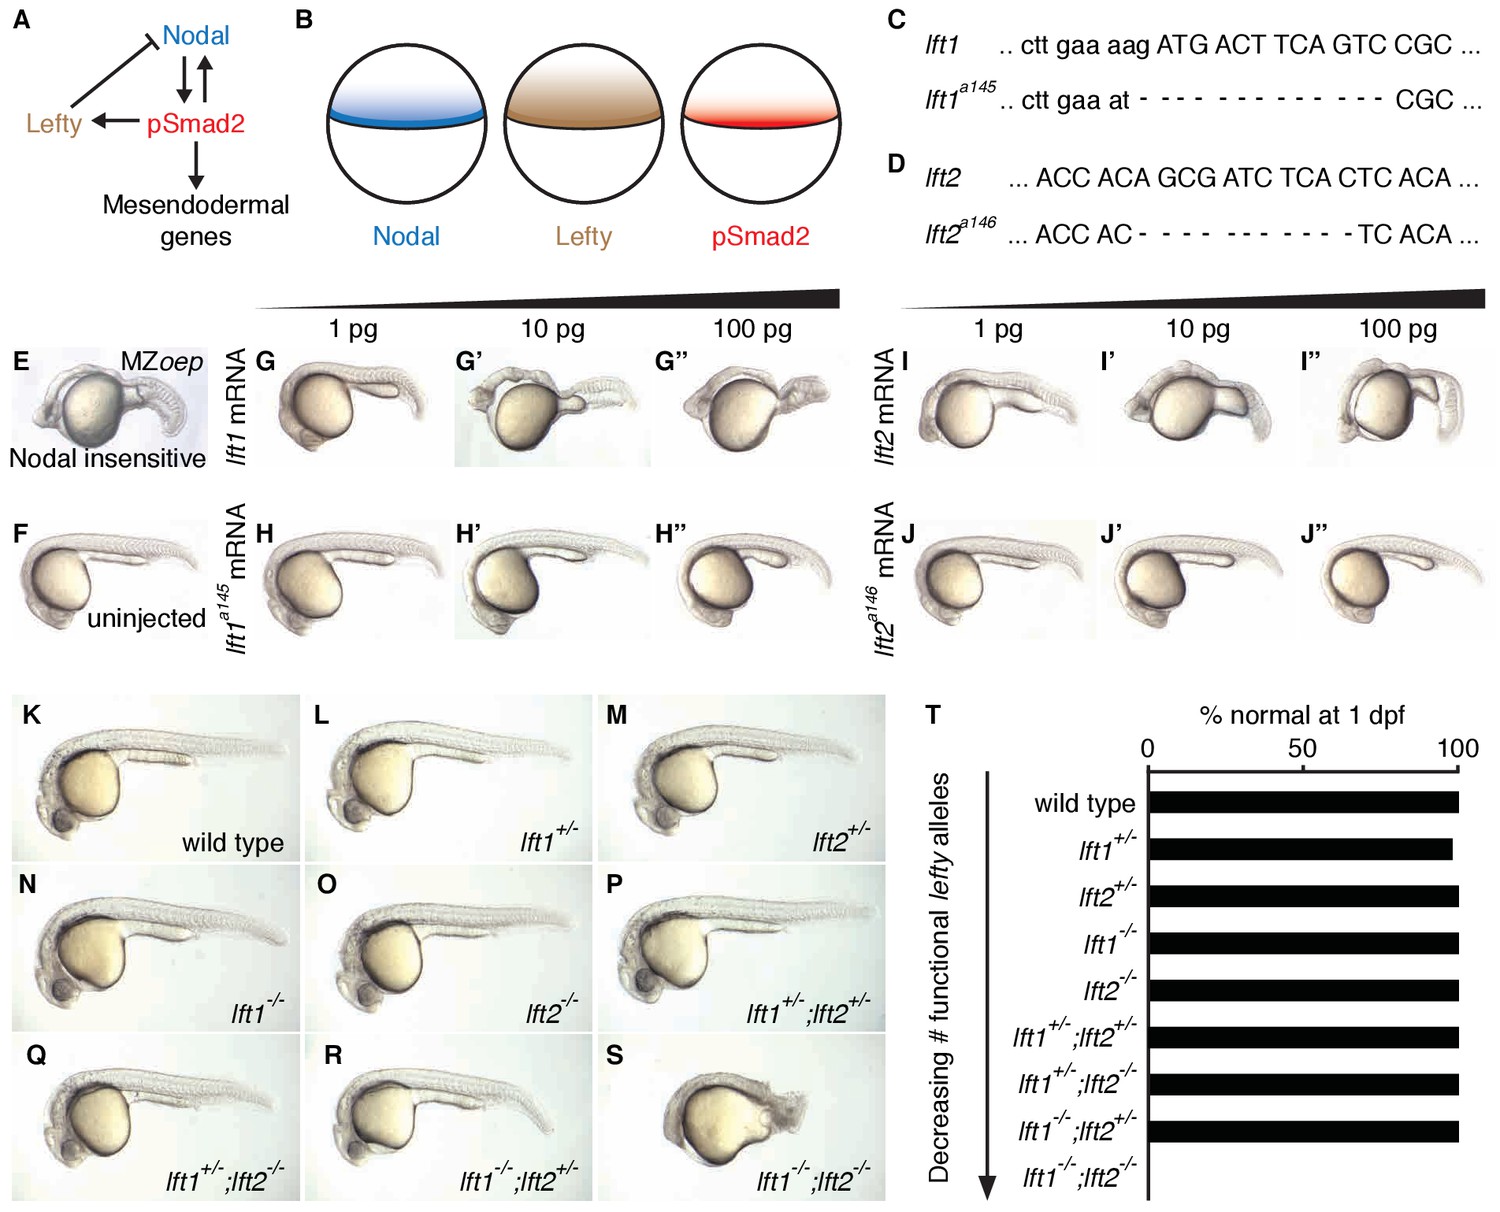
Complete Lefty loss causes severe patterning defects.
(A) Nodal activates itself, mesendodermal genes, and the secreted feedback inhibitor Lefty by inducing phosphorylation and nuclear translocation of the signal transducer Smad2. (B) Nodal (blue) and Lefty (brown) are expressed in overlapping domains at the margin (black line) in zebrafish embryos, generating a signaling gradient of phosphorylated Smad2 (red). (C) A 13-base-pair deletion at the 5’ end of lft1a145 removes the translational start site (TSS) and part of the signal sequence. An alternative TSS 36 bp downstream of the deletion could produce an in-frame protein product, but the first 16 amino acids, and therefore most of the predicted 20-aa signal sequence, would be missing. (D) An 11-base-pair deletion at the 5’ end of lft2a146 removes part of the predicted 19-aa signal sequence, causing a frame shift after 36 bp resulting in a stop codon 18 bp later. (E–J’’) Testing the activity of lft mutant mRNA. All images were obtained at 24 hr post-fertilization (hpf). Wild type embryos at the one-cell stage were injected with 1, 10, and 100 pg wild type lft1 (G–G’’) or lft1a145 (H–H’’) mRNA as indicated. Embryos expressing lft1 mRNA exhibit Nodal loss-of-function phenotypes, similar to maternal-zygotic mutants for the zebrafish EGF-CFC co-receptor one-eyed pinhead (oep) (E), which are insensitive to Nodal signaling (Gritsman et al., 1999). Embryos expressing mutant mRNA do not exhibit Nodal loss-of-function phenotypes. Similar results were obtained for wild type lft2 (I–I’’) and lft2a146 (J–J’’) mRNA. (F) Uninjected wild type embryo. (K–S) lft mutant phenotypes. All images were obtained at 24–29 hpf. A single functional lft allele is sufficient for grossly normal patterning (Q,R). (S) lft1-/-;lft2-/- double homozygous mutants have severe patterning defects and lack eyes, heart, and full length tails, and often exhibit excess tissue along the posterior trunk. (T) Percentage of embryos with normal gross morphology at 1 day post-fertilization (dpf). Number of normal/total embryos: wild type = 50/50, lft1+/- = 49/50, lft2+/- = 46/46, lft1-/- = 50/50, lft2-/- = 46/46, lft1+/-;lft2+/- = 50/50, lft1+/-;lft2-/- = 43/43, lft1-/-;lft2+/- = 24/24 lft1-/-;lft2-/- = 0/55.
Figure 1—figure supplement 1
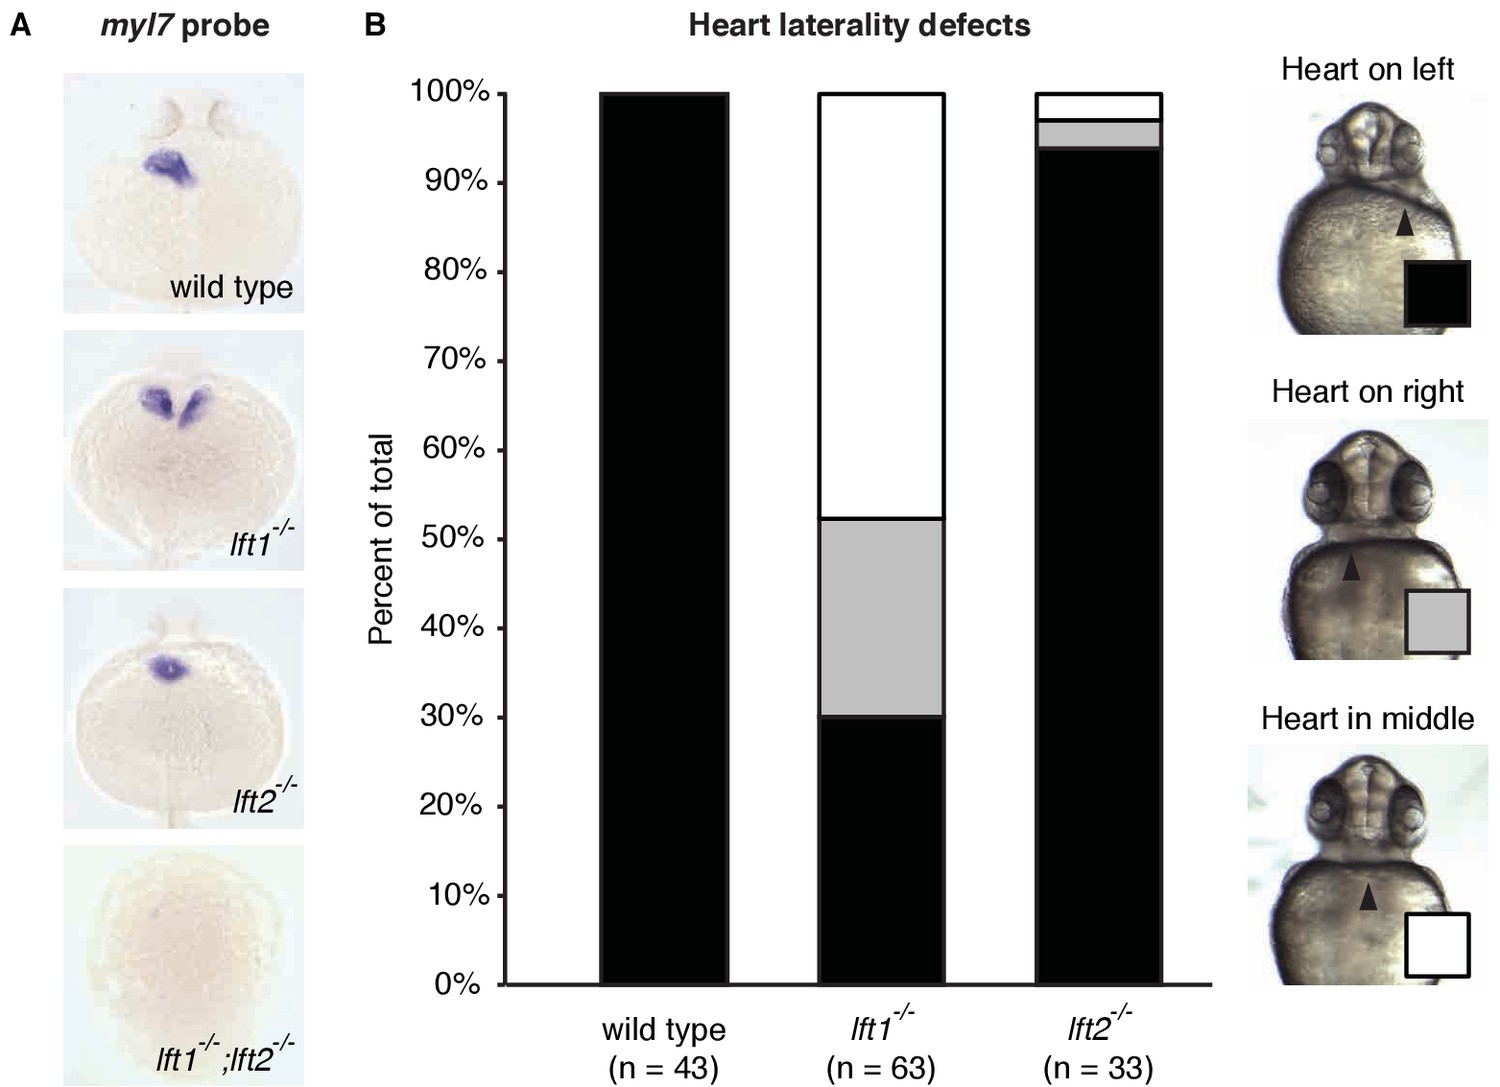
lefty1-/- mutants exhibit partially penetrant heart laterality defects.
(A) In situ hybridization using a probe against the heart muscle marker myl7 in 24 hr post-fertilization (hpf) wild type and lft mutant embryos (dorsal views). Most wild type and lft2-/- mutants exhibit myl7 expression on the left side. In contrast, some lft1-/- mutants exhibit bilateral myl7 expression, and lft1-/-;lft2-/- mutants express very little myl7 and typically fail to generate hearts (dorsal views). (B) Quantification of heart laterality defects in lft1-/- and lft2-/- mutants (ventral views). Live embryos were scored at 30 hpf. Whereas lft2-/- mutants typically exhibit normal heart laterality, lft1-/- mutants frequently have misplaced hearts. Despite this heart laterality defect, lft1-/- mutants are viable.
Figure 1—figure supplement 2
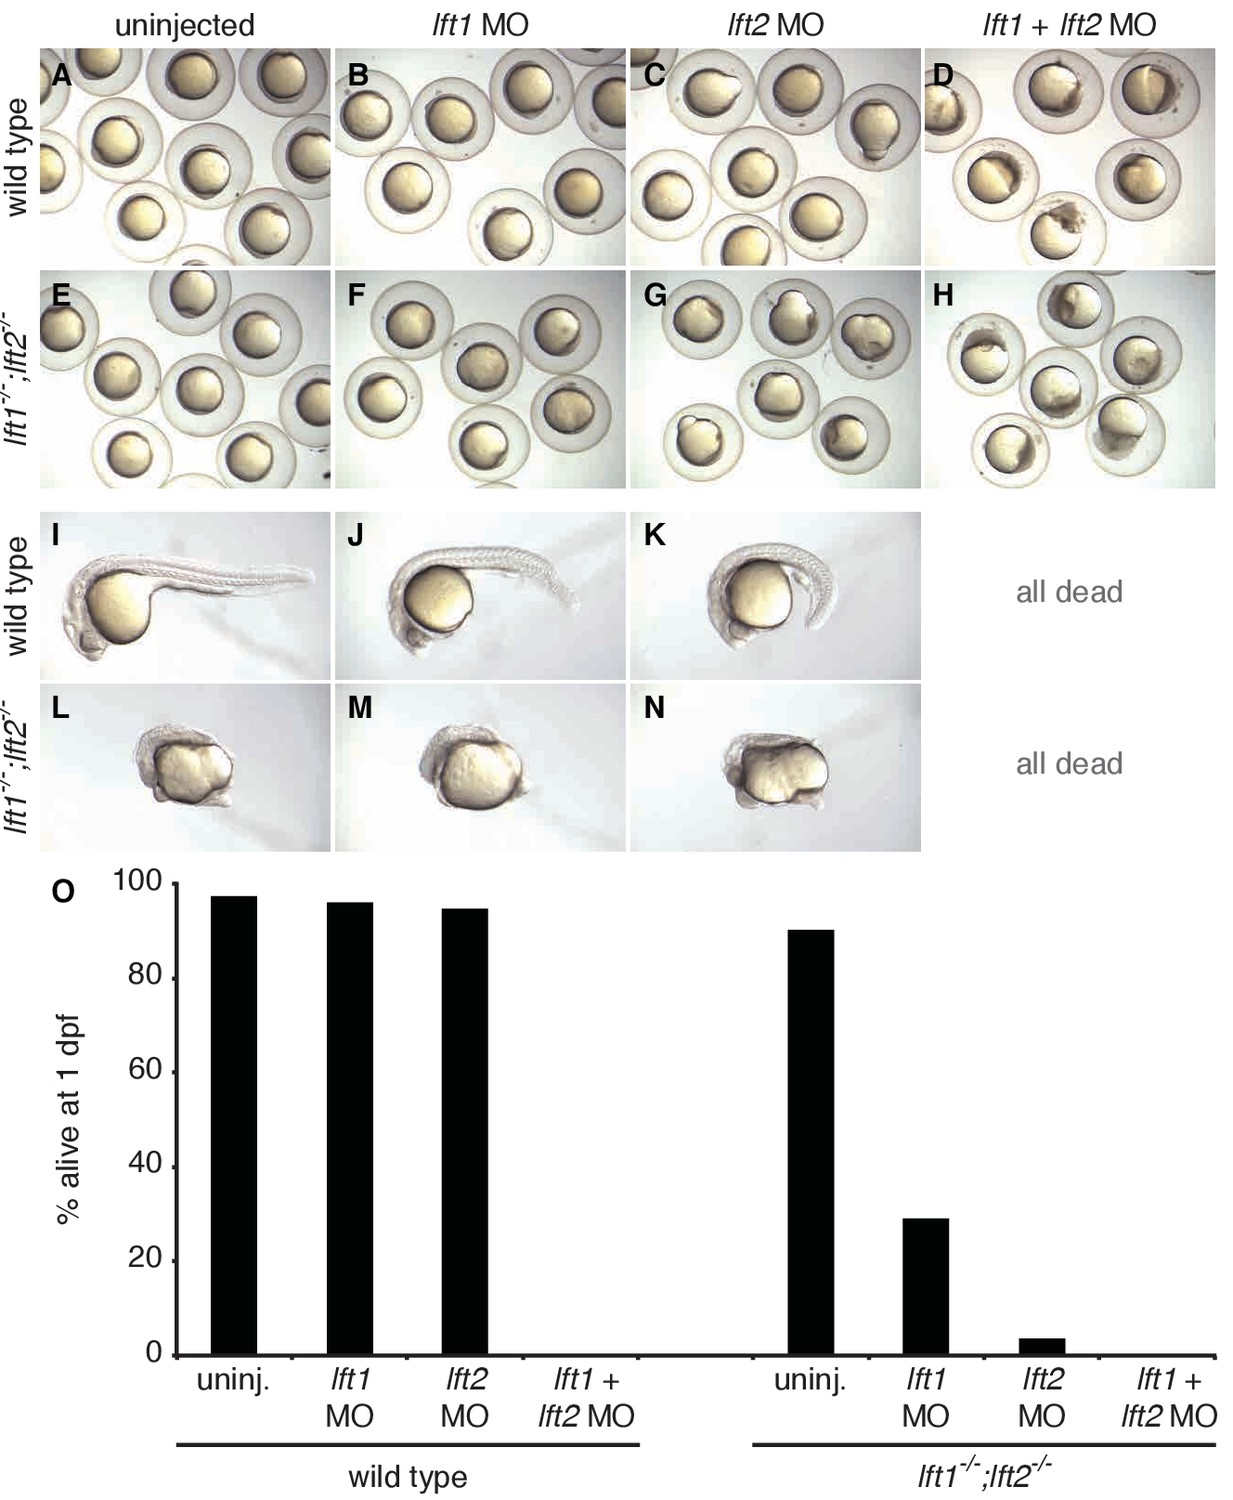
lefty double mutants and morphants have distinct phenotypes.
About 97% of double lft morphants die by 24 hr post-fertilization (hpf) and undergo strongly disrupted gastrulation (Agathon et al., 2001; Feldman et al., 2002). In contrast, most lft1-/-;lft2-/- mutants underwent gastrulation and survived past 24 hpf. Axis bifurcation occurred with variable penetrance in lft1-/-;lft2-/- mutants, but has not been reported in double lft morphants. Double morphants exhibited expansion of sox32 and tb at 30% epiboly (Agathon et al., 2001; Chen and Schier, 2002), whereas expansion was only evident in double mutants starting at gastrulation (Figure 3, Figure 3—figure supplement 1). In addition, lft transcripts are present at low or undetectable levels prior to sphere stage (Pauli et al., 2012), and lft1-/-;lft2-/- adult females crossed to wild type males produce viable offspring (data not shown), suggesting that differences in morphant and mutant phenotypes are unlikely to be due to inhibition of maternally contributed lft. We also note that loss of sqt, but not cyc, reduced mesendodermal expansion and gastrulation defects in double morphants (Chen and Schier, 2002; Feldman et al., 2002), but loss of either sqt or cyc partially rescued morphology in double mutants (Figure 4). These differences suggest that, as other work has shown (Kok et al., 2015; Schulte-Merker and Stainier, 2014), off target morpholino effects may confound studies of gene function. (A–N) Wild type (A–D, I–K) and lft1-/-;lft2-/- mutant (E–H, L–N) embryos were injected with 7 ng lft1 morpholino (B,F,J,M), 7 ng lft2 morpholino (C,G,K,N), or 7 ng of each morpholino together (D,H). At 12 hpf (A–H), wild type and mutant embryos injected with both morpholinos exhibited severe gastrulation defects not observed in uninjected embryos. At 1 day post-fertilization (dpf) (I–N), all embryos injected with both morpholinos were dead. (O) Percentage of embryos alive at 1 dpf. Number of living/total embryos at 1 dpf: uninjected wild type = 38/39, wild type +lft1 MO = 25/26, wild type + lft2 MO = 18/19, wild type + lft1/2 MOs = 0/22, uninjected lft1-/-;lft2-/-= 47/52, lft1-/-;lft2-/- + lft1 MO: 7/24, lft1-/-;lft2-/- + lft2 MO = 1/27, lft1-/-;lft2-/- + lft1/2 MOs = 0/22. lft1 MO sequence: 5’-cgcggactgaagtcatctttcaag-3'. lft2 MO sequence: 5’-agctggatgaacagagccatgct-3'.
Figure 2 with 1 supplement

Lefty loss causes expanded Nodal signaling gradients.
α-pSmad2 staining (red) at sphere stage (A, animal views) and 50% epiboly (B, lateral views) in representative wild type and lft1-/-;lft2-/- mutant embryos (nuclei labeled with Sytox nuclear stain (green)). Note stronger pSmad2 staining in lft1-/-;lft2-/- mutant embryos compared to wild type. (C) Quantification of pSmad2 gradients in wild type (blue) and lft1-/-;lft2-/- (red) mutant embryos at dome stage (dashed) and 50% epiboly (solid) shows an increase in the amplitude and range of the signaling gradient in lft1-/-;lft2-/- mutants. See Materials and methods and Figure 2—figure supplement 1 for quantification details.
Figure 2—figure supplement 1
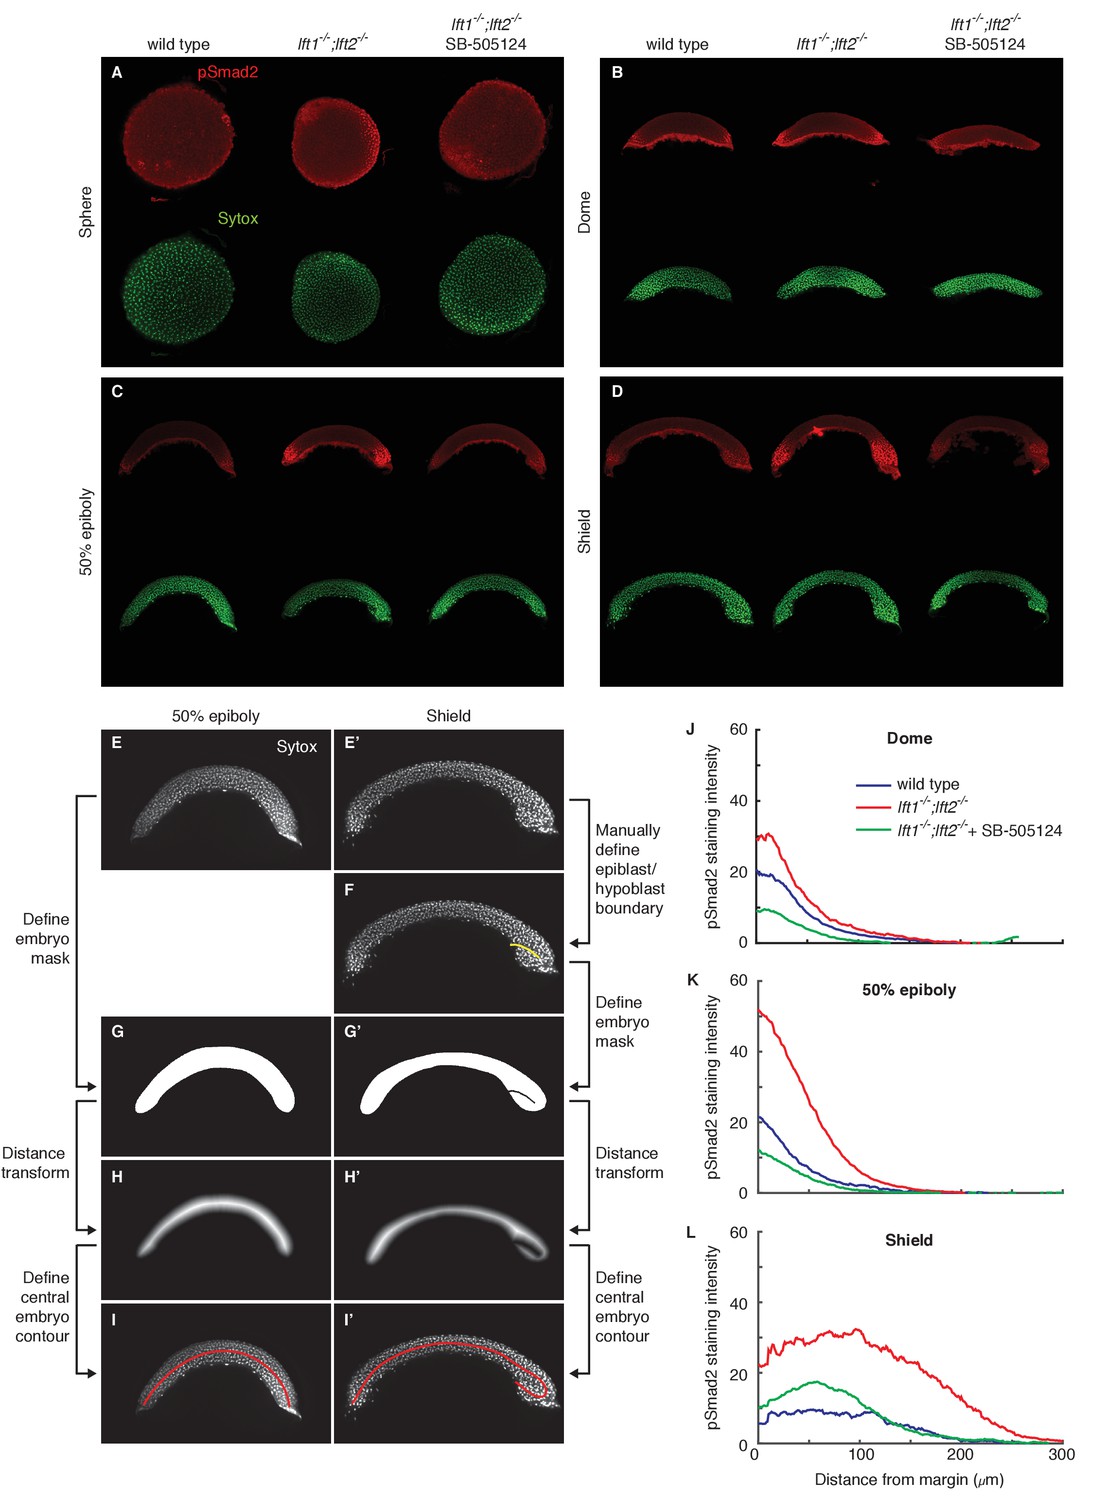
pSmad2 gradient quantification.
pSmad2 gradients were visualized by α-pSmad2 immunofluorescence in wild type embryos, lft1-/-;lft2-/- mutant embryos, and lft1-/-;lft2-/- mutant embryos treated with 2 μM SB-505124 (Nodal inhibitor drug) starting at the 8 cell stage. (A–D) Representative maximum intensity projections for α-pSmad2 staining (red) and Sytox nuclear stain (green) in sphere (A), dome (B), 50% epiboly (C), and shield (D) stage embryos. Sphere stage embryos are animal pole views; all other stages are laterally oriented. For lateral images, projections were derived from the 10 slices surrounding the center of the embryo. (E–I’) Nodal signaling gradients were quantified by measuring nuclear pSmad2 immunofluorescence as a function of distance from the margin. To quantify gradients, individual nuclei were first identified, their distance from the embryo margin along a contour following the midline of the embryo cross-section was measured, the fluorescence intensity in each nucleus was determined, and finally intensity versus distance was plotted (see Materials and methods). The process of defining the contour for 50% epiboly (E,G,H,I) and shield (E’,F’,G’,H’,I’) stage embryos is illustrated here. (E,E’) Maximum intensity projections of Sytox green stacks used to identify nuclei and define embryo contour. The ten planes closest to the center of the embryo (five planes above and five below center) were used for quantification and calculation of the central contour. (F) For shield stage embryos, the boundary between the epiblast and involuting hypoblast was manually defined (yellow line). This boundary allowed the central contour to ‘wrap’ around the epiblast/hypoblast boundary at the embryonic shield. (G,G’) A minimal mask containing all segmented nuclei was defined. For shield stage embryos, pixels corresponding to the hypoblast/epiblast boundary were set to zero. (H,H’) To identify an approximate embryo midline, the distance transform of the inverse of the embryo mask (panels G,G’) was calculated. In this new representation, pixels within the mask that are the farthest from the mask boundary (i.e. pixels along its midline) have the highest values. (I,I’) The central contour of each embryo was defined by stepping from one margin to the other along the central maxima of the distance transform. The final contours used for gradient quantification are shown in red. (J–L) pSmad2 gradients are plotted for dome (J), 50% epiboly (K), and shield stages (L). Gradients in lft1-/-;lft2-/- mutants (red) have higher amplitudes than wild type (blue) or drug-treated lft1-/-;lft2-/- mutant (green) gradients. Some images from (A), (C), and (D) are also used in Figure 2.
Figure 3 with 1 supplement
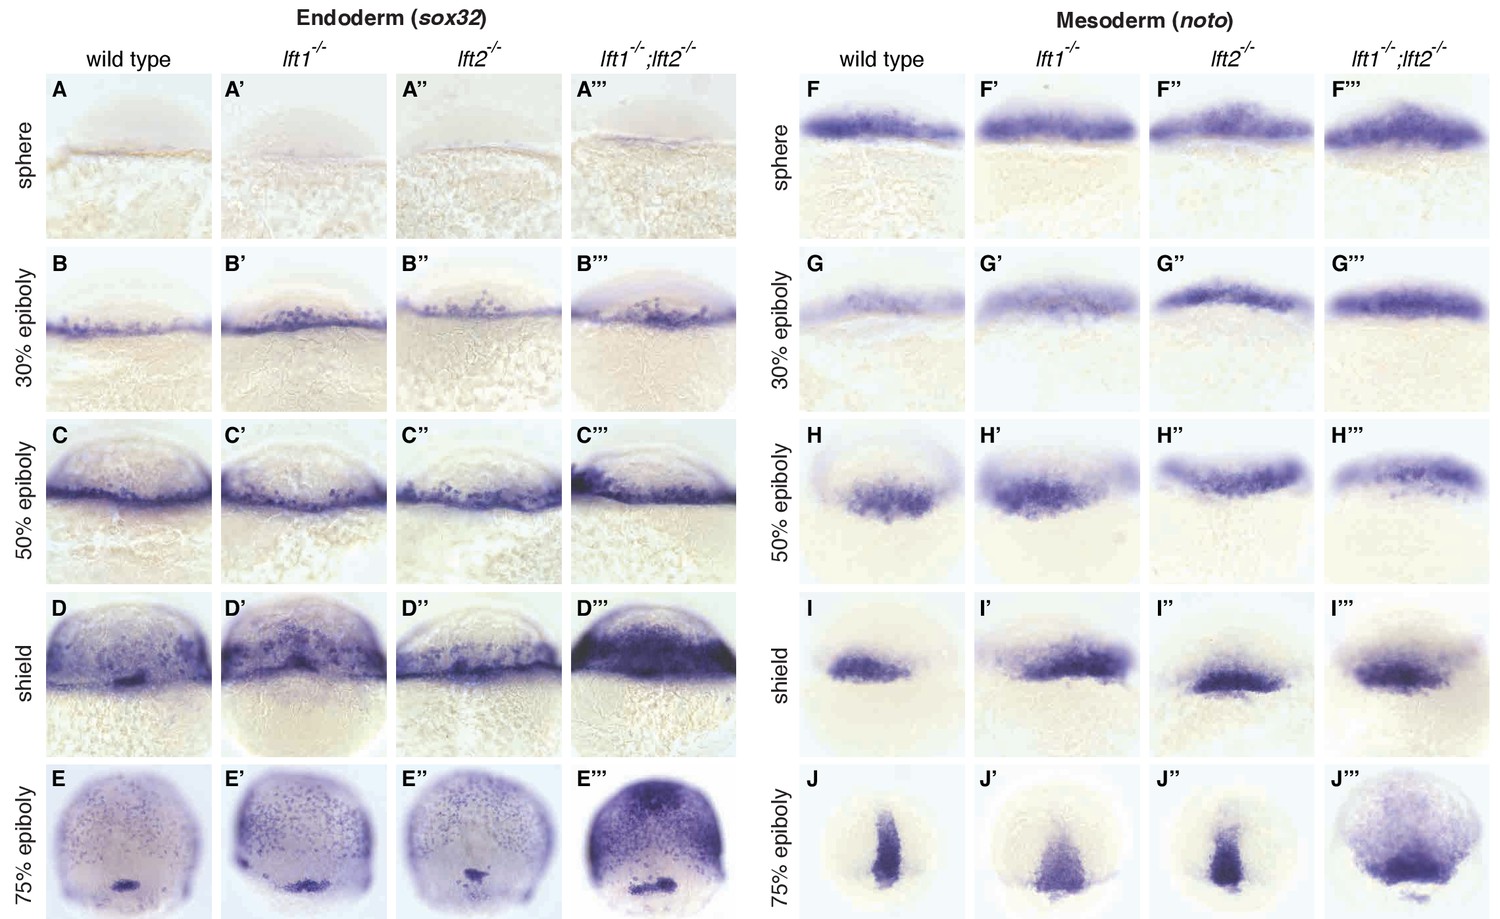
Lefty loss causes expanded expression of mesendodermal genes.
In situ hybridization comparing expression of endodermal (sox32/casanova) (A–E’’’) and mesodermal (noto/floating head) (F–J’’’) genes in wild type, lft1-/- mutants, lft2-/- mutants, and lft1-/-;lft2-/- mutants at the indicated developmental stages (dorsal views). Note upregulation of mesendoderm in lft1-/-;lft2-/- mutants starting at early gastrulation stages (e.g., shield stage). lft1-/-;lft2-/- embryos were generated from lft1+/-;lft2-/- incrosses, lft1-/-;lft2-/- incrosses, or lft1-/-;lft2-/- X lft1+/-;lft2-/- crosses. Embryos were genotyped after imaging (see Materials and methods for details).
Figure 3—figure supplement 1
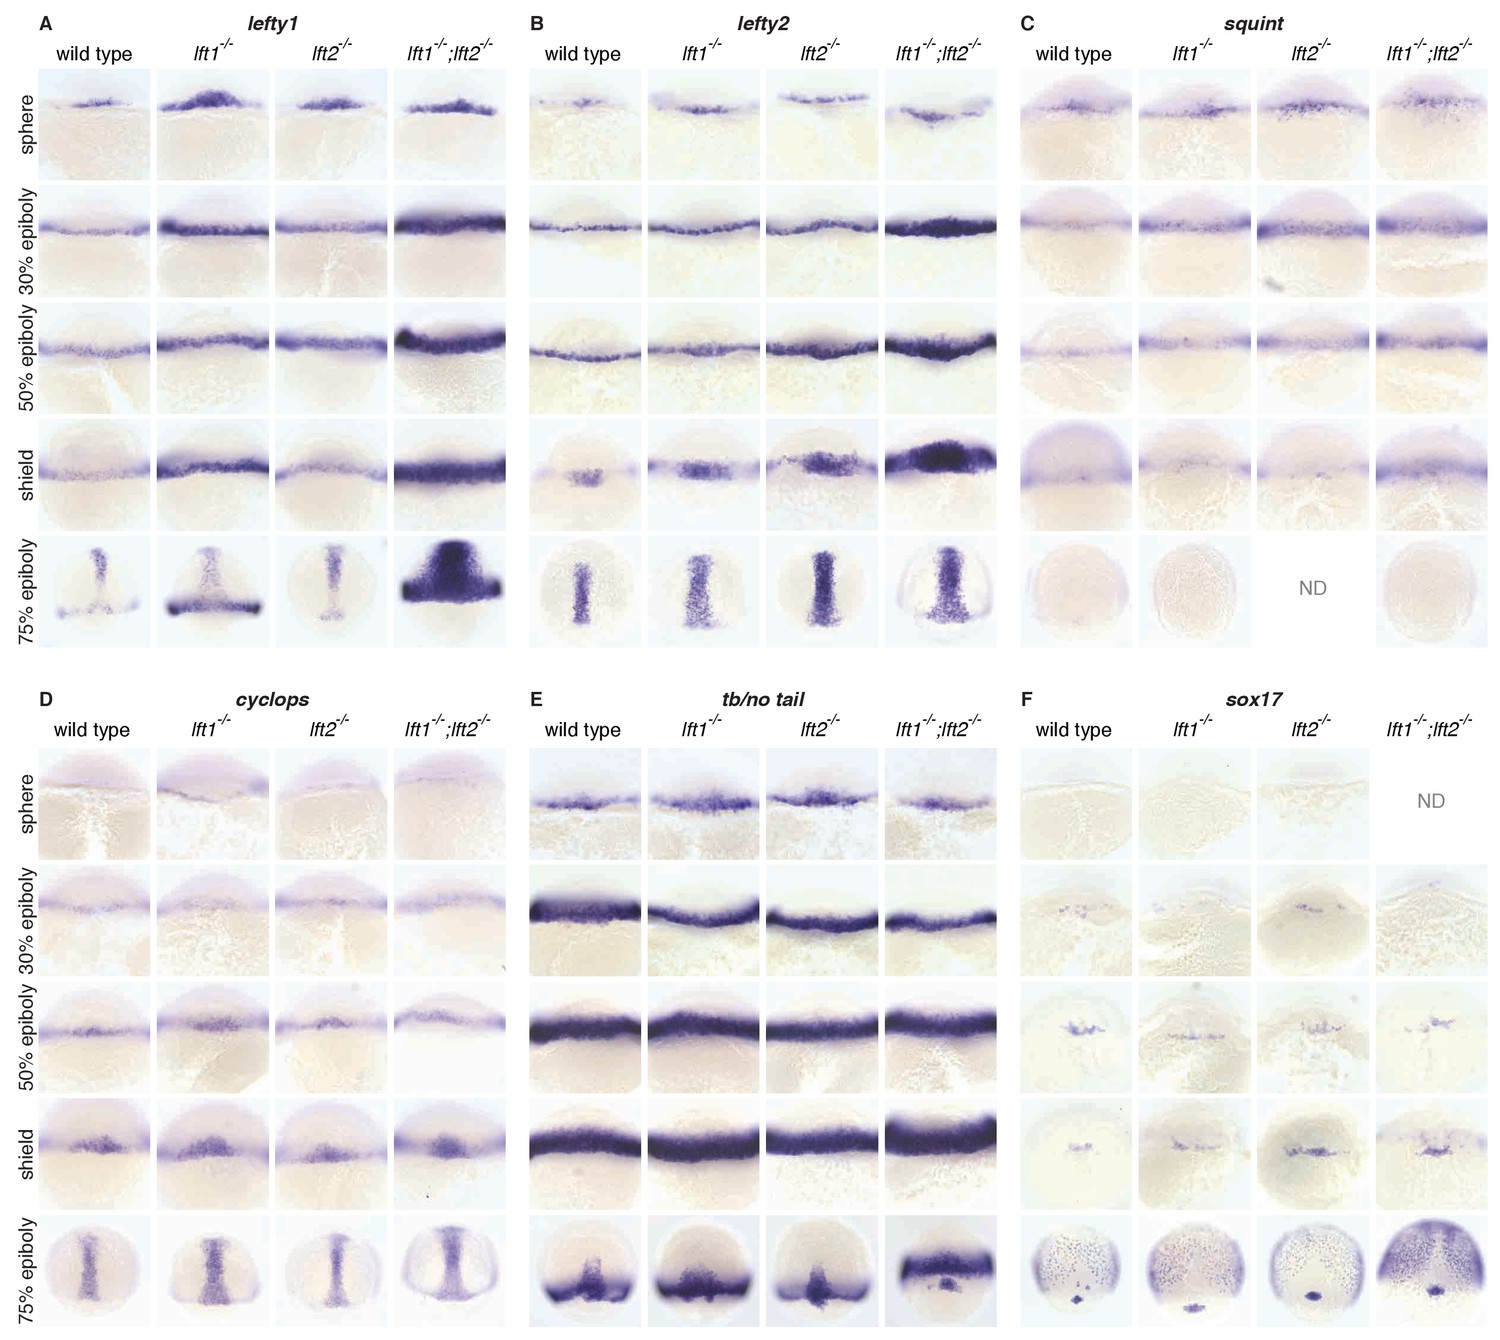
Expression of nodal, lefty, and Nodal target genes in lefty1-/-;lefty2-/- mutants during gastrulation.
Wild type embryos, lft1-/- embryos, lft2-/- embryos, and (to generate lft1-/-;lft2-/- embryos) progeny from lft1+/-;lft2-/- incrosses, lft1-/-;lft2-/- incrosses, or lft1-/-;lft2-/- X lft1+/-;lft2-/- crosses were fixed at the indicated stages. In situ hybridization was performed using probes against the following Nodal target genes: lft1 (A), lft2 (B), sqt (C), cyc (D), tb/no tail (E), and sox17 (F). Dorsal views. After imaging, embryos from lft1+/-;lft2-/- incrosses or lft1-/-;lft2-/- X lft1+/-;lft2-/- crosses were genotyped (see Materials and methods for details). Upregulation of Nodal target genes was most dramatic in lft1-/-;lft2-/- mutants, though lft1-/- mutants tended to exhibit slight upregulation as well. Note that expression of tb/no tail at 30% epiboly was normal in lft1-/-;lft2-/- mutants, in contrast to the dramatic upregulation at 30% epiboly observed in double lefty morphants (Agathon et al., 2001).
Figure 4
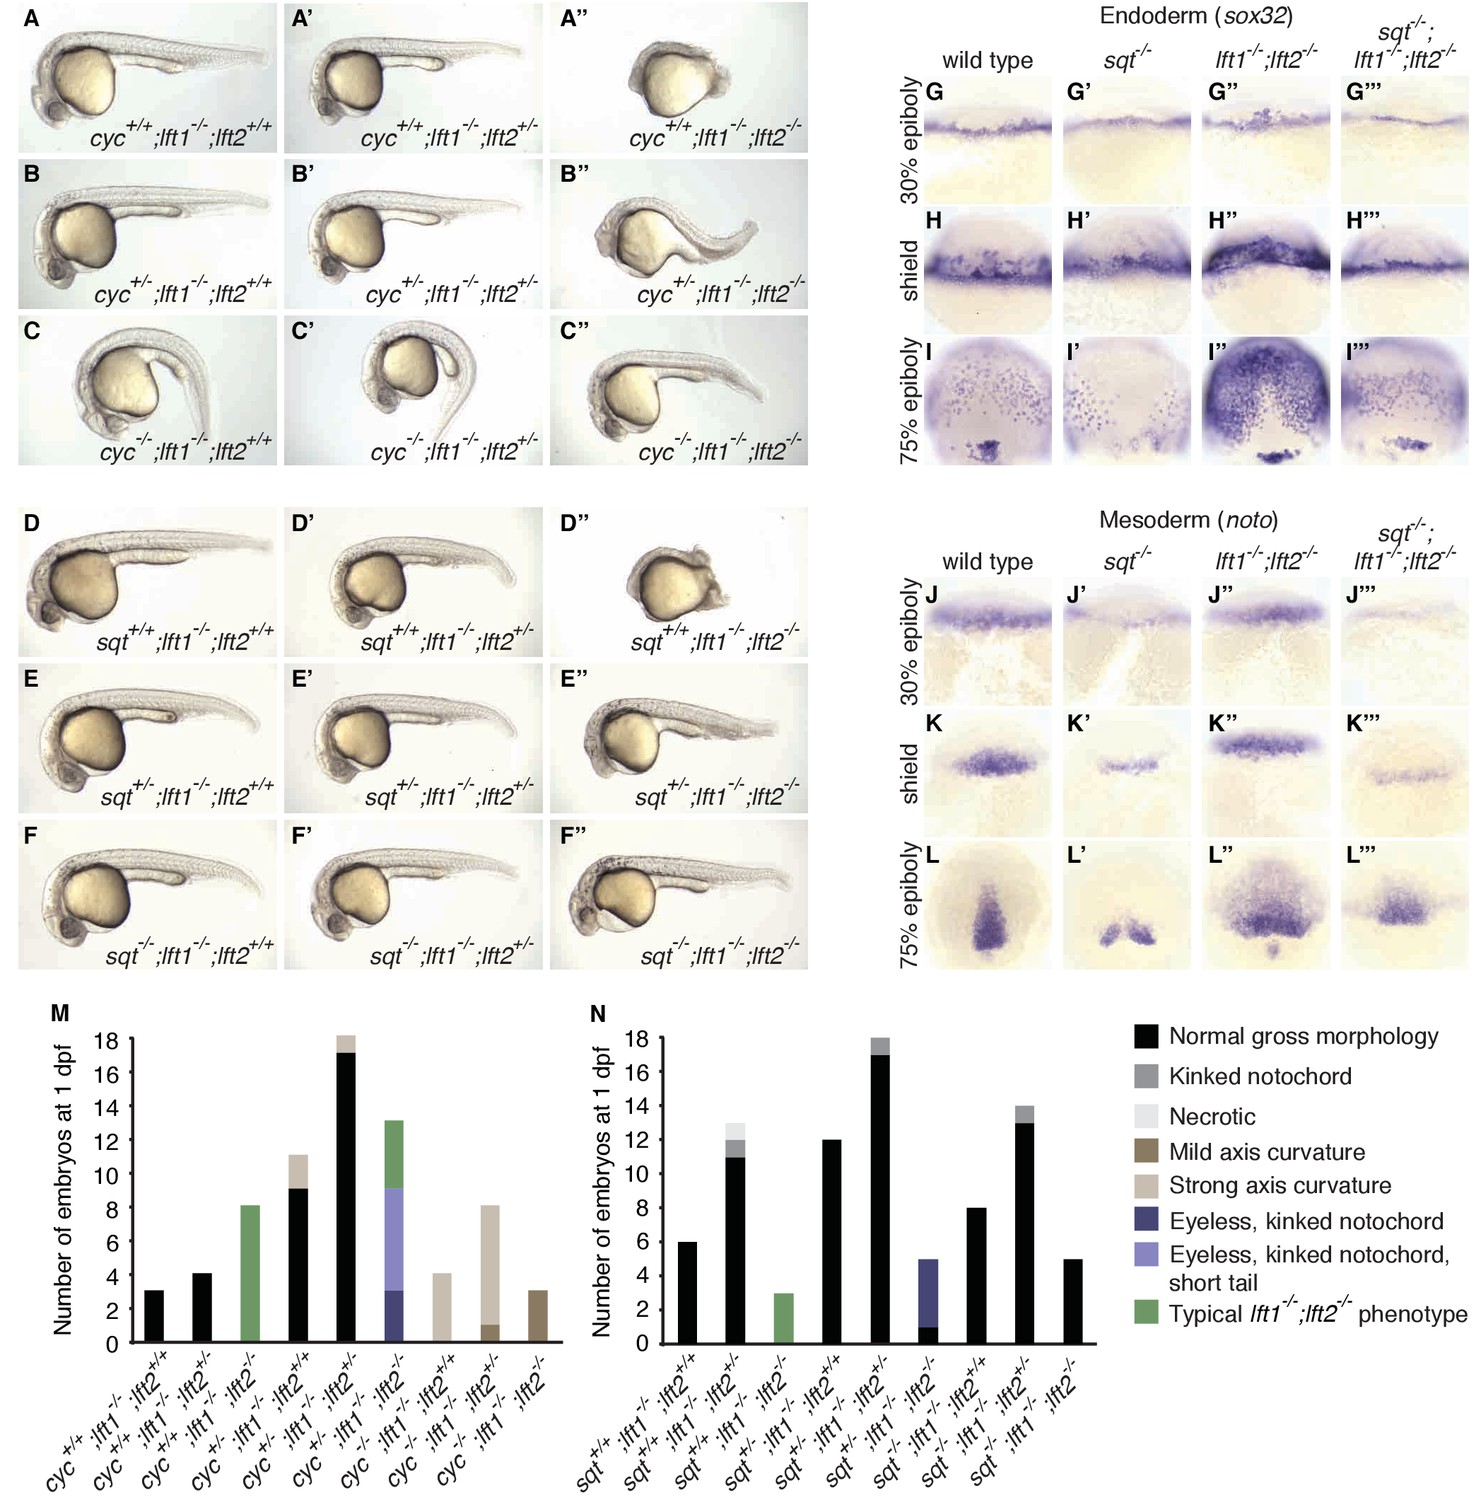
nodal mutations suppress lefty1-/-;lefty2-/- mutant defects.
(A–F’’) Lateral views of embryos with indicated genotypes at 1 day post-fertilization (dpf). Embryos are progeny from an incross of cycm294/+;lft1-/-;lft2+/- (A–C’’) or sqtcz35/+;lft1-/-;lft2+/- (D–F’’) adults, and were genotyped after imaging (see Materials and methods for details). In contrast to lft1-/-;lft2-/- mutants (A’’, D’’), nodal+/-;lft1-/-;lft2-/- mutants (B’’, E’’) have long tails and well-defined heads, and some nodal-/-;lft1-/-;lft2-/- mutants (C’’,F’’) have eyes in addition to full-length tails. nodal-/-;lft1-/-;lft2-/- and nodal+/-;lft1-/-;lft2-/- mutants are not viable. cyc homozygotes exhibit the expected curved body axis (Sampath et al., 1998) (C,C’), but curvature is reduced in cyc-/-;lft1-/-;lft2-/- embryos (C’’). (G–L’’’) In situ hybridization assessing expression of endodermal (sox32/casanova) (G–I’’’) or mesodermal (noto/floating head) (J–L’’’) genes in the indicated genotypes (dorsal views). Mesendoderm upregulation is less pronounced in sqt-/-;lft1-/-;lft2-/- compared to lft1-/-;lft2-/- mutants. (M–N) 72 embryos from a cyc+/-;lft1-/-;lft2+/- incross (M) and 84 embryos from a sqt+/-;lft1-/-;lft2+/- incross (N) were scored and imaged at 1 dpf, and subsequently genotyped. Number of embryos of each genotype with the indicated phenotype at 1 dpf is shown. Together, these results demonstrate that loss of sqt or cyc can suppress lft1-/-;lft2-/- mutant phenotypes.
Figure 5 with 3 supplements
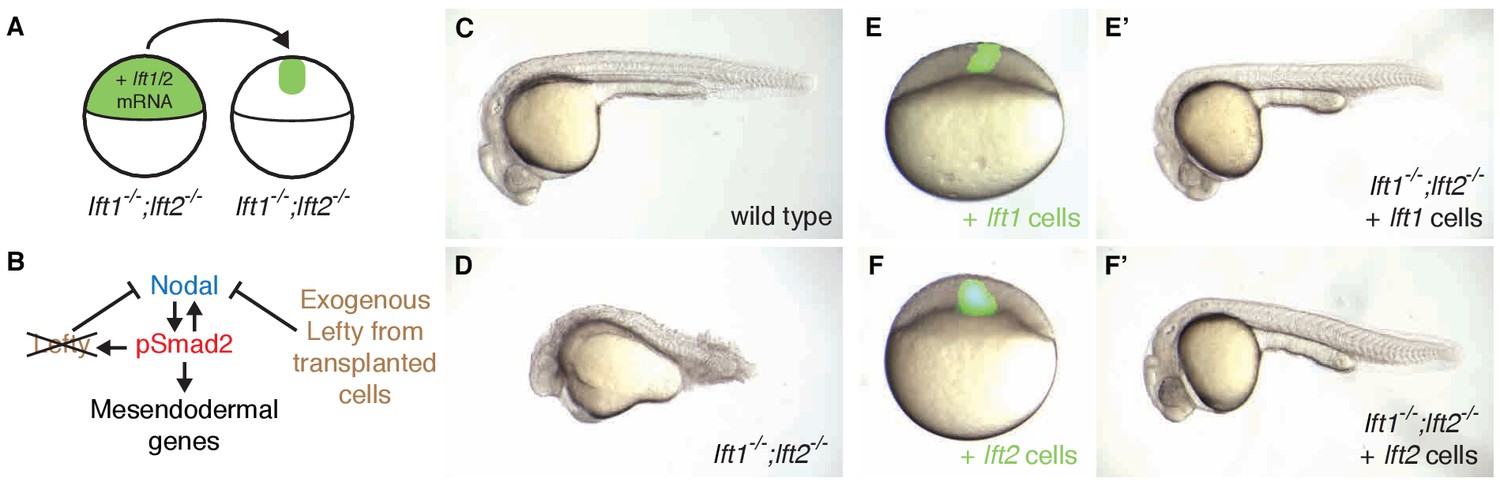
Ectopic lefty expression rescues Lefty loss.
(A) lft1-/-;lft2-/- mutant donors were injected with 0.4 pg Alexa 488-dextran (3 kD, ThermoFisher) and 10 pg lft1 or lft2 mRNA at the one-cell stage. At sphere stage, around 50 cells from donors were transplanted into the animal pole of lft1-/-;lft2-/- mutant host embryos. (B) In host embryos Nodal is inhibited by exogenous, ectopic Lefty. (C,D) Untransplanted wild type (C) and lft1-/-;lft2-/- mutant (D) embryos at 1 day post-fertilization (dpf). (E–F’) lft1-/-;lft2-/- mutant hosts 30–120 min after receiving cells from donors injected with Alexa 488-dextran + lft1 (E) or lft2 (F) mRNA and at 1 dpf (lft1 mRNA (E’), lft2 mRNA (F’)). Note relatively normal morphology compared to untransplanted lft1-/-;lft2-/- sibling (D). Similar results were obtained using donors injected with lft1-gfp (200 pg) or lft2-gfp (60 pg) mRNA (data not shown). Number of embryos with indicated phenotype at 1 dpf/total number embryos receiving lft1-expressing cells: 21/45 normal gross morphology, 11/45 partially rescued (e.g. longer tail but no eyes), 6/45 cyclopia, 2/45 necrotic, and 5/45 dead. Number of embryos with indicated phenotype at 1 dpf/total number embryos receiving lft2-expressing cells: 19/45 normal gross morphology, 16/45 partially rescued, 2/45 cyclopia, 3/45 typical lft1-/-;lft2-/- mutant phenotype, 1/45 necrotic, and 4/45 dead.
Figure 5—figure supplement 1

Transplanted cells are mostly retained in the animal pole during germ layer patterning.
lft1-/-;lft2-/- mutant donors were injected with 0.4 pg Alexa 488-dextran (3 kD, ThermoFisher), 10 pg lft1 mRNA, and 30 pg membrane RFP mRNA at the one-cell stage; lft1-/-;lft2-/- mutant hosts were injected with 30 pg membrane RFP mRNA. At sphere stage, around 50 cells from donors were transplanted into the animal pole of host embryos as in Figure 5A,E and F. Embryos were imaged using a Zeiss Lightsheet Z.1 microscope starting 60 min post-transplantation for 3.5 hr. Maximum intensity projections (~525 µm total) are shown for two embryos (A–H and I–P); time post-transplantation is indicated in the lower right corner of each image. Transplanted cells tended to stay mainly in the animal pole during the imaging session, when the majority of Nodal-mediated germ layer patterning occurs (late blastula - early gastrula stages [Hagos and Dougan, 2007]). This supports the idea that ectopic Lft expression far from its endogenous source at the margin is sufficient to generate viable embryos (see Figure 3—figure supplement 1A,B for endogenous lft expression domains). Note that due to constant production of membrane RFP, the minimum and maximum display values for the red channel were manually adjusted in each frame.
Figure 5—figure supplement 2
Transplanted cells frequently populate head structures.
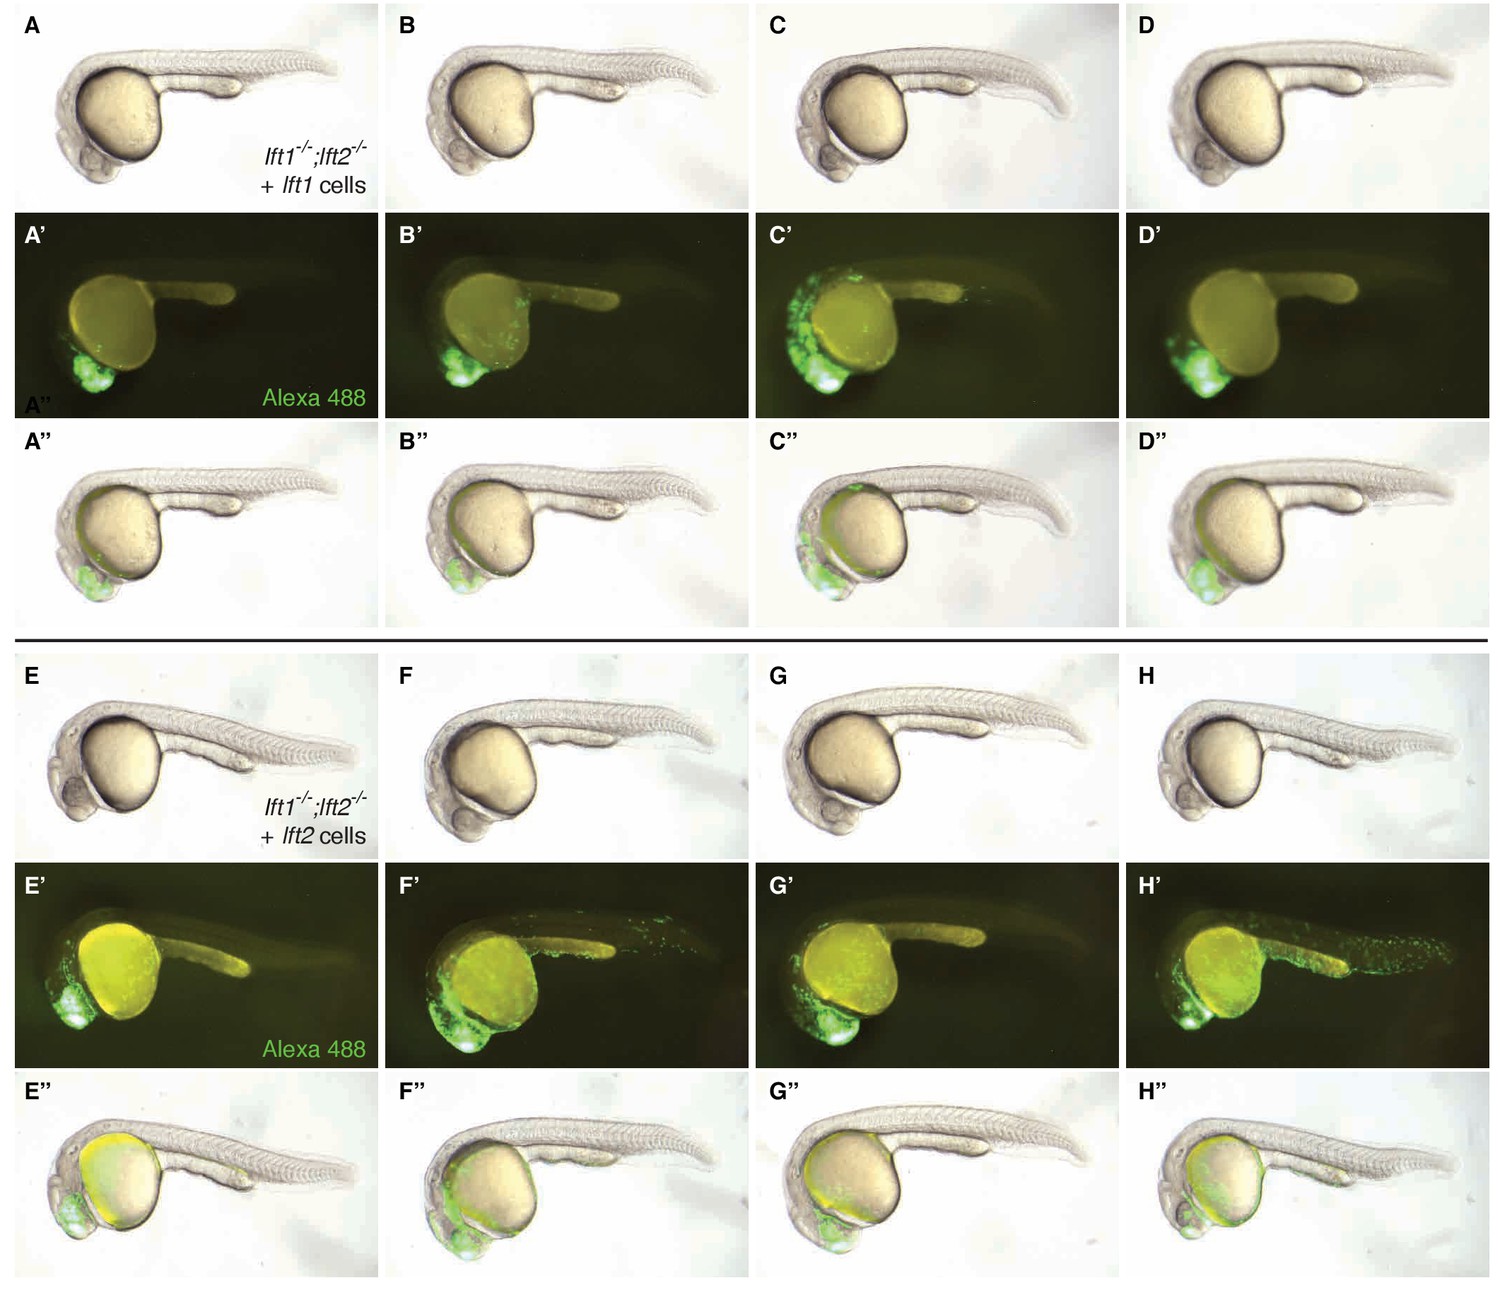
lft1-/-;lft2-/- mutant donors were injected with 0.4 pg Alexa 488-dextran (3 kD, ThermoFisher) and 10 pg lft1 or lft2 mRNA at the one-cell stage. At sphere stage, around 50 cells from donors were transplanted into the animal pole of lft1-/-;lft2-/- mutant host embryos as in Figure 5A,E and F. A representative selection of rescued lft1-/-;lft2-/- mutant hosts that received lft1- (A–D’’) or lft2- (E–H’’) expressing cells are shown at 1 day post-fertilization. Transplanted cells (marked with Alexa 488) are frequently found in head structures, consistent with an animal pole localization during germ layer specification. Embryos shown in A-A’’ and E-E’’ are the same shown in Figure 5E–E’ and F–F’, respectively.
Figure 5—figure supplement 3

Ubiquitous Activin expression can partially rescue maternal-zygotic one-eyed pinhead embryos.
Maternal-zygotic one-eyed pinhead (oep) embryos are insensitive to Nodal signaling, but receptive to the related TGFβ ligand Activin (Gritsman et al., 1999; Donovan et al., 2017). At 1 day post-fertilization (dpf), MZoep embryos (B) lack mesendoderm-derived head and trunk structures in contrast to wild type embryos (A). (D) MZoep embryos were injected with the indicated amounts of myc-tagged human activin mRNA (Donovan et al., 2017) at the one- to two-cell stage and scored at 1 dpf, similar to Gritsman et al., 1999. 0.2–0.4 pg hActivin mRNA can rescue some loss of trunk tissue and somites; amounts higher than 0.4 pg result in severe deformities and embryo rupture. One MZoep embryo injected with 0.3 pg hActivin mRNA exhibited two separated, non-cyclopic eyes and moderate rescue of head and trunk mesensoderm (C). (E–L) Representative images of 1 dpf MZoep embryos injected with hActivin mRNA at the one-cell stage. Injected amount indicated in the lower right corner, number of embryos with the displayed phenotype out of total shown in the left corner. The inability to fully rescue loss of Nodal signaling with ubiquitous Activin expression suggests an important role for the localization of Nodal expression at the margin, in contrast to Lefty (e.g. Figures 5 and 6).
Figure 6 with 4 supplements
Artificial, uniform Nodal inhibition rescues Lefty loss.
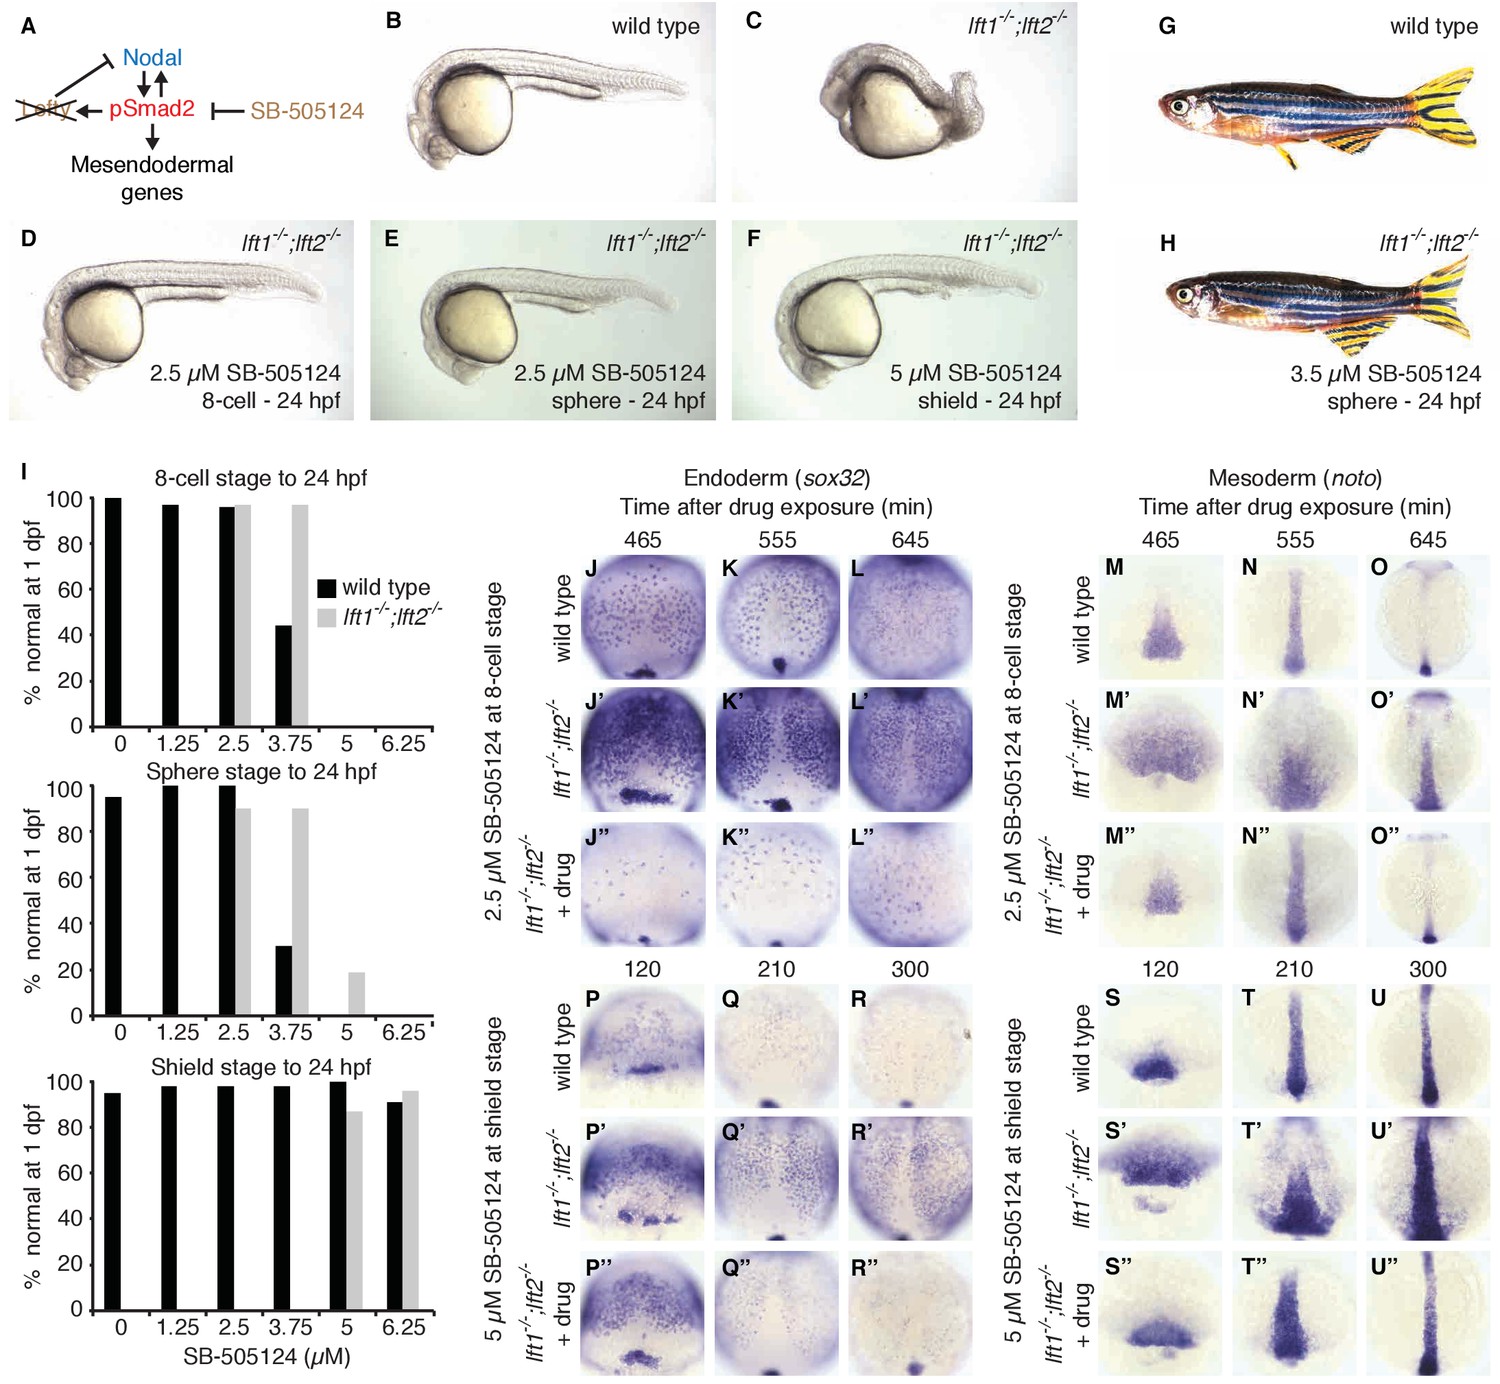
Wild type and lft1-/-;lft2-/- mutant embryos were exposed to 0, 1.25, 2.5, 3.75, 5, or 6.25 μM SB-505124 (Nodal inhibitor drug) starting at the 8 cell stage, sphere stage, or shield stage. (Exposure to 30–50 μM fully inhibits Nodal signaling (Fan et al., 2007; Hagos et al., 2007; Hagos and Dougan, 2007).) Drug was removed at 24 hr post-fertilization (hpf). (A) Inhibition is decoupled from signaling in drug-treated lft1-/-;lft2-/- mutants. (B–F) Exposure to 2.5 μM SB-505124 at the 8 cell (D) or sphere (E) stage or 5 μM at shield stage (F) rescues gross morphological defects in lft1-/-;lft2-/- mutants (C); compare to wild type embryo (B). Embryos were imaged at 1 day post-fertilization (dpf). (G,H) Drug exposure rescues lft1-/-;lft2-/- mutants to adulthood. (G) 10 month old wild type TE adult male. (H) 5 month old lft1-/-;lft2-/- mutant male treated with 3.5 μM SB-505124 from sphere stage to 24 hpf. (I) Percent of wild type (black bars) or double mutant (gray bars) embryos with normal gross morphology at 1 dpf after drug exposure is plotted. See Figure 6—figure supplements 1 and 2 for further details. (J–U’’) Endodermal (sox32/casanova) and mesodermal (noto/floating head) gene expression in embryos treated as indicated was assessed using in situ hybridization. lft1-/-;lft2-/- mutants treated starting at the 8 cell stage (2.5 μM) exhibit decreases in endoderm compared to wild type embryos (J–L’’), but have mesodermal gene expression similar to wild type embryos (M–O’’). lft1-/-;lft2-/- mutants treated at shield stage (5 μM) exhibit upregulation of mesendoderm until ~5 hr post-exposure (P–U’’). See Figure 6—figure supplement 3 for in situ hybridization of embryos treated with drug at sphere and shield stage, as well as additional time points and treatments.
Figure 6—figure supplement 1
Artificial, uniform Nodal inhibition rescues morphology at 1 dpf in lefty1-/-;lefty2-/- mutants.
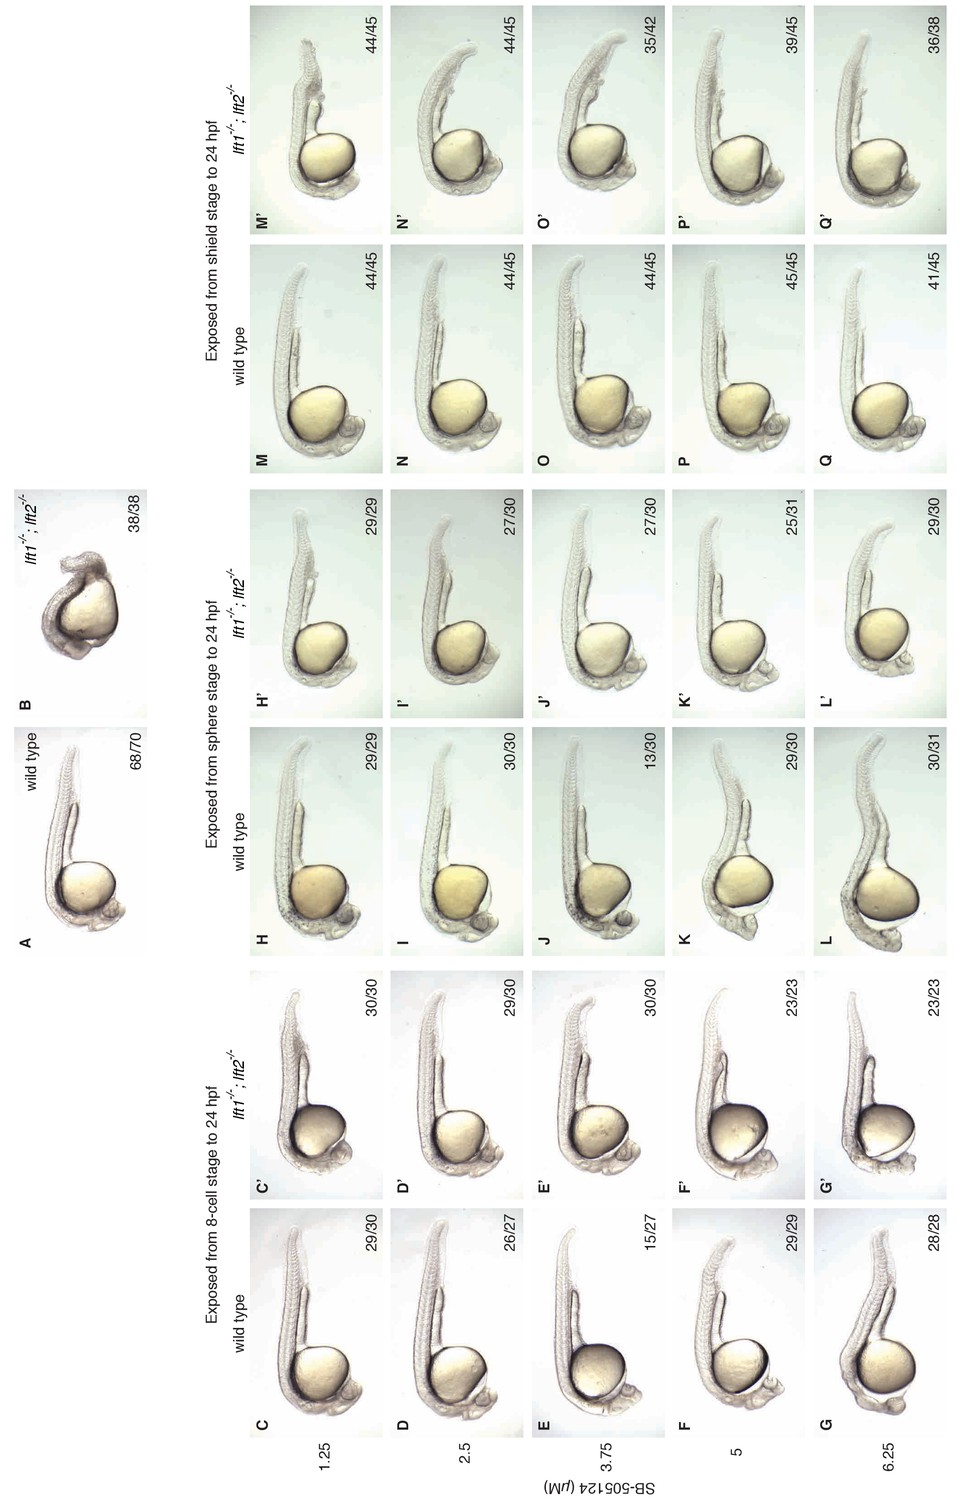
Wild type and lft1-/-;lft2-/- mutant embryos were exposed to 0, 1.25, 2.5, 3.75, 5, or 6.25 μM SB-505124 (Nodal inhibitor drug) starting at the 8 cell stage, sphere stage, or shield stage. Drug was removed at 24 hr post-fertilization. Rescue at earlier stages requires lower concentrations (2.5–3.75 μM) of SB-505124 than rescue at later stages (5–6.25 μM). (A–B) Unexposed wild type (A) and lft1-/-;lft2-/- mutant (B) embryos at 1 dpf. (C–Q’) Embryos exposed to SB-505124 from the 8 cell stage to 24 hpf (C–G’), sphere stage to 24 hpf (H–L’), and shield stage to 24 hpf (M–Q’) at 1 dpf. Number of embryos with same phenotype as image/total is indicated in bottom right of images. Cyclopia and loss of head and trunk mesendoderm are typical Nodal loss-of-function phenotypes (Gritsman et al., 1999; Hagos and Dougan, 2007), and can be observed in both wild type and mutant embryos treated with higher amounts of SB-505124 (e.g., F and F’). Wild type embryos exposed to 3.75 μM at the 8 cell stage (E) exhibited cyclopia (15/27, shown here) and normal morphology (12/27). Wild type embryos exposed to 3.75 μM at sphere stage (J) exhibited mild cyclopia (6/30), moderate cyclopia (13/30, shown here), necrosis and cyclopia (1/30), normal morphology (9/30), and 1/30 died. Some images shown here are also used in Figure 6.
Figure 6—figure supplement 2
Artificial, uniform Nodal inhibition rescues morphology at 4 dpf in lefty1-/-;lefty2-/- mutants.
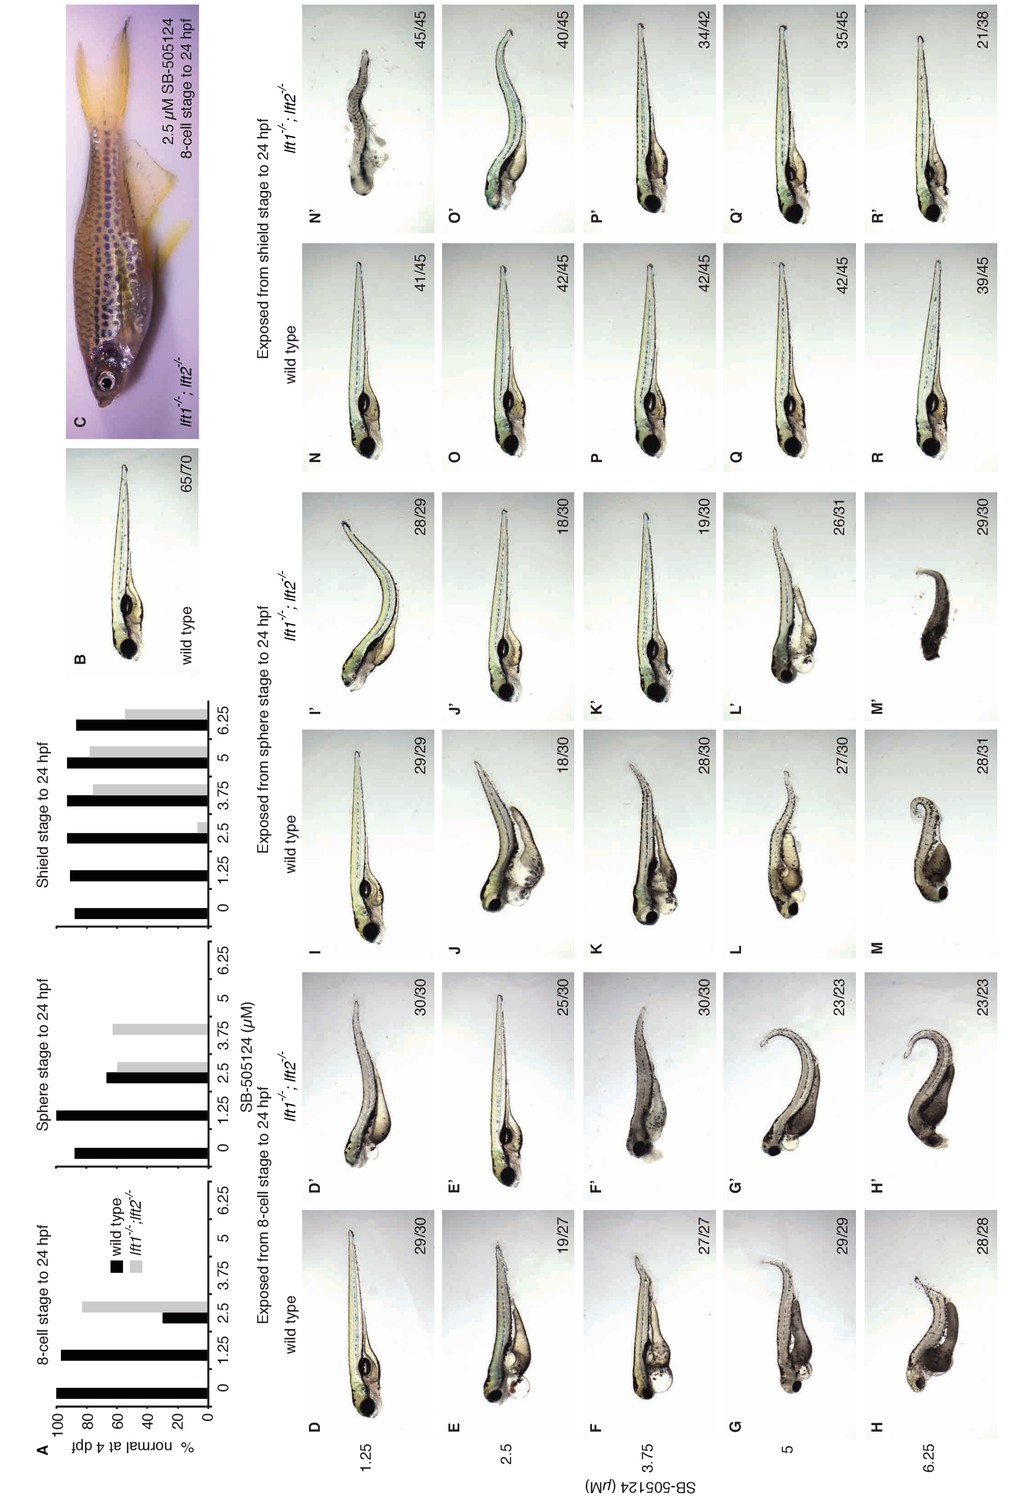
(A) Wild type and lft1-/-;lft2-/- mutant embryos were exposed to 0, 1.25, 2.5, 3.75, 5, or 6.25 μM SB-505124 (Nodal inhibitor drug) starting at the 8 cell stage, sphere stage, or shield stage. Drug was removed at 24 hr post-fertilization. Percent of embryos with normal gross morphology at 4 days post-fertilization (dpf) is plotted. (B) Unexposed wild type embryo at 4 dpf. (C) A ~ 3 month old female lft1-/-;lft2-/- mutant exposed to 2.5 μM SB-505124 from the 8 cell stage to 24 hpf. Drug-rescued mutants are fertile. Spotted pigmentation is common in incrossed TLAB strains. (D–R’) Embryos exposed to SB-505124 from the 8 cell stage to 24 hpf (D–H’), sphere stage to 24 hpf (I–M’), and shield stage to 24 hpf (N–R’) at 4 dpf. Number of embryos with same phenotype as image out of total is indicated in bottom right of images. Occasionally, embryos that appeared normal at 1 dpf had evident defects at 4 dpf, and embryos that appeared abnormal at 1 dpf recovered by 4 dpf.
Figure 6—figure supplement 3
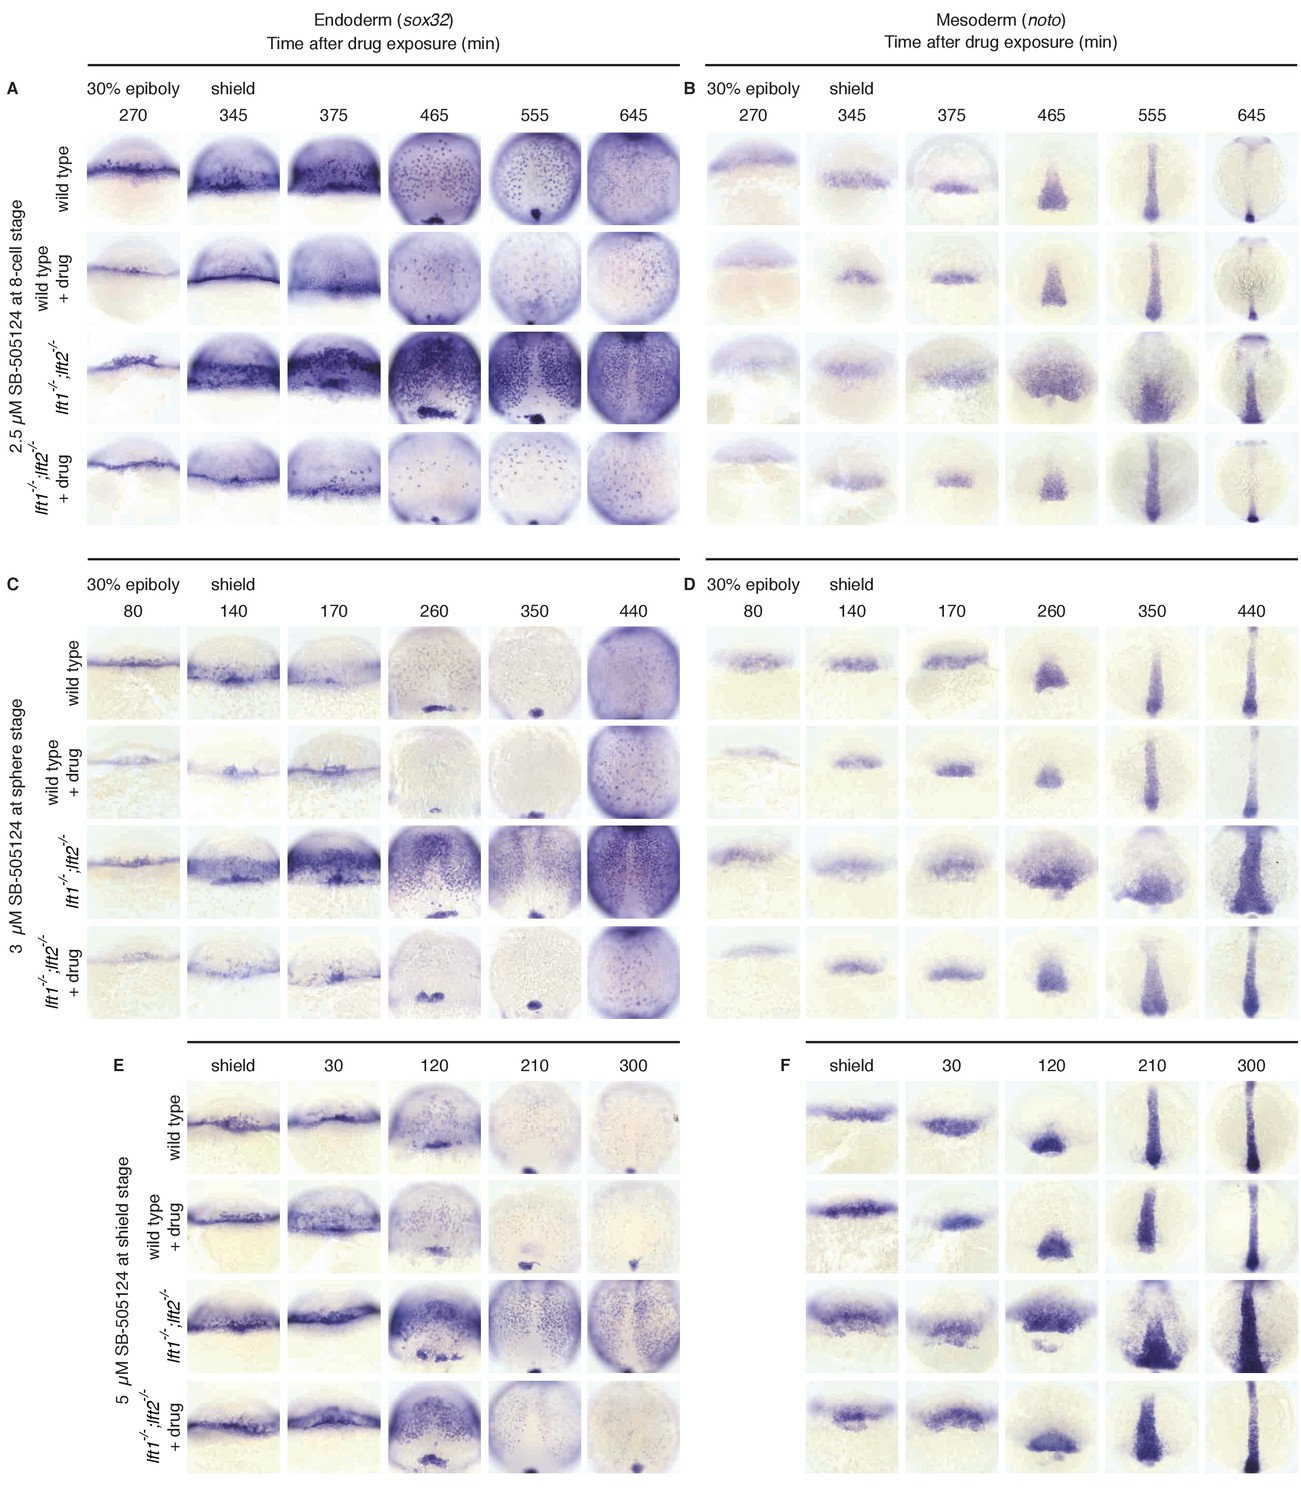
Artificial, uniform Nodal inhibition rescues mesendodermal gene expression in lefty1-/-;lefty2-/- mutants.
Wild type and lft1-/-;lft2-/- mutant embryos were exposed to 2.5 μM SB-505124 (Nodal inhibitor drug) starting at the 8 cell stage (A,B), 3 μM starting at sphere stage (C,D), or 5 μM starting at shield stage (E,F), slightly after gastrulation commences. Endodermal (sox32/casanova) (A,C,E) and mesodermal (noto/floating head) (B,D,F) gene expression was assessed using in situ hybridization. Embryos were fixed at the indicated times post drug-exposure. Mesodermal gene expression in lft1-/-;lft2-/- mutants exposed at the 8 cell stage or sphere (B,D) appears normal, while endodermal gene expression in drug-exposed embryos is reduced (A,C). In contrast, mesendodermal gene expression is upregulated in embryos exposed at shield stage until ~5 hr post-exposure (E,F). Some images from A, B, E, and F are also used in Figure 6.
Figure 6—figure supplement 4
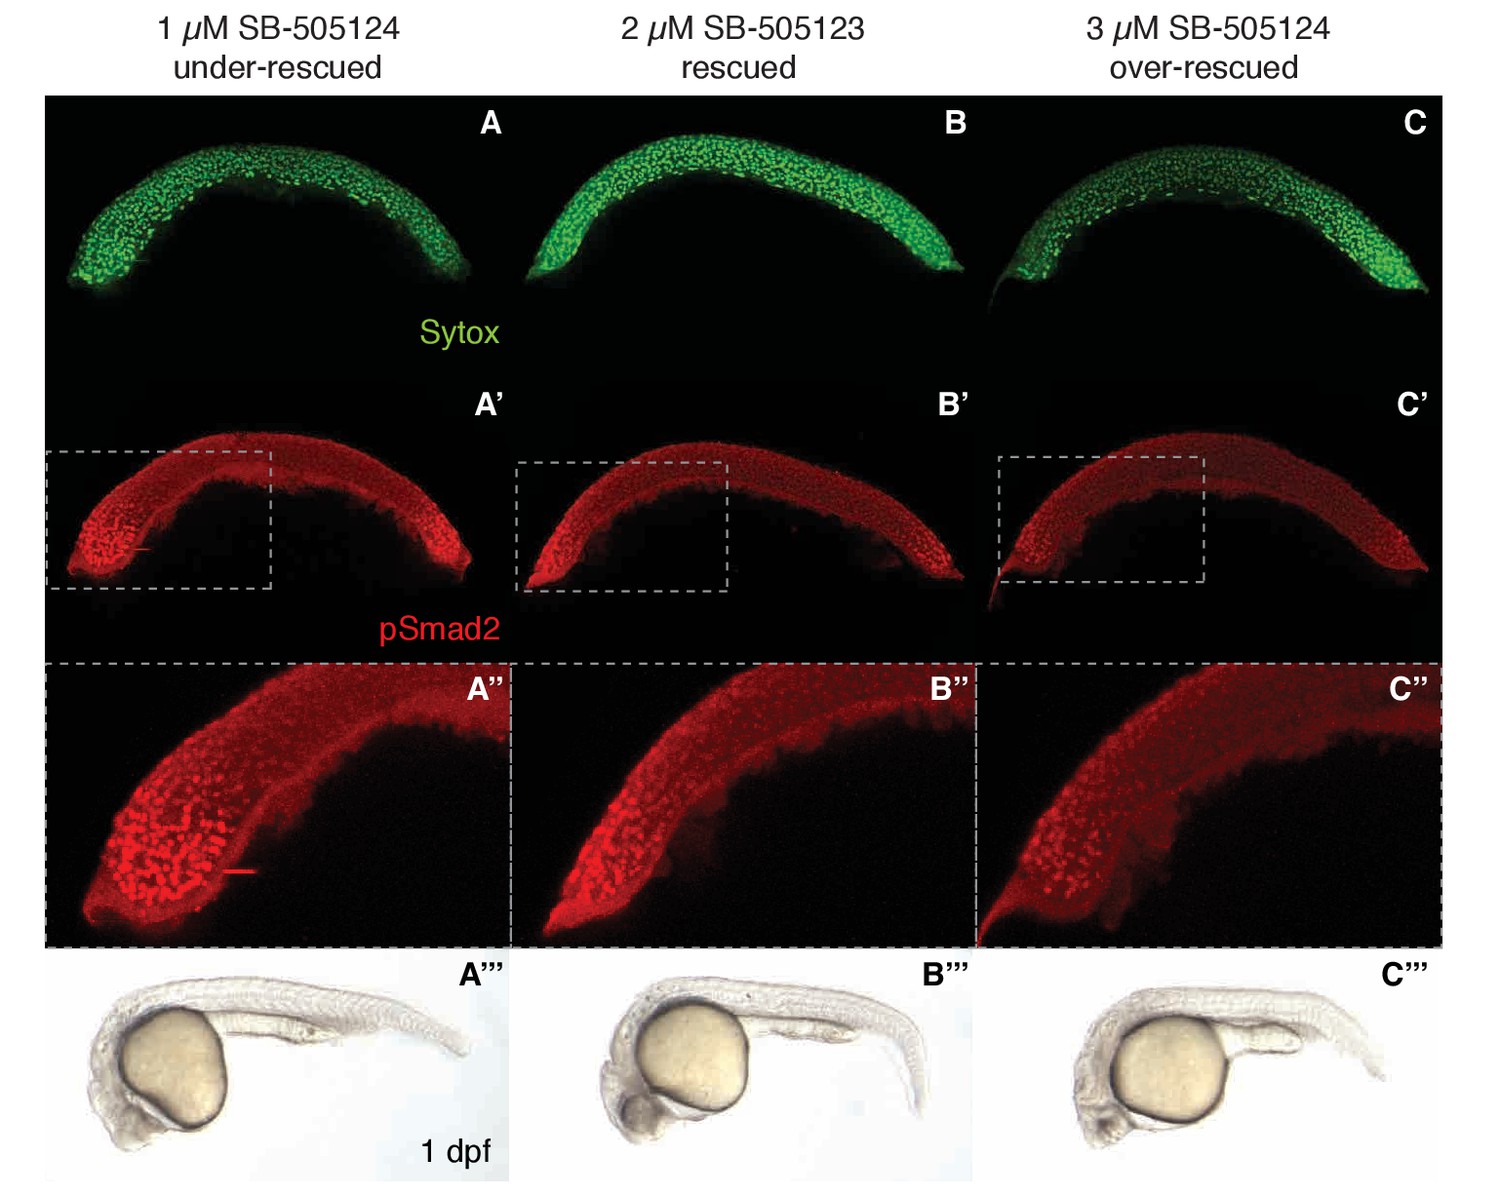
Nodal activity gradients in under- and over-rescued lefty double mutants.
To examine the tolerance to variation in Nodal signaling gradients, lft1-/-;lft2-/- embryos were exposed to 1 µM (‘under-rescued’, (A–A’’’)), 2 µM (‘rescued’, (B–B’’’)), or 3 µM (‘over-rescued’, (C–C’’’)) of the Nodal inhibitor drug SB-505124 beginning at the 8 cell stage. Embryos were fixed at 50% epiboly and stained for pSmad2 as described in the Materials and methods section. The under-rescue treatment leads to marked expansion of the Nodal signaling gradient (A’, A’’) and phenotypes at 1 day post-fertilization (dpf) consistent with hyperactive Nodal signaling (A’’’). The over-rescue treatment leads to a Nodal gradient with reduced amplitude (C’, C’’) and phenotypes consistent with mild Nodal loss of function (e.g. cyclopia) (C’’’). Images in A’’, B’’, and C’’ are cropped as indicated from A’, B’, and C’, respectively. Note that rescuing concentrations of SB-505124 vary from batch to batch, but are internally consistent within each experiment.
Figure 7
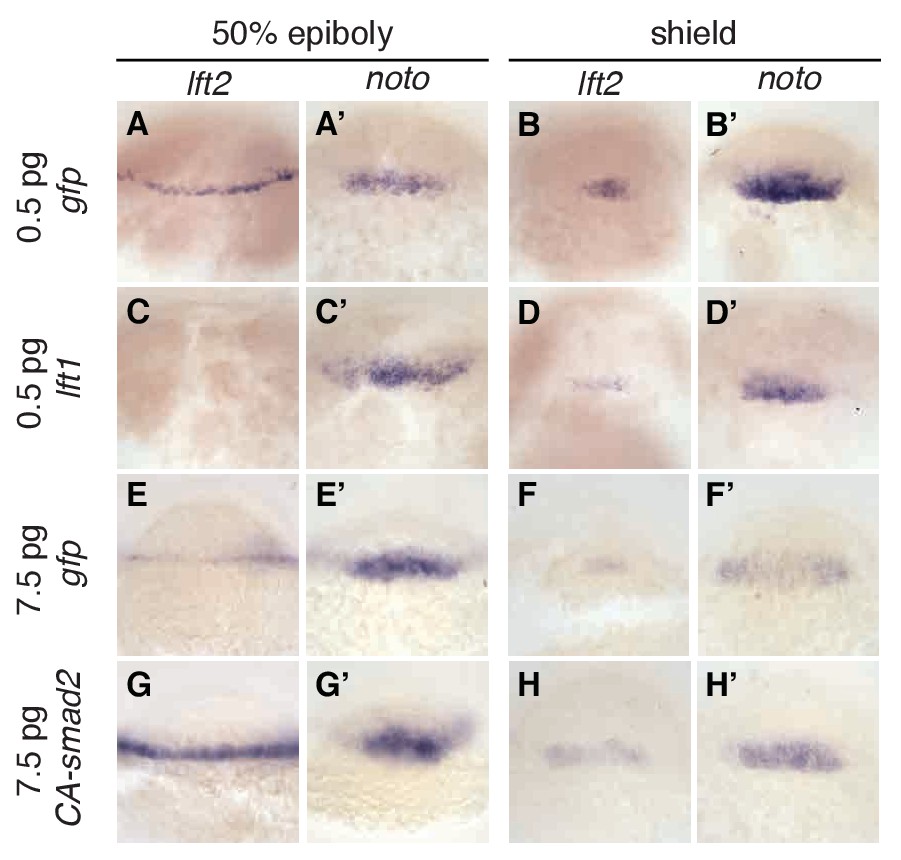
Expression of lefty2 responds sensitively to Nodal signaling perturbations.
Wild type embryos at the one-cell stage were injected with 0.5 pg gfp mRNA (first row, (A–B’)), 0.5 pg lft1 mRNA (second row, (C–D’)), 7.5 pg gfp mRNA (third row, (E–F’)), or 7.5 pg CA-smad2 mRNA (fourth row, (G–H’)). Embryos were fixed at 50% epiboly and shield stages and expression of endogenous lft2 (A,B,C,D,E,F,G,H) and the mesoderm marker noto (A’,B’C’,D’,E’,F’,G’H’) were assessed using in situ hybridization. Note the dramatic decrease and increase in lft2 expression after lft1 (A,B,C,D) and CA-smad2 injection (E,G,F,H), respectively. Expression of noto was relatively unchanged in all treatments.
Figure 8 with 1 supplement
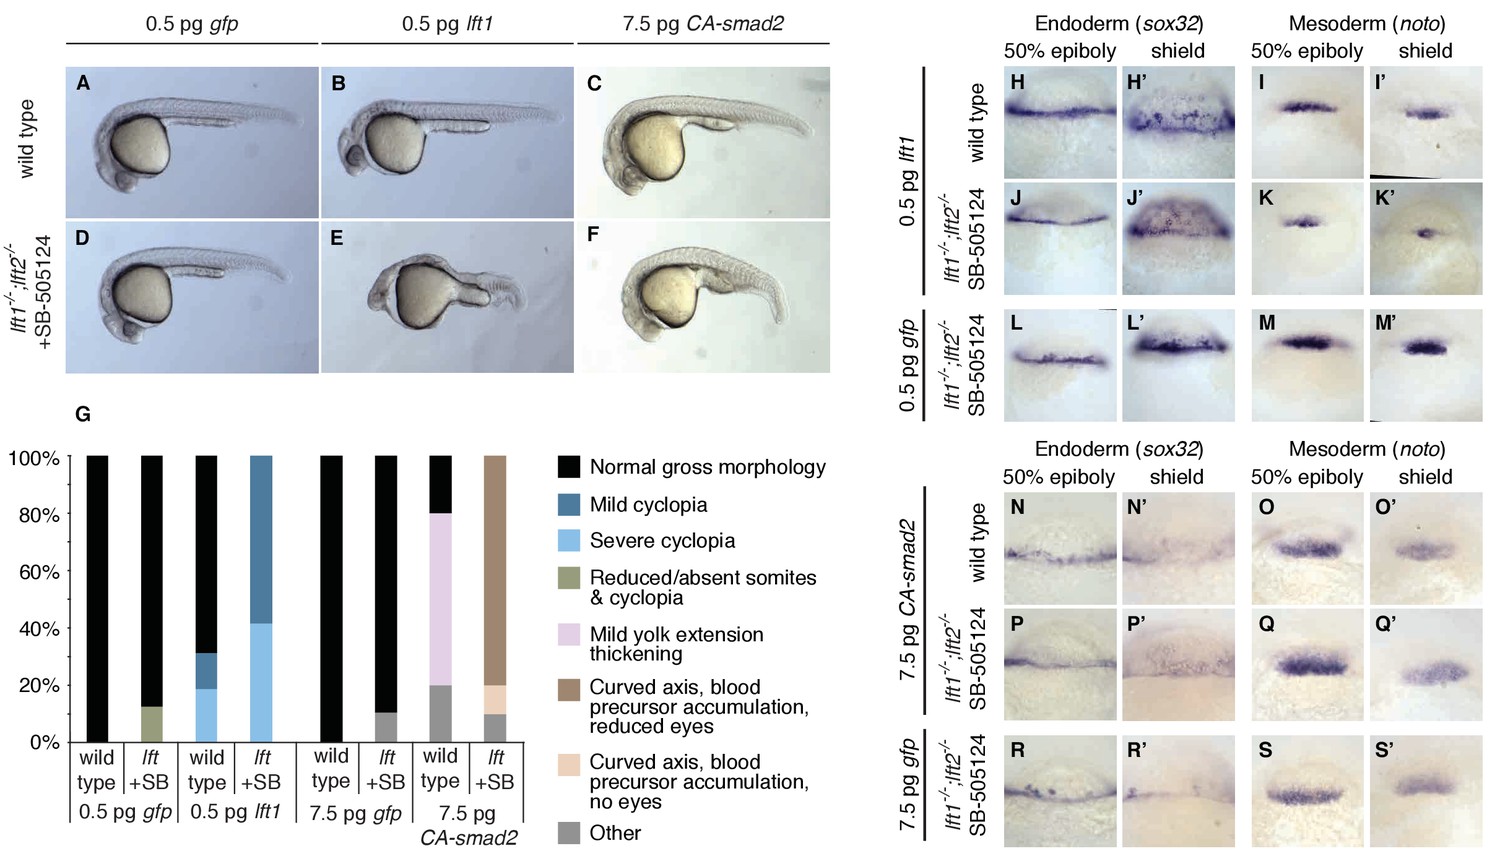
Correction of Nodal signaling challenges requires Lefty feedback.
(A–F) Wild type embryos with intact feedback circuits (A–C) and feedback-decoupled drug-treated lft1-/-;lft2-/- mutants (D–F) were challenged by decreasing Nodal signaling with injection of 0.5 pg lft1 mRNA (B,E) or by increasing Nodal signaling with injection of 7.5 pg CA-smad2 (C,F). lft1-/-;lft2-/- mutant embryos were exposed to 2 µM SB-505124 (Nodal inhibitor drug) at the 8 cell stage and phenotypes were assessed at 1 dpf. 0.5 pg lft1 causes mild Nodal loss-of-function phenotypes in wild type embryos (B), but strong Nodal loss-of-function phenotypes such as cyclopia and loss of head and trunk mesendoderm in feedback-decoupled embryos (E). CA-smad2 is well-tolerated in wild type embryos (C), but causes reduction of eyes, axis curvature, and accumulation of blood precursors in feedback-decoupled embryos (F). (G) Percentages of embryos with indicated phenotypes. Total embryos analyzed, lft challenge experiment: wild type + 0.5 pg gfp mRNA = 10, wild type +0.5 pg lft1 mRNA = 16, drug-treated lft1-/-;lft2-/- mutants + 0.5 pg gfp mRNA = 16, drug-treated lft1-/-;lft2-/- mutants + 0.5 pg lft1 mRNA = 12. Total embryos analyzed, CA-smad2 challenge experiment: wild type +7.5 pg gfp mRNA = 18, wild type +7.5 pg CA-smad2 mRNA = 20, drug-treated lft1-/-;lft2-/- mutants + 7.5 pg gfp mRNA = 19, drug-treated lft1-/-;lft2-/- mutants + 7.5 pg CA-smad2 mRNA = 20. (H–M’) Wild type (H–I’) and lft1-/-;lft2-/- mutant embryos (J–M’) were injected with 0.5 pg gfp or lft1 mRNA at the one-cell stage. Mutants were exposed to 2 µM Nodal inhibitor drug SB-505124 starting at the 8 cell stage, and expression of the endoderm marker sox32 (H, H’, J, J’, L, L’) and the mesoderm marker noto (I, I’, K, K’, M, M’) were assessed at 50% epiboly and shield stage as indicated via in situ hybridization. Note the decreased expression of noto in drug-treated double mutants injected with lft1 mRNA (K, K’) compared to wild type embryos injected with lft1 mRNA (I,I’). (N–S’) Wild type (N–O’) and lft1-/-;lft2-/- mutant embryos (P–S’) were injected with 7.5 pg gfp or CA-smad2 mRNA at the one-cell stage. Mutants were exposed to 2 µM Nodal inhibitor drug SB-505124 starting at the 8 cell stage, and expression of sox32 (N,N’, P, P’, R, R’) and noto (O, O’, Q, Q’,S, S’) were assessed at 50% epiboly and shield stage as indicated via in situ hybridization.
Figure 8—figure supplement 1
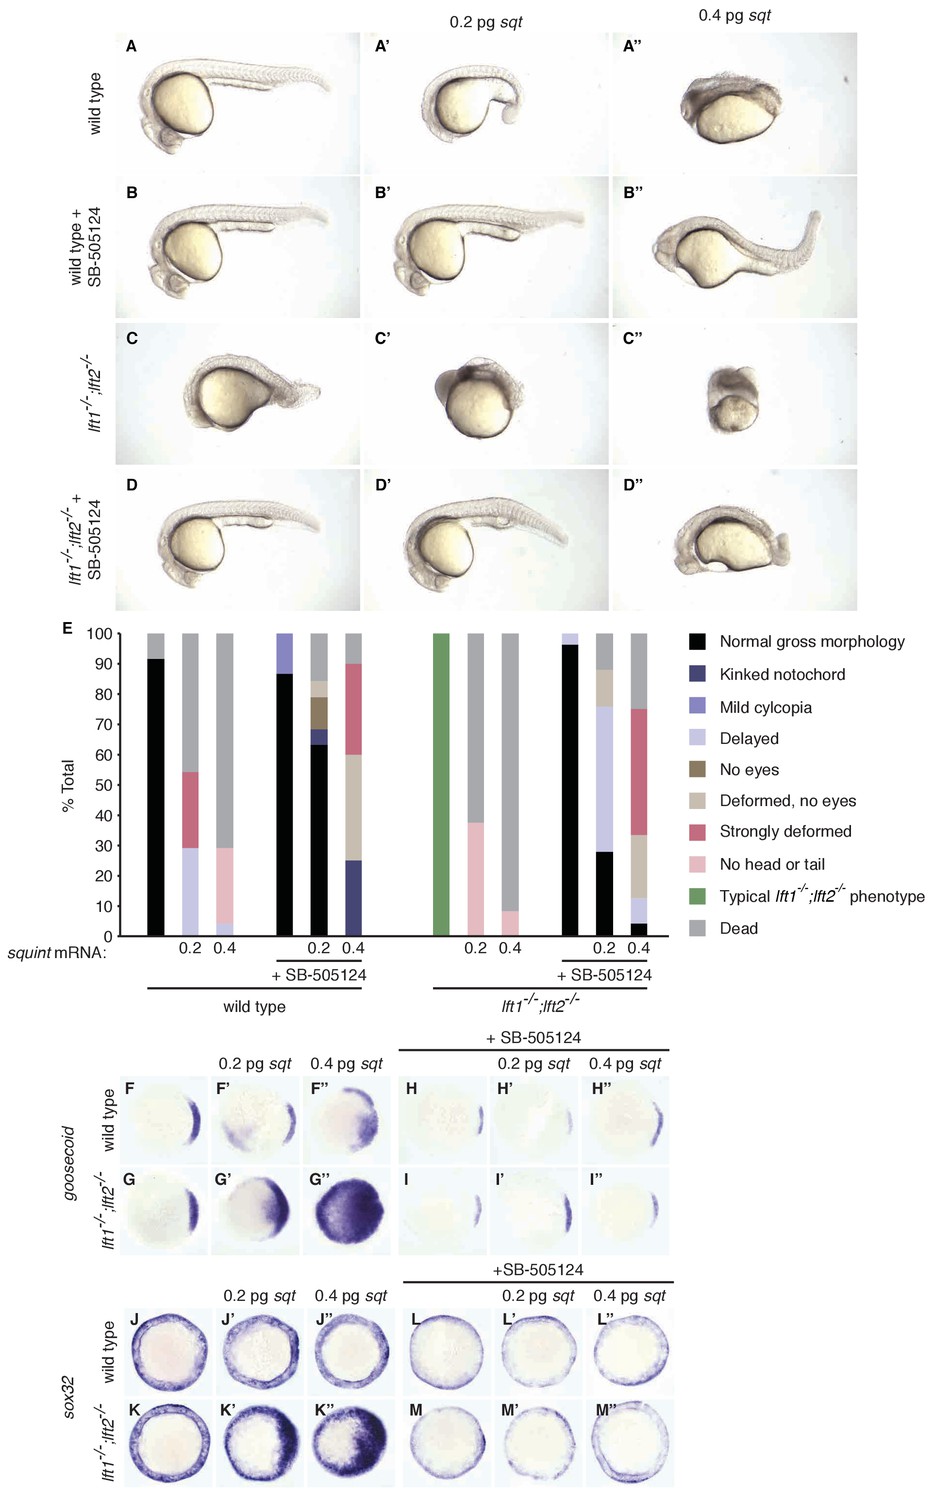
Response of wild type and lefty1-/-;lefty2-/- mutant embryos to squint injection.
Wild type and lft1-/-;lft2-/- mutant embryos were injected with 0.2 or 0.4 pg sqt mRNA at the one-cell stage. Embryos were then exposed to 2.5 μM SB-505124 (Nodal inhibitor drug) starting at the 8 cell stage (see Figure 6, Figure 6—figure supplements 1, 2 and 3, and Figure 2—figure supplement 1). (A–D’’) Phenotypes at 1 day post-fertilization (dpf). Embryos injected with sqt mRNA exhibit dramatic morphological defects and frequently die by 1 dpf, whereas embryos injected with sqt mRNA and treated with Nodal inhibitor drug have more normal morphology and higher survival rates. (E) Percentages of embryos with the indicated phenotypes. Injected, drug-treated embryos have higher survival rates and more normal morphology than injected embryos that were not treated with drug. Total embryos analyzed: wild type = 24, wild type + 0.2 pg sqt = 24, wild type + 0.4 pg sqt = 24, wild type + drug = 15, wild type + 0.2 pg sqt + drug = 19, wild type + 0.4 pg sqt +drug = 20, lft1-/-;lft2-/- mutants = 24, lft1-/-;lft2-/- mutants + 0.2 pg sqt = 24, lft1-/-;lft2-/- mutants + 0.4 pg sqt = 24, lft1-/-;lft2-/- mutants + drug = 27, lft1-/-;lft2-/- mutants + 0.2 pg sqt + drug = 25, lft1-/-;lft2-/- mutants + 0.4 pg sqt + drug = 24. (F–M’’) Embryos were treated as described above, and fixed when uninjected wild type embryos reached 50% epiboly. Injection of 0.2 pg (F’) or 0.4 pg (F’’) sqt mRNA caused upregulation of the mesoderm marker goosecoid in wild type embryos. (G–G’’) Compared to wild type embryos, lft1-/-;lft2-/- mutants exhibited stronger upregulation of goosecoid upon injection of 0.2 pg (G’) or 0.4 pg (G’’) sqt mRNA. (H–I’’) Exposure to Nodal inhibitor drug decreased the size of the goosecoid expression domain (H,I). Injection of 0.2 pg (H’,I’) or 0.4 pg (H’’, I’’) sqt mRNA did not affect goosecoid expression in drug-treated wild type or mutant embryos. (J–K’’) The endoderm marker sox32/casanova was not upregulated in wild type embryos injected with 0.2 pg (J’) or 0.4 pg (J’’) sqt mRNA, but was upregulated in injected lft1-/-;lft2-/- mutant embryos (K’,K’’). (L–M’’) Exposure to Nodal inhibitor drug dampened sox32 expression in both wild type and mutant embryos (L,M). Injection of 0.2 pg (L’,M’) or 0.4 pg (L’’,M’’) sqt mRNA did not affect sox32 expression in drug-treated wild type or mutant embryos. Wild type embryos did not have a clear advantage over drug-treated lft1-/-;lft2-/- mutants in this assay.
Author response image 1
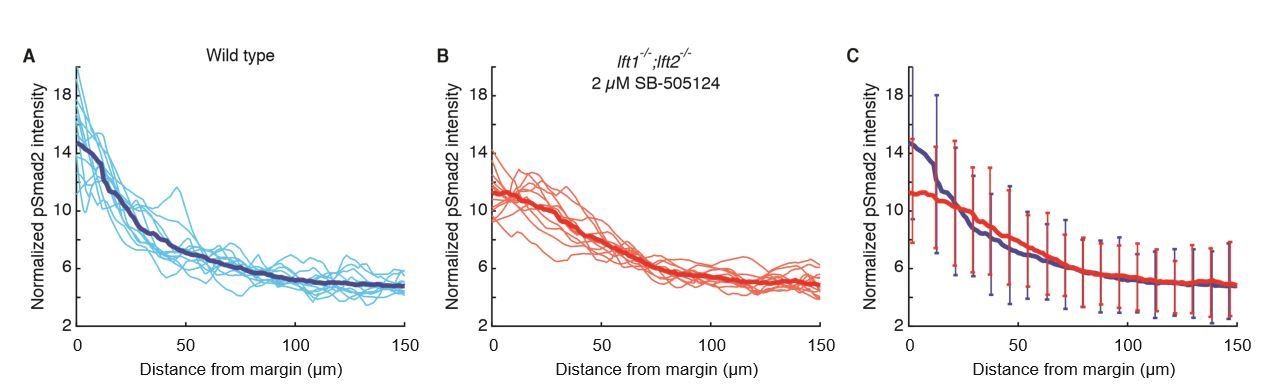
Nodal signaling gradients in wild type and rescued lefty double mutants have comparable variability.
All data were derived from quantitative analysis of 50% epiboly embryos stained for pSmad2 as described in the Materials and methods section. Nuclear intensities from each embryo were normalized to the total gradient intensity (i.e., the integral of the activity gradient) to control for technical variability in antibody staining. A) Normalized Nodal activity gradients in wild type embryos. Twelve gradients derived from six embryos (i.e., gradients from the left and right sides of embryo cross-sections) are plotted in light blue. Each gradient is estimated with a sliding window average of average nuclear pSmad2 staining intensity. The mean gradient shape was calculated by taking a sliding window average of pooled data (dark blue). B) Normalized Nodal activity gradients in lft double mutants rescued by exposure to 2 µM SB-505124 starting at the 8-cell stage. Twelve gradients were derived from six embryos (light red), and the mean gradient was estimated with a sliding window average of pooled data (dark red). C) Mean wild type (blue) and rescued lefty double mutant (red) gradients are plotted for comparison. Error bars denote 1 standard deviation of data within 8 µm bins. Although the signaling gradient shapes differ between wild type and drug-rescued lft double mutant embryos, they appear to have similar variability. Note, however, that the accepted practice of normalizing by total intensity may diminish true biological variability in gradient amplitude.
Additional files
-
Source code 1
MATLAB image processing scripts.
- https://doi.org/10.7554/eLife.28785.023
-
Transparent reporting form
- https://doi.org/10.7554/eLife.28785.024
Download links
A two-part list of links to download the article, or parts of the article, in various formats.
Downloads (link to download the article as PDF)
Open citations (links to open the citations from this article in various online reference manager services)
Cite this article (links to download the citations from this article in formats compatible with various reference manager tools)
Nodal patterning without Lefty inhibitory feedback is functional but fragile
eLife 6:e28785.
https://doi.org/10.7554/eLife.28785


