Sperm competition risk drives rapid ejaculate adjustments mediated by seminal fluid
- University of Canterbury, New Zealand
- University of Otago, New Zealand
Figures
Figure 1
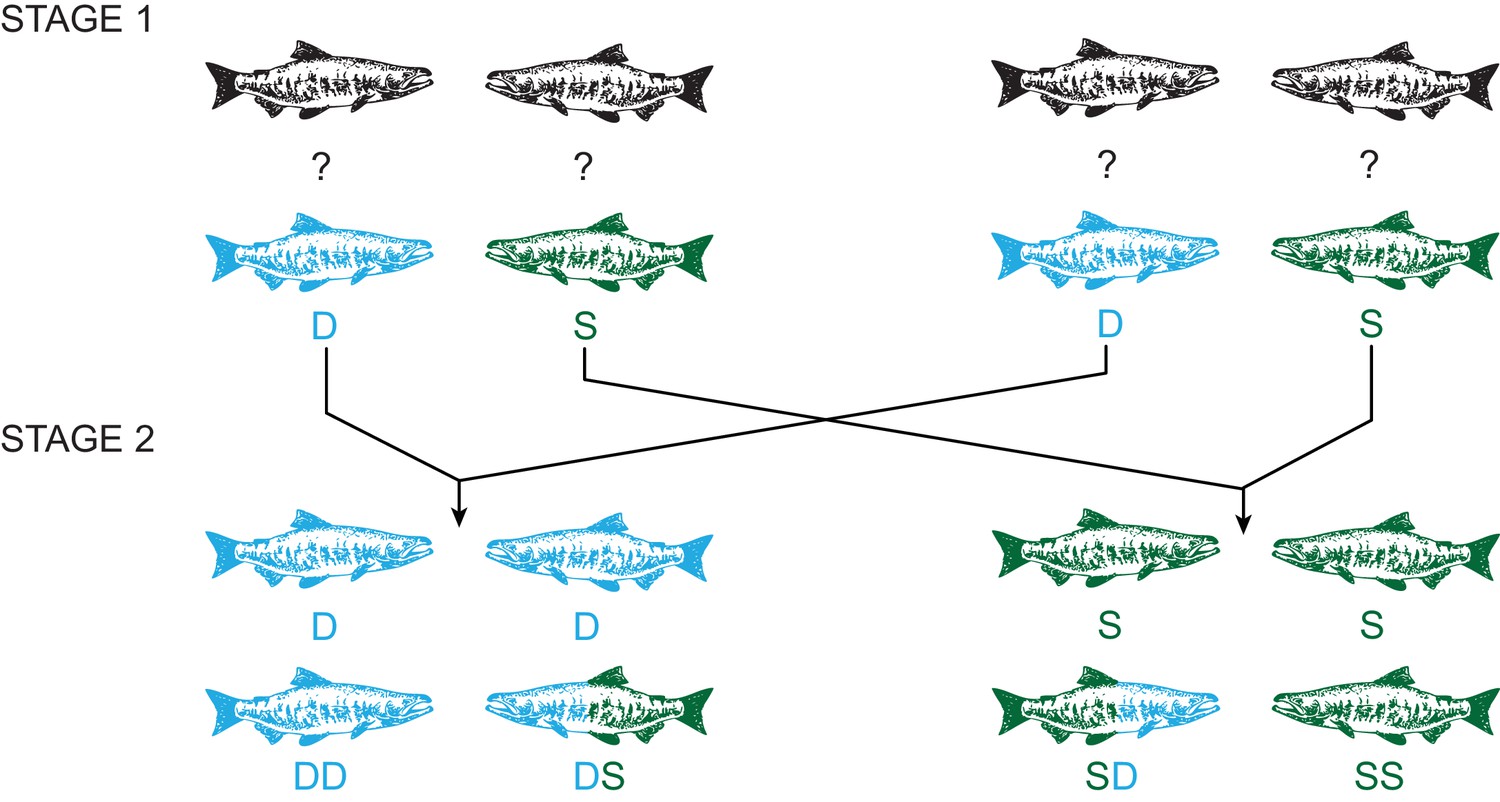
Experimental design using a two-stage social status manipulation in chinook salmon.
For each trial, in stage 1, four males of unknown social status were used to form two pairs and the social hierarchy within each pairing was then determined, assigning one male as dominant (D) and the other subdominant (S). After 48 hr, ejaculates were collected from each male (D, S, D, S). In stage 2, we reformed pairs, putting males with the same social status together, and re-determined the social hierarchy within each pairing. Males either retained the same status, dominant (DD) or subdominant (SS) in both stages, or changed status in either direction, dominant to subdominant (DS) or subdominant to dominant (SD). After 48 hr, ejaculates were recollected from each male (DD, DS, SD, SS).
Figure 2 with 1 supplement
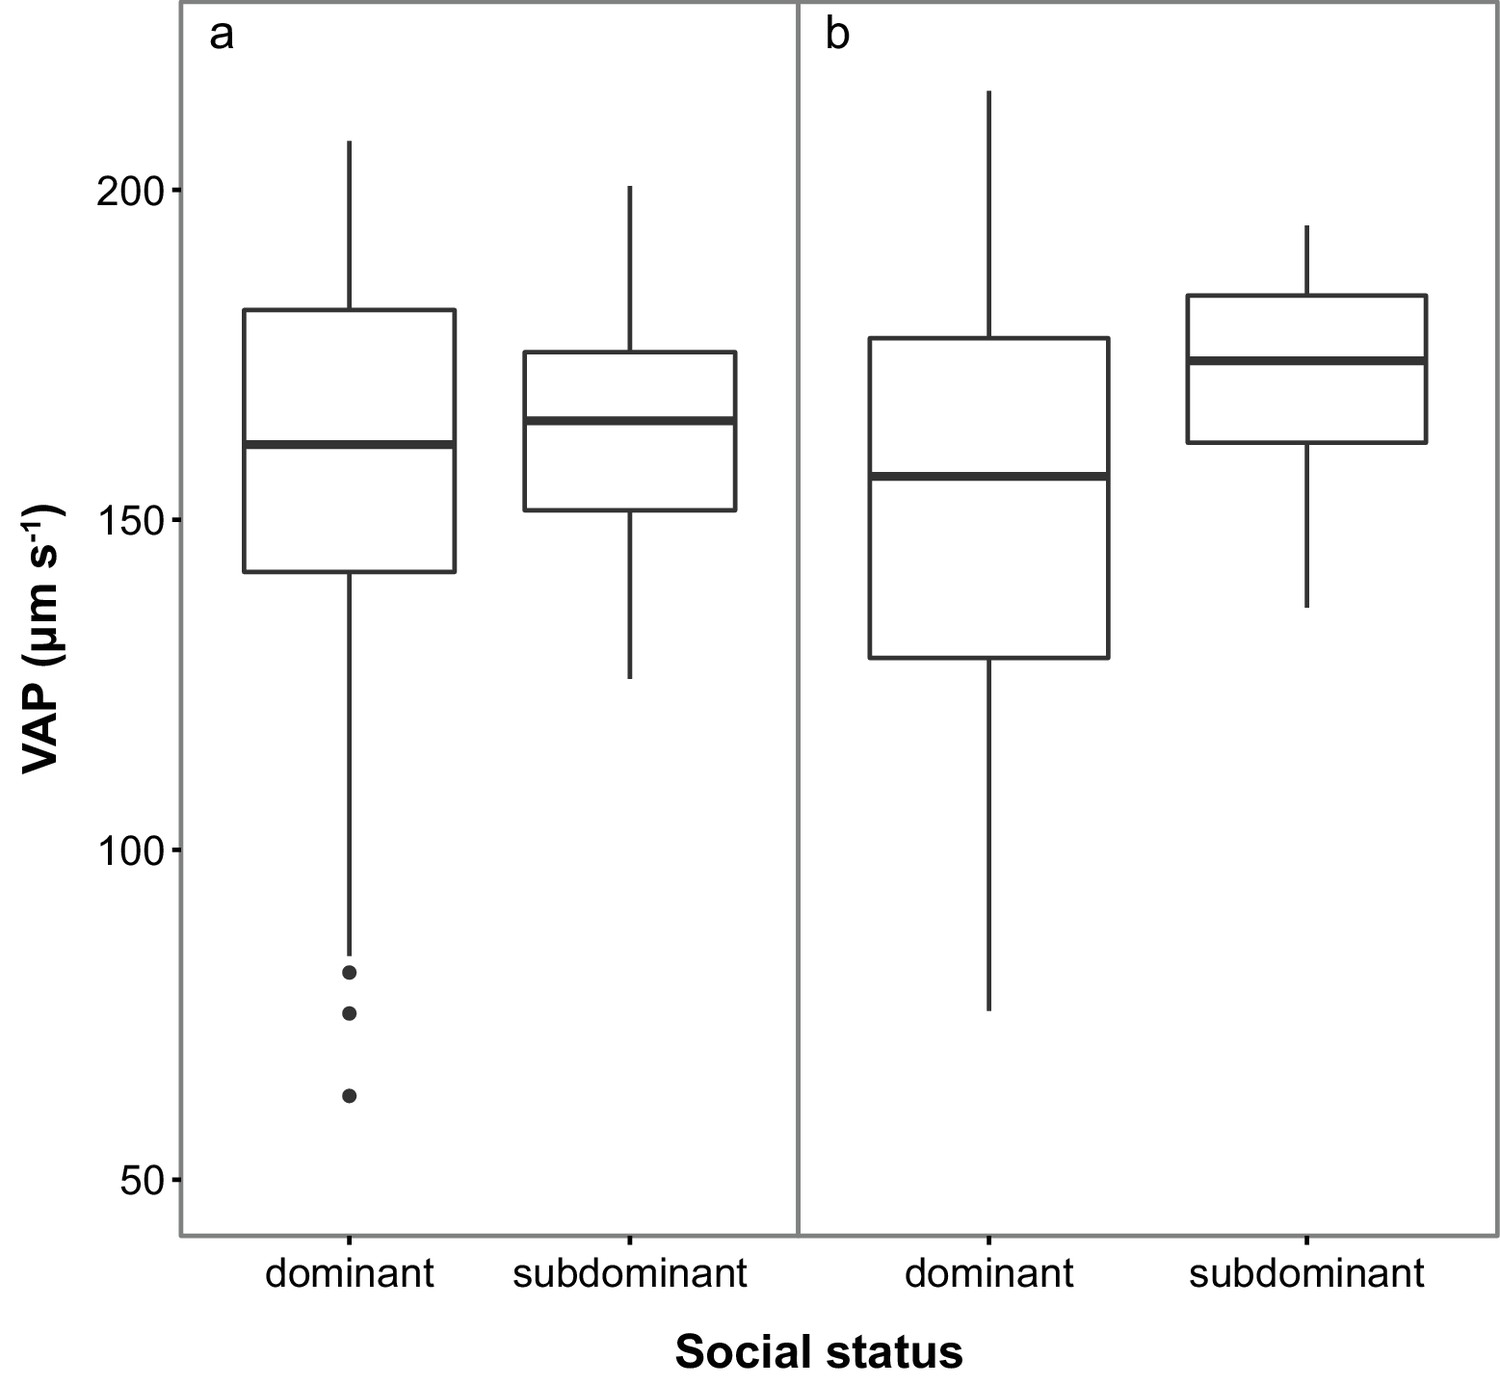
Sperm velocity (VAP in µm s−1) in males of dominant (D) and subdominant (S) social status after a: the first social challenge (D, n = 22; S, n = 22) and b: the second social challenge (D, n = 19; S, n = 19).
Boxplots display the median of each group with the 25th and 75th percentiles and whiskers extend to data within 1.5 x the inter-quartile range.
-
Figure 2—source data 1
Source data for boxplot (Figure 2a).
This Excel file contains the Average Path Velocity (VAP) data collected for males in stage 1 of the experiment.
- https://doi.org/10.7554/eLife.28811.006
-
Figure 2—source data 2
Source data for boxplot (Figure 2b).
This Excel file contains the Average Path Velocity (VAP) data collected for males in stage 2 of the experiment.
- https://doi.org/10.7554/eLife.28811.007
Figure 2—figure supplement 1
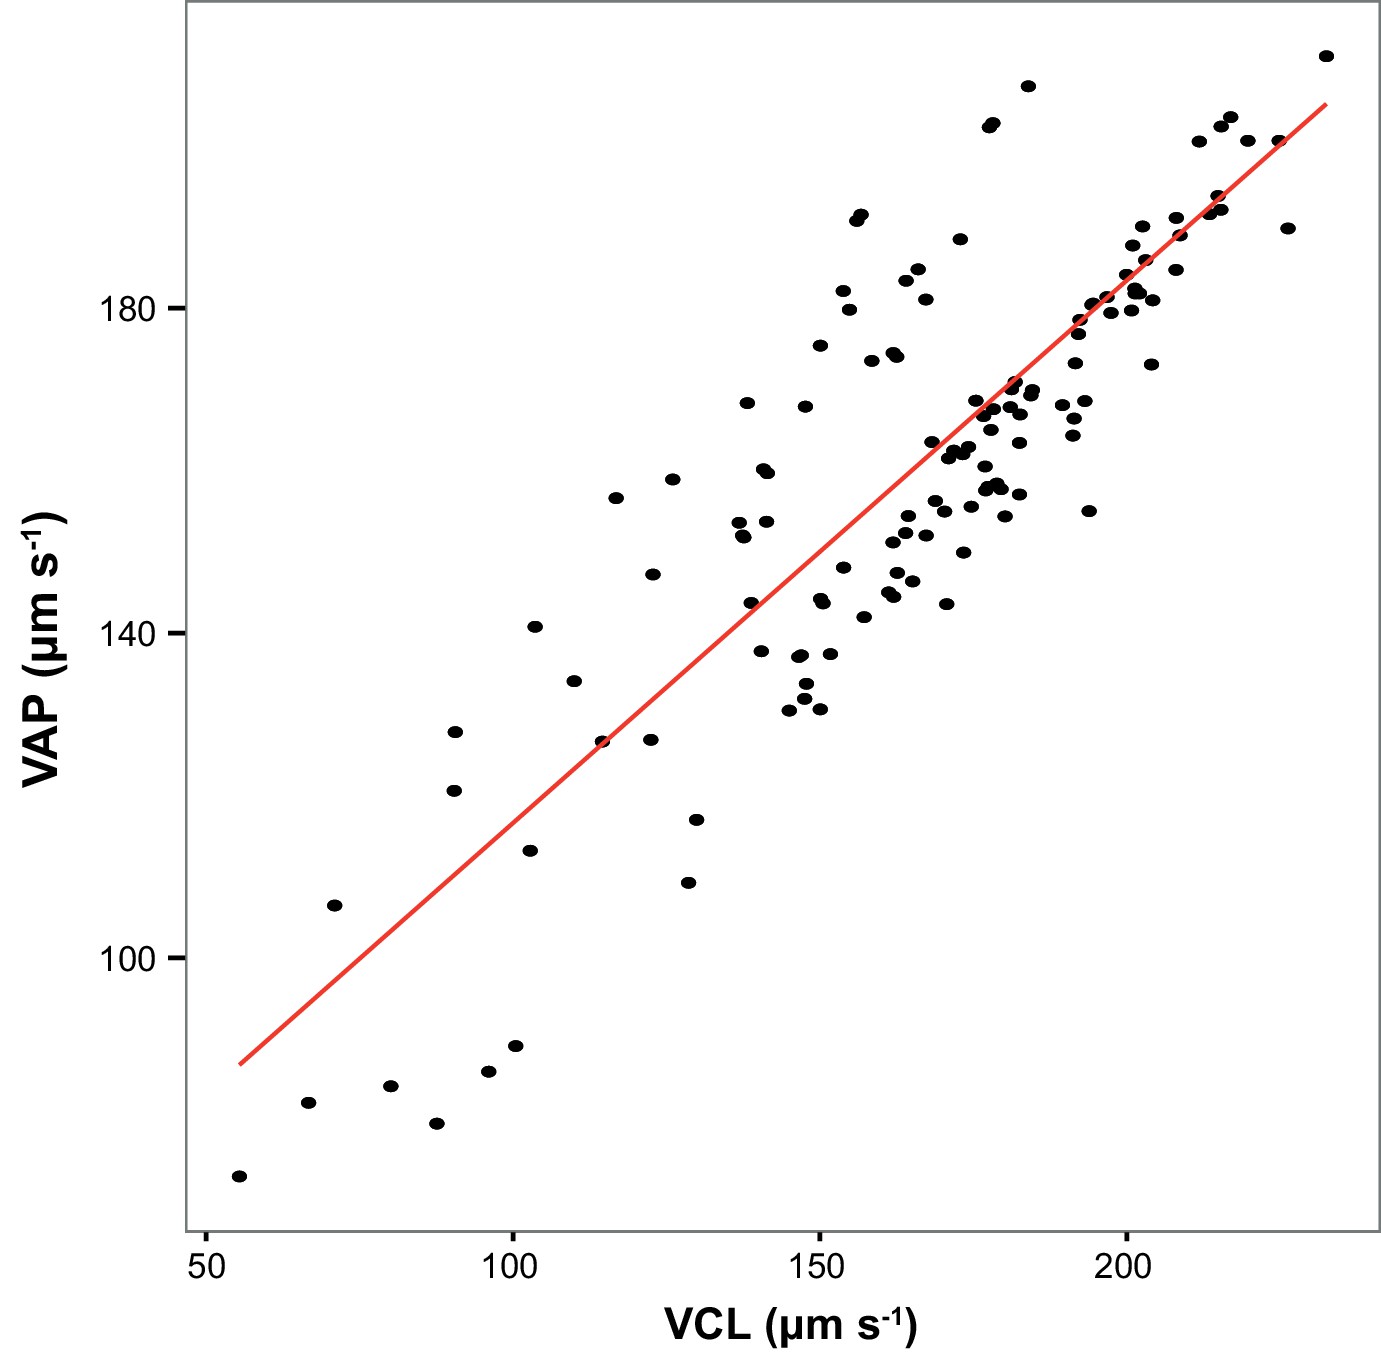
Across all sperm samples collected in this study, Average Path Velocity (VAP) at 10 s post-activation was strongly correlated with Curvilinear Velocity (VCL; r = 0.85, p<0.000 l, n = 126).
https://doi.org/10.7554/eLife.28811.005-
Figure 2—figure supplement 1—source data 1
Source data for correlation analysis.
This Excel file contains the Average Path Velocity (VAP) and Curvilinear Velocity (VCL) data for all sperm samples collected in this study.
- https://doi.org/10.7554/eLife.28811.008
Figure 3
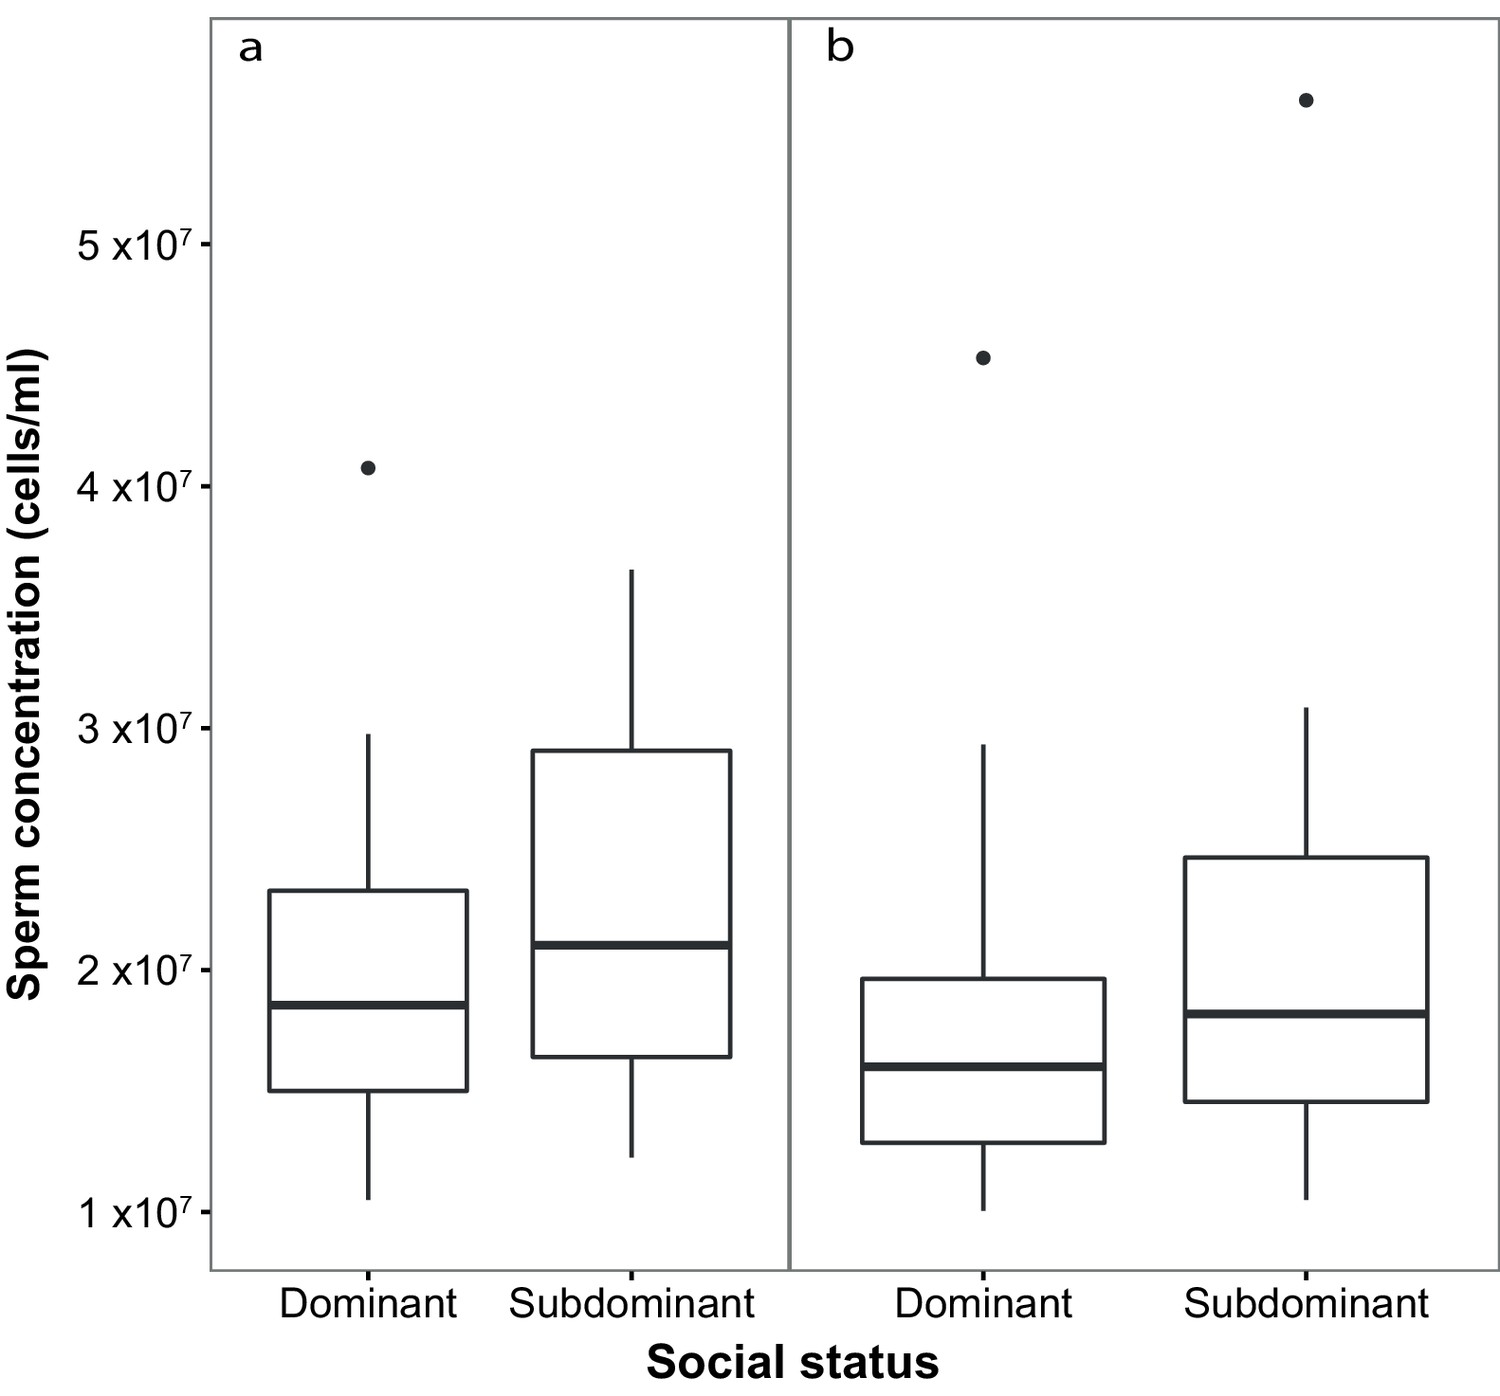
Sperm concentration (cells/ml) in males of dominant (D) and subdominant (S) social status after a: the first social challenge (D, n = 22; S, n = 22) and b: the second social challenge (D, n = 19; S, n = 19).
Boxplots display the median of each group with the 25th and 75th percentiles and whiskers extend to data within 1.5 x the inter-quartile range.
-
Figure 3—source data 1
Source data for boxplot (Figure 3a).
This Excel file contains the sperm concentration data collected for males in stage 1 of the experiment.
- https://doi.org/10.7554/eLife.28811.010
-
Figure 3—source data 2
Source data for boxplot (Figure 3b).
This Excel file contains the sperm concentration data collected for males in stage 2 of the experiment.
- https://doi.org/10.7554/eLife.28811.011
Figure 4
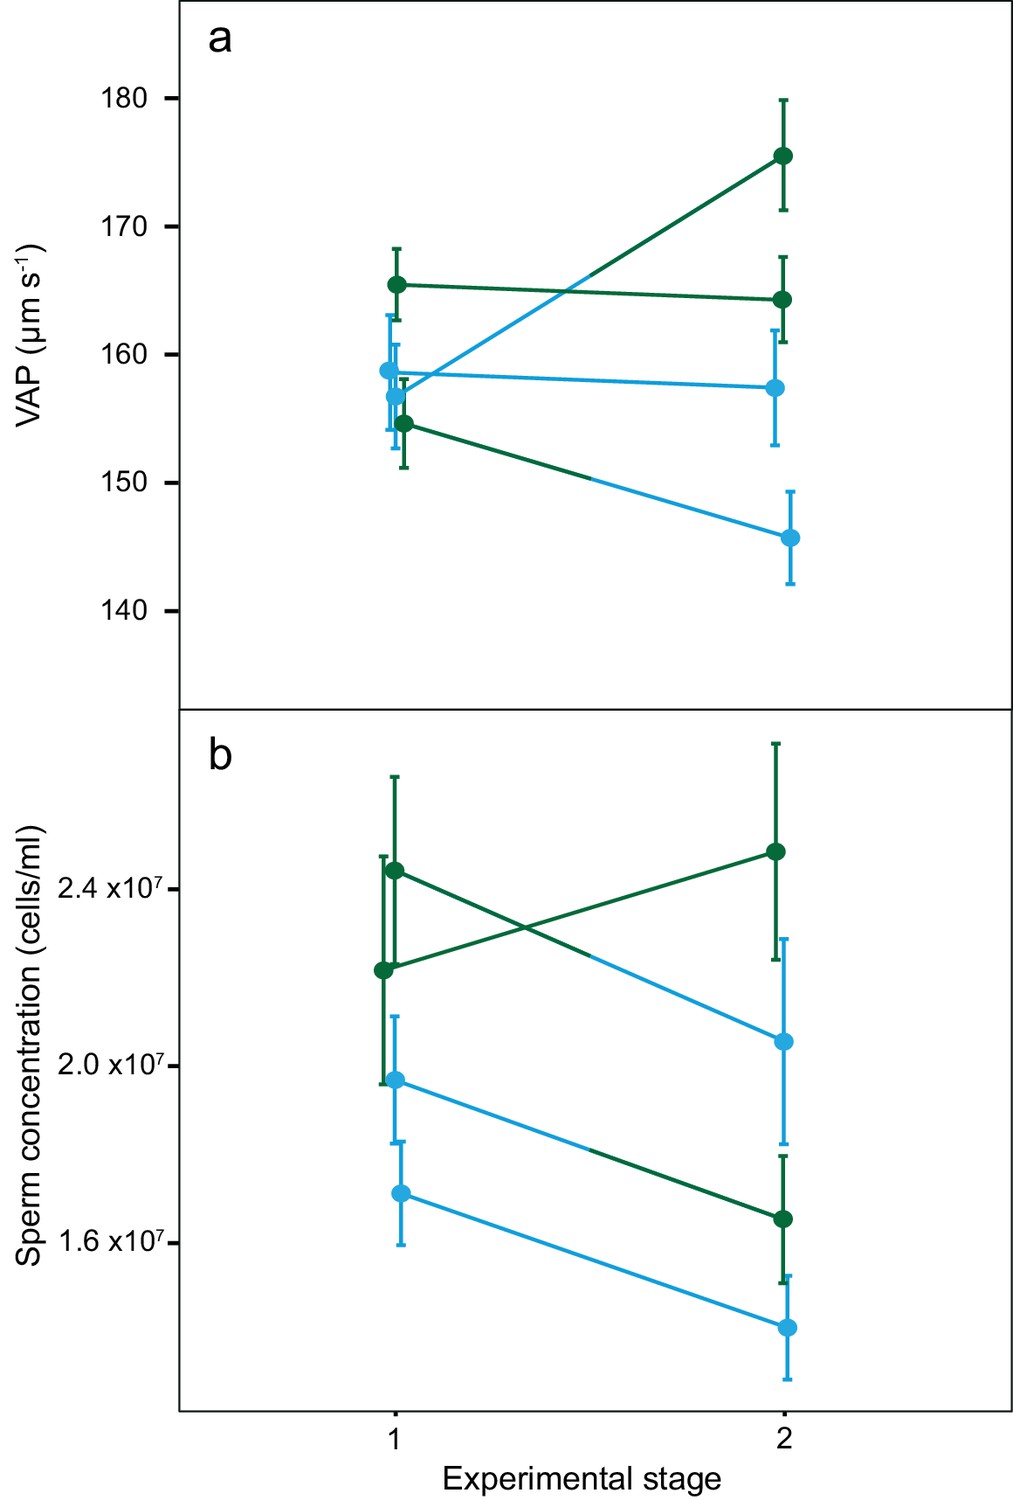
Average sperm velocity (VAP, µm s−1;±s.e.m.) and average sperm concentration (cells/ml;±s.e.m.) in males of the four social phenotypes after each stage of a social status manipulation experiment in chinook salmon.
Blue colour denotes males dominant in both stages (DD, n = 10), green colour denotes males subdominant in both stages (SS, n = 9), a change from blue to green colour denotes males that changed from dominant to subdominant status (DS, n = 10) and a change from green to blue colour denotes males that changed from subdominant to dominant status (SD n = 9). The change in VAP for DS males was statistically significant.
-
Figure 4—source data 1
Source data for Figure 4a.
This Excel file contains the Average Path Velocity (VAP) data collected for males at both stages 1 and 2 of the experiment.
- https://doi.org/10.7554/eLife.28811.014
-
Figure 4—source data 2
Source data for Figure 4b.
This Excel file contains the sperm concentration data collected for males at both stages 1 and 2 of the experiment.
- https://doi.org/10.7554/eLife.28811.015
Figure 5
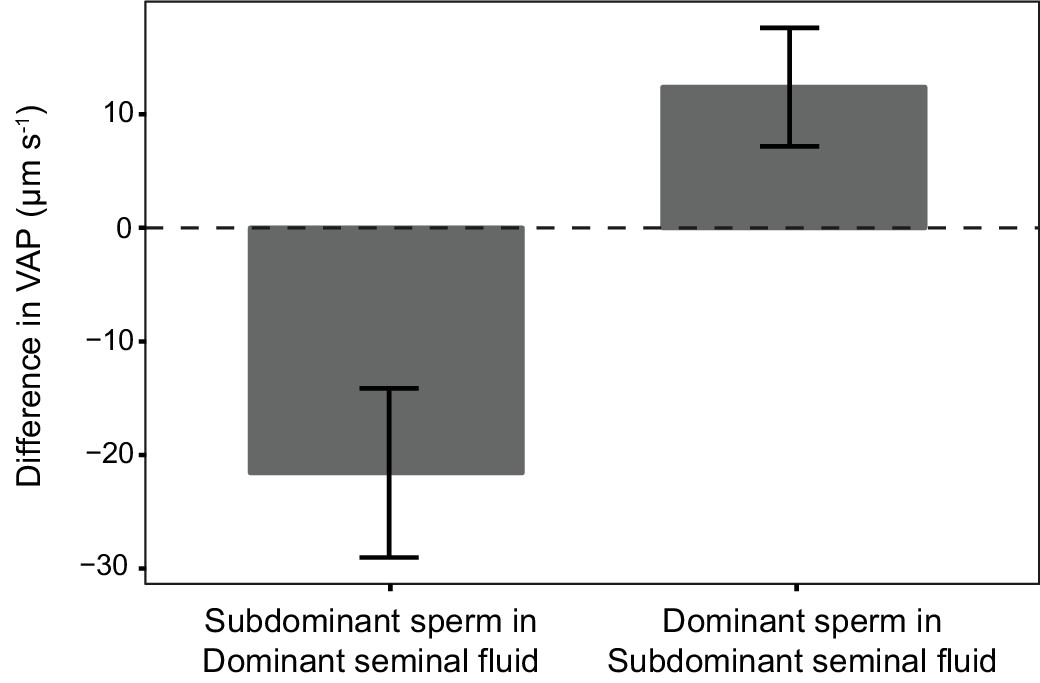
Average difference in sperm velocity (VAP, µm s−1;±s.e.m.) between sperm incubated in their own seminal fluid and incubated in the seminal fluid of their rival in each dyad of a social status manipulation experiment in chinook salmon (n = 42 males in 39 dyads).
Seminal fluid from dominant rival males on average decreased VAP of sperm from subdominant males. In contrast, seminal fluid from rival subdominant males on average increased VAP of sperm from dominant males. Social status was a significant predictor of the difference in sperm velocity between sperm incubated in their own seminal fluid and incubated in the seminal fluid of their rival.
-
Figure 5—source data 1
Source data for Figure 5.
This Excel file contains the sperm velocity data recorded for each males sperm after incubation in either their own seminal fluid or the seminal fluid of their rival. Differences in sperm velocity are calculated for sperm from different males incubated in their own seminal fluid and also for sperm from the same male incubated in own seminal fluid and that of their rival.
- https://doi.org/10.7554/eLife.28811.018
Figure 6
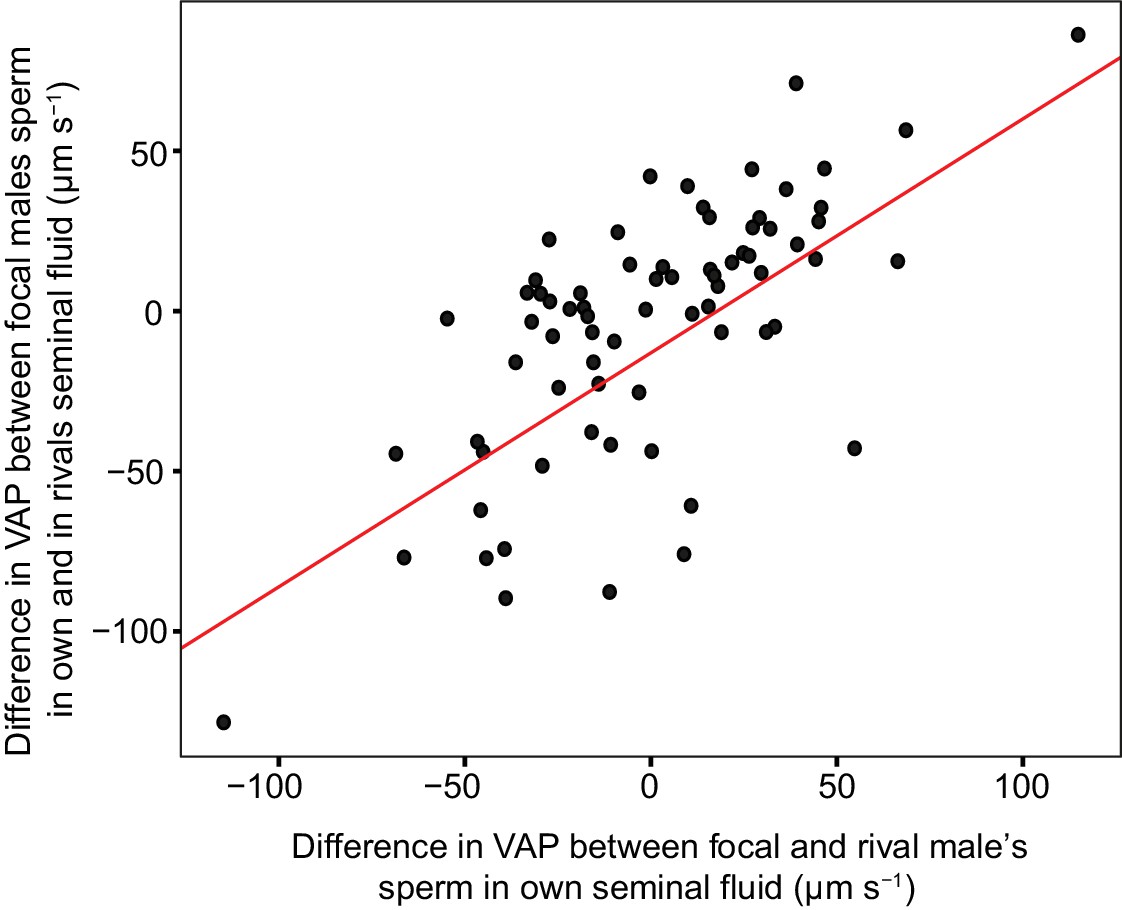
Significant linear relationship between the difference in sperm velocity (VAP, µm s−1), between sperm incubated in their own seminal fluid and incubated in the seminal fluid of their rival, and the difference in VAP between sperm from the males in each pairing incubated in their own seminal fluid for each dyad of a social status manipulation experiment in chinook salmon (n = 42 males in 39 dyads).
Incubating sperm in the seminal fluid of a rival with faster VAP generally results in an increase in that male’s sperm velocity. Likewise, incubating sperm in the seminal fluid of a rival with slower VAP generally results in a decrease in that male’s sperm velocity. Raw data is displayed for ease of interpretation, data analysis required transformation (refer to Materials and methods: Statistical analyses and supplementary material for details).
Figure 7
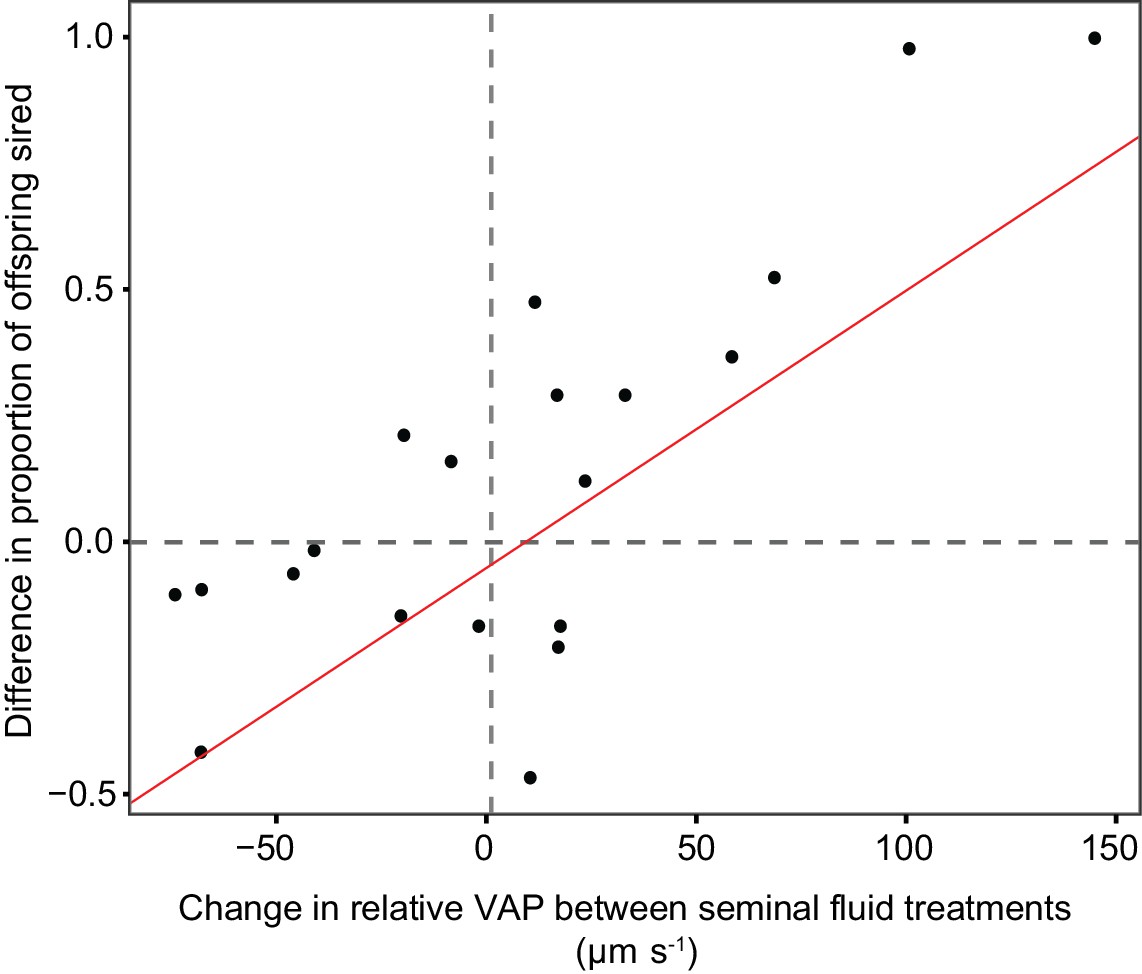
Statistically significant relationship between the difference in the proportion of eggs sired by the focal male in each triad from sperm competition trials using chinook salmon (n = 20) when that male’s sperm were either incubated in their own or their rival’s seminal fluid, and the difference in relative sperm velocity (VAP, µm s−1) between males in each pair when sperm were either incubated in their own or their rival’s seminal fluid.
The relationship shows that change in fertilisation success across seminal fluid treatments is correlated with the change in relative sperm velocity between competing males in each seminal fluid treatment.
-
Figure 7—source data 1
Source data for Figure 7.
This Excel file contains the calculated difference in the proportion of eggs sired by a focal male in each male x male x female combination across seminal fluid treatments (either unmanipulated milt or recombined ejaculates). It also contains the calculated difference in relative sperm velocity between competing males in each male x male x female combination across seminal fluid treatments.
- https://doi.org/10.7554/eLife.28811.022
Tables
Table 1
Generalised linear mixed effects models (GLMM) to compare sperm velocity (VAP, µs−1) and sperm concentration (cells/ml) among male chinook salmon of different social status (see Figure 1 for experimental design).
In stage 1 of the experiment, dominant (D; n = 22) males were compared to subdominants (S; n = 22). In stage 2, separate models were run with the fixed parameter social status with either four levels (males that retained the same status DD (n = 10) and SS (n = 9), and males that changed status SD (n = 9) and DS [n = 10]), or two levels with data pooled together (D = DD + SD (n = 19), S = SS + DS (n = 19)). p-Values are calculated using Satterthwaite approximations to degrees of freedom and 95% confidence intervals were calculated using the Wald method. p-Values are adjusted for multiple testing where multiple pairwise comparisons are made using the Bonferroni method with significant values highlighted in bold.
| Response variable | Stage | Parameters (fixed effects) | Estimate | 95% CI | p Value |
|---|---|---|---|---|---|
| VAP | 1 | Intercept | 152.9 | 135.3–170.4 | |
| D – S | 7.4 | −8.6–23.4 | 0.37 | ||
| 2 | Intercept | 127.1 | 108.8–145.5 | ||
| D – S | 19.7 | 5.1–34.2 | 0.01 | ||
| 2 | Intercept | 131.2 | 109.2–153.2 | ||
| DD – SS | 14.9 | −6.5–36.5 | 0.18 | ||
| DD – DS | 17.9 | −2.7–38.5 | 0.09 | ||
| SD – DS | 24.4 | 2.9–45.9 | 0.03 | ||
| SD – SS | 21.5 | −0.2–43.2 | 0.06 | ||
| Sperm concentration | 1 | Intercept | 6.0 | 5.81–6.22 | |
| D – S | 0.2 | 0.01–0.39 | 0.04 | ||
| 2 | Intercept | 5.9 | 5.72–6.21 | ||
| D – S | 0.2 | −0.06–0.41 | 0.14 | ||
| 2 | Intercept | 5.8 | 5.55–6.09 | ||
| DD – SS | 0.5 | 0.16–0.77 | 0.003 | ||
| DD – DS | 0.1 | −0.16–0.43 | 0.36 | ||
| SD – DS | −0.1 | −0.44–0.18 | 0.42 | ||
| SD – SS | 0.2 | −0.12–0.52 | 0.21 |
Table 2
Generalised linear mixed effects models (GLMM) to compare sperm velocity (VAP, µs−1) and sperm concentration (cells/ml) in males of each social phenotype changing from stage 1 to stage 2 of the experiment.
The four social phenotypes are males that remained dominant (DD, n = 10) or subdominant (SS, n = 9) in both stages and males that changed status in either direction, subdominant to dominant (SD, n = 9) and dominant to subdominant (DS, n = 10). p-Values are calculated using Satterthwaite approximations to degrees of freedom and 95% confidence intervals were calculated using the Wald method. p-Values are adjusted for multiple testing using the Bonferroni method with significant values highlighted in bold.
| Response variable | Social phenotype | Parameters (fixed effects) | Estimate | 95% CI | p alue |
|---|---|---|---|---|---|
| VAP | DD | Intercept | 109.1 | 88.9–129.2 | |
| Stage 1 – Stage 2 | 0.1 | −14.1–14.4 | 0.9 | ||
| SD | Intercept | 139.6 | 111.9–167.2 | ||
| Stage 1 – Stage 2 | −8.9 | −19.5–1.5 | 0.1 | ||
| DS | Intercept | 163.9 | 141.1–186.8 | ||
| Stage 1 – Stage 2 | 17.2 | 5.4–29.1 | 0.008 | ||
| SS | Intercept | 162.5 | 147.1–177.9 | ||
| Stage 1 – Stage 2 | −2.3 | −12.0–7.4 | 0.6 | ||
| Sperm concentration | DD | Intercept | 5.6 | 5.34–5.97 | |
| Stage 1 – Stage 2 | −0.2 | −0.39–0.06 | 0.2 | ||
| SD | Intercept | 6.4 | 6.12–6.68 | ||
| Stage 1 – Stage 2 | −0.2 | −0.48–0.002 | 0.05 | ||
| DS | Intercept | 6.1 | 5.56–6.58 | ||
| Stage 1 – Stage 2 | −0.1 | −0.34–0.15 | 0.4 | ||
| SS | Intercept | 6.4 | 6.09–6.61 | ||
| Stage 1 – Stage 2 | 0.1 | −0.17–0.35 | 0.5 |
Table 3
Generalised linear mixed effects models (GLMM) predicting the change in sperm velocity (VAP, µs−1) observed in the focal male’s sperm when incubated in either their own seminal fluid or the seminal fluid of their rival male in that dyad, using the social status of the rival male and the relative VAP between sperm from focal and rival males as measured in their own seminal fluid (n = 42 males in 39 dyads).
p-Values are calculated using Satterthwaite approximations to degrees of freedom and 95% confidence intervals were calculated using the Wald method. Significant values are highlighted in bold.
| Response variable | Model | Parameters (fixed effects) | Estimate | 95% CI | p-Value |
|---|---|---|---|---|---|
| Change in VAP | 1 | Intercept | −24.4 | −41.8–−7.0 | |
| Rival’s Social Status | 31.4 | 15.1–47.7 | 0.0003 | ||
| 2 | Intercept | −0.64 | |||
| Rival’s Social Status | 0.44 | −0.7–1.6 | 0.465 | ||
| Relative VAP | 0.05 | 0.04–0.07 | <0.0001 |
Table 4
Generalised linear mixed effects models (GLMM) predicting the fertilisation success of male chinook salmon in sperm competition trials using two males and one female.
Trials were conducted using two seminal fluid (SF) treatments, either unmanipulated milt, or recombined ejaculates for which the sperm for both competitors were recombined with the seminal fluid of their rival. Sperm concentration was controlled so that the same number of sperm were used for each male. The first models used the social status of each male to predict the proportion of offspring sired (n = 20). The second models used the relative sperm velocity (VAP, µm s−1) between competitors to predict the difference in offspring sired (n = 20). The final model shows that the change in relative sperm velocity between males within the same male-male-female combinations across SF treatments was a significant predictor of the change in the proportion of eggs sired by that male’s sperm across SF treatments (n = 20). p-Values are calculated using Satterthwaite approximations to degrees of freedom and 95% confidence intervals were calculated using the Wald method. Significant values are highlighted in bold.
| Response variable | SF treatment | Parameters (fixed effects) | Estimate | 95% | P value |
|---|---|---|---|---|---|
| Proportion of offspring sired | Unmanipulated | Intercept Social status | −0.38 1.11 | 0.63–1.58 | <0.0001 |
| Recombined | Intercept SF social status | −3.24 6.23 | 4.7–7.7 | <0.0001 | |
| Difference in number of offspring sired between males | Unmanipulated | Intercept Relative sperm velocity | −1.49e03 1.44e−01 | 0.06–0.23 | 0.003 |
| Recombined | Intercept Relative sperm velocity | 3.72e03 0.13 | 0.05–0.21 | 0.003 | |
| Difference in proportion of eggs sired across SF treatments | NA | Intercept Difference in relative sperm velocity across SF treatments | −56.39 0.006 | 3.5e−03– 7.6e−03 | 0.0001 |
-
Table 4—source data 1
Source data for GLMM models predicting the fertilisation success of male chinook salmon in sperm competition trials.
This Excel file contains data on the proportion of eggs sired by each male and the social status of those males. The data is presented in two tabs, the first for the unmanipulated milt and the second for the recombined ejaculate seminal fluid treatments.
- https://doi.org/10.7554/eLife.28811.024
-
Table 4—source data 2
Source data for GLMM models predicting the fertilisation success of male chinook salmon in sperm competition trials.
This Excel file contains data on the diffence in the number of eggs sired between males in each sperm competition trial and the relative sperm velocity of those males. The data is presented in two tabs, the first for the unmanipulated milt and the second for the recombined ejaculate seminal fluid treatments.
- https://doi.org/10.7554/eLife.28811.025
Table 5
The Dominance Index (DI) of the Dominant (D) and Subdominant (S) males in 11 pairings (6 in stage 1 and 5 in stage 2).
In 2013, behavioural observations were conducted twice for each pair, on the day the pair was formed (as in other years) and the next day as a means to assess the stability of social hierarchies. We found that in 10 out of 11 pairs the status of males determined on the first day did not change from on the second day.
| Social status | D | D | S | S | |
|---|---|---|---|---|---|
| Pair | Stage | Day 1 | Day 2 | Day 1 | Day 2 |
| 1 | 1 | 0.844 | 0.739 | 0.155 | 0.26 |
| 2 | 1 | 0.8 | 0.75 | 0.19 | 0.25 |
| 3 | 2 | 0.829 | 0.857 | 0.17 | 0.14 |
| 4 | 2 | 1 | 0.93 | 0 | 0.06 |
| 5 | 1 | 0.98 | 1 | 0.01 | 0 |
| 6 | 1 | 0.96 | 0.89 | 0.03 | 0.1 |
| 7 | 2 | 0.82 | 0.15 | 0.2 | 0.8 |
| 8 | 1 | 0.97 | 1 | 0.03 | 0 |
| 9 | 1 | 1 | 1 | 0 | 0 |
| 10 | 2 | 0.85 | 1 | 0.15 | 0 |
| 11 | 2 | 1 | 1 | 0 | 0 |
Table 6
Microsatellite primers used to determine paternity.
Primers Ots 100, Ots 101 and Oki 3a were amplified in a multiplex reaction, Ots 104 was amplified singly using a touchdown protocol. Letter at 5’ end indicates fluorescent label: p=Pet (red), F = Fam (blue), N = Ned (yellow), V = Vic (green).
| Primer | Primer sequence 5’−3’ | Master mix | PCR | Source | |
|---|---|---|---|---|---|
| Ots 100 | F | P-tga-aca-tga-gct-gtg-tga-g | Multiplex | Multiplex | Nelson and Beacham (1999) |
| R | P-acg-gac-gtg-cca-gtg-ag | ||||
| Ots 101 | F | F-acg-tct-gac-ttc-aat-tgg-t | Multiplex | Multiplex | Small et al. (1998) |
| R | F-tat-taa-tcc-tcc-aac-cca-g | ||||
| Oki 3a | F | N-tgt-gct-ata-ggc-tga-atg-tgc | Multiplex | Multiplex | Unpublished, See, Kinnison et al. (2002) |
| R | N-aac-aca-ggc-atc-ccc-act-aa | ||||
| Ots 104 | F | V-gca-ctg-tat-cca-cca-tga | Single | Touchdown | Nelson and Beacham (1999) |
| R | V-gta-gga-gtt-tca-ttt-gaa-tc |
Additional files
-
Supplementary file 1
- https://doi.org/10.7554/eLife.28811.028
-
Transparent reporting form
- https://doi.org/10.7554/eLife.28811.029
Download links
A two-part list of links to download the article, or parts of the article, in various formats.
Downloads (link to download the article as PDF)
Open citations (links to open the citations from this article in various online reference manager services)
Cite this article (links to download the citations from this article in formats compatible with various reference manager tools)
Sperm competition risk drives rapid ejaculate adjustments mediated by seminal fluid
eLife 6:e28811.
https://doi.org/10.7554/eLife.28811


