Cyclic di-GMP differentially tunes a bacterial flagellar motor through a novel class of CheY-like regulators
- Biozentrum of the University of Basel, Switzerland
- Yale University, United States
Figures
Figure 1 with 1 supplement
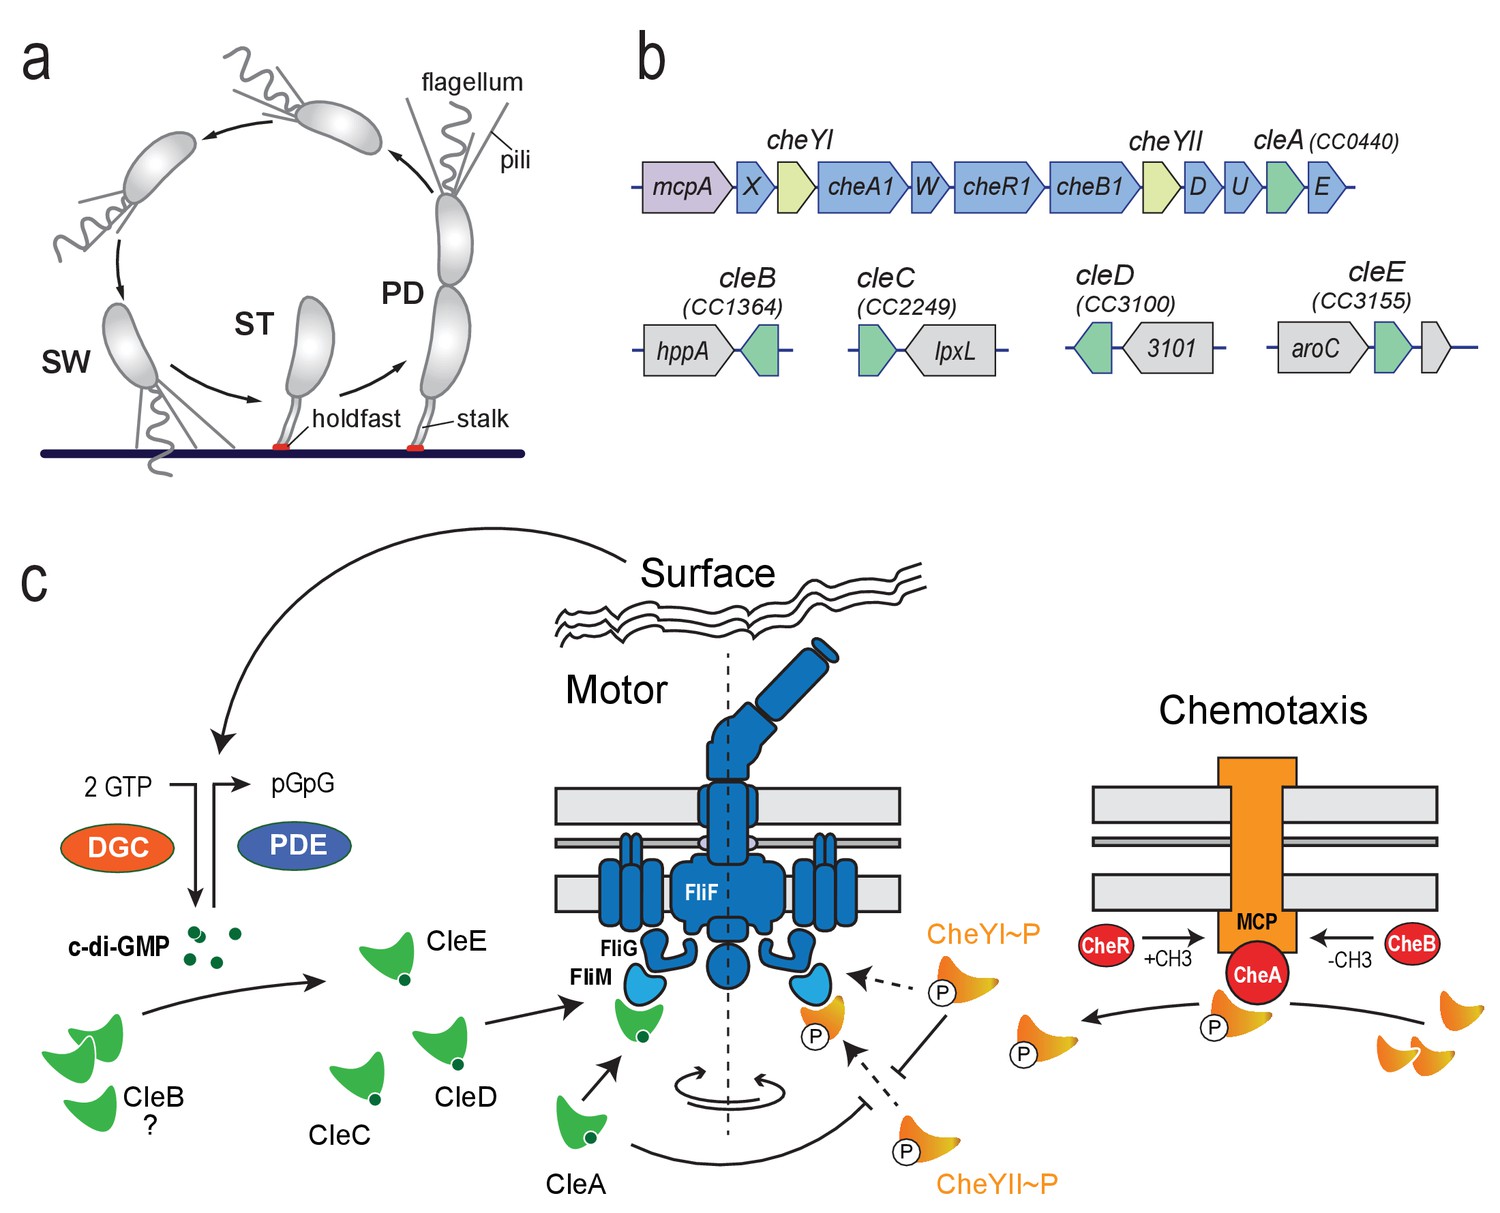
Cle proteins constitute a novel family of CheY like proteins in C. crescentus.
(a) Schematic of the C. crescentus cell cycle. SW, swarmer; ST, stalked; PD, predivisional cell. (b) Genomic organization of the C. crescentus chemotaxis gene cluster and of regions containing cle genes. Purple: mcp gene (methyl-accepting chemotaxis protein); blue: che genes; light green: cheY genes; dark green cle genes; grey: hypothetical genes. (c) Model for CheY and Cle-mediated control of the C. crescentus flagellum. CheY (orange) and Cle proteins (green) interact with the flagellar switch protein FliM. CheYII is the functional homolog of E. coli CheY and is responsible to induce motor reversals upon phosphorylation by chemoreceptor-coupled kinases CheA (red) and subsequent binding to the FliM switch protein. CleA (in its c-di-GMP bound form) and CheYI ~P compete with CheYII ~P for FliM binding sites thereby reducing the overall reversal rate of the flagellar motor. Accordingly, CleA may promote smooth forward or backward swimming through CheYII competition under conditions that boost c-di-GMP levels in motile C. crescentus SW cells. Enzymes regulating the internal concentration of c-di-GMP (green) (DGC, red; PDE, blue) are indicated. CleC, CleE and possibly CleD interfere with motor function to boost rapid surface attachment. These proteins may be part of a feedback mechanism through which the flagellum signals surface encounter via DGCs and/or PDEs to increase the internal c-di-GMP pool (Hug et al., 2017).
Figure 1—figure supplement 1
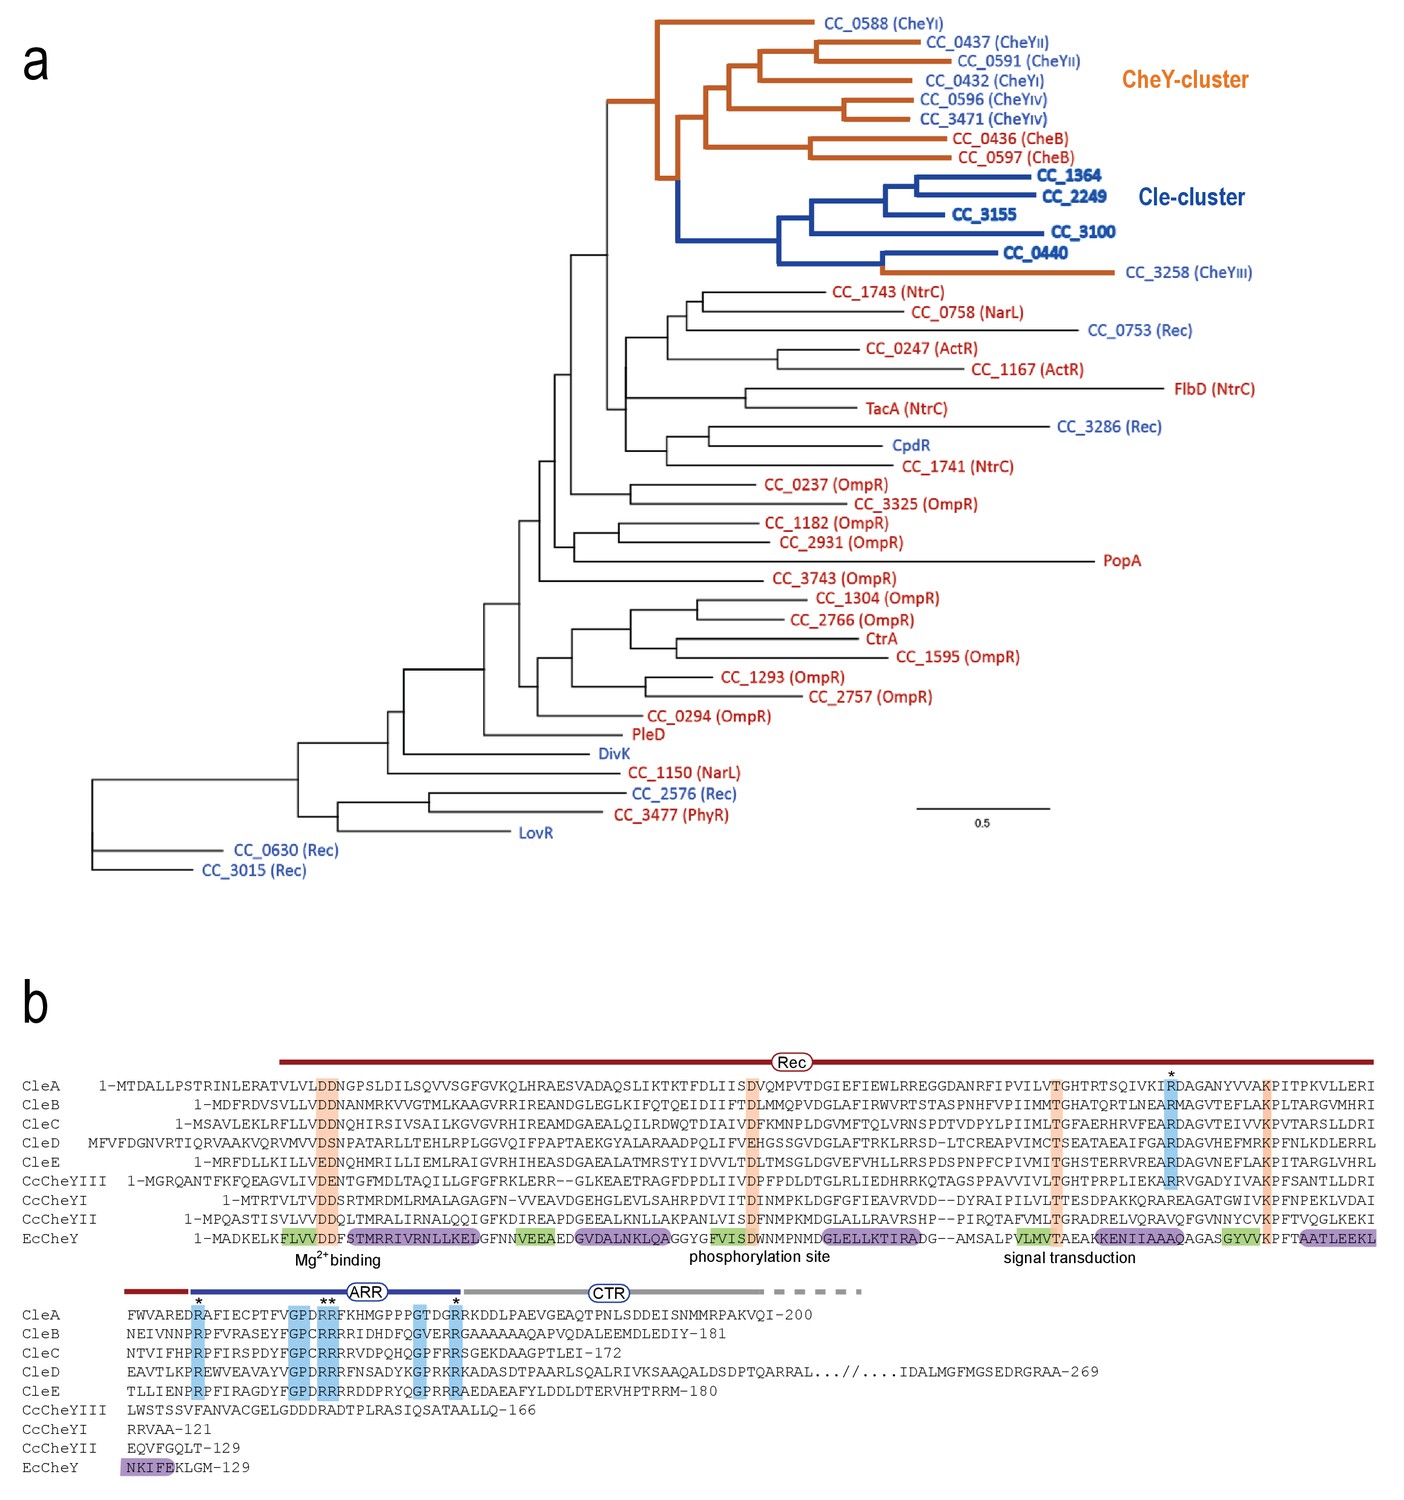
Grouping and alignment of C. crescentus Cle proteins.
(a) The phylogenetic tree of C. crescentus response regulators based on the sequence of their receiver domains. The CheY cluster (orange lines) and the Cle subcluster (blue lines) are highlighted. The five Cle proteins are closely related to response regulators (RR) of the CheY and CheB family but share a unique C-terminal Arg-rich region (ARR). Single domain response regulators are labeled blue; response regulators with C-terminal output domains are labeled red. (b) Alignment of C. crescentus CleA-E, CheYIII (CC3258), CheYI (CC0432), CheYII (CC0437) and of E. coli CheY (EcCheY). The boundaries of receiver domain (Rec), Arg-rich region (ARR) and C-terminal region (CTR) are indicated. Secondary structure elements of CheY are indicated in purple (α-helices) and in green (β-sheets) (Cho et al., 2000). Orange: conserved residues involved in phosphorylation-mediated activation of CheY (Bourret, 2010). Blue: Residues specifically conserved within the Cle protein family with conserved Arg residue marked with asterisks.
Figure 2 with 1 supplement
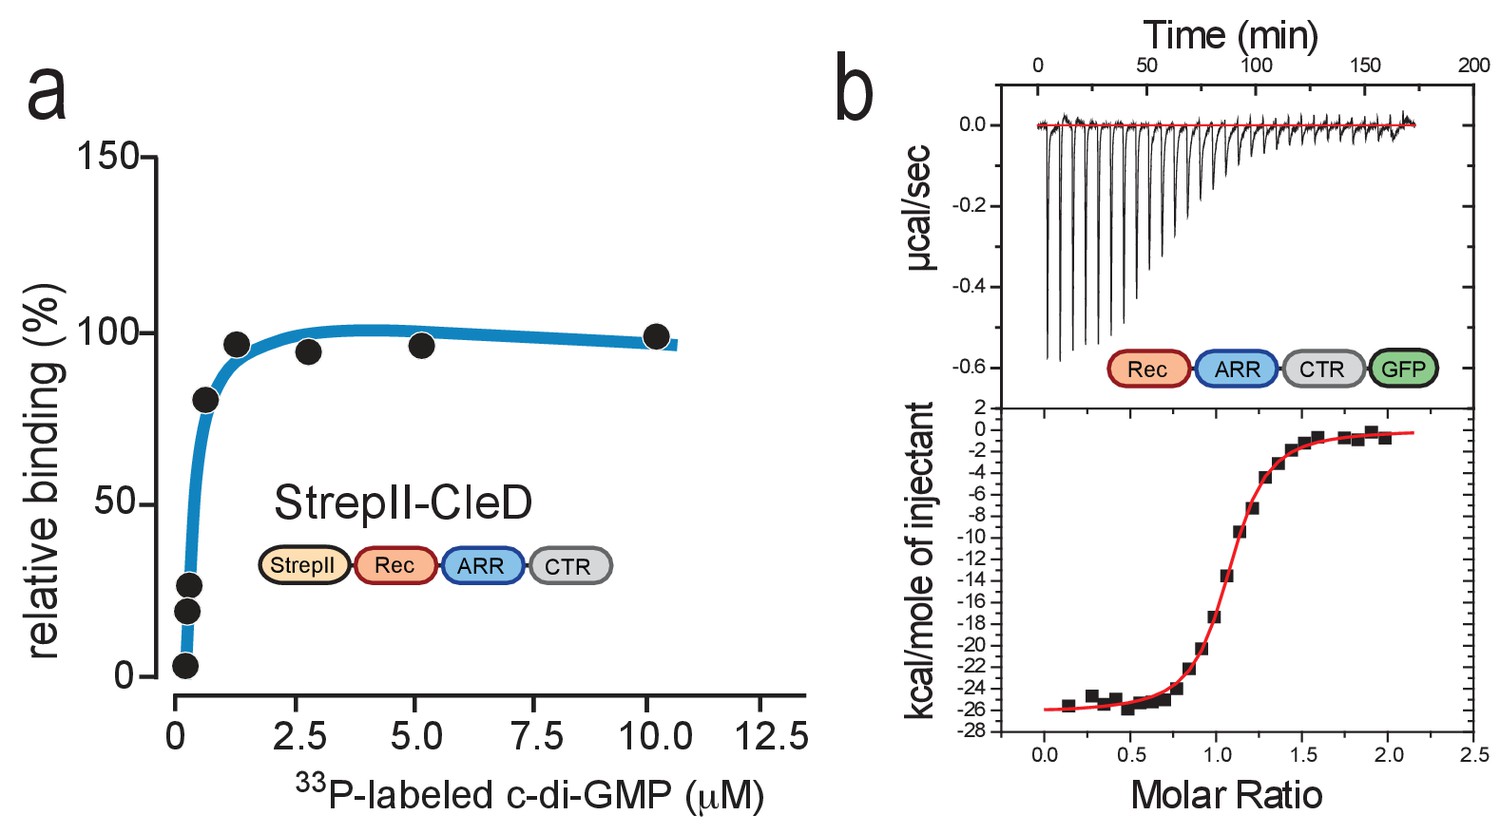
CleD specifically binds c-di-GMP.
(a) UV-cross-linking of purified StrepII-CleD (1 μM) with increasing amounts of 33P-labelled c-di-GMP. The Kd was determined to 212 nM. (b) ITC experiment analyzing c-di-GMP binding to CleD-GFP. The top panel shows the raw ITC data collected at 10°C, the bottom panel depicts the integrated titration peaks. The Kd for c-di-GMP binding to CleD-GFP was calculated as 86 nM. Experiments in (a) and (b) include two technological replicas with a representative example shown.
Figure 2—figure supplement 1
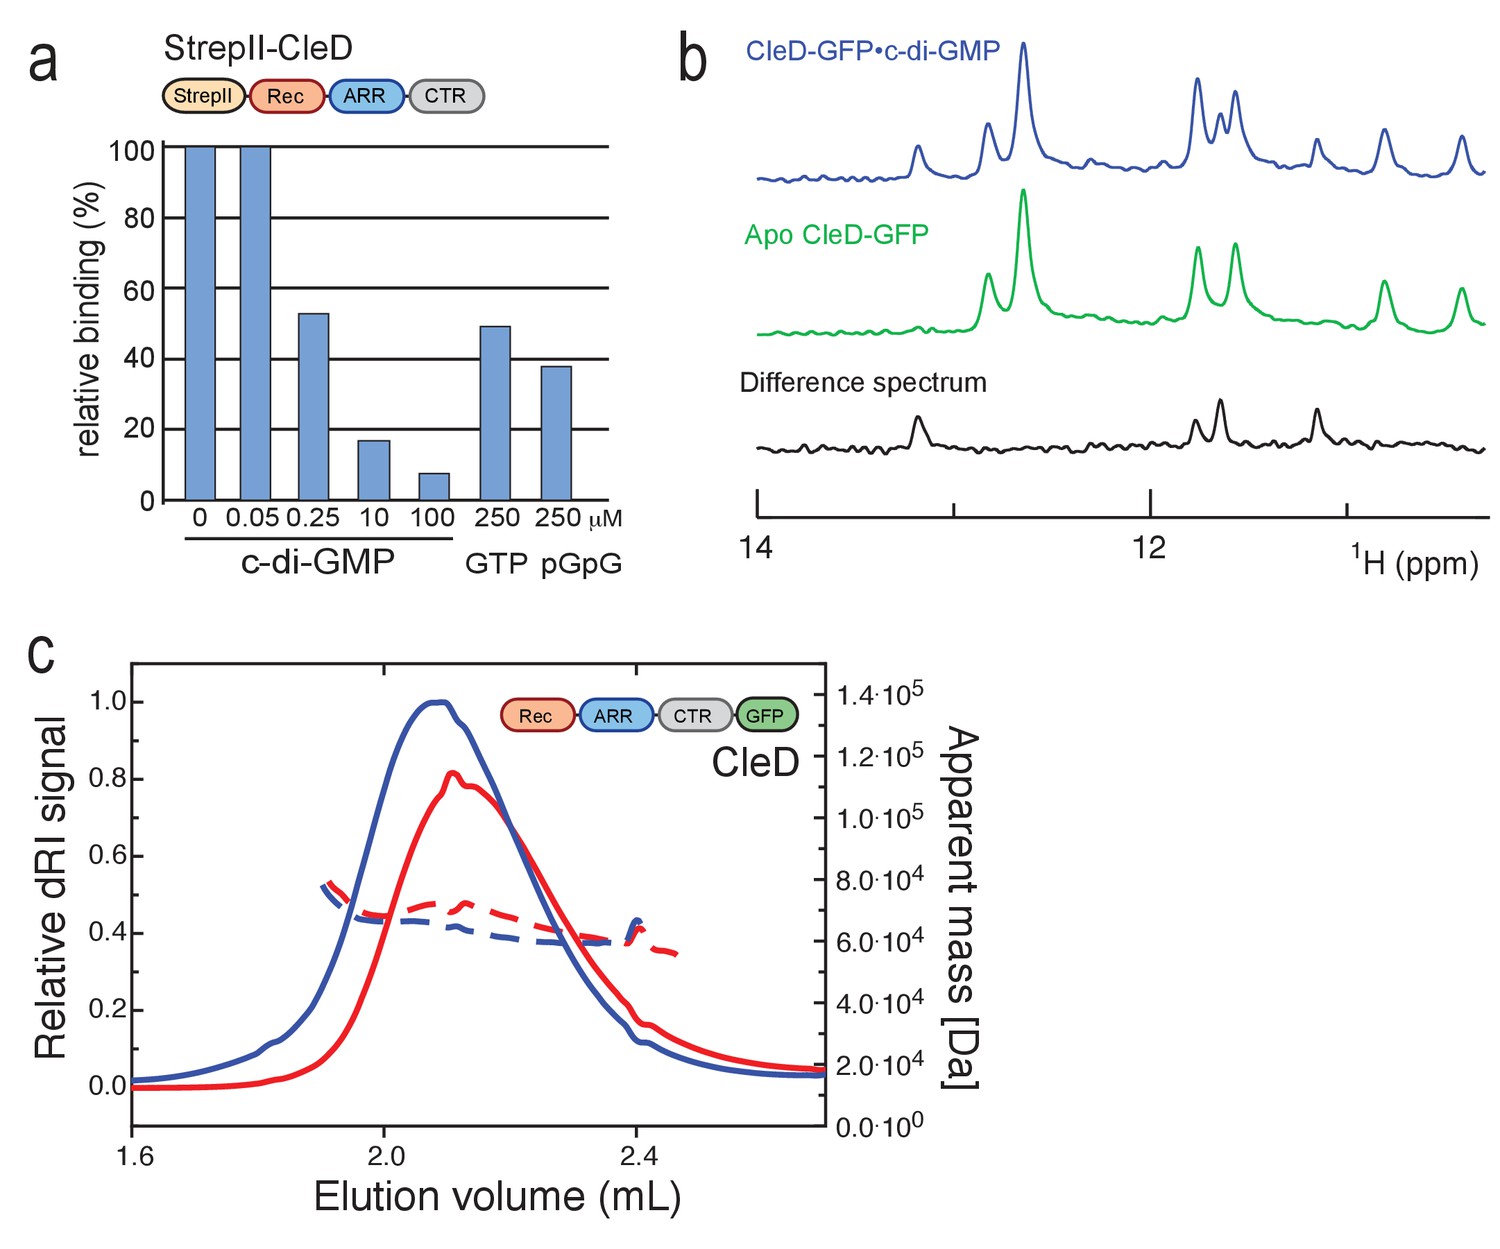
Biochemical and biophysical characterization of CleD.
(a) CleD binds c-di-GMP specifically. Purified StrepII-CleD (1 µM) was UV cross-linked in the presence of 0.25 µM 33P-labelled c-di-GMP and the indicated concentrations of non-labeled nucleotides. Binding is shown as relative units determined in the absence of non-labeled nucleotides. While equimolar amounts of non-labeled c-di-GMP reduced binding of 33P-labelled c-di-GMP, a similar reduction required 1000-fold higher concentrations of GTP or pGpG. (b) Excerpts of the one-dimensional 1H-NMR Jump-return spectra of CleD-GFP in the presence of c-di-GMP (blue), without c-di-GMP (green), and the difference spectrum of both. Four different imino H1 proton resonances are observed in the difference spectrum, indicative of four guanosines in an asymmetric environment. This is consistent with the binding of one c-di-GMP dimer to one protein monomer. A similar spectrum was observed for PA4608·c-di-GMP, which binds c-di-GMP as an intercalated dimer (Habazettl et al., 2011). (c) CleD is a monomer in its apo- and ligand bound form. SEC-MALS chromatograms of His-CleD-GFP in the absence (red) and presence of c-di-GMP (blue). Loading concentrations were 38.6 µM for CleD-GFP and 192.8 µM for c-di-GMP. Continuous lines represent the dRI signal (left axis) and broken lines the MALS derived apparent mass values (right axis). The calculated mass using ProtParam was 58.4 kDa for CleD-GFP and apparent masses are 69.2 kDa and 64.5 kDa for CleD-GFP and CleD-GFP/c-di-GMP, respectively.
Figure 3 with 2 supplements
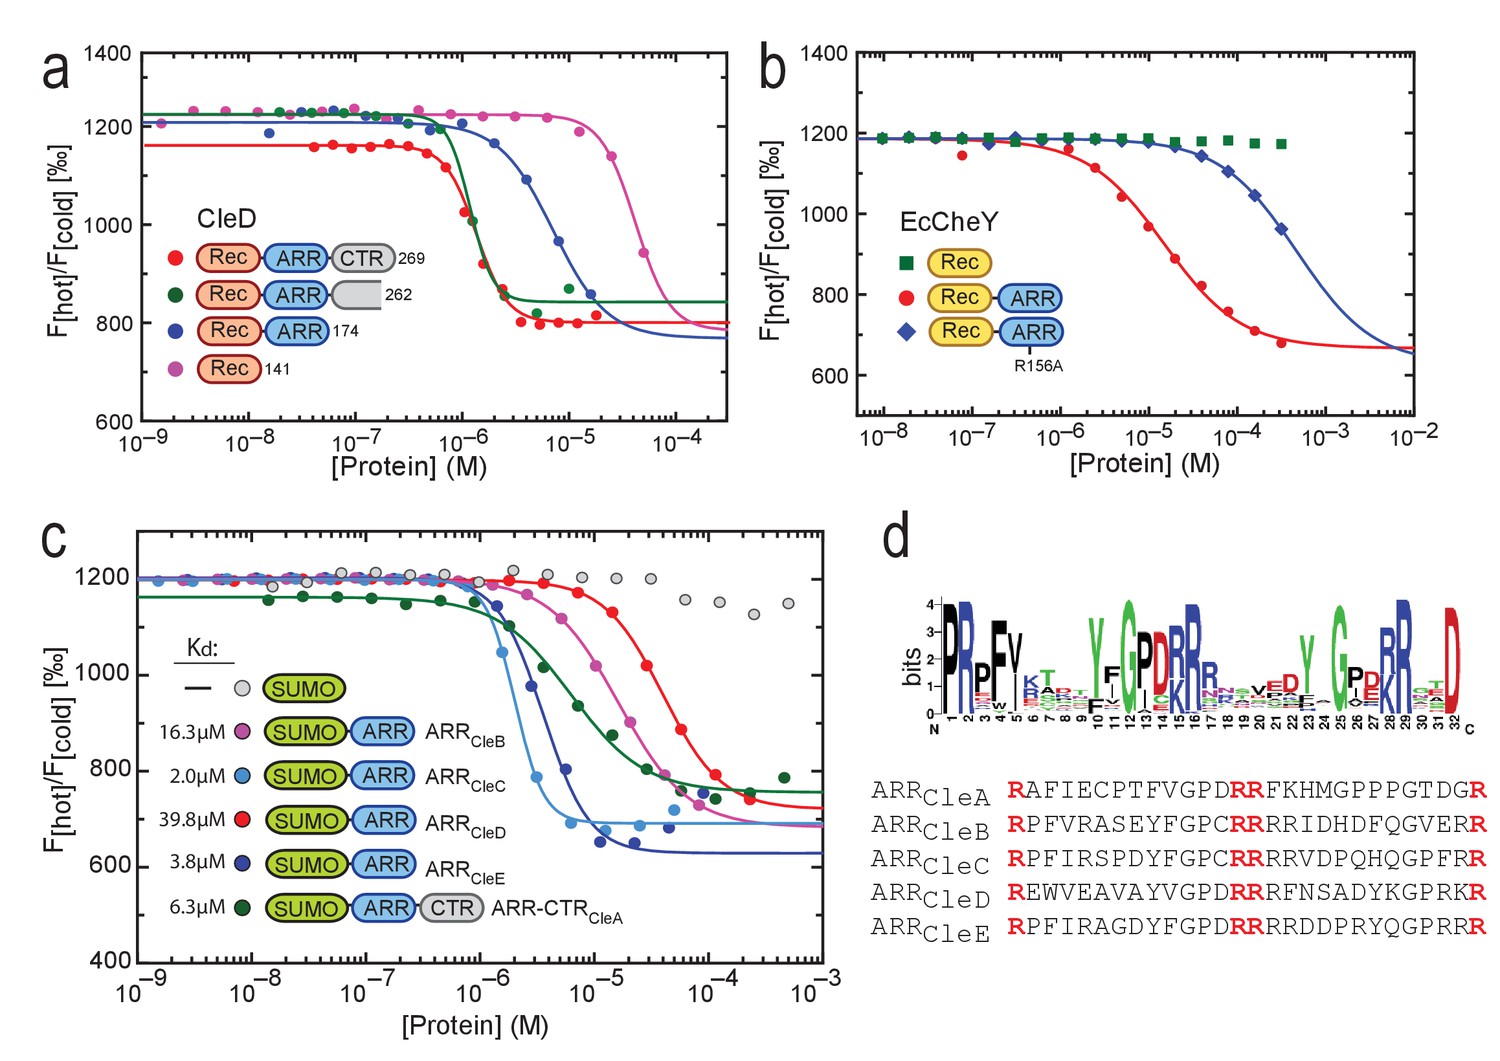
C-di-GMP binds to C-terminal Arg-rich peptides.
(a) c-di-GMP binding to CleD requires the ARR. Microscale thermophoresis (MST) experiments with purified full-length His-CleD and truncated variants using 60 nM of the ligand 2'-Fluo-AHC-c-di-GMP (flr-cdG). Kds were determined as follows: 1.2 µM for His-CleD (aa 19–269), 1.3 µM for His-CleD (aa 19–262), 6.2 µM for His-CleD-rec-ARR (aa 19–174) and 41.7 µM for His-CleD-rec (aa 19–141). (b) The ARR peptide is sufficient to bind c-di-GMP. The ARR of CleD was fused to the C-terminus of E. coli CheY. Binding of flr-cdG to purified His-CheY (green) and its variants containing a wild-type ARR (red) or the R156A mutant ARR (blue) was determined by MST. Apparent Kds were calculated as 14.8 µM (red) and 471 µM (blue). (c) c-di-GMP binds to the ARR peptides of all five Cle proteins. MST experiments were done as outlined above. The ARR peptide regions fused to His-SUMO are indicated in Figure 1c. Binding was determined to His-SUMO (grey), and to His-SUMO with fused ARR regions of CleB (pink), CleC (light blue), CleD (red) and CleE (dark blue), or with the ARR-CTR region of CleA (dark green). The respective Kd values are indicated. (d) Sequence logo of the alignment generated by Jackhmmer when queried with the ARR region of CleD. Analysis of a representative pool of sequences (see Materials and Methods) identified the tandem motif [YF]XGP[DE][RK]R. The overall height of the stack indicates the sequence conservation at that position, while the height of symbols within the stack indicates the relative frequency of each amino acid at that position. Bits: Information content in bits.
Figure 3—figure supplement 1
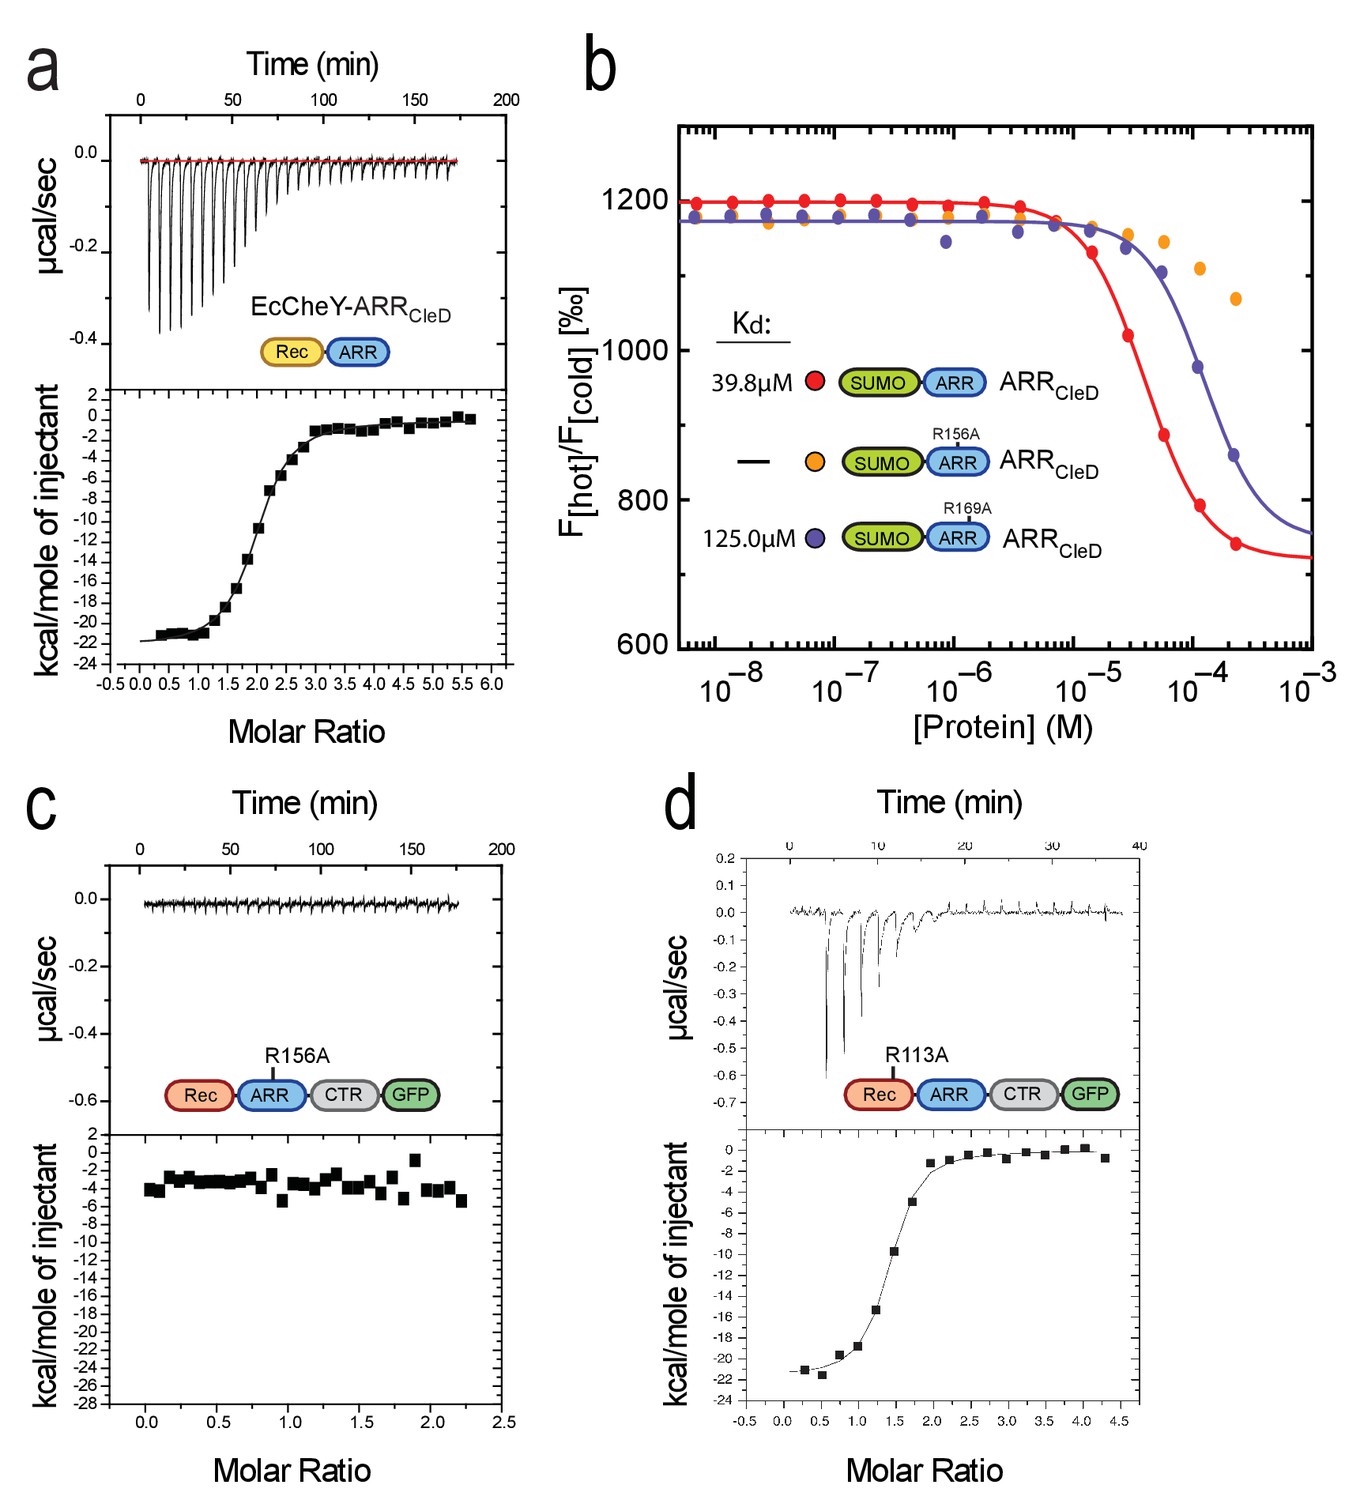
Conservation and distribution of Rec-ARR proteins.
(a) c-di-GMP binds to chimeric EcCheY-ARRCleD. ITC experiment with purified His-EcCheY-ARRCleD. The apparent Kd for c-di-GMP was determined as 150 nM. Experimental details and labels are as in Figure 2b. (b) Arg156 and Arg169 of CleD are involved in c-di-GMP binding. His-SUMO fusions to wild-type (red) or the R156A (orange) and R169A mutant (blue) ARRs of CleD were used in MST experiments. (c) ITC experiment analyzing c-di-GMP binding to the R156A mutant variant of CleD-GFP. Experimental details and labels are as in Figure 2b. (d) ITC experiment analyzing c-di-GMP binding to the R113A mutant variant of CleD-GFP. Experimental details and labels are as in Figure 2b. The Kd for c-di-GMP binding to purified His-CleD_R113A-GFP was calculated to 221 nM.
Figure 3—figure supplement 2
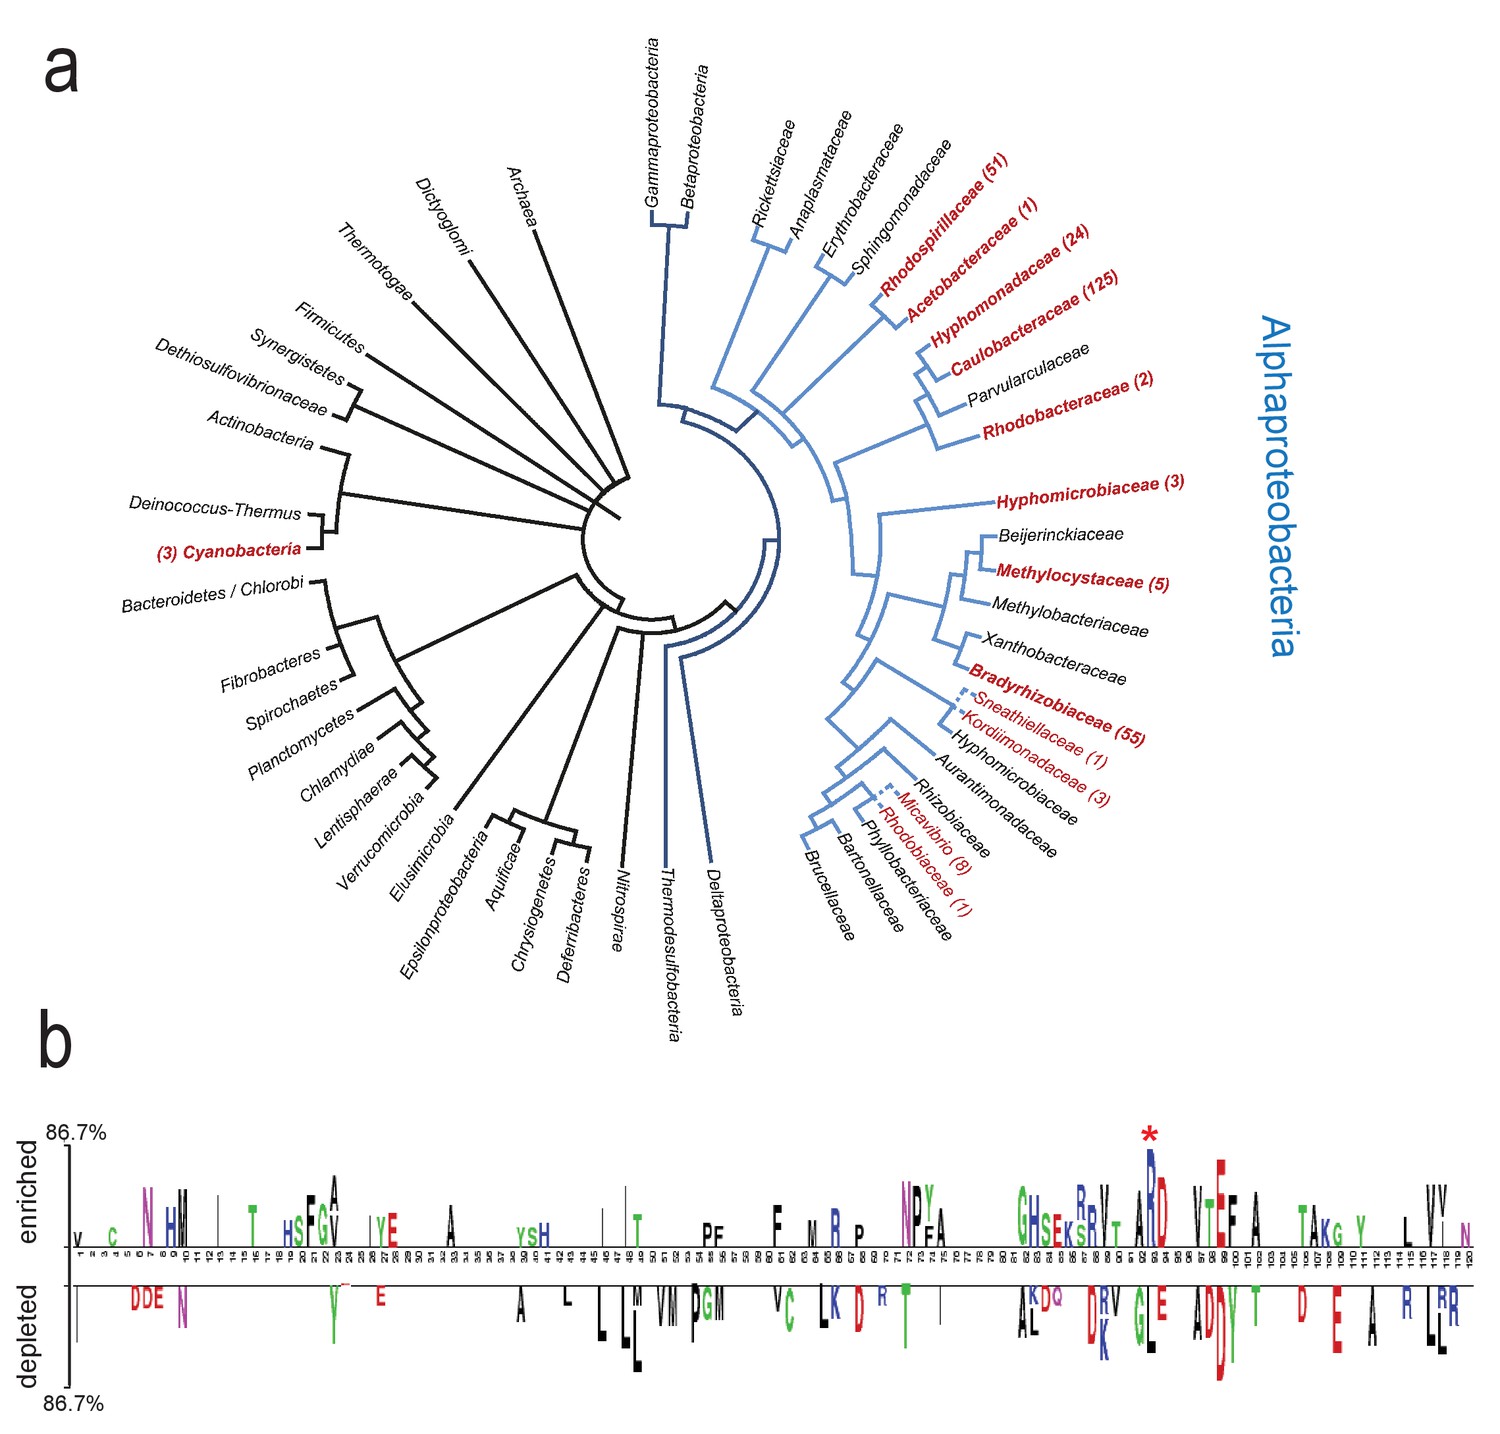
Conservation and distribution of Rec-ARR proteins.
(a) Phylogenetic tree showing ARR occurrences in bacteria and archaea. The simplified tree topology was derived from the genomic tree of life generated with PhyloPhlAn (Segata et al., 2013). Only nodes with Bootstrap values above 60% are shown. Blue branches indicate proteobacteria, light-blue branches delineate alphaproteobacteria. Taxa in red font correspond to taxonomic groups where ARR containing proteins were found (302 in total; Families in red bold font, subfamily taxa in normal red font). Dashed lines indicate branches extrapolated according to 16S rDNA alignments. Numbers correspond to the proteins identified within each taxon. 15 and 5 additional occurrences were detected in unclassified alphaproteobacteria and unclassified bacteria, respectively. (b) Residues of receiver domains correlating with the presence or absence of a C-terminal ARR. The CleD Rec domain (residues 21–141) was used as query. The 136 best blastP hits of rp75 were separated in two groups according to the presence (enriched, top) or absence (depleted, bottom) of the ARR in the corresponding protein sequences. Statistically significant residues are plotted (T test;<0.0001). Only sites covered by more than 50% of the proteins in the alignment were considered here. The size of the symbol is proportional to the difference between the two groups. The most conserved residue in the ARR containing proteins is marked with an asterisk and corresponds to R113 in CleD and R111 in CleA.
Figure 4 with 2 supplements
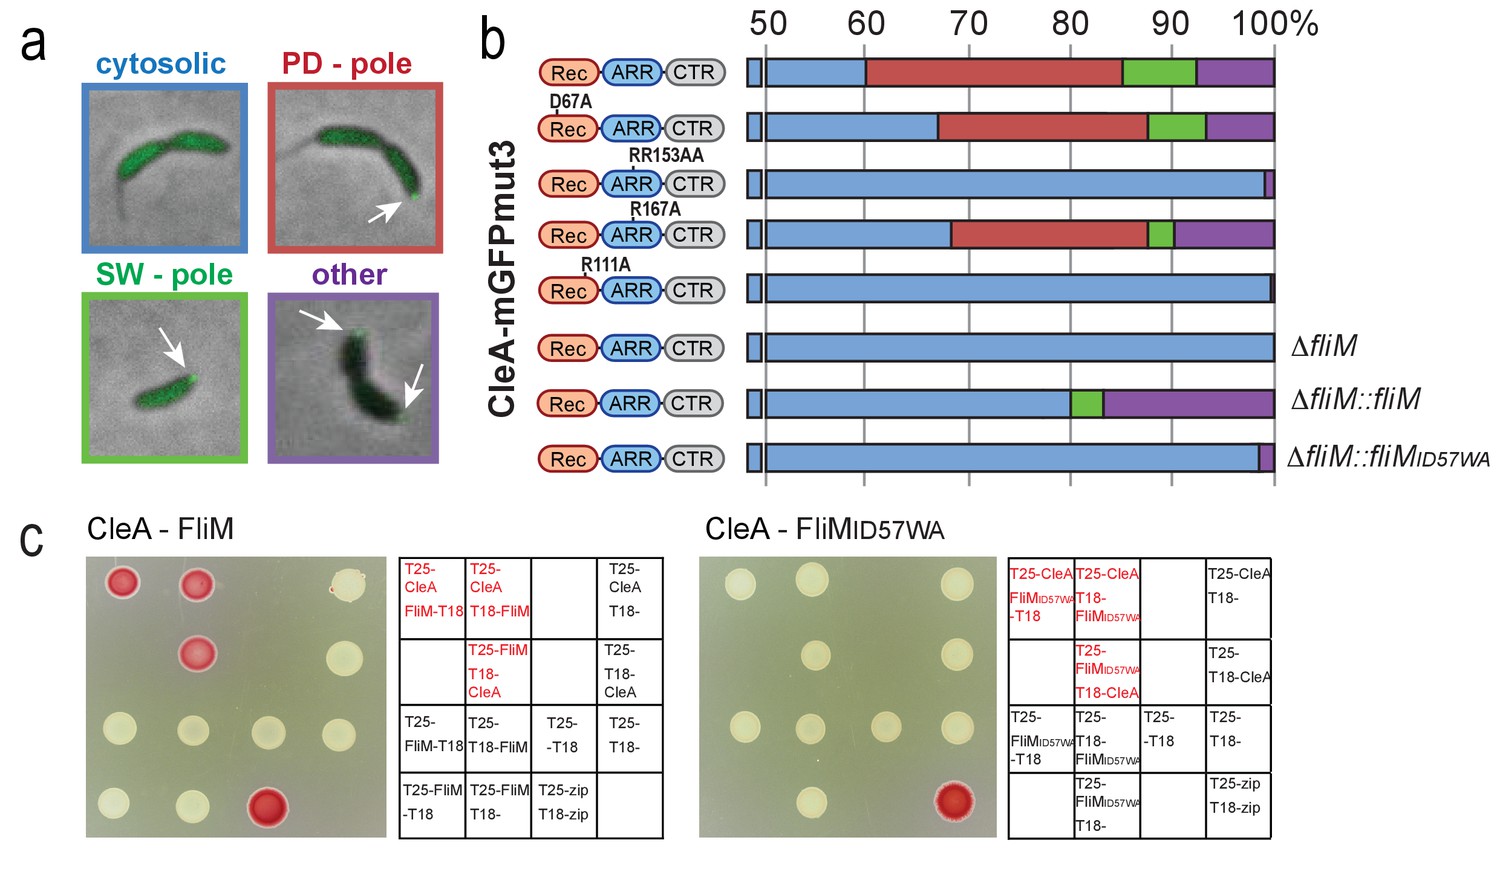
CleA localizes to the flagellated cell pole to interact with FliM.
Examples of the subcellular localization of CleA-mGFPmut3 are shown in (a) and quantified as shown in (b). Variants of CleA fused to mGFPmut3 are indicated on the left with the three domains highlighted as in Figures 2 and 3. Individual amino acid substitutions are indicated. CleA fusion proteins were expressed in a ΔcleA deletion strain and additional genetic alterations as indicated on the right of each panel. Cells were classified according to the localization patterns shown in (a): delocalized cytosolic (blue); foci at flagellated pole of PD cells (red); polar foci in small SW cells (green); other localization patterns (purple), including PD cells with foci at both poles, PD cells with foci at stalked pole, cells with no GFP signal. Number of cells analyzed (top to bottom): 3452, 1450, 637, 2357, 2603, 795, 1148, 1347. (c) CleA interacts with the FliM flagellar switch protein. Binding of CleA to the N-terminus of FliM was determined by bacterial two-hybrid analysis. Fusion proteins between the T25 and T18 fragments of adenylate cyclase (Karimova et al., 1998) and the N-terminal peptide of FliM or FliM_ID57WA (aa 2–65), or full-length CleA were constructed and expressed in the E. coli cya mutant strain AB1770. Strains harboring combinations of FliM and CleA fusions were spotted on McConkey agar plates to score for interaction. Red color indicates reporter gene expression from a cAMP-dependent promoter. The spotting order is indicated in the grids on the right. A positive control with the adenylate cyclase fragments fused to the leucine zipper region of the yeast GCN4 protein (zip) is shown (lower right spots).
Figure 4—figure supplement 1
CleD localizes to the flagellated cell pole to interact with FliM.
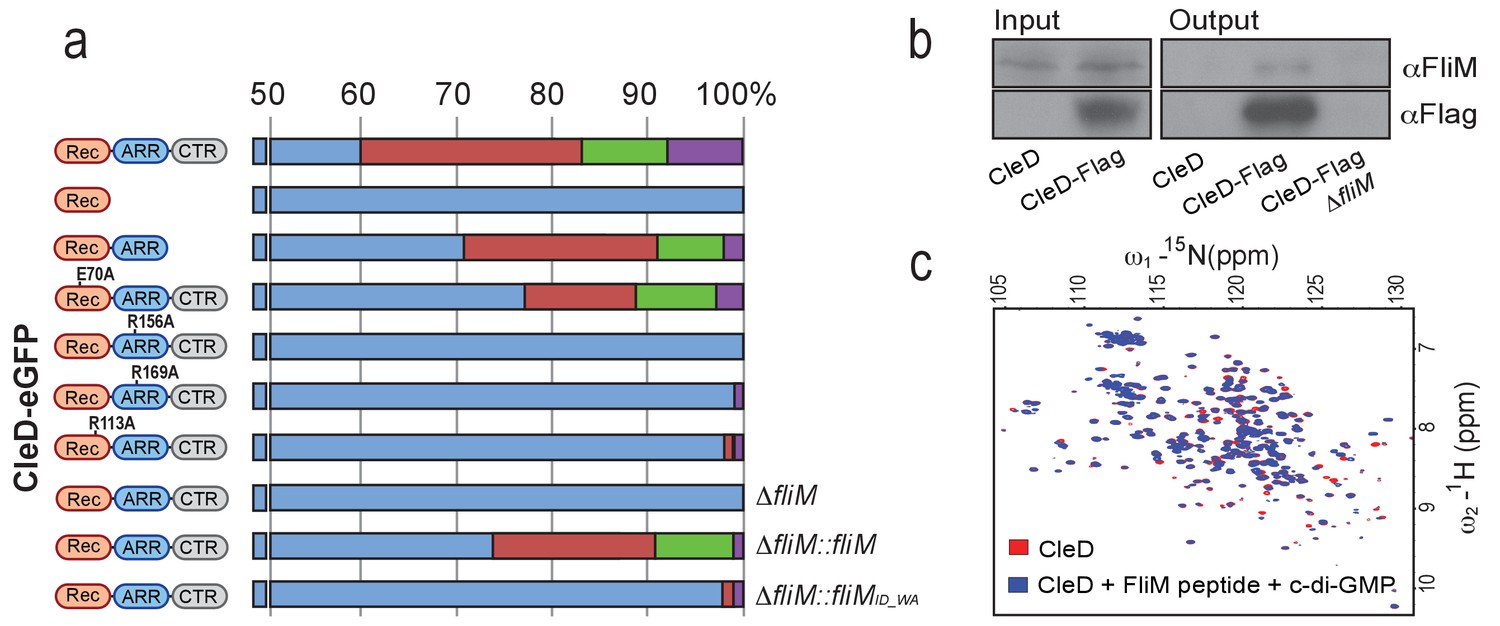
(a) Localization of CleD-eGFP wild type and mutant variants. Individual amino acid substitutions are indicated. CleD fusion proteins were expressed in a ΔcleD deletion strain and additional genetic alterations as indicated on the right of each panel. Cells were classified according to the localization patterns shown in Figure 4a: delocalized cytosolic (blue); foci at flagellated pole of PD cells (red); polar foci in small SW cells (green); other localization patterns (purple), including PD cells with foci at both poles, PD cells with foci at stalked pole, cells with no GFP signal. Number of cells analyzed (top to bottom): 226,>200, 287, 2194,>200,>200, 645,>200, 981, 709. (b) CleD interacts with the FliM flagellar switch protein. Pull-down experiments were carried out with a strain expressing a Flag-tagged copy of CleD. Anti-Flag antibodies were used for co-immunoprecipitation with cell extracts (input) and precipitated fractions (output) being analyzed by immunoblots with anti-Flag and anti-FliM antibodies as indicated. Extracts of C. crescentus wild-type or a ΔfliM mutant were used as indicated. The experiment was repeated three times with a representative example shown. (c) Direct interaction of CleD with a peptide spanning FliM residues 47–62. The 1H-15N HSQC spectra of the CleD (red) and CleD in complex with the FliM peptide (blue) are shown. The spectrum of CleD with c-di-GMP and the FliM_ID57WA mutant peptide or with CleD and the wild-type FliM peptide without c-di-GMP was indistinguishable from the spectrum recorded for CleD alone.
Figure 4—figure supplement 2

The conserved CheY binding site of the C. crescentus FliM switch protein is required for motor reversal.
(a) Alignments of the α4-β5-α5 region of E. coli CheY and C. crescentus CleA and CleD (top) and of the N-terminal peptides of E. coli and C. crescentus FliM (bottom). Residues shown to be important for the interaction between FliM and CheY in E. coli are highlighted in yellow. Conserved FliM residues that were mutated in this study to break the interaction between C. crescentus FliM and CheY or Cle are marked by asterisks. (b) Crystal structure of E. coli CheY (green) interacting with the N-terminal helix of FliM (orange) (PDB 1F4V). (c) Reversal frequencies of C. crescentus wild type and of a ΔfliM deletion strain expressing a fliM wild-type allele (red) or the fliM_ID57WA mutant (green) from plasmid pSRK-Km. The distributions were calculated from more than 850 cells (WT = 6719 cells;DfliM pSRK-FliM = 887 cells;DfliM pSRK-FliM_ID57WA = 936 cells) combined from multiple independent experiments. Experiments were repeated twice except for WT, which was repeated seven times.
Figure 5 with 1 supplement
CleA tunes the flagellar motor by interfering with the chemotaxis response.
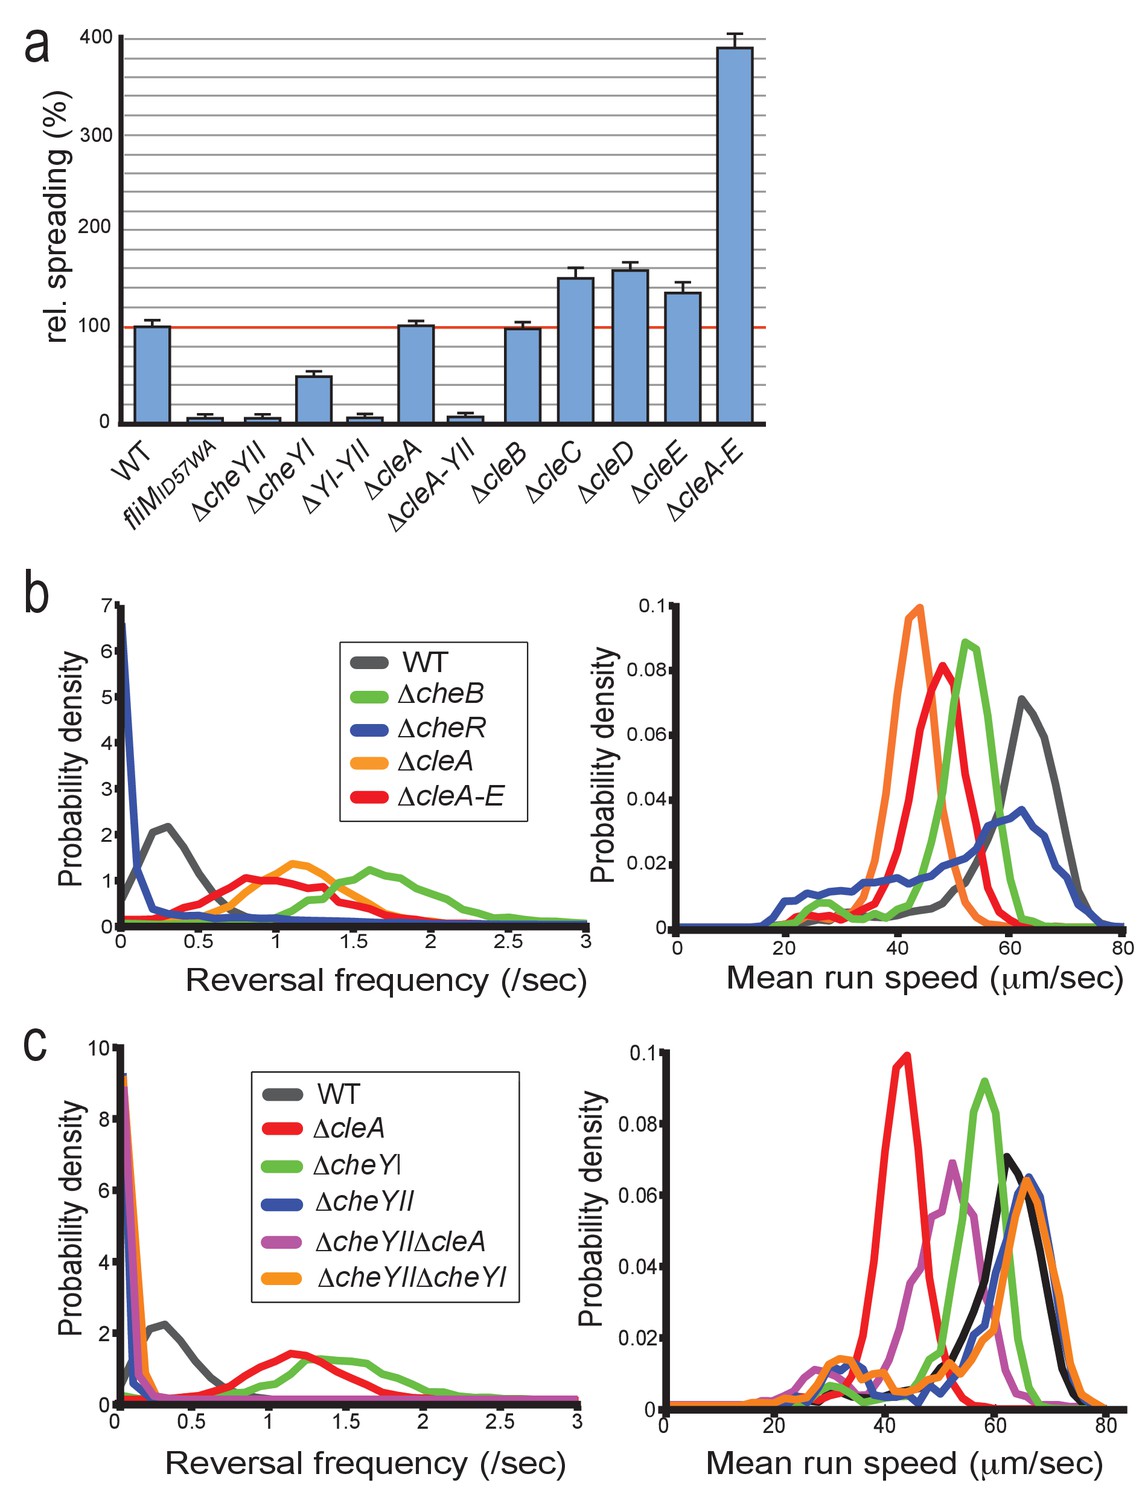
(a) Cle proteins impede spreading on semisolid agar. Relative spreading areas of C. crescentus wild type and fliM, cheY and cle mutants are indicated. Strains were incubated at 30°C and motility was scored after 72 hr as the overall area covered by individual strains. Strains containing single or multiple deletions are indicated. (b) Mutants lacking CleA show a hyper-reversal phenotype. Directional reversal frequencies and mean run speed were measured for individual swimming cells of C. crescentus wild type and mutants lacking CheB, CheR, CleA, or all five Cle proteins. All strains analyzed harbored an additional deletion in the pilA gene to avoid pili-mediated motility variations. Cells were located in a pseudo-2D environment and their swimming trajectories were recorded at 16 frames per second. The fraction of cells with a given reversal frequency (left) or mean run speed (right) is indicated. (c) CleA promotes smooth swimming by antagonizing the major C. crescentus CheY, CheYII. Analysis of reversal frequencies and mean speed of the strains indicated was as in (b). It should be noted that the reversal frequency profiles of strains ΔcheYII, DcheYIIΔcleA and ΔcheYIIΔcheYI overlay. Experiments in (b) and (c) include the analysis of >850 cells for each strain.
Figure 5—figure supplement 1
Reversal frequencies and speed of C. crescentus mutants lacking specific CheY and Cle components.
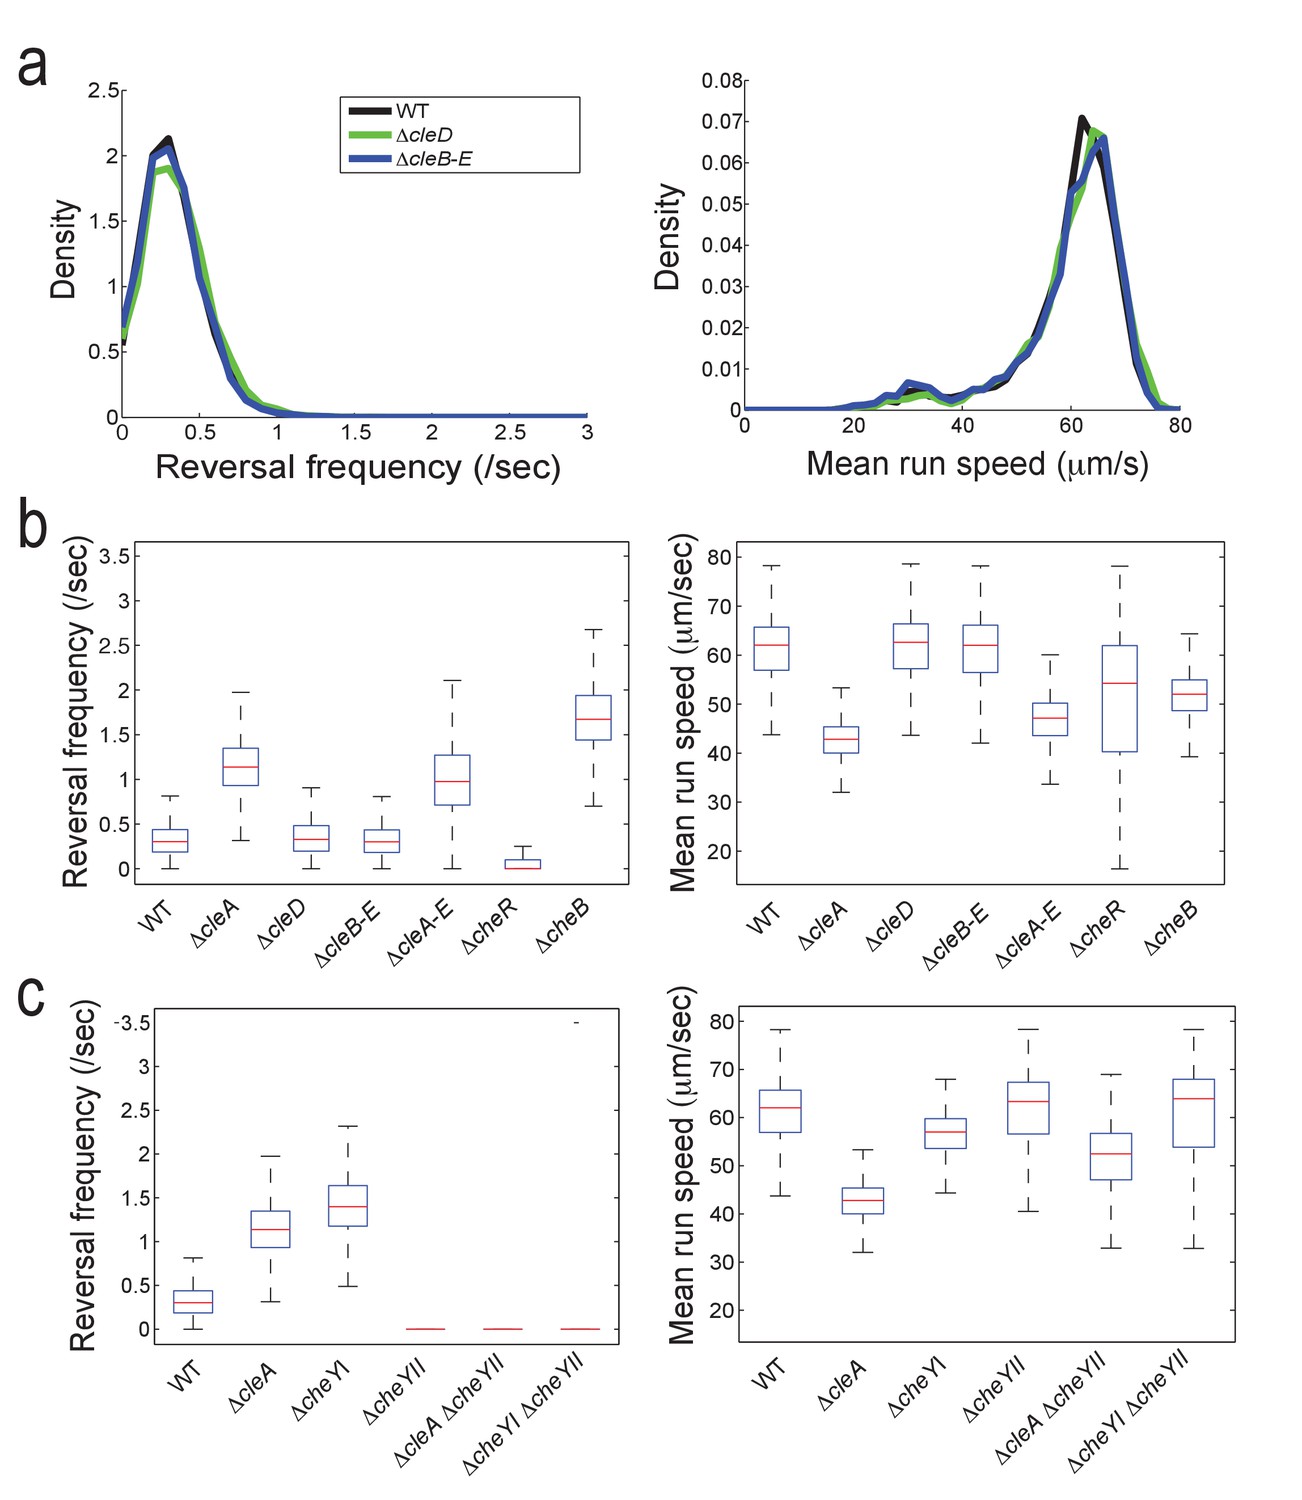
(a) Reversal frequencies (left) and mean run speeds (right) were determined as indicated in the legend to Figure 5b. Strains lacking CleD (ΔcleD) or CleB, CleC, CleD and CleE (ΔcleB-E) showed wild-type like reversal frequencies and speed. (b) Reversal frequencies and speed in cle mutants and mutants lacking all C. crescentus CheR methyltransferases or CheB methylesterases. Median (red bars) reversal frequencies and speeds are from trajectories of more than 2000 cells (WT = 6719 cells; ΔcleA = 4602 cells; ΔcleD = 3134 cells; ΔcleB-E = 2532 cells; ΔcleA-E = 3757 cells; ΔcheR = 5042 cells; ΔcheB = 2392 cells) combined from multiple independent experiments. Number of replicates is seven, five, four, two, four, three, and two, respectively. The edges of the box indicate 25th and 75th percentiles of the data set. (c) Functional interaction of CleA and CheYII. Reversal frequencies and speed were measured in the mutants indicated. Data are from more than 1000 cells (WT = 6719 cells; ΔcleA = 4602 cells; ΔcheYI = 2205 cells; ΔcheYII = 1347 cells; ΔcleAΔcheYII = 1762 cells; ΔcheYIΔcheYII = 1375 cells) combined from multiple independent experiments. Experiments were repeated twice except for WT and ΔcleA, which were repeated seven and five times, respectively. All strains harbored a deletion in pilA encoding the major pilin subunit.
Figure 6
Role of Cle proteins in C. crescentus surface attachment.
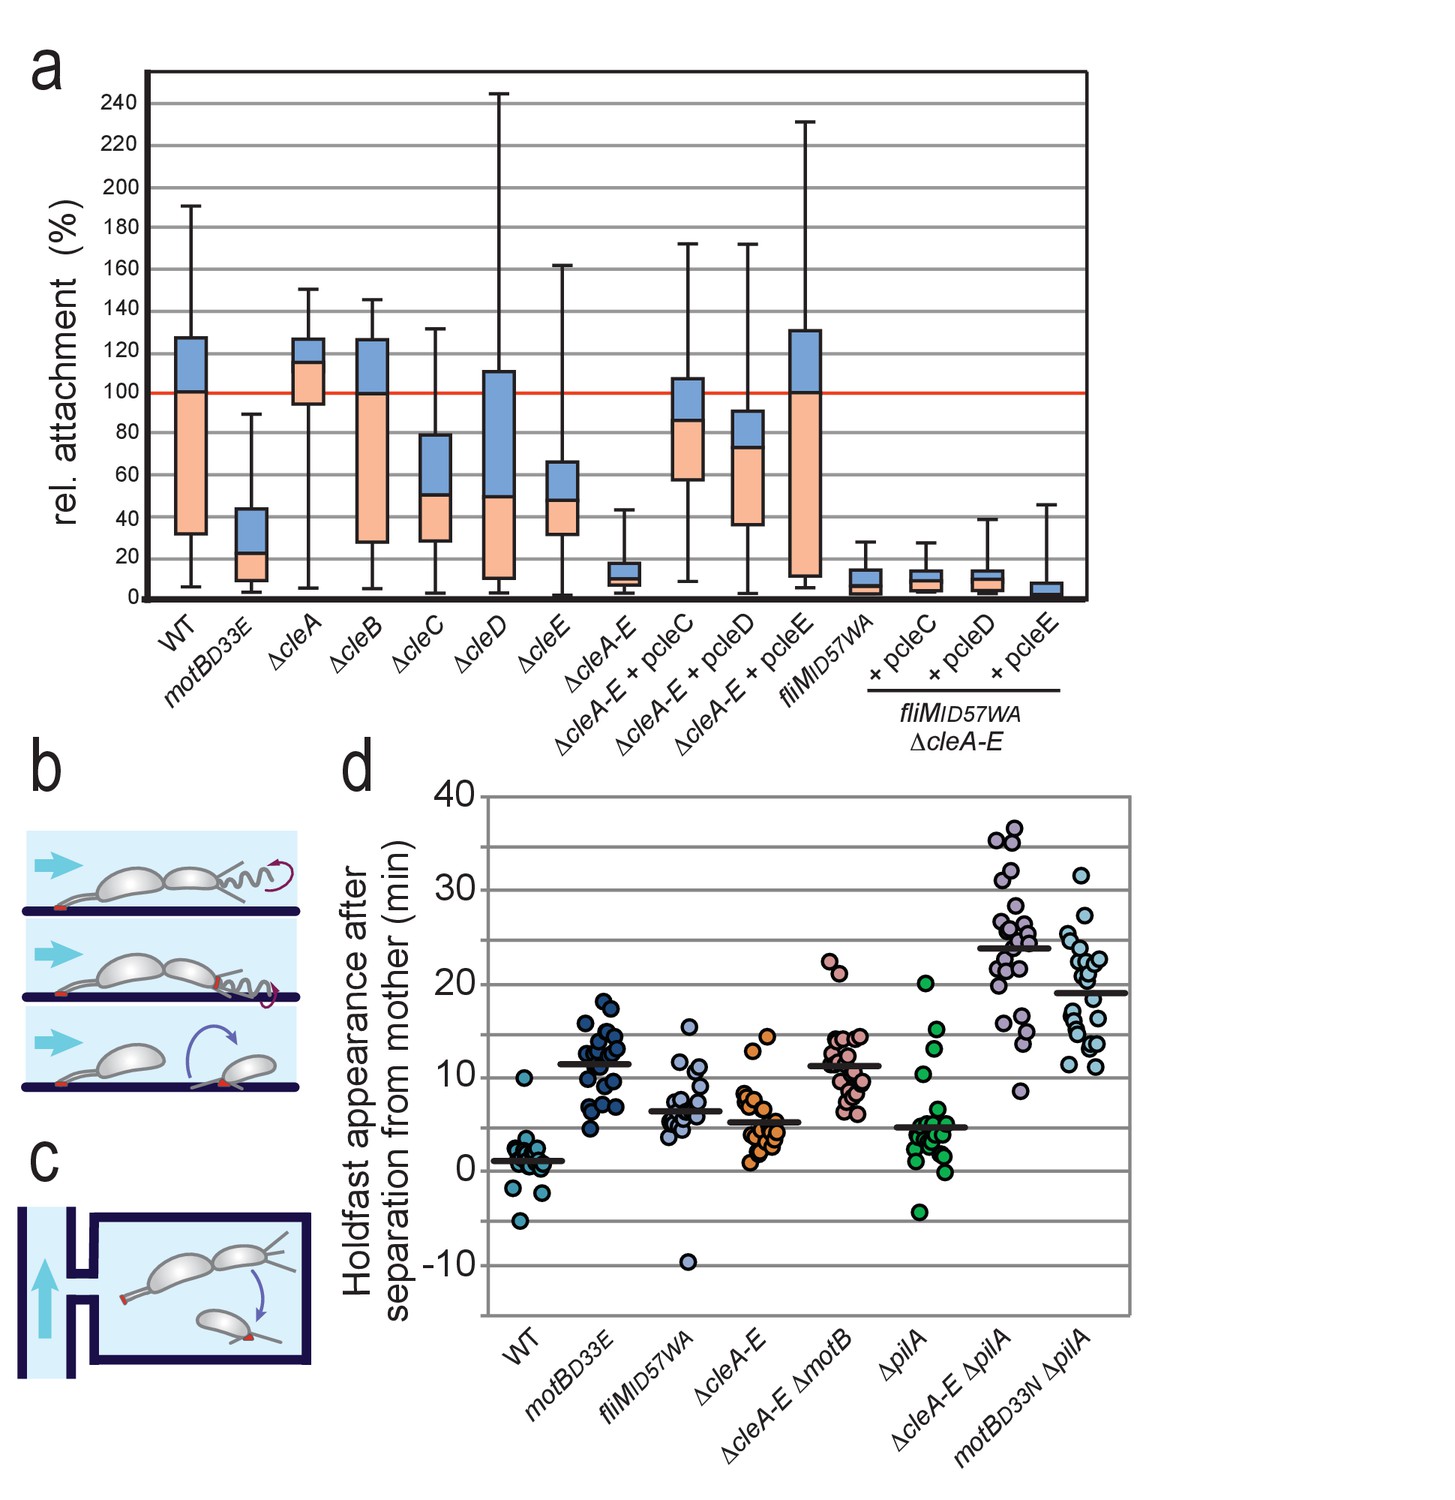
(a) Cle proteins promote rapid surface attachment under flow. C. crescentus wild-type and mutant strains were assayed as indicated in (b). The efficiency of rapid surface attachment of newborn SW progeny was determined as the relative area covered by microcolonies emerging from a single mother cell after 15 hr incubation. Box plots mark the median (horizontal black lines), the lower and upper quartiles (red and blue boxes) and the extreme values (whiskers). P values obtained with a 2-tailed T-test were < 0.05 for ΔcleC and ΔcleE, whereas the ΔcleA,ΔcleB and ΔcleD mutants were statistically not significant. (b) Experimental setup for microfluidics experiments shown in (a). The direction of medium flow in the microfluidic channels is indicated by blue arrows. The position of holdfast (red), pili and flagella are indicated. Newborn wild type SW cells are able to sense surface exposure and rapidly synthesize a holdfast before cell separation and remain attached downstream of their mother cells (Hug et al., 2017). (c) Experimental setup for experiments shown in (d). Dividing C. crescentus cells were trapped in narrow quasi-2D chambers that offer immediate surface contact in the absence of flow. Holdfast was visualized using Oregon-green labeled wheat germ agglutinin lectin. Time-lapse imaging at four frames per minute allowed the determination of the time elapsed from separation of individual SW cells and the first detection of their newly secreted holdfast (Hug et al., 2017). (d) Timing of holdfast appearance after separation from mother cells. Dots represent individual cells of C. crescentus wild type and mutants as indicated. Horizontal black lines mark the average values. Values for ΔcleA-E and fliMID57WA mutants were significantly different from both WT and motBD33N with P values with a 2-tailed T-test < 0.01.
Figure 7 with 1 supplement
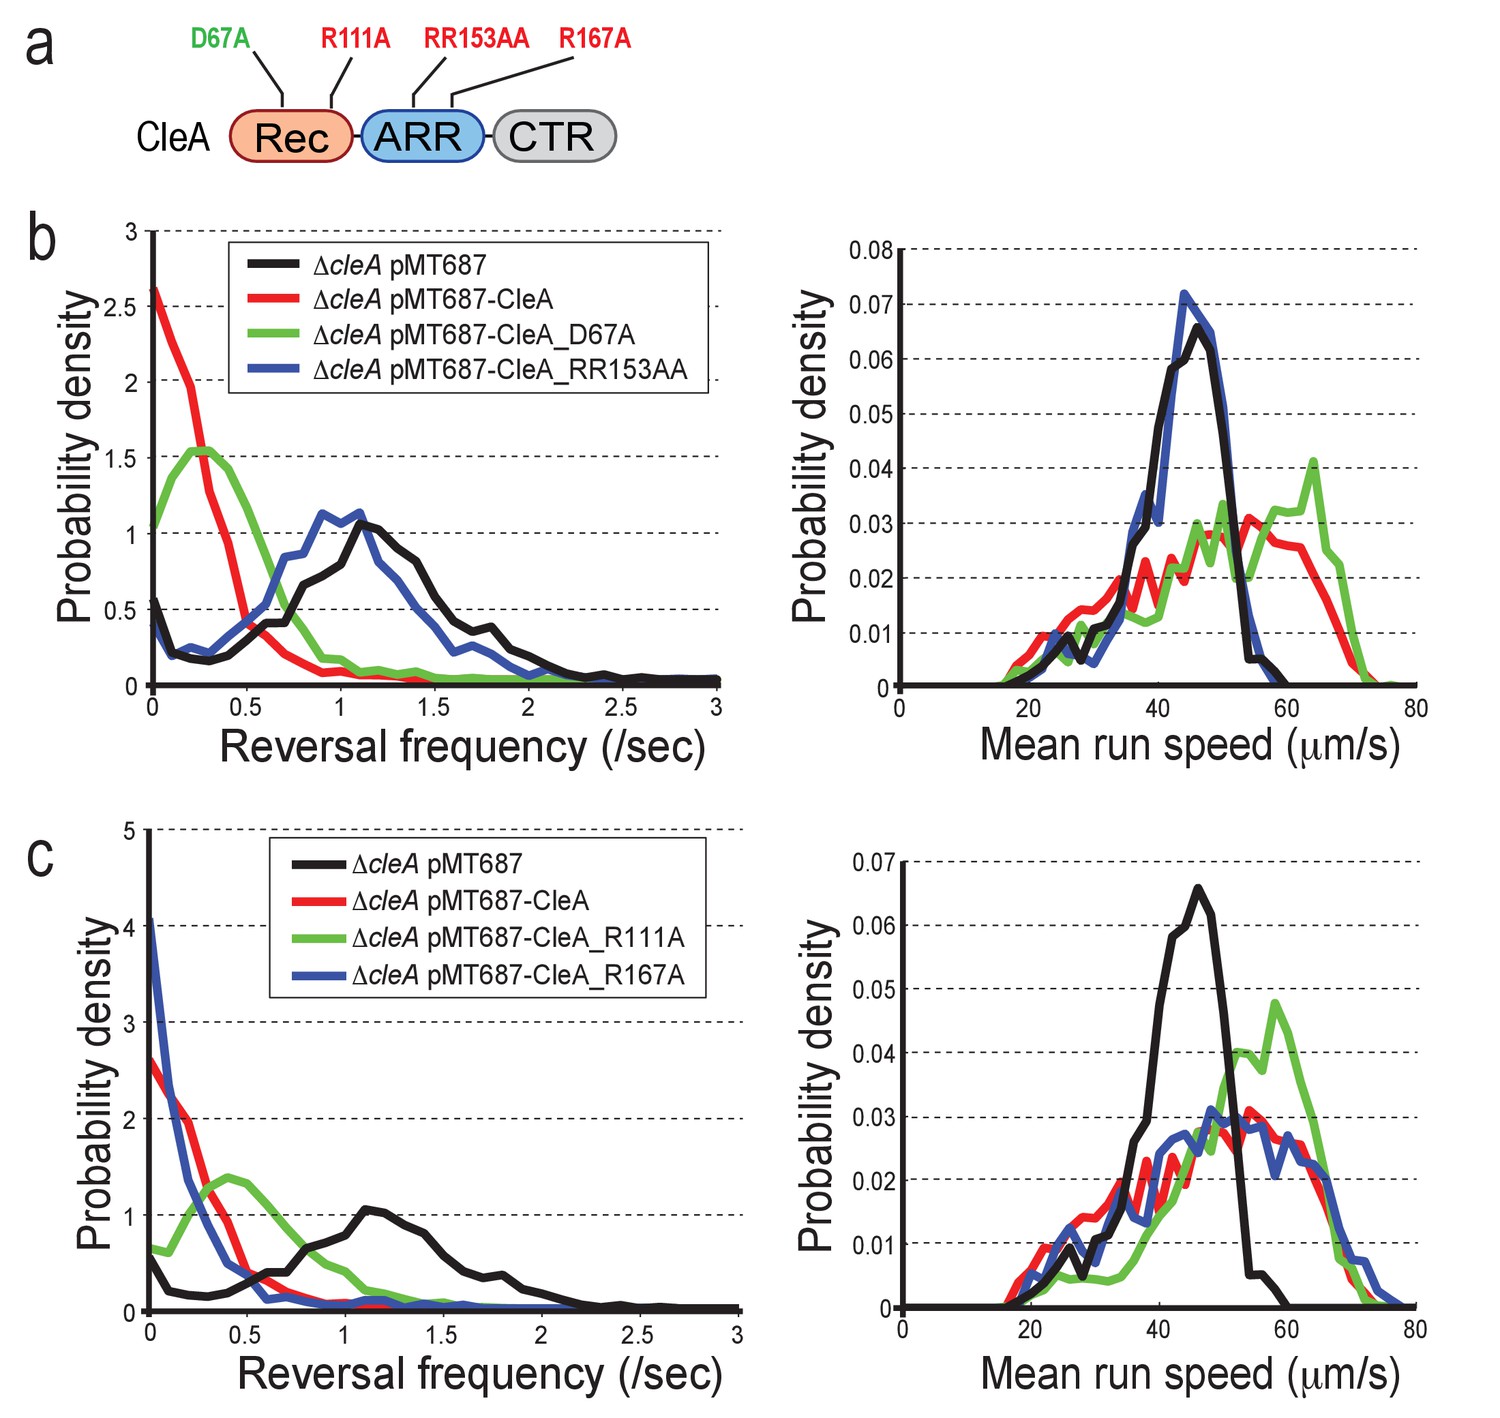
CleA is activated by c-di-GMP binding but not phosphorylation.
(a) Schematic of the domain structure of CleA with mutations that interfere with potential phosphorylation control (green) or c-di-GMP binding (red). The domains are labeled as in Figures 2, 3 and 4. (b-c) CleA is activated by c-di-GMP binding. Single cell analysis of reversal frequencies and mean speed of C. crescentus wild type andΔcleA mutants harboring plasmid driven cleA alleles as indicated in (a). cleA alleles were expressed from a xylose-dependent promoter and were induced with 0.1% xylose for 3 hr before imaging. Experiments in (b) and (c) include the analysis of >850 cells for each strain.
Figure 7—figure supplement 1
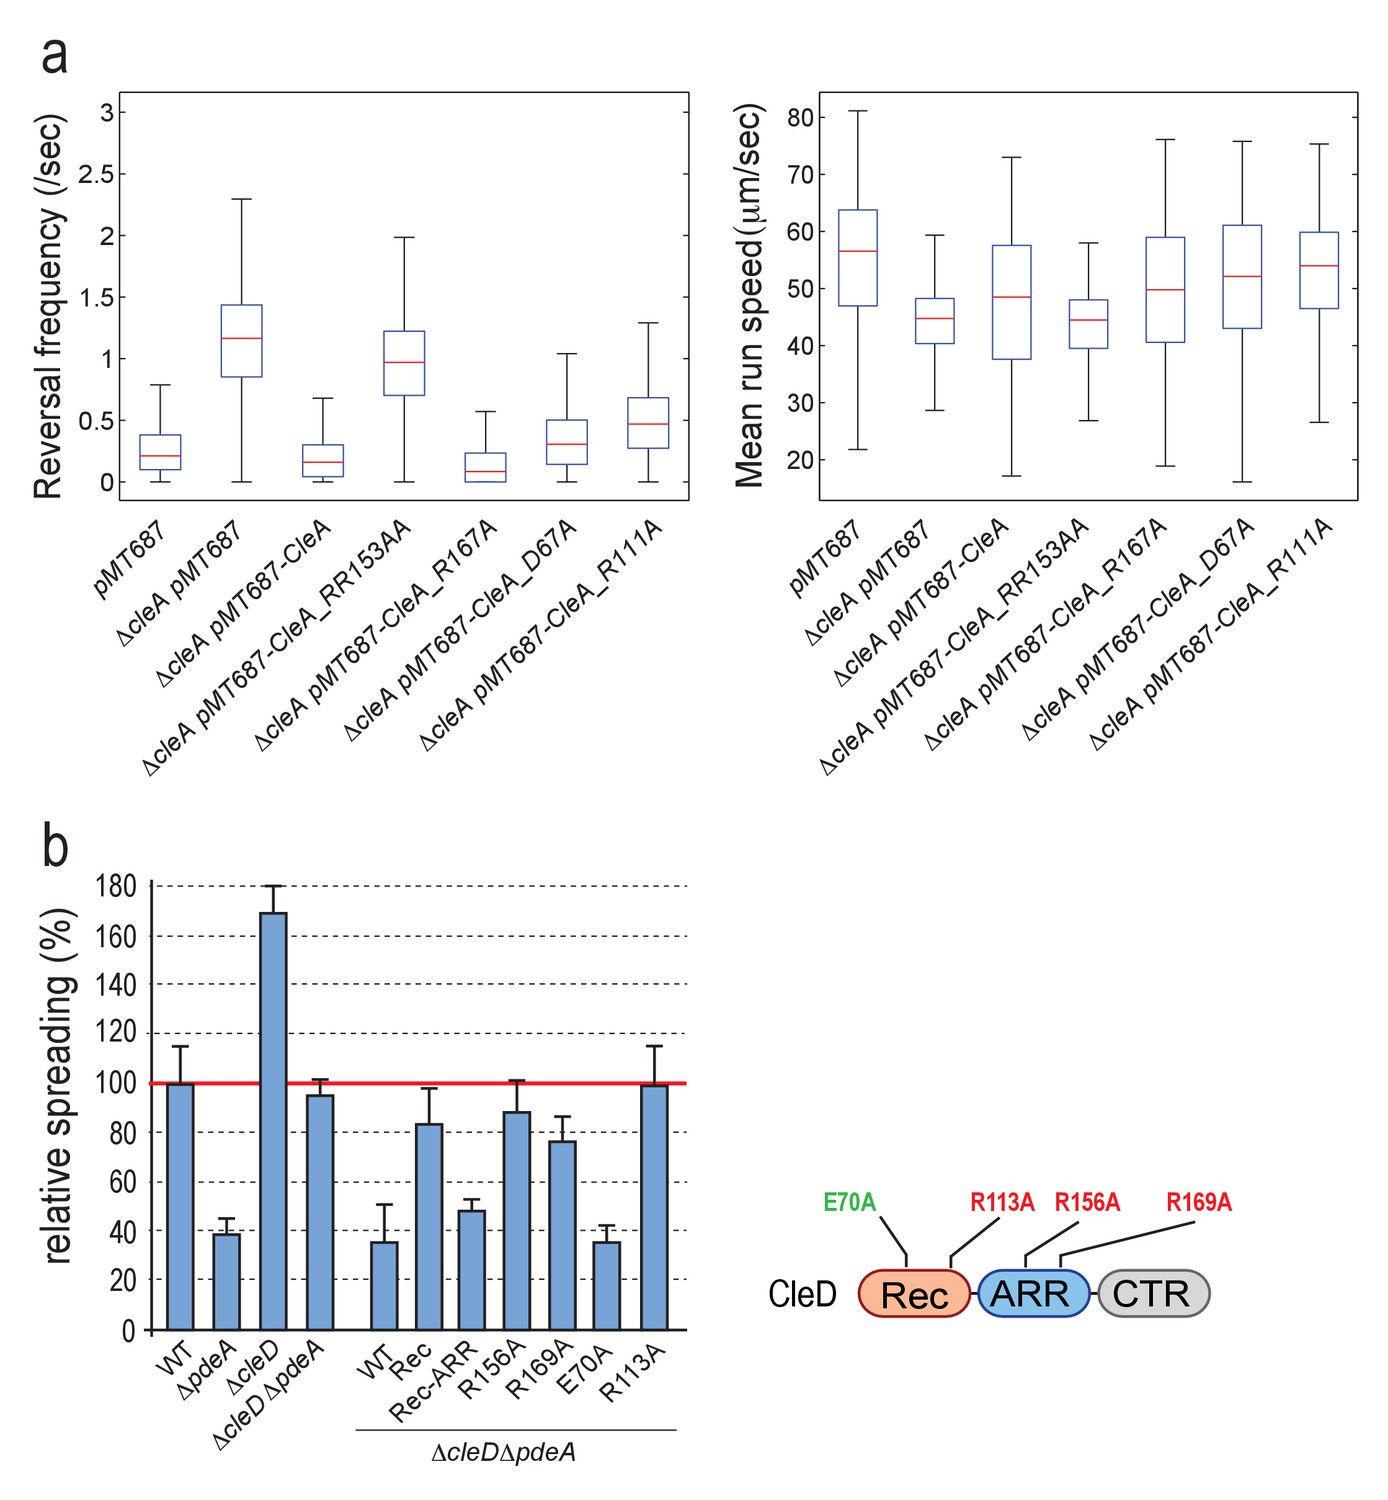
CleA and CleD are activated by c-di-GMP binding but not phosphorylation.
(a) Functionality of CleA variants. Analysis of reversal frequencies and mean speed of strains harboring different cleA alleles. Box plots are as in Figure 5—figure supplement 1b,c. All strains harbored a deletion in pilA encoding the major pilin subunit. Median reversal frequencies and speeds are from trajectories of over 950 cells (pMT687 (WT) = 1139 cells; ΔcleA pMT687 = 1486 cells; ΔcleA pMT687-CleA = 1158 cells; ΔcleA pMT687-CleA_RR153AA = 1134 cells; ΔcleA pMT687-CleA_R167A = 967 cells; ΔcleA pMT687-CleA_D67A = 1095 cells; ΔcleA pMT687-CleA_R111A = 1848 cells) combined from two independent experiments. (b) CleD is activated by c-di-GMP binding. Spreading in semisolid agar plates was analyzed as described in the legend of Figure 5a. Strains analyzed are indicated below the graph. Different cleD alleles were expressed from a plasmid-born xylose-dependent promoter in aΔcleDΔpdeA background as indicated. The schematic on the right indicates the position of cleD mutations interfering with potential phosphorylation control (green) or c-di-GMP binding (red). The data include five biological replicates. Bars are average spreading areas with standard deviations indicated.
Videos
Video 1
NA1000 ΔpilA tethered on cover slips.
https://doi.org/10.7554/eLife.28842.015
Video 2
Movie of NA1000 ΔpilA ΔcleA deletion mutant tethered on cover slips.
https://doi.org/10.7554/eLife.28842.016Tables
Table 1
CheY-like response regulators identified by CCMS.
https://doi.org/10.7554/eLife.28842.004| Protein name | ID | CCMS experiment/CCMS competition* | |||
|---|---|---|---|---|---|
| #spectral counts of identified peptides | |||||
| Experiment† | 1 | 2 | 3 | 4 | |
| CleB | CC1364 | 2/0 | 3/0 | 1/0 | 1/0 |
| CleC | CC2249 | 2/0 | 5/0 | 3/0 | 4/2 |
| CleD | CC3100 | 2/0 | 4/0 | 6/0 | 4/0 |
-
*All competition experiments were performed in the presence of 1 mM c-di-GMP.
†Experiment 1 was performed with 10 µM cdG-CC, experiment 2 with 10 µM cdG-CC, experiment 3 with 5 µM cdG-CC, and experiment 4 with 2.5 µM cdG-CC.
Additional files
-
Supplementary file 1
(A) Strains used in this study. (B) Plasmids used in this study. (C) Oligonucleotids used in this study.
- https://doi.org/10.7554/eLife.28842.020
-
Transparent reporting form
- https://doi.org/10.7554/eLife.28842.021
Download links
A two-part list of links to download the article, or parts of the article, in various formats.
Downloads (link to download the article as PDF)
Open citations (links to open the citations from this article in various online reference manager services)
Cite this article (links to download the citations from this article in formats compatible with various reference manager tools)
Cyclic di-GMP differentially tunes a bacterial flagellar motor through a novel class of CheY-like regulators
eLife 6:e28842.
https://doi.org/10.7554/eLife.28842


