High lumenal chloride in the lysosome is critical for lysosome function
- University of Chicago, United States
- Grossman Institute of Neuroscience, Quantitative Biology and Human Behavior, University of Chicago, United States
Figures
Figure 1 with 3 supplements
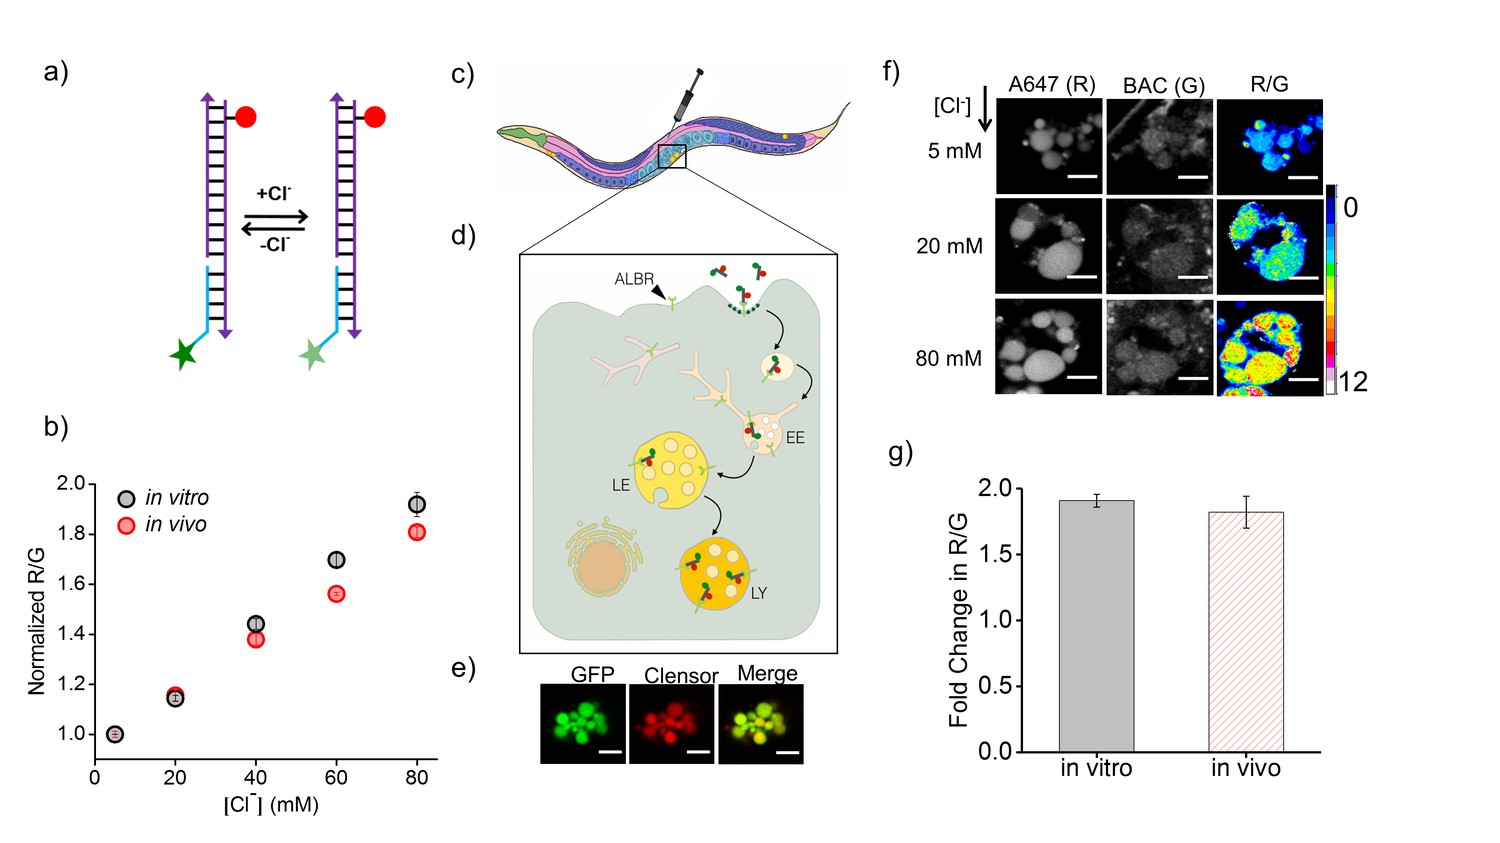
Clensor recapitulates its chloride sensing characteristics in vivo.
(a) Schematic of the ratiometric, fluorescent chloride (Clˉ) reporter Clensor. It bears a Clˉ sensitive fluorophore, BAC (green star) and a Clˉ insensitive fluorophore, Alexa 647 (red circle) (b) Calibration profile of Clensor in vitro (grey) and in vivo (red) given by normalized Alexa 647 (R) and BAC (G) intensity ratios versus [Cl-]. (c) Receptor mediated endocytic uptake of Clensor in coelomocytes post injection in C. elegans. (d) Clensor is trafficked by the anionic ligand binding receptor (ALBR) from the early endosome (EE) to the late endosome (LE) and then lysosome (LY). (e) Colocalization of ClensorA647 (red channel) microinjected in the pseudocoelom with GFP-labeled coelomocytes (green channel). Scale bar: 5 μm. (f) Representative fluorescence images of endosomes in coelomocytes labeled with Clensor and clamped at the indicated Clˉ concentrations ([Cl-]). Images are acquired in the Alexa 647 (R) and BAC (G) channels from which corresponding pseudocolored R/G images are generated. The in vivo calibration profile is shown in (b). Scale bar: 5 µm. Error bars indicate s.e.m. (n = 15 cells,≥50 endosomes) (g) In vitro (grey) and in vivo (red) fold change in R/G ratios of Clensor from 5 mM to 80 mM [Clˉ].
Figure 1—figure supplement 1
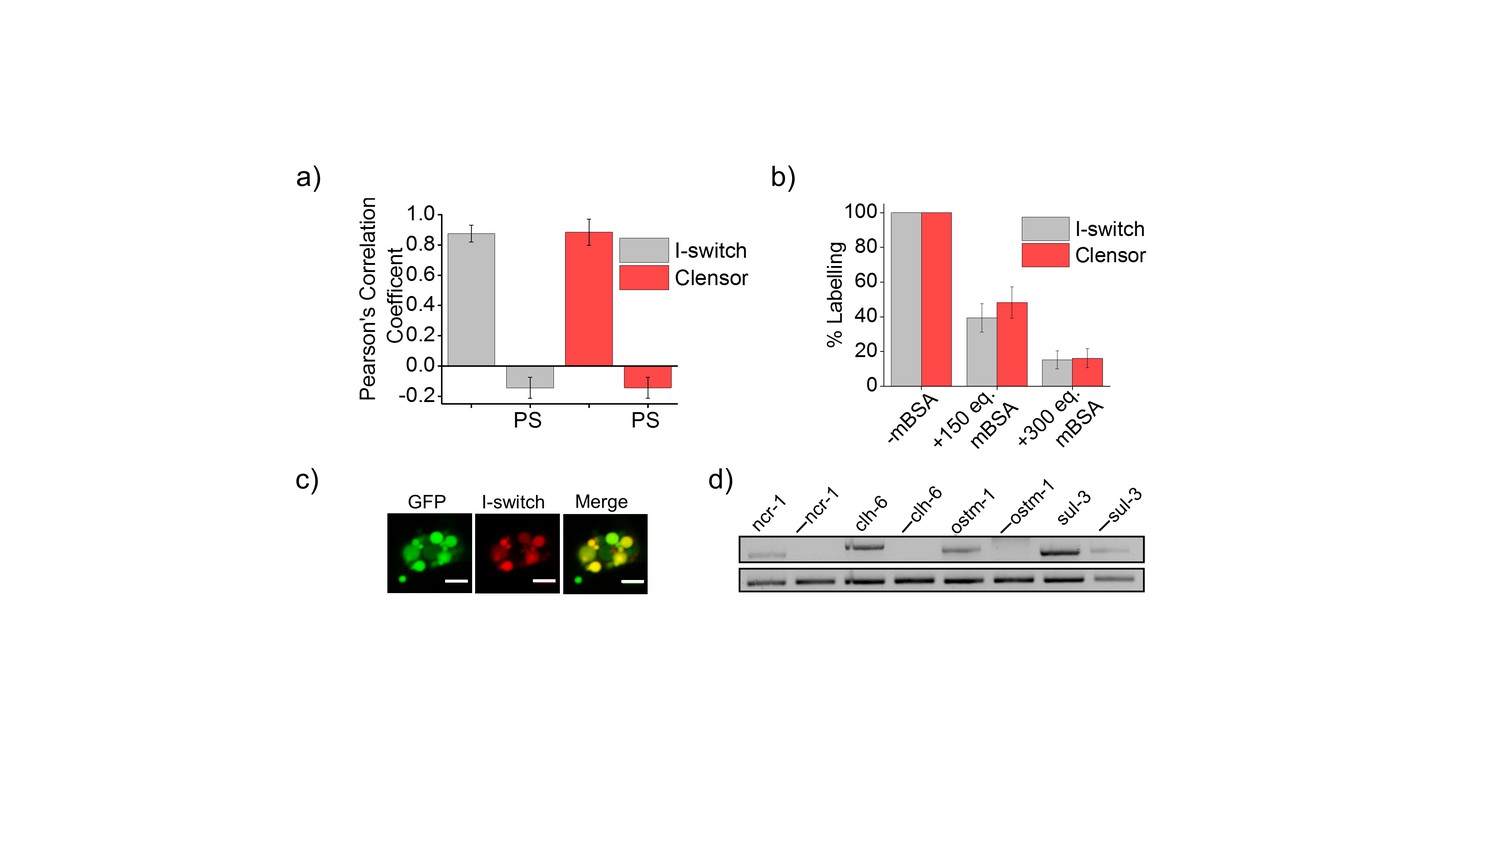
(a) Quantification of co-localization between DNA nanodevices and GFP in arIs37 worms.
Mean of n = 10 cells. (b) Coelomocyte labeling efficiency with I-switch (I4A647, grey) and ClensorA647 (red) in the absence (-mBSA) or presence of 150 or 300 equivalents excess of maleylated bovine serum albumin (mBSA). Error bars indicate s.e.m. (n = 10 worms) (c) Images showing colocalization of I-switch (red) 1 hr post injection in the pseudocoelom of arIs37 [pmyo-3::ssGFP] worms (green). Scale bar: 5 μm. (d) RT-PCR analysis of total RNA isolated from C. elegans pre- and post- RNAi. Lanes correspond to PCR-amplified cDNA of the indicated gene product isolated from wild type without RNAi treatment (denoted by gene name) and the corresponding dsRNA-fed worms (denoted as. ‘— ncr-1’, ‘— chl-6’ etc).
Figure 1—figure supplement 2
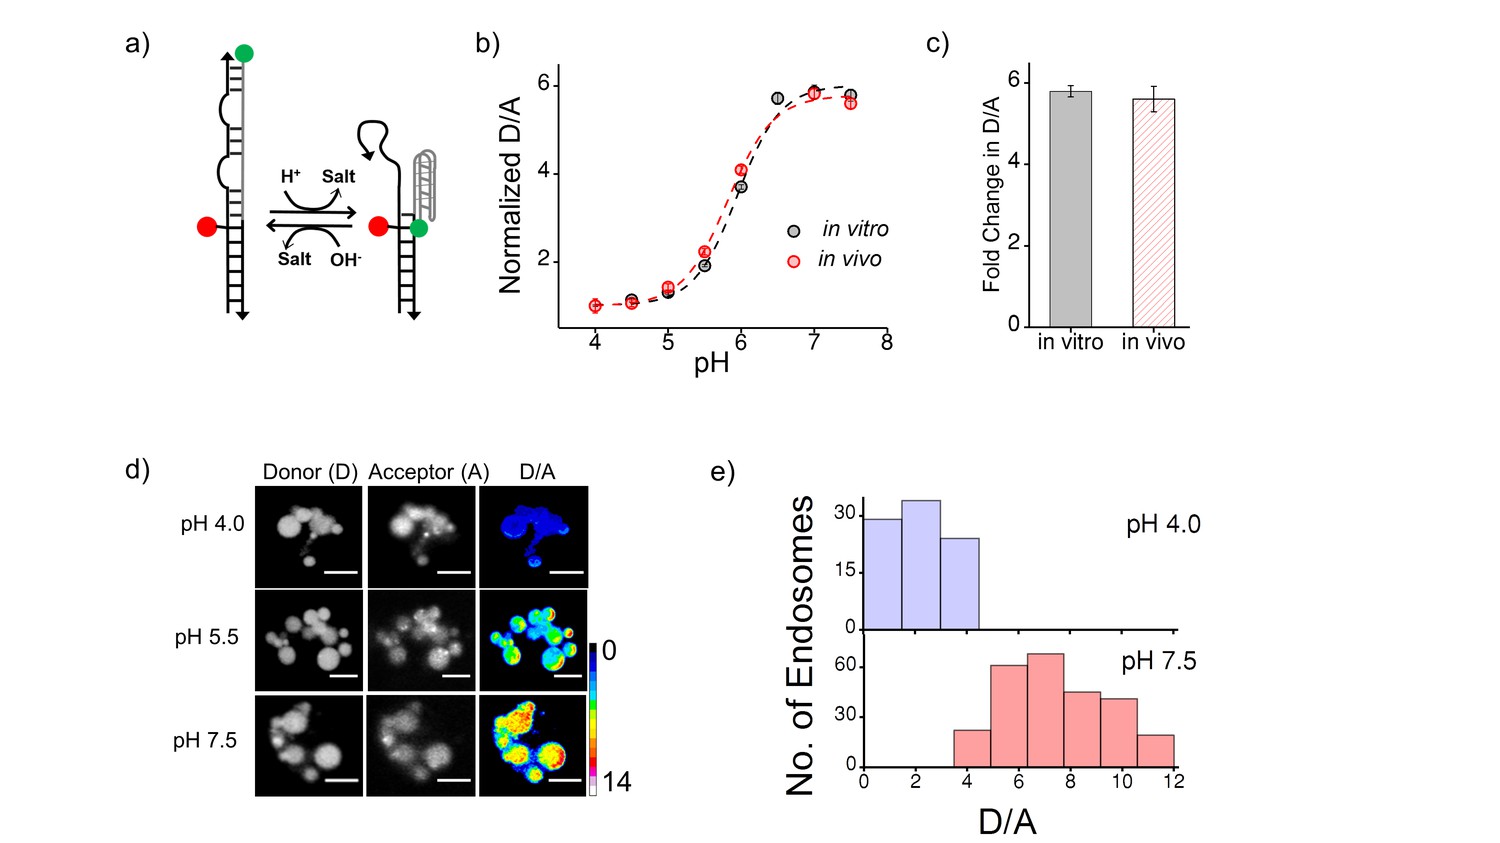
(a) Schematic of a DNA nanodevice, I-switch, that functions as a fluorescent pH reporter based on a pH triggered conformational change that is transduced to photonic changes driven by differential fluorescent resonance energy transfer between donor (D, green) and acceptor (A, red) fluorophores (b) pH calibration curve of I4cLYA488/A647 in vivo (red) and in vitro (grey) showing normalized D/A ratios versus pH.
Error bars indicate s.e.m. (n = 15 cells, ≥60 endosomes) (c) in vitro (grey) and in vivo (red) fold change in D/A ratios of I4cLYA488/A647 from pH 4.0 to pH 7.5. (d) Representative images of coelomocytes labelled with I4cLYA488/A647, clamped at the indicated pH. Images are acquired in donor channel (D), acceptor channel (A) from which the respective pseudocolored D/A image is obtained. Scale bar, 5 μm. (e) Histograms showing typical spread of D/A ratios of endosomes clamped at pH 4 (lavender) and pH 7.5 (salmon);(n = 10 cells, ≥100 endosomes). We use the I switch for pH measurements in the lysosomes of coelomocytes (Figure 1—figure supplement 2). We first validate the sensor in vivo. For this we first generate an in vivo calibration profile for the sensor using previous methods standardized by our lab (Surana et al., 2011). Briefly worms are injected with 500 nM I-switch and were placed in clamping buffers of varying pH 1 hr post injection. Post 75 mins incubation, worms were imaged in the Donor Channel (D) and Acceptor Channel (A) (Figure 1—figure supplement 2d). On plotting the mean D/A against varying pH we generate a calibration curve which shows that the sensor’s in vivo performance is similar to the in vitro profile (Figure 1—figure supplement 2b and c).
Figure 1—figure supplement 3
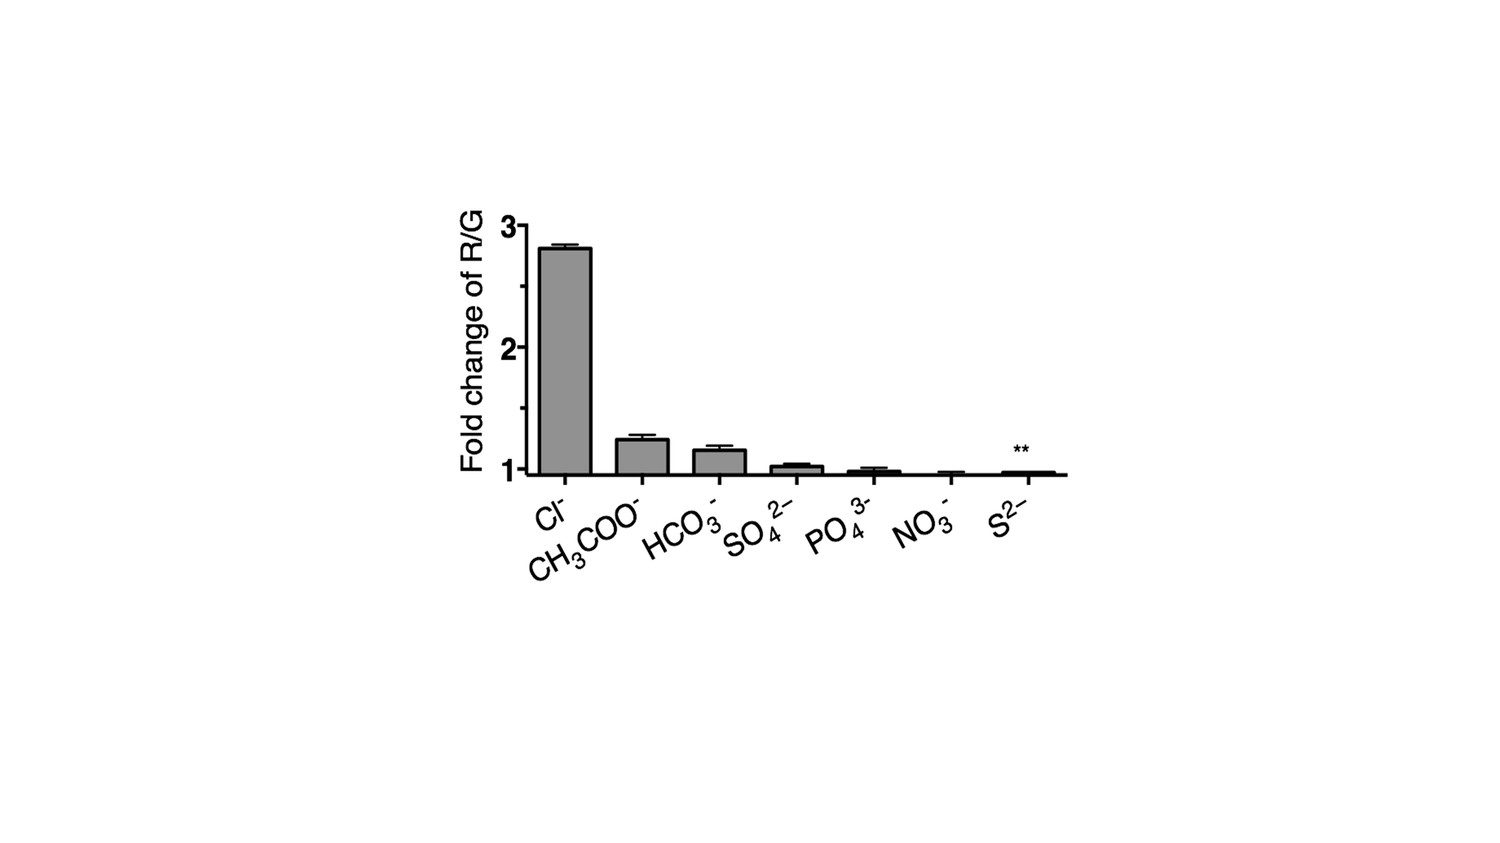
Selectivity of Clensor (200 nM) in terms of its fold change in R/G from ~0 to 100 mM of each indicated anion unless otherwise indicated.
(** ~ 0 to 10 mM). Since Cl− channels are known to exhibit poor anion selectivity, we investigate the selectivity of Clensor to demonstrate the signal change in cell is attributed by the change of chloride ions level. The selectivity of Clensor to various anions in the form of their sodium salts. This reveals that the sensitivity of Clensor to diverse biologically abundant anions including NO3- and PO43- is negligible.
Figure 2 with 2 supplements
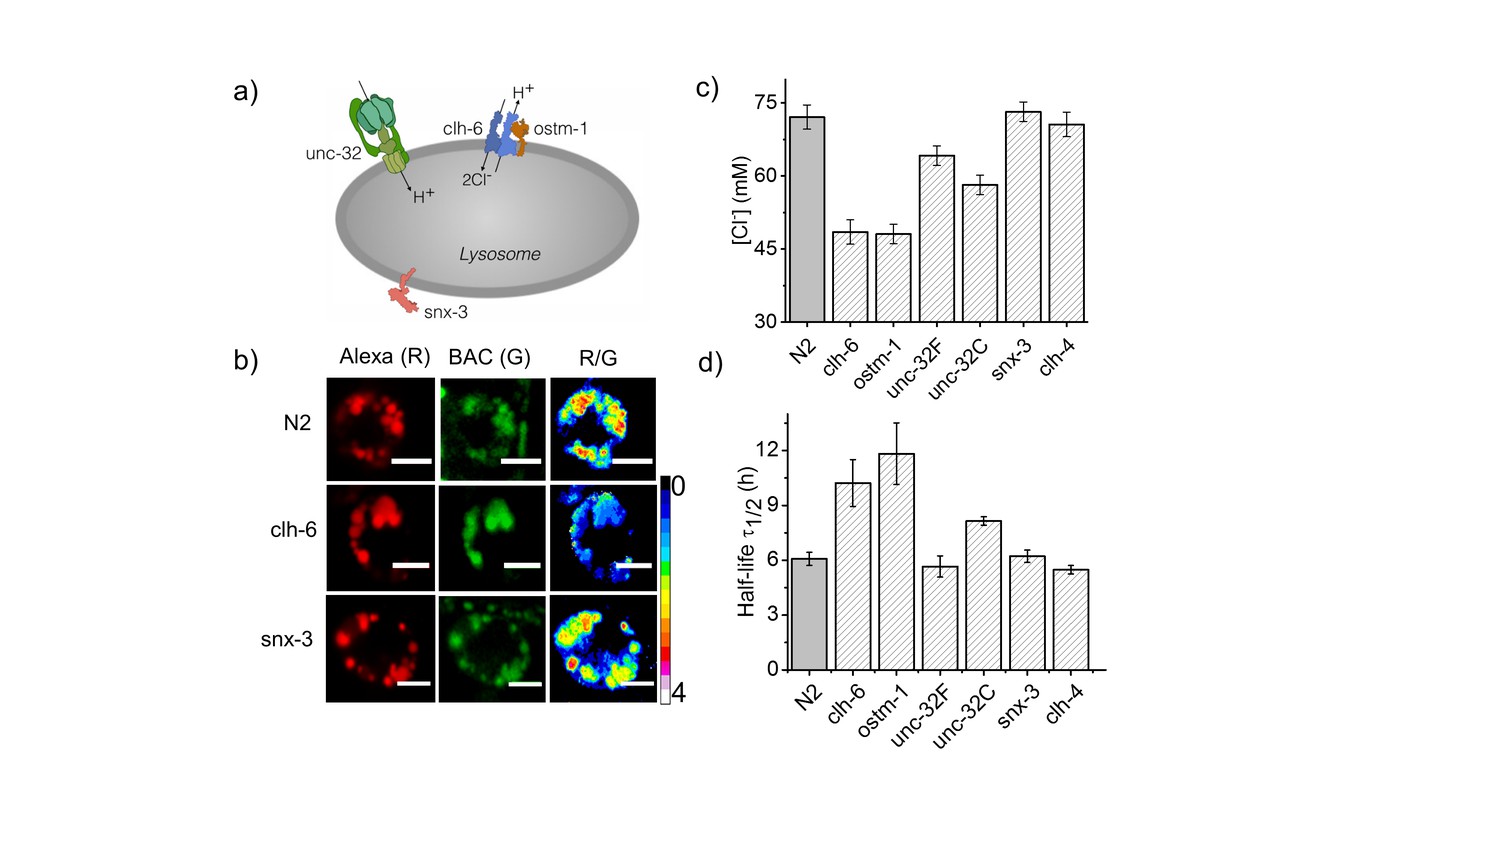
Dysregulation in lysosomal [Cl-] correlates with reduced lysosomal degradation.
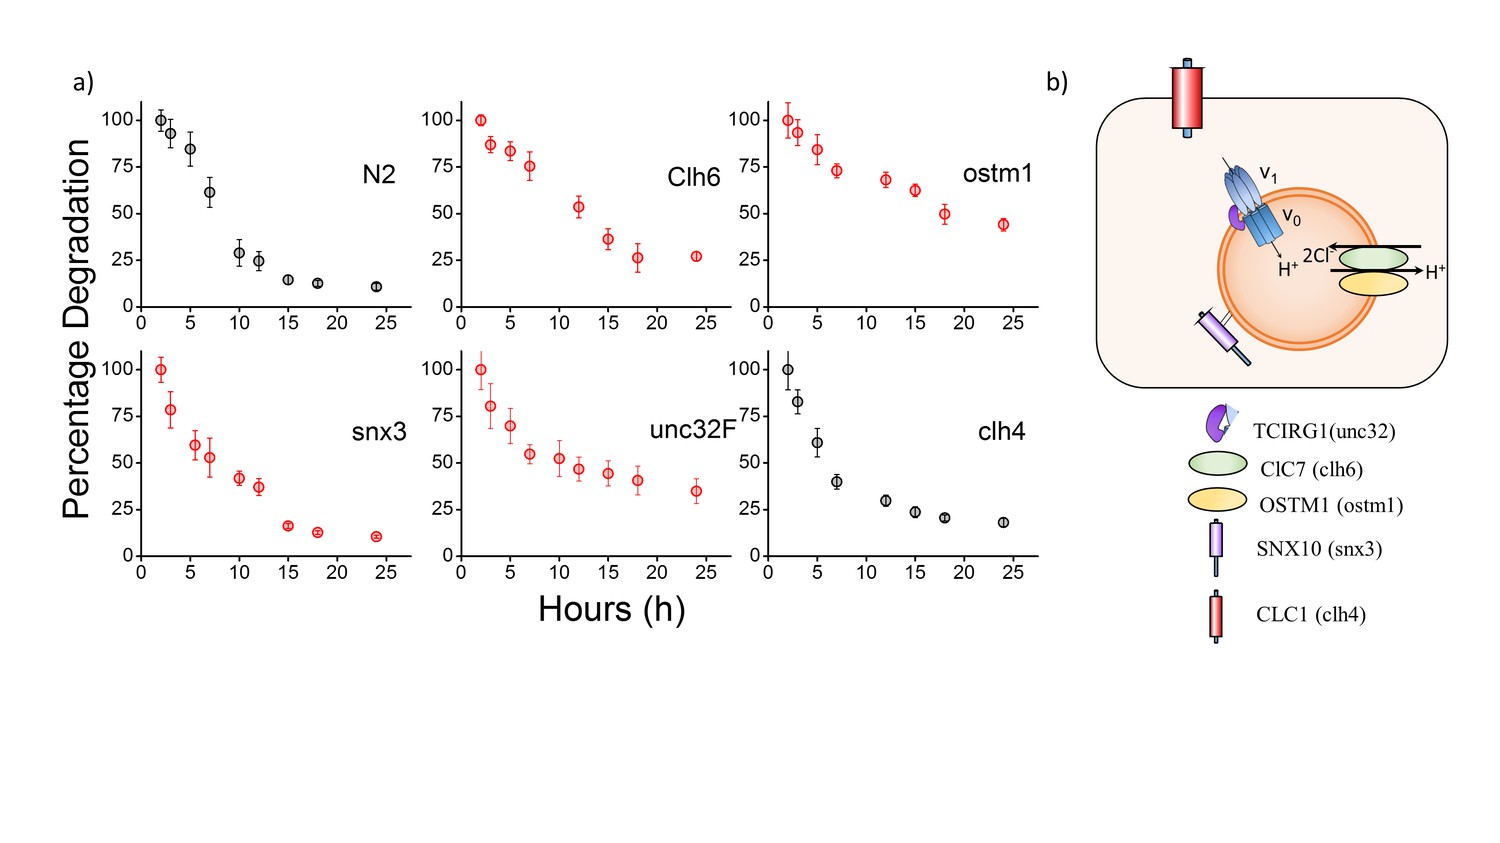
(a) Schematic depicting protein players involved in autosomal recessive osteopetrosis. (b) Representative images of Clensor in lysosomes of coelomocytes, in the indicated genetic backgrounds acquired in the Alexa 647 (R) and BAC (G) channels and their corresponding pseudocolored R/G images. Scale bar, 5 μm. (c) Lysosomal Cl- concentrations ([Cl-]) measured using Clensor in indicated genetic background (n = 10 worms, ≥100 lysosomes). (d) Degradative capacity of lysosomes of coelomocytes in nematodes with the indicated genetic backgrounds as given by the observed half-life of Clensor. Error bars indicate s.e.m.
Figure 2—figure supplement 1
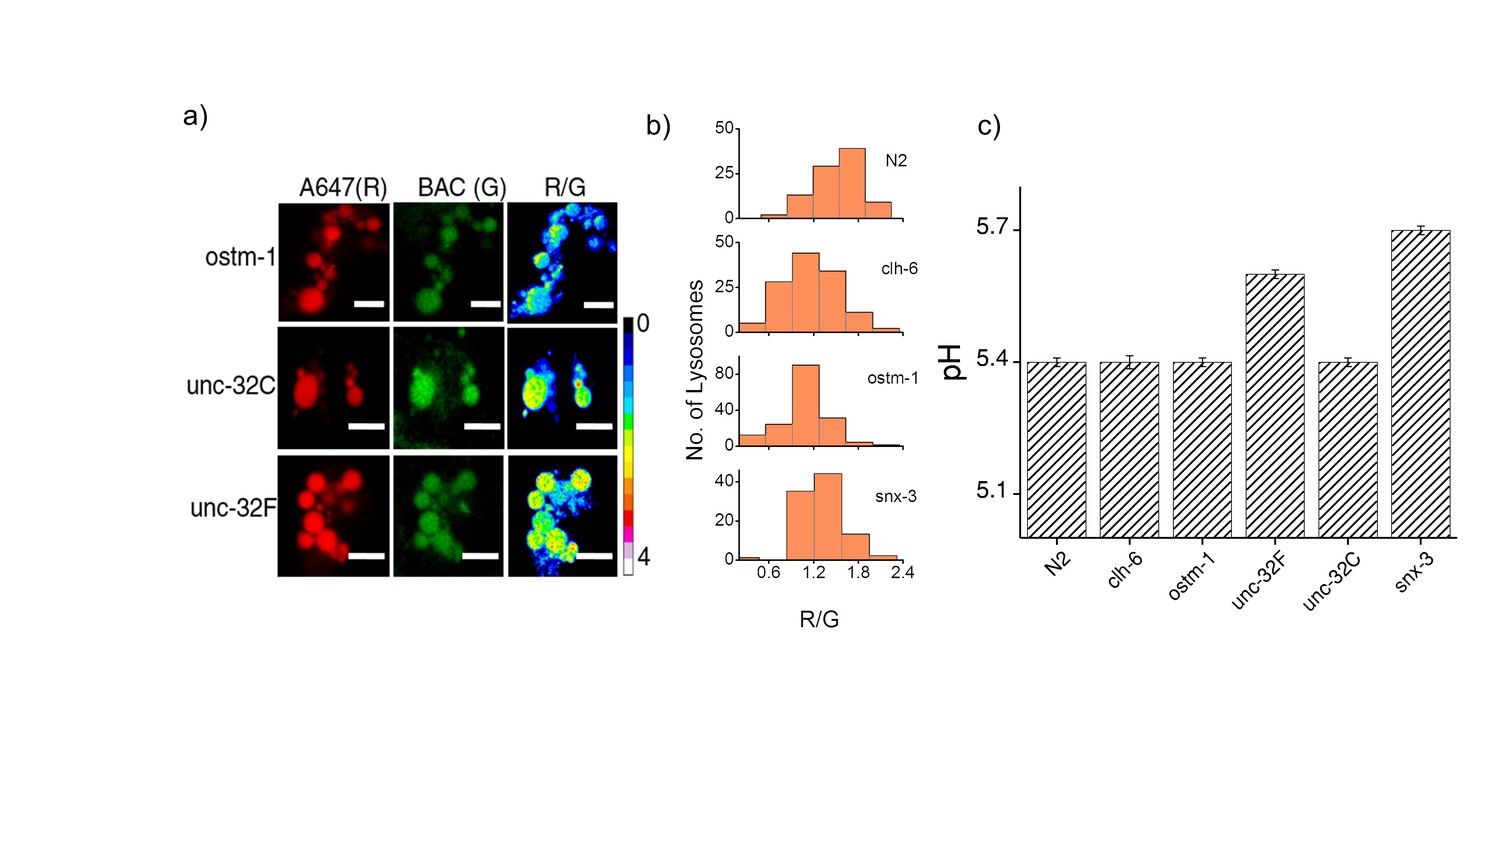
(a) Representative images of coelomocyte lysosomes labeled with Clensor one hour post injection, in the indicated genetic backgrounds acquired in the Alexa 647 (R) and BAC (G) channels and the corresponding pseudocolored R/G images.
Scale bar, 5 μm. (b) Histograms comparing the spread of R/G in coelomocytes in different RNAi background. (n = 10 cells; >100 lysosomes). (c) Lysosomal pH measured using I4cLYA488/A647 in the indicated genetic backgrounds (n = 10 worms, ≥100 lysosomes). Figure 2—figure supplement 1a shows representative images of chloride measurements in lysosomes of coelomocytes of worms where various genes related to osteopetrosis are either knocked out or knocked downs. Figure 2—figure supplement 1b shows a histogram comparing the spread of R/G values reporting lysosomal chloride in the indicated genetic backgrounds. We observe that the R/G values are lower in the case of clh-6 mutant and ostm-1 RNAi whereas that of snx-3 is similar to wild type.
Figure 2—figure supplement 2
(a) Plots showing mean whole cell intensity of I4A647 per coelomocyte, as a function of time, post-injection in indicated genetic backgrounds.
Error bars indicate s.e.m. (n ≥ 10 cells). (b) Schematic depicting protein players involved in autosomal recessive osteopetrosis. Also shown is clh-4, a plasma membrane resident chloride channel, that is used as a control. The above figure shows the stability of I switch in the lysosomes of the coelomocytes. Worms were injected with I4A647 and the number of labeled coelomocytes were plotted as a function of time. This gives an exponential decay profile, with progressively more coelomocytes losing their labeling as the DNA device is degraded in the coelomocyte. An exponential is fitted that gives the half-life of the device. In N2 worms, the half-life of the DNA reporters is ~6.5 hr, with maximal labelling occurring at 2 hr post injection.
Figure 3 with 3 supplements
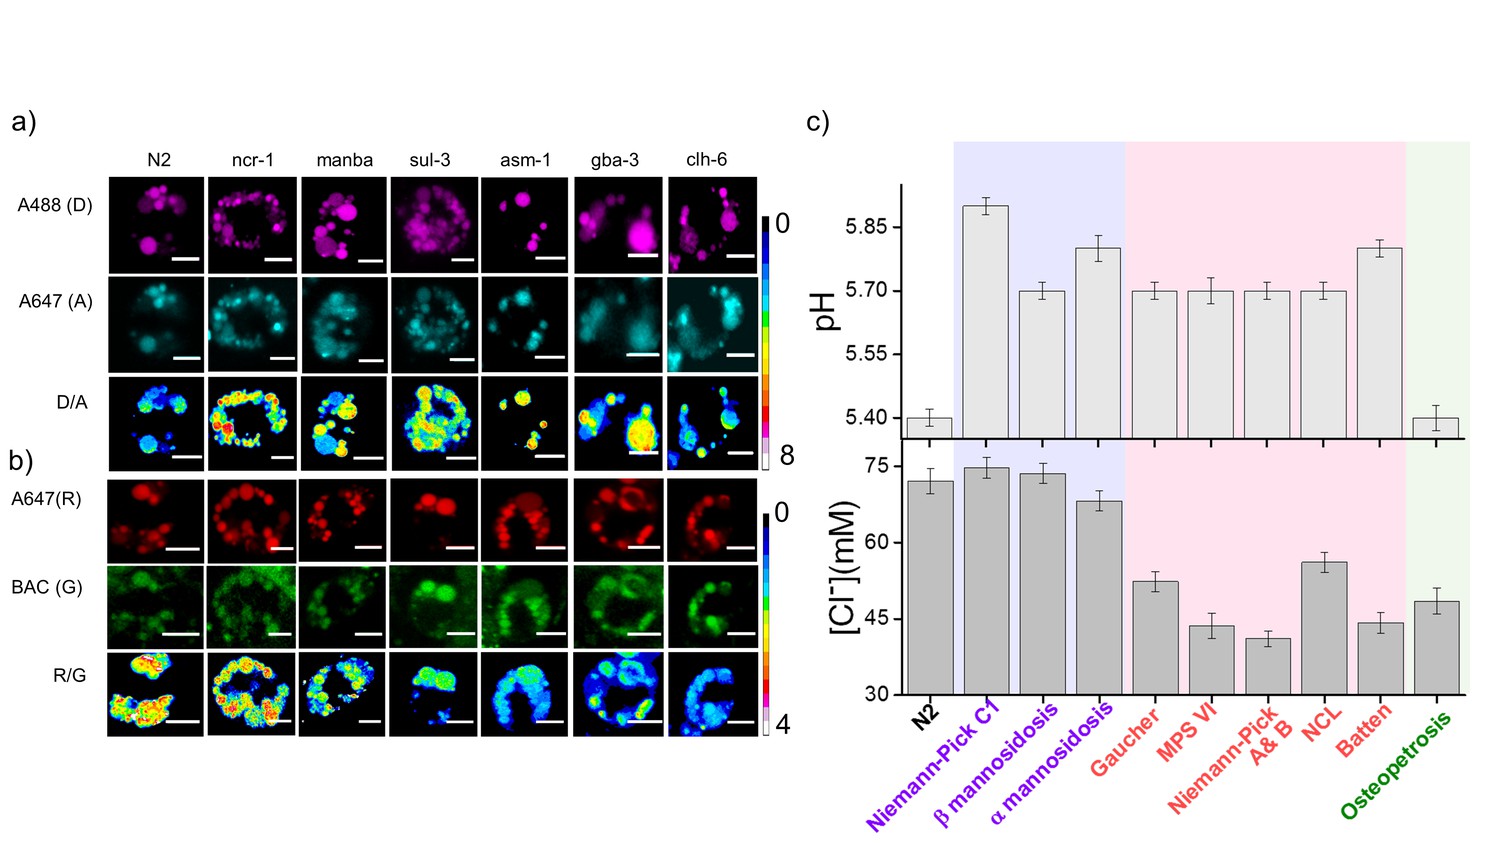
Lysosomal chloride dysregulation is observed in nematode models in several pH-related lysosomal storage disorders.
(a) Representative pH maps of lysosomes in coelomocytes labelled with a DNA-based pH reporter, I4cLYA488/A647, in the indicated genetic backgrounds. Images were acquired in the donor (D, magenta) and acceptor (A, cyan) channels and the corresponding pseudocolored D/A images. Scale bar, 5 μm (b) Representative [Cl-] maps of lysosomes acquired in these genetic backgrounds using Clensor. Images are acquired in the Alexa 647 (R) and BAC (G) channels and the corresponding pseudocolored R/G images are shown. Scale bar, 5 μm. (c) Quantification of lysosomal pH and lysosomal Cl- in C. elegans mutants or RNAi knockdowns of genes responsible for the indicated lysosomal storage diseases in humans. Mutants are grouped according to dysregulation only in lysosomal pH (purple box); only in lysosomal chloride (green box) and both lysosomal pH and chloride (pink box) for n = 10 worms (≥100 lysosomes) Error bars indicate s.e.m.
Figure 3—figure supplement 1
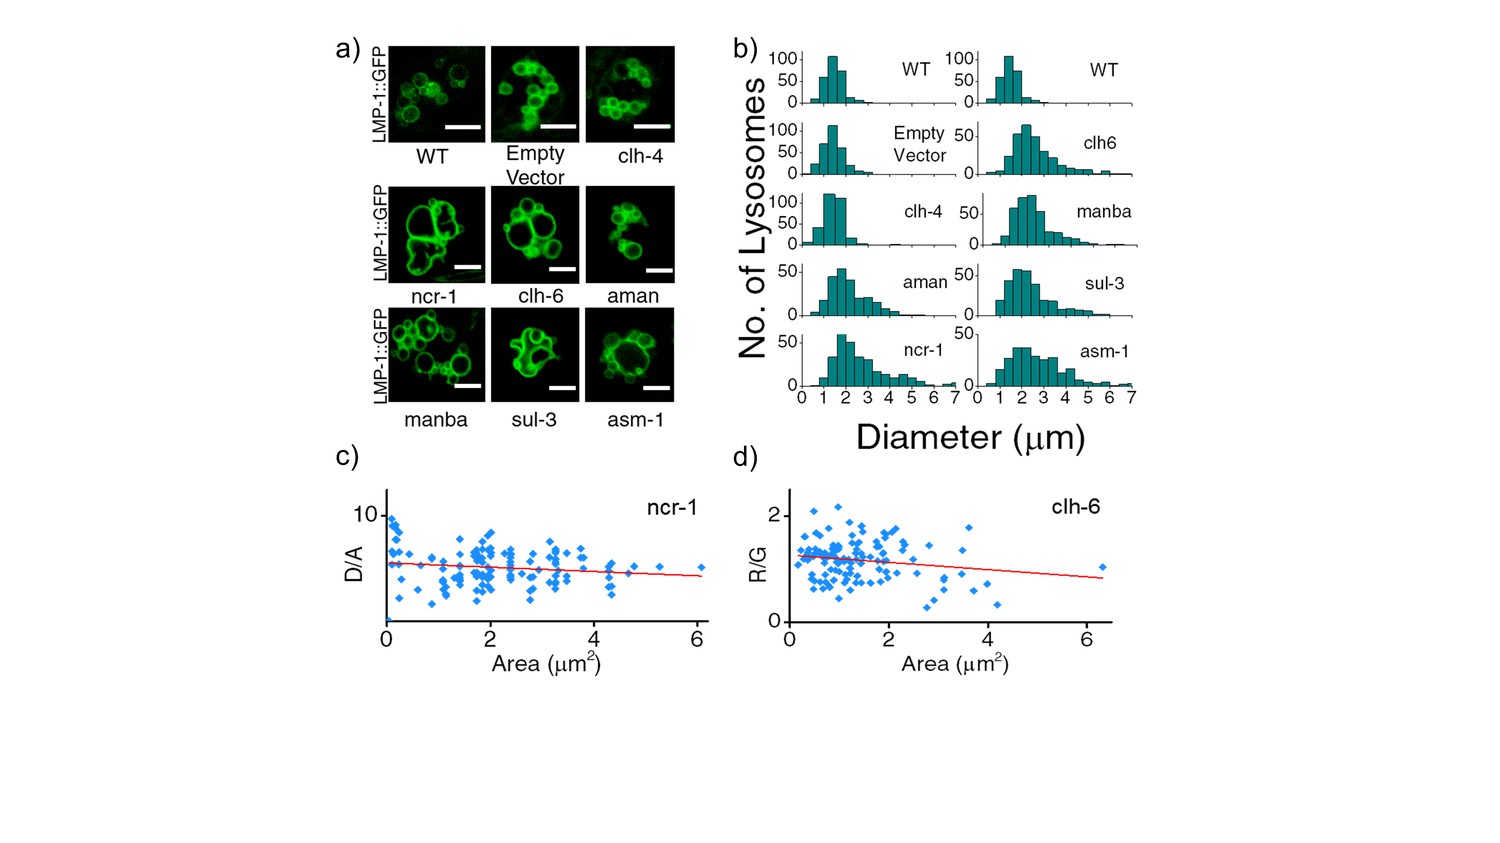
(a) Representative images of LMP-1::GFP marked coelomocytes in the background of indicated RNAi.
Scale bar: 5 μm. (b) Histograms comparing the spread in size of LMP-1::GFP positive vesicles in coelomocytes in the indicated RNAi background (n = 20 cells). (c) D/A values obtained for individual pH measurements in lysosomes as a function of area of each vesicle in the indicated genetic background. The linear regression is shown in red. The coefficient of regression (p = ‒0.14) shows no correlation (n > 100 lysosomes). (d) R/G values obtained for individual Cl- measurement in lysosomes as a function of area of each vesicle in the indicated genetic background. The linear regression line is shown in red. The coefficient of regression (p= ‒0.18) shows no correlation (n > 100 lysosomes). A key phenotype observed in cells derived from patients suffering from lysosomal storage disorders (LSD) is the presence of enlarged lysosomes (Filocamo and Morrone, 2011; Platt et al., 2012). LSD-related gene knockdowns in worms show subtle to no observable whole organismal phenotypes (de Voer et al., 2008). However, on knocking down various LSD-related genes in the background of LMP-1::GFP worms we observed that the morphology of LMP-1 positive vesicles were altered and that the coelomocytes contained enlarged lysosomes, some as large as eight microns in diameter (Figure 3—figure supplement 1). Figure 3—figure supplement 1b represents a plot of the diameter distribution for LMP-1 positive vesicles under each indicated genetic background. Worms with LSD-related gene knockdowns show a broader distribution of vesicle sizes compared to a more tightly regulated size distribution in wild type nematodes or non-LSD related mutants. example for when clh-4, a plasma membrane resident chloride channel was knocked down, lysosomal morphology is not affected. We carried out pH and chloride measurements for worms from various genetic backgrounds and checked for correlations between lysosomal D/A (or R/G) and lysosome size. On plotting D/A values obtained from pH measurements in ncr-1 RNAi worms, against the area of each vesicle; we observe no correlation between the two parameters (Figure 3—figure supplement 1c). A similar observation is seen in the case of chloride R/G measurements (Figure 3—figure supplement 1d). Thus assaying only for lysosome size shows no correlation with lysosome functionality. However lumenal chloride concentration is the best correlate of lysosome dysfunction, irrespective of size.
Figure 3—figure supplement 2
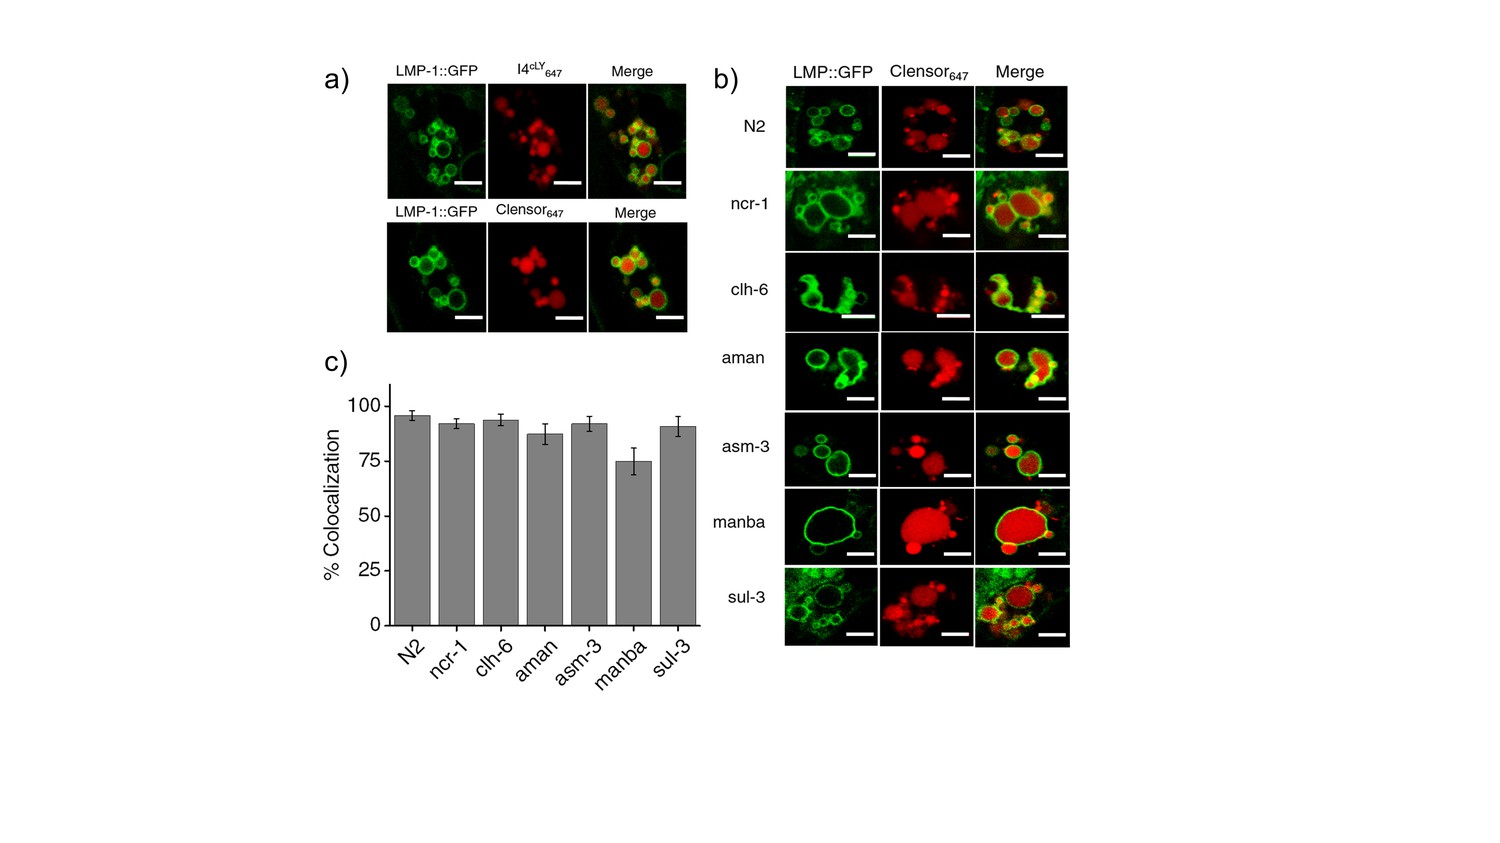
(a) Worms expressing LMP-1::GFP in coelomocytes were injected with I4cLYA647 or ClensorA647 (red) and show maximal colocalization with LMP-1::GFP vesicles (green) at 60 min.
Scale bar: 5 μm (b) Representative images of worms expressing LMP-1::GFP (green) in the background of various indicated RNAi's, which were injected with ClensorA647 (red) and imaged 60 mins post-injection. Scale bar: 5 μm. (c) Quantification of colocalization between the ClensorA647 and GFP in arIs37 worms. Mean of n = 10 cells. To check whether our DNA nanodevices can mark the lysosomes of coelomocytes in wild type worms, we injected 500 nM of I4cLYA647 or ClensorA647 into worms containing LMP1::GFP marker (Figure 3—figure supplement 2a). The worms were imaged 1 hr post injection in the GFP channel (green) and in Alexa 647 channel (red) to visualize the lysosomal marker and DNA reporter respectively. Merged images show colocalization of DNA devices with the lysosomal marker, similar to previous studies (Surana et al., 2011). We then proceeded to validate the devices in the lysosomes in coelomocytes of various LSD-related genes knocked down worms. LMP1::GFP positive worms that were RNAi-ed for indicated genes were injected with ClensorA647 and imaged 1 hr post injection (Figure 3—figure supplement 2b). We observe that, in worms, Clensor reliably marks the lysosomes in all LSD- related gene knockdowns with over 74% colocalization (Figure 3—figure supplement 2c).
Figure 3—figure supplement 3
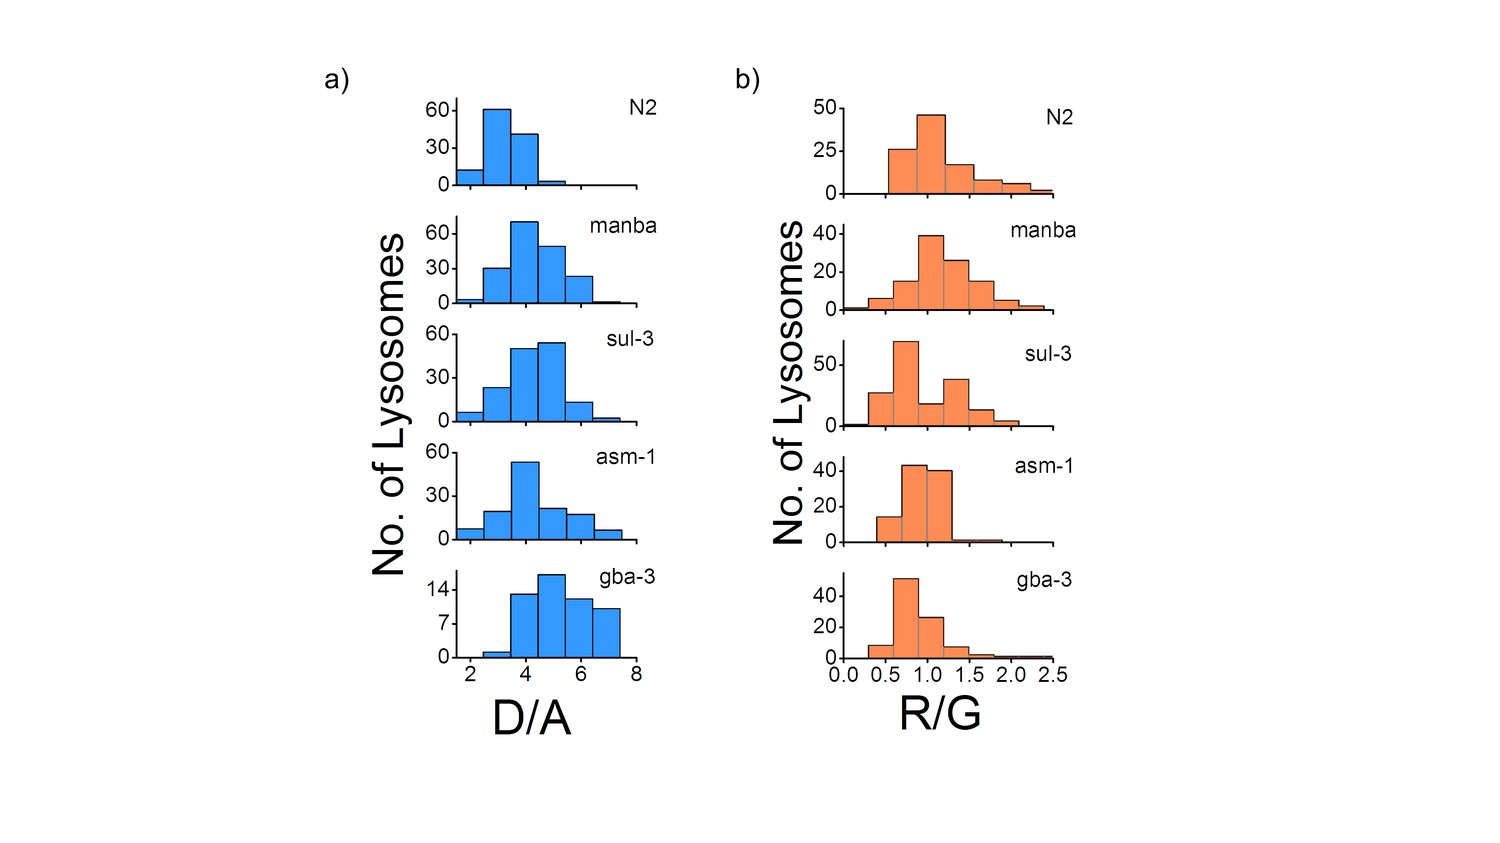
(a) Histograms comparing the spread of D/A in coelomocytes in different RNAi background.
(n = 10 cells; >100 lysosomes). (b) Histograms comparing the spread of R/G in coelomocytes in different RNAi background. (n = 10 cells; >100 lysosomes).
Figure 4 with 5 supplements
Lysosomal chloride is substantially depleted in mammalian cell culture models of lysosomal storage diseases.
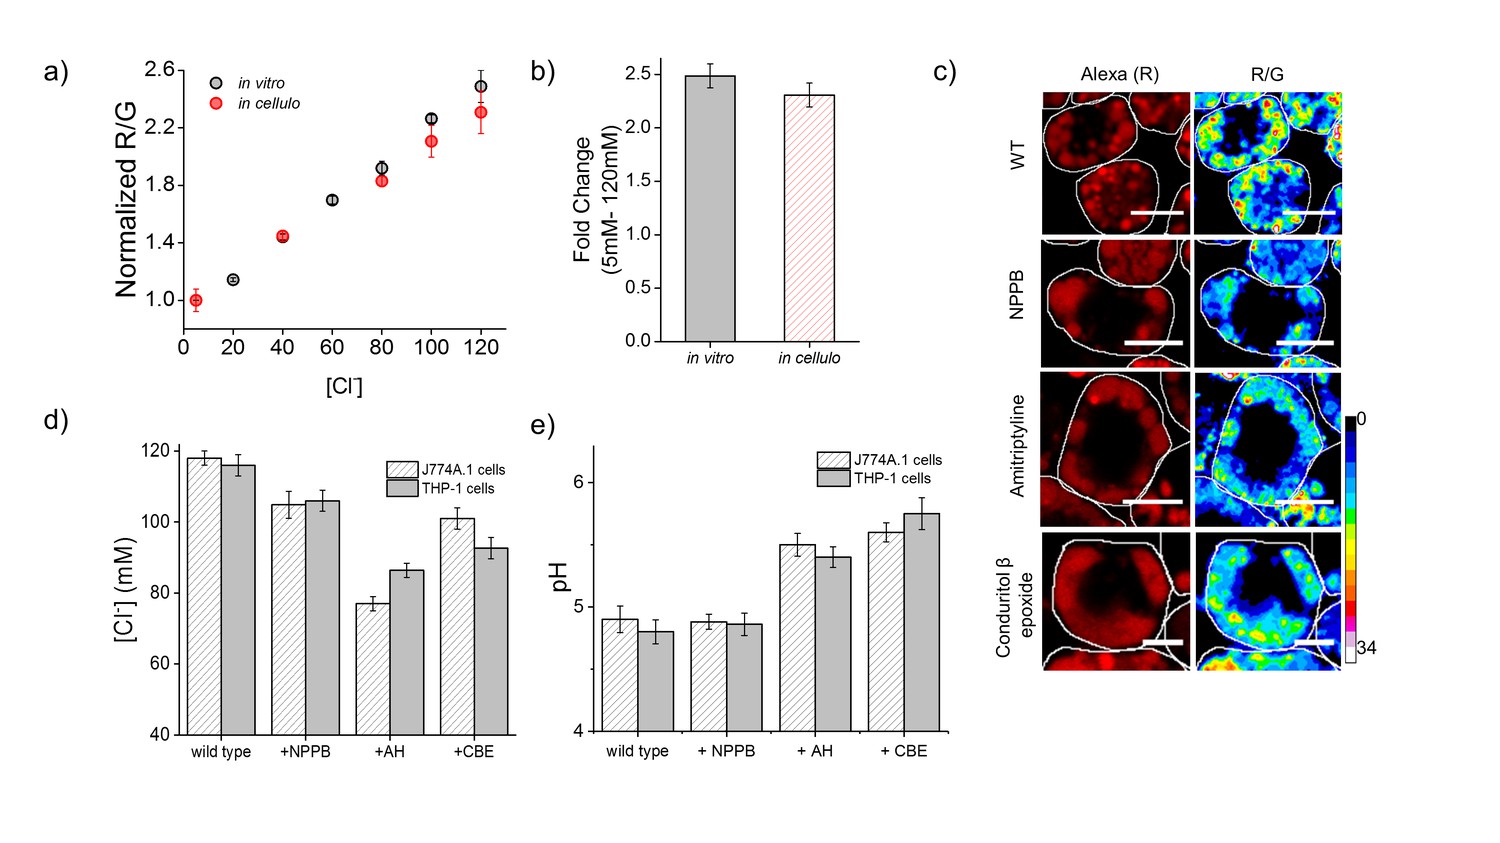
(a) Calibration profile of Clensor in cells (red) and in vitro (grey) showing normalized Alexa 647 (R) and BAC (G) intensity (R/G) ratios versus [Cl-]. Error bars indicate s.e.m. (n = 20 cells,≥100 endosomes) (b) Fold change in R/G ratios of Clensor in vitro (grey) and in cells (red) from 5 mM to 120 mM [Clˉ] (c) Representative [Cl-] maps of Clensor in lysosomes of J774A.1 cells treated with the indicated lysosomal enzyme inhibitor. Images of the Alexa 647 (R) channel and pseudocolored R/G images are shown. Scalebar: 10 μm. (d) Bar graphs of lysosomal Cl- values obtained in THP-1 and J774A.1 cells treated with the indicated inhibitors. NPPB (50 μM), Amitryptiline, AH (10 μM), Conduritol β-epoxide, CBE (400 μM) were used to model Niemann Pick A/B and Gaucher's diseases in both cell types. Error bars indicate s.e.m. (n = 10 cells, ≥60 endosomes). (e) Bar graphs of lysosomal pH values obtained in THP-1 and J774A.1 cells treated with the indicated inhibitors. NPPB (50 μM), Amitryptiline, AH (10 μM), Conduritol β-epoxide, CBE (400 μM) were used to model Niemann Pick A/B and Gaucher's diseases respectively in both cell types. Error bars indicate s.e.m. (n = 10 cells, ≥50 endosomes).
Figure 4—figure supplement 1
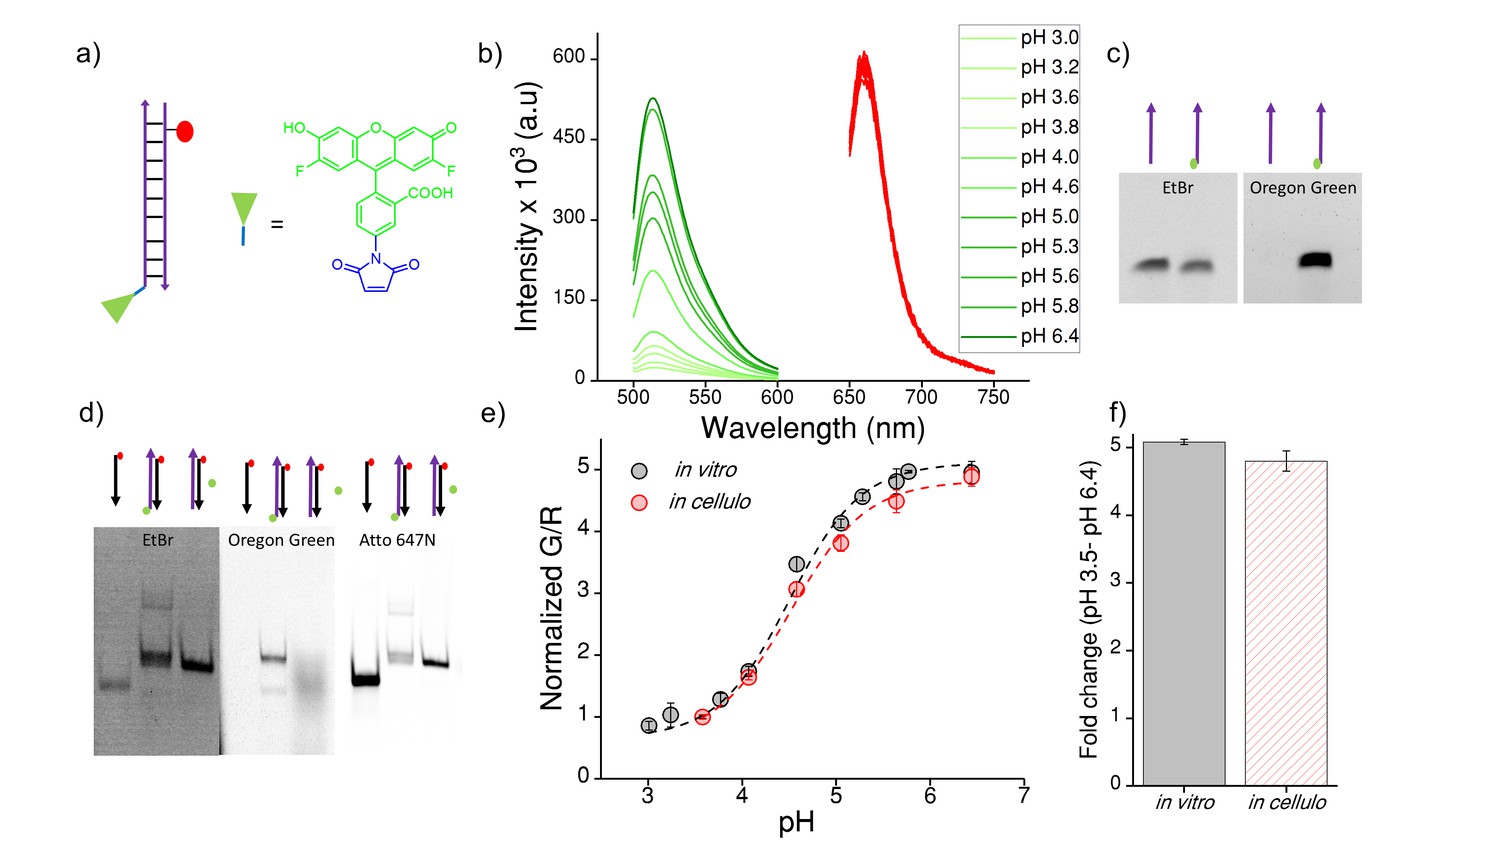
(a) Structure of Oregon Green (OG) and schematic of ImLy (b) Fluorescence emission spectra of ImLy at the indicated pH obtained using λExOG = 494 nm (green) and λEx Atto 647N = 650 nm (red).
(c) Representative 12% denaturing PAGE stained with Ethidium bromide (EtBr) showing conjugation of OG (green) to thiol labelled DNA (purple arrow) imaged in the ETBr and OG channels respectively (d) Representative 20% PAGE showing formation of ImLy (e) pH calibration curve of ImLy in cellulo (red) and in vitro (black) showing normalized G/R ratios versus pH. Error bars indicate s.e.m. (n = 15 cells, ≥60 endosomes) (f) in vitro and in cellulo fold change in G/R ratios of ImLy from 3.5 to pH 6.4. To create a pH sensor for mammalian lysosomes we conjugated a pH sensitive dye ‒ Oregon green (OG) which pKa is 4.9 (green chemical structure) to thiol labelled DNA using a maleimide linker (blue chemical structure). The complementary strand contains a normalizing dye, Atto 647N (red circle). The conjugation of OG was confirmed by 12% denaturing PAGE (Figure 4—figure supplement 1). Furthermore, the formation of ImLy was confirmed by a gel mobility shift assay using native polyacrylamide gel electrophoresis. We annealed 10 μM of both components in equimolar ratios in 10 mM sodium phosphate buffer, pH 7.4 and investigated the sample by PAGE. The formation of ImLy was revealed by its lower electrophoretic mobility with respect to its component single strands (Figure 4—figure supplement 1d). The fluorescence of OG increases with the pH while the fluorescence of normalizing dye Atto 647N remains unchanged (Figure 4—figure supplement 1b). Furthermore, the in cellulo calibration were well matched with their in vitro calibration profiles (Figure 4—figure supplement 1e‒f), indicating that both sensor integrity and performance were quantitatively preserved at the time of making lysosomal pH a measurements in these cells.
Figure 4—figure supplement 2
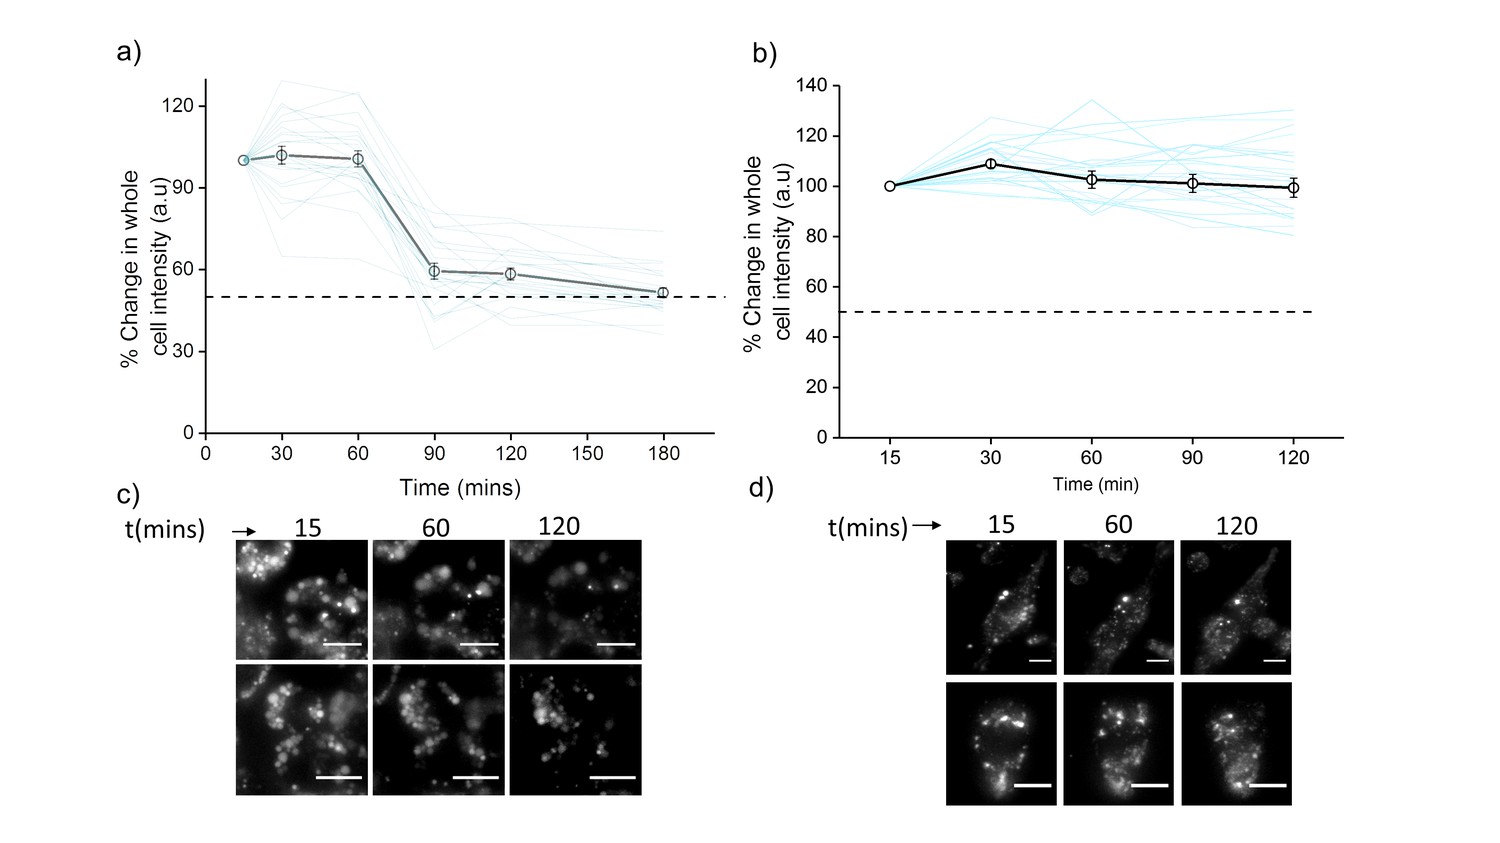
Plots showing mean whole cell intensity (wci, black line) of ClensorA647 in cells imaged as a function of indicated times in (a) J774A.1 cells and (b) THP-1 cells.
Blue lines show wci traces of individual cells as a function of time. Error bars indicate s.e.m. (n ≥ 25 cells). Representative images of (c) J774A.1 cells and (d) THP-1 cells at indicated time points. Scale bar: 10 µm. To examine the stability of Clensor in cellulo, we pulse 500 nM Clensor for 30 min and chase for other 60 min to J774A.1 cells and THP-1 cells. The whole cell intensity of ClensorA647 was unchanged upon 60 min chasing and decrease significantly from 60 min to 90 min for J774A.1 cell while no significant change was observed for THP-1 cells. The result indicates that the DNA device is stable for lysosomal pH measurement using our protocol (30 min pulse follow by 60 min chasing).
Figure 4—figure supplement 3
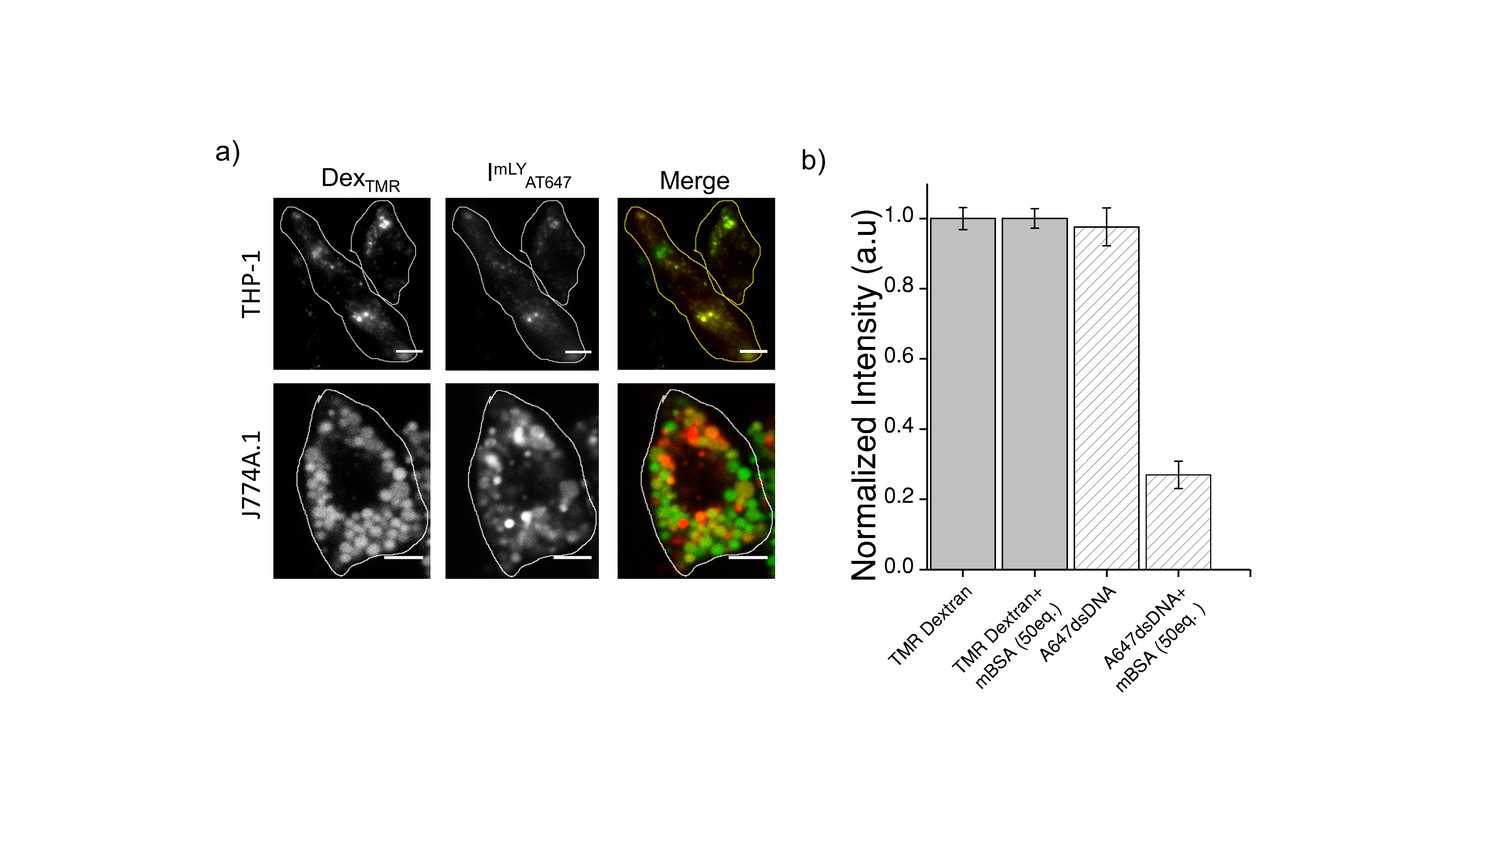
(a) Representative images showing colocalization of ImLyAT647 with TMR-Dex in J774A.1 and THP-1 macrophages (b) Macrophage labeling efficiency with ClensorA647 (A647) in the absence or presence of 50 equivalents excess of maleylated bovine serum albumin (mBSA) in comparison to TMR Dextran.
Error bars indicate s.e.m. (n = 20 cells). To verify whether ImLy was endocytosized to lysosome by anionic ligand binding receptor (ALBR) pathyway, cells were first pre-labelled with TMR-Dextran a marker of lysosome through fluid phase (0.5 mg/mL; 1 hr pulse followed by 16 hr chase). Cells were then pulse ImLy for 30 min and chased for 60 min. Co-localization of ImLy with TMR-Dextran was observed. Next, competition experiments with 30 equivalents of maleylated BSA (mBSA) ‒ a well-known competitor for the anionic ligand, were performed. In the presence of mBSA, only the intensity of ImLy was decreased significantly thus confirming that ImLy was endocytosized via ALBR pathway.
Figure 4—figure supplement 4
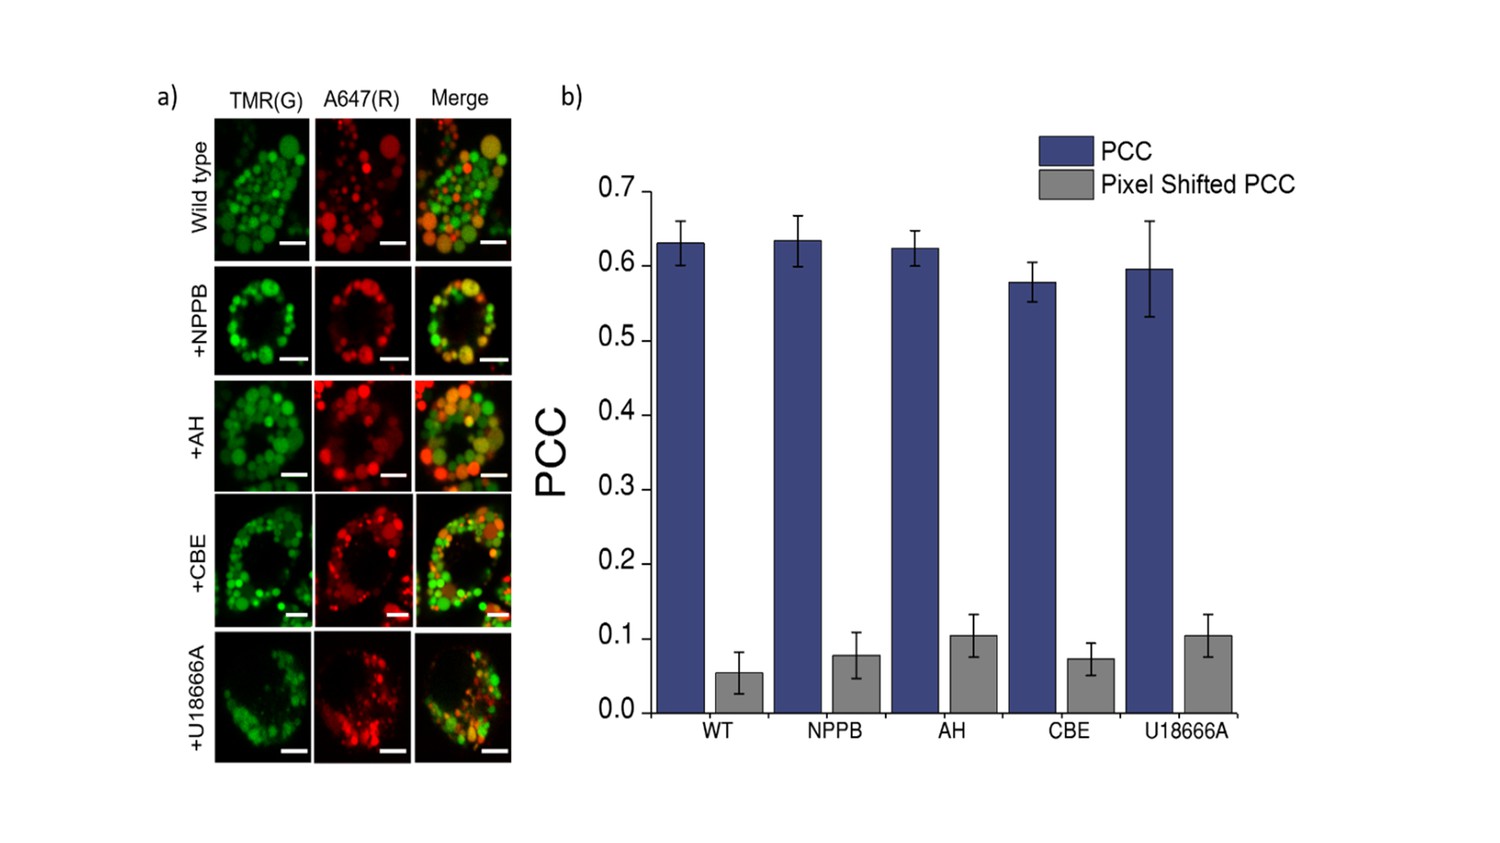
Co-localization of Clensor (red) with lysosomes labelled with TMR–dextran (green) in J774A.1 cells treated with the indicated lysosomal enzyme inhibitors.
(a) Representative images of lysosomes of J774A.1 cells labelled with TMR dextran (TMR; G) and Clensor (Alexa 647; R) in the absence of any inhibitor, 50 μM NPPB, 10 μM Amitryptiline hydrochloride (AH) 400 μM of Conduritol β-epoxide (CBE) or 10 μM of U18666A . Scale bar, 5 μm (b) Pearson's correlation coefficient for the colocalization between Clensor and TMR Dextran. To eliminate the possibility that trafficking defect in LSD may contributes to the observed reduction in lysosomal [Cl-]. We pre-labelled lysosomes with TMR-Dextran (0.5 mg/mL) using literature protocols, treated cells with U18666A and Conduritol β-epoxide (CBE) to induce Niemann Pick C and Gaucher's cellular phenotype respectively, only then pulse Clensor for 30 min, chased for 60 min, and scored for co-localization with TMR-Dextran. Amitriptyline (AH) and NPPB were added 30 min after the pulsing and chasing of Clensor to the lysosome. We observed that Clensor colocalized with lysosomes under each of these conditions, indicating that they do not suffer trafficking defects in these cell culture models of lysosomal storage diseases.
Figure 4—figure supplement 5
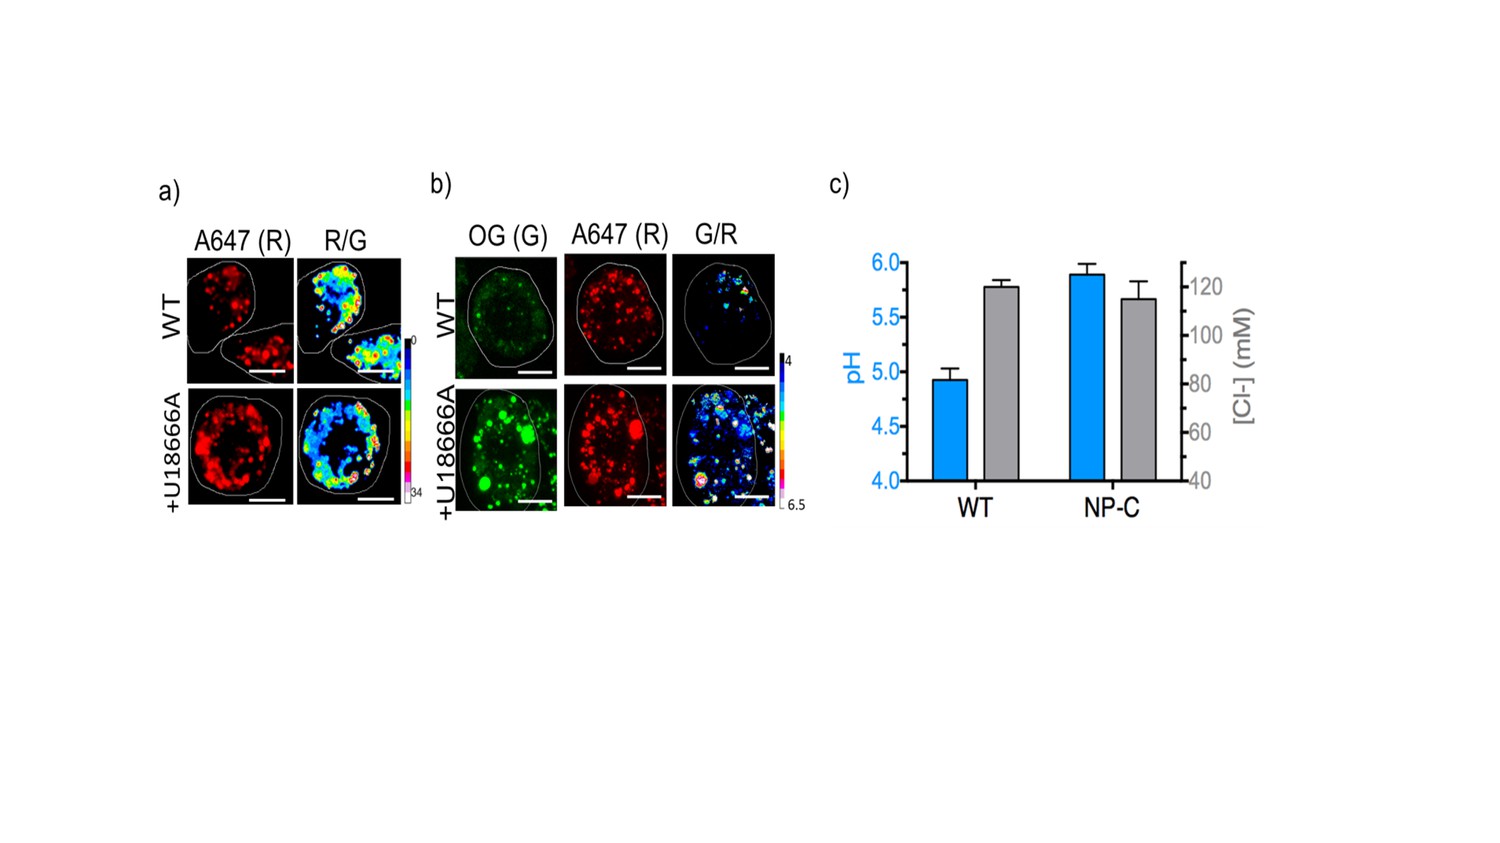
Representative pH and [Cl-] maps of ImLy and Clensor in lysosomes of J774A.1 cells in the absence and presence of 10 μM U18666A that gives a cell culture model of NP-C.
(A) Representative images of lysosomes labeled with Clensor in the Alexa 647 (R) channel and pseudocolored R/G images are shown. Scale bar: 10 μm (B) Representative images of lysosomes labeled with pH sensor ImLy in the Oregon Green (OG) channel (G), Atto647 channel (R) and pseudocolored G/R images are shown. Scale bar: 10 μm (C) pH and Cl- levels in lysosomes in the presence and absence of 10 μM U18666A. Error bars indicate s.e.m. (n = 10 cells, ≥50 endosomes). To directly compare the results from ncr-1 knockdowns that yielded a worm model of Niemann Pick C in Figure 3, we also employed U18666A a selective inhibitor for NPC1 protein to induce NP-C cell model. We first confirmed that Clensor could traffic to the lysosome in this cell culture model (Figure 4—figure supplement 5). We found a dramatic lysosomal hypoacidification and no significant change of lysosomal [Cl-]. This matches our observation in a C. elegans model for NP-C.
Figure 5 with 2 supplements
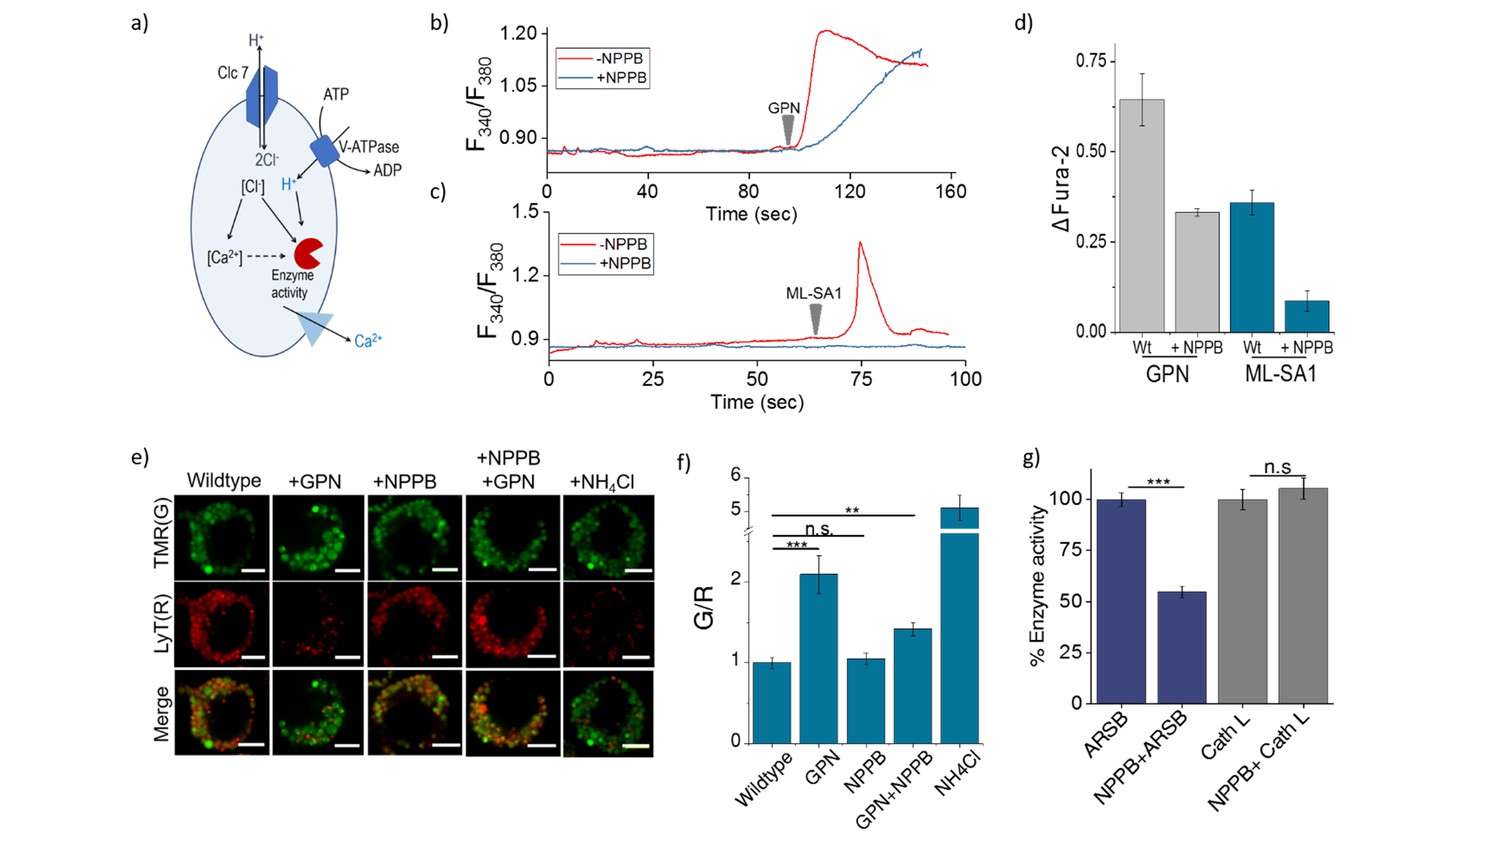
(a) Schematic of potential roles for lysosomal chloride.
Cl- ions can regulate lysosomal Ca2+ and/or affect lysosomal enzyme function. (b) Representative traces of Glycyl-L-phenylalanine 2-naphthylamide (GPN) (400 μM) triggered lysosomal Ca2+ release in J774A.1 cells ratiometrically imaged using Fura-2 (F340/F380) in the presence and absence of 50 μM NPPB. (c) Representative traces of ML-SA1 (20 μM) triggered lysosomal Ca2+ release in J774A.1 cells ratiometrically imaged using Fura-2 (F340/F380) in the presence and absence of 50 μM NPPB. (d) Quantification of lysosomal Ca2+ release from b) and c) given by (Ft-F0/F0) (ΔFura-2) for n = 15 cells. (e) Representative images of lysosomes of J774A.1 cells labelled with TMR dextran (TMR; G) and LysoTracker Red (LyT; R) in the presence or absence of 50 μM NPPB, 200 μM GPN or 1 mM NH4Cl. Scale bar, 5 μm (f) Quantification of LysoTracker Red release from (e) (n = 50 cells). (g) Quantification of activity of the enzymes arylsulfatase B (ARSB) and Cathepsin L (Cath L) in J774A.1 cells in the absence and presence of 50 μM NPPB (n = 70 cells). Error bars indicate s.e.m. P values are as follows; ** = p<0.001, *** = p<0.0001, n.s = non significant.
Figure 5—figure supplement 1

Representative fluorescence images of cleaved substrates of ARSB and cathepsin L (E), DAPI (D) merge of E and D channels and respective pseudocolour E/D maps of J774A.1 cells with and without 50 µM NPPB.
Scale bar: 5 μm. To demonstrate chloride ion levels directly influence lysosome function, 50 µM of chloride channel inhibitor – NPPB was employed to decrease lysosomal chloride without affecting lysosomal pH (Figure 5—figure supplement 1). Upon incubation of 50 µM of NPPB for 30 min, the activity of arylsulfatase B (ARSB) was reduced ca. 50% while the activity of its upstream enzyme cathepsin L which activates cathepsin C, (Dahl et al., 2001) is still unchanged. It reveals that decrease of chloride ions level directly attenuate cathepsin C activity.
Figure 5—figure supplement 2

(a) Lysosomal pH and (b) chloride levels measured by ImLy and Clensor in J774A.1 cells with increasing concentrations of NPPB.
Here we show that by varying doses of NPPB that at < 100 µM of NPPB, we can selectively reduce lysosomal Cl- without changing in lysosomal pH. Consequently all further studies that use NPPB do so at 50 µM.
Additional files
-
Supplementary file 1
Sequences used for Clensor and I4cLYA488/A647 assemblies.
Oligo P, Oligo D1 and Oligo D2 combine to form Clensor. Oligo I4cLYA488 and I4cLYA647 combine to form I4cLYA488/A647. The sequences in matching colors are complementary.
- https://doi.org/10.7554/eLife.28862.023
-
Supplementary file 2
Lysosomal storage disorders investigated in this study, their corresponding human genes and the C.elegans homologues.
- https://doi.org/10.7554/eLife.28862.024
Download links
A two-part list of links to download the article, or parts of the article, in various formats.
Downloads (link to download the article as PDF)
Open citations (links to open the citations from this article in various online reference manager services)
Cite this article (links to download the citations from this article in formats compatible with various reference manager tools)
High lumenal chloride in the lysosome is critical for lysosome function
eLife 6:e28862.
https://doi.org/10.7554/eLife.28862


