Nanoscale architecture of the Schizosaccharomyces pombe contractile ring
- Vanderbilt University, United States
- Vanderbilt University Medical Center, United States
- Stowers Institute for Medical Research, United States
- Johns Hopkins University School of Medicine, United States
Figures
Figure 1 with 1 supplement
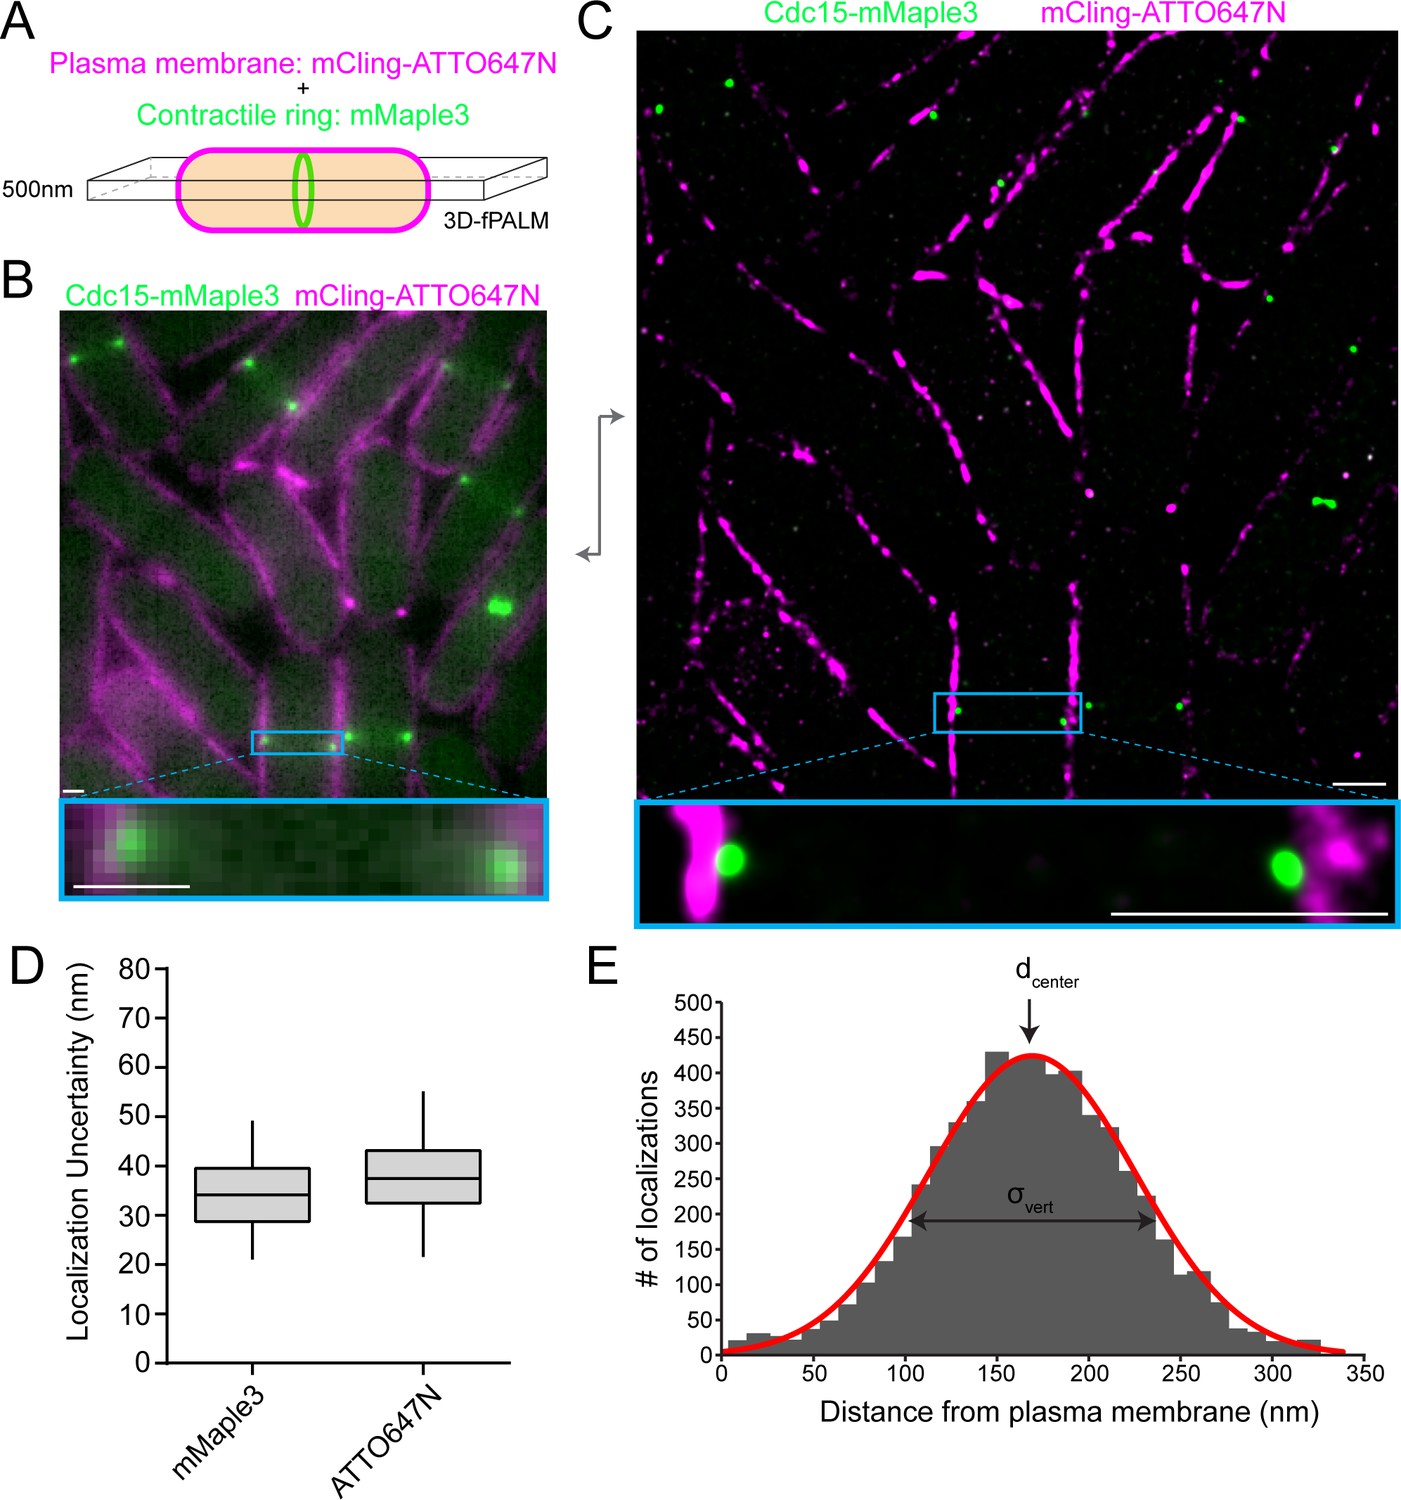
fPALM strategy to localize contractile ring proteins relative to the plasma membrane with nanometer resolution.
(A) Schematic of fPALM sample setup. Contractile ring proteins were endogenously tagged with mMaple3 while the plasma membrane was labeled with mCling-ATTO647N. A 3D-fPALM system was used to restrict the imaging plane to a narrow 500 nm Z section. (B) Conventional fluorescence microscopy images of a contractile ring protein and membrane dye. (C) Resulting 2 color fPALM image after localization analysis. Particles are visualized as normalized Gaussians with standard deviation = localization uncertainty. (D) Localization uncertainty achieved with mMaple3 and ATTO647N fluorophores for all data in this study. (E) Example histogram of Cdc15-mMaple3 localization distances from the mCling-ATTO647N membrane edge. A Gaussian curve was fitted to the data from which dcenter and σvert parameters can be extracted. Scale bars = 1 µm.
Figure 1—figure supplement 1

The mCling-ATTO674N plasma membrane marker accurately identifies the plasma membrane edge.
(A) mCling-ATTO647N is a bona fide plasma membrane marker. Time course of mCling-ATTO647N and FM4-64 staining of cells reveals plasma membrane colocalization and trafficking into internal compartments. (B) Left) fPALM mCling-ATTO647N and Acyl-mMaple3 signals are directly aligned at the plasma membrane. Right) A linescan across the plasma membrane (grey dashed line) reveals the edges of the mCling-ATTO647N and Acyl-mMaple3 signals align. The blue line indicates where the membrane edge would be identified at a 95% signal dropoff level (see Materials and methods). (C) Visual identification parameters used to select fully formed but unconstricted contractile rings. Single arrow heads indicate precursor nodes. Double arrow heads indicate septum ingression. Scale bar, 200 nm.
Figure 2 with 2 supplements
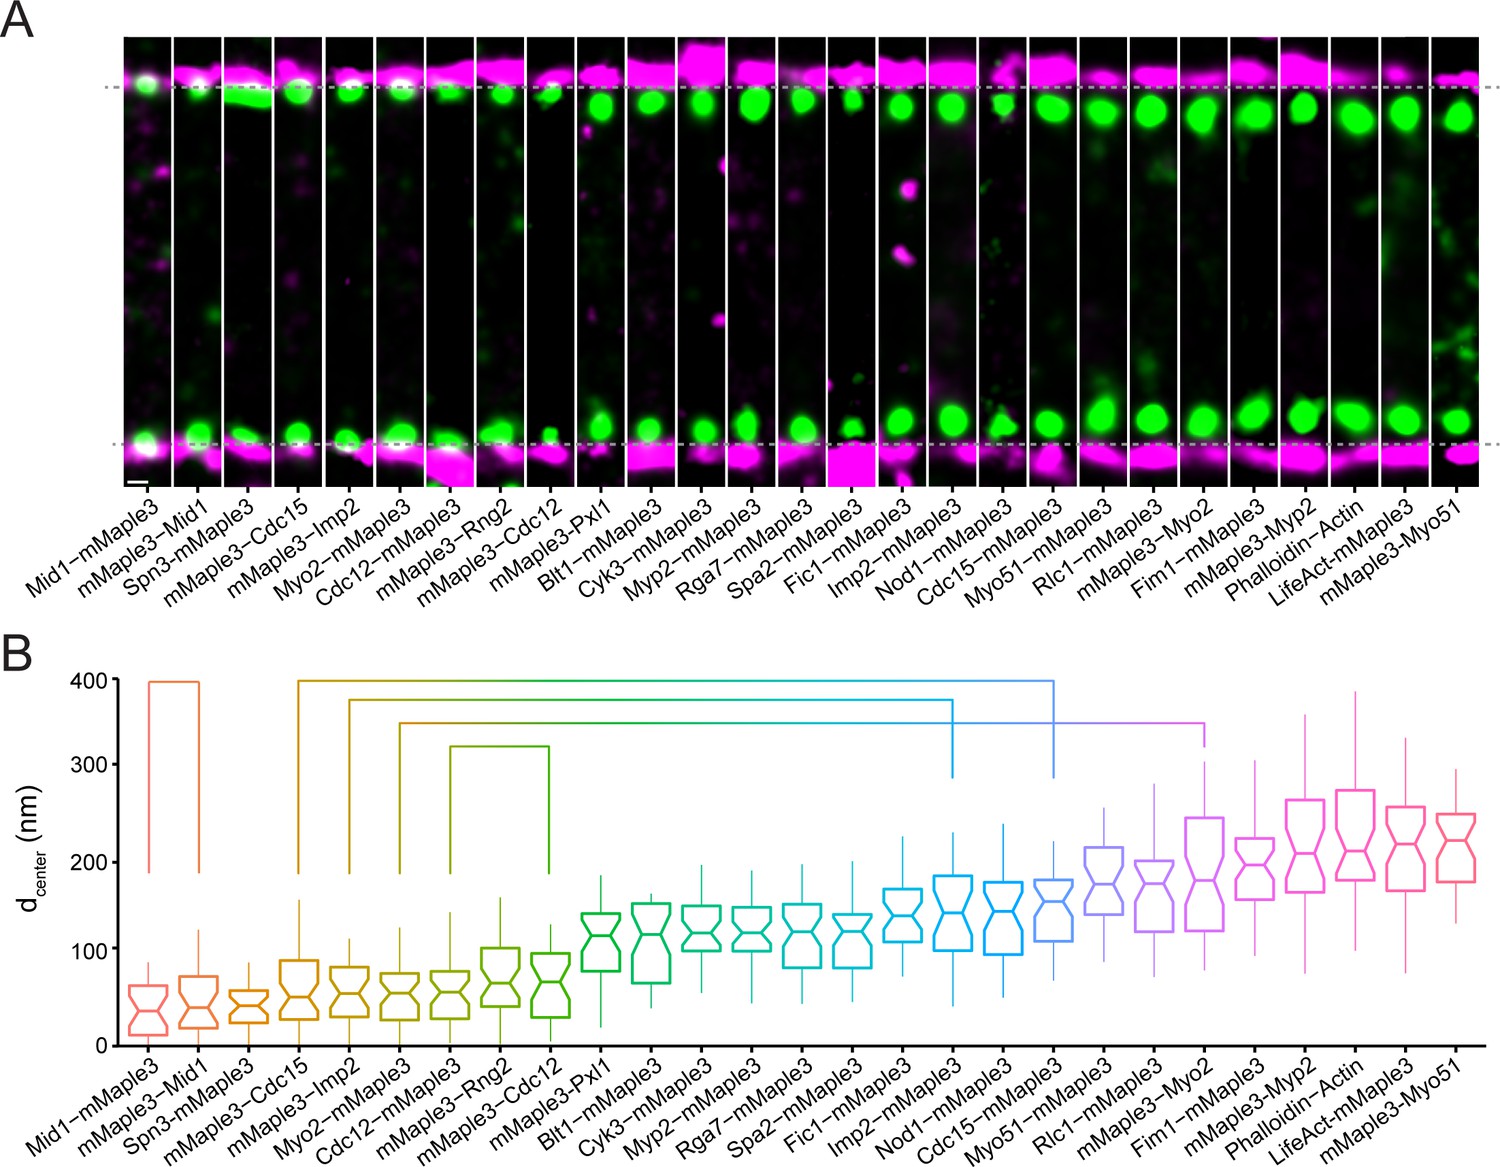
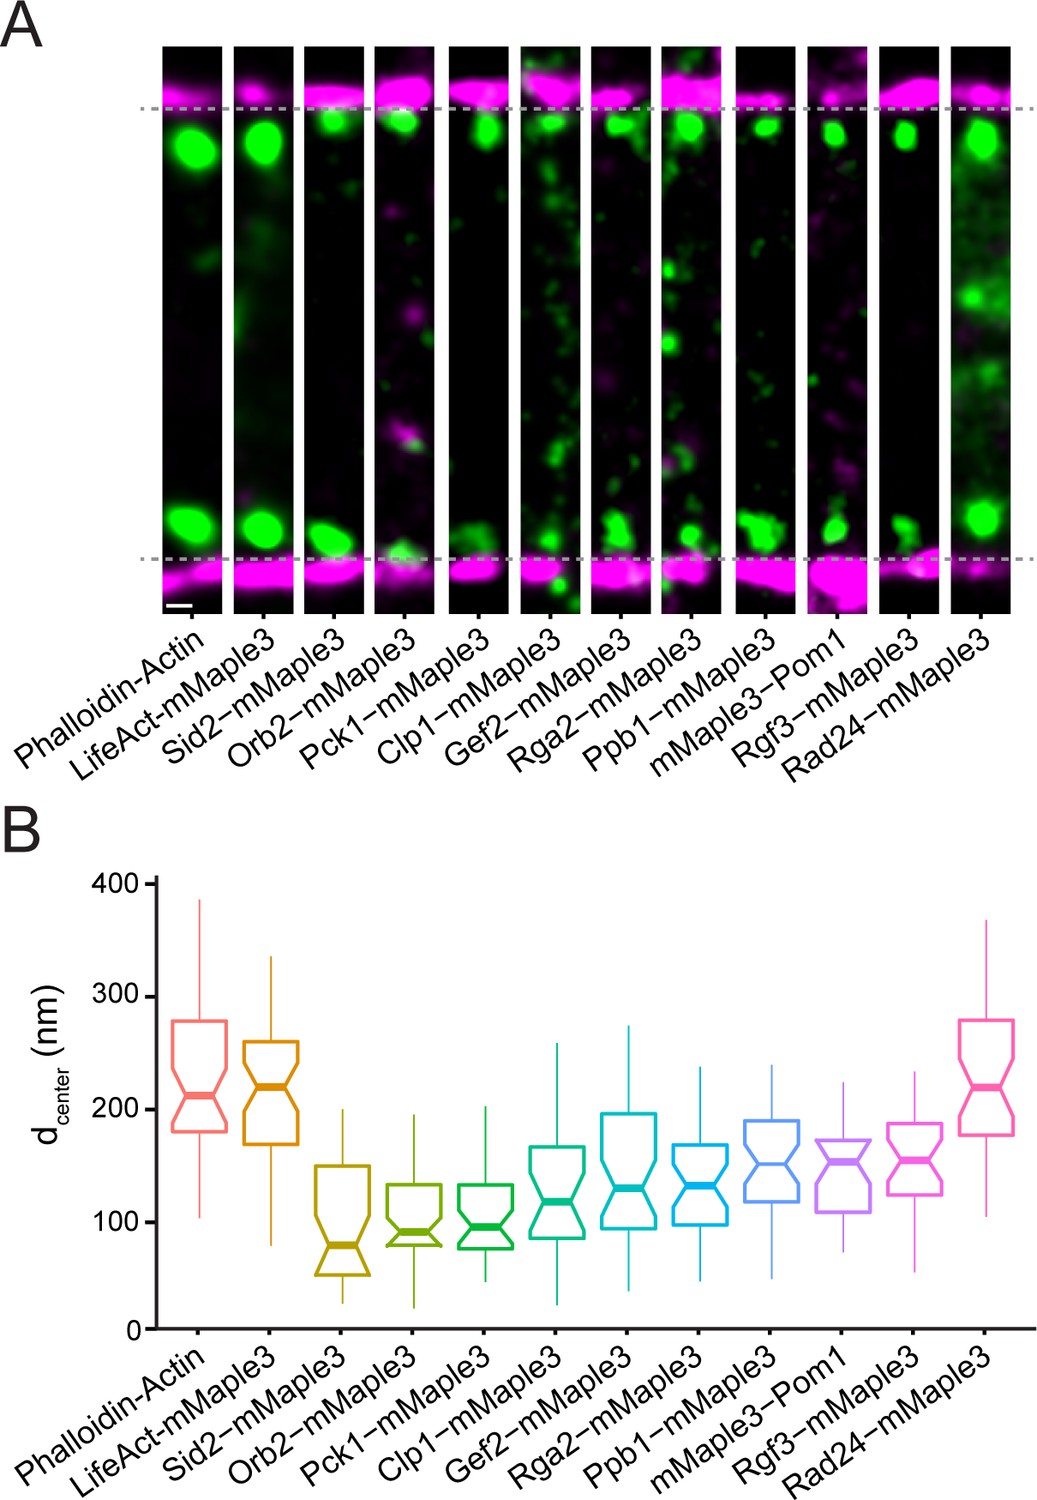
Nanoscale organization of contractile ring structural components.
(A) Representative fPALM images of structural contractile ring components. Scale, 100 nm. Particles are visualized as normalized Gaussians with standard deviation = localization uncertainty. Dashed lines indicate plasma membrane edges. (B) Distance from the plasma membrane (dcenter) of structural contractile ring components. Box plots depict 1st and 3rd quartiles and median; Whiskers, minimum and maximum; Notches, 95% confidence intervals. Lines connect proteins labeled on opposite termini.
Figure 2—figure supplement 1
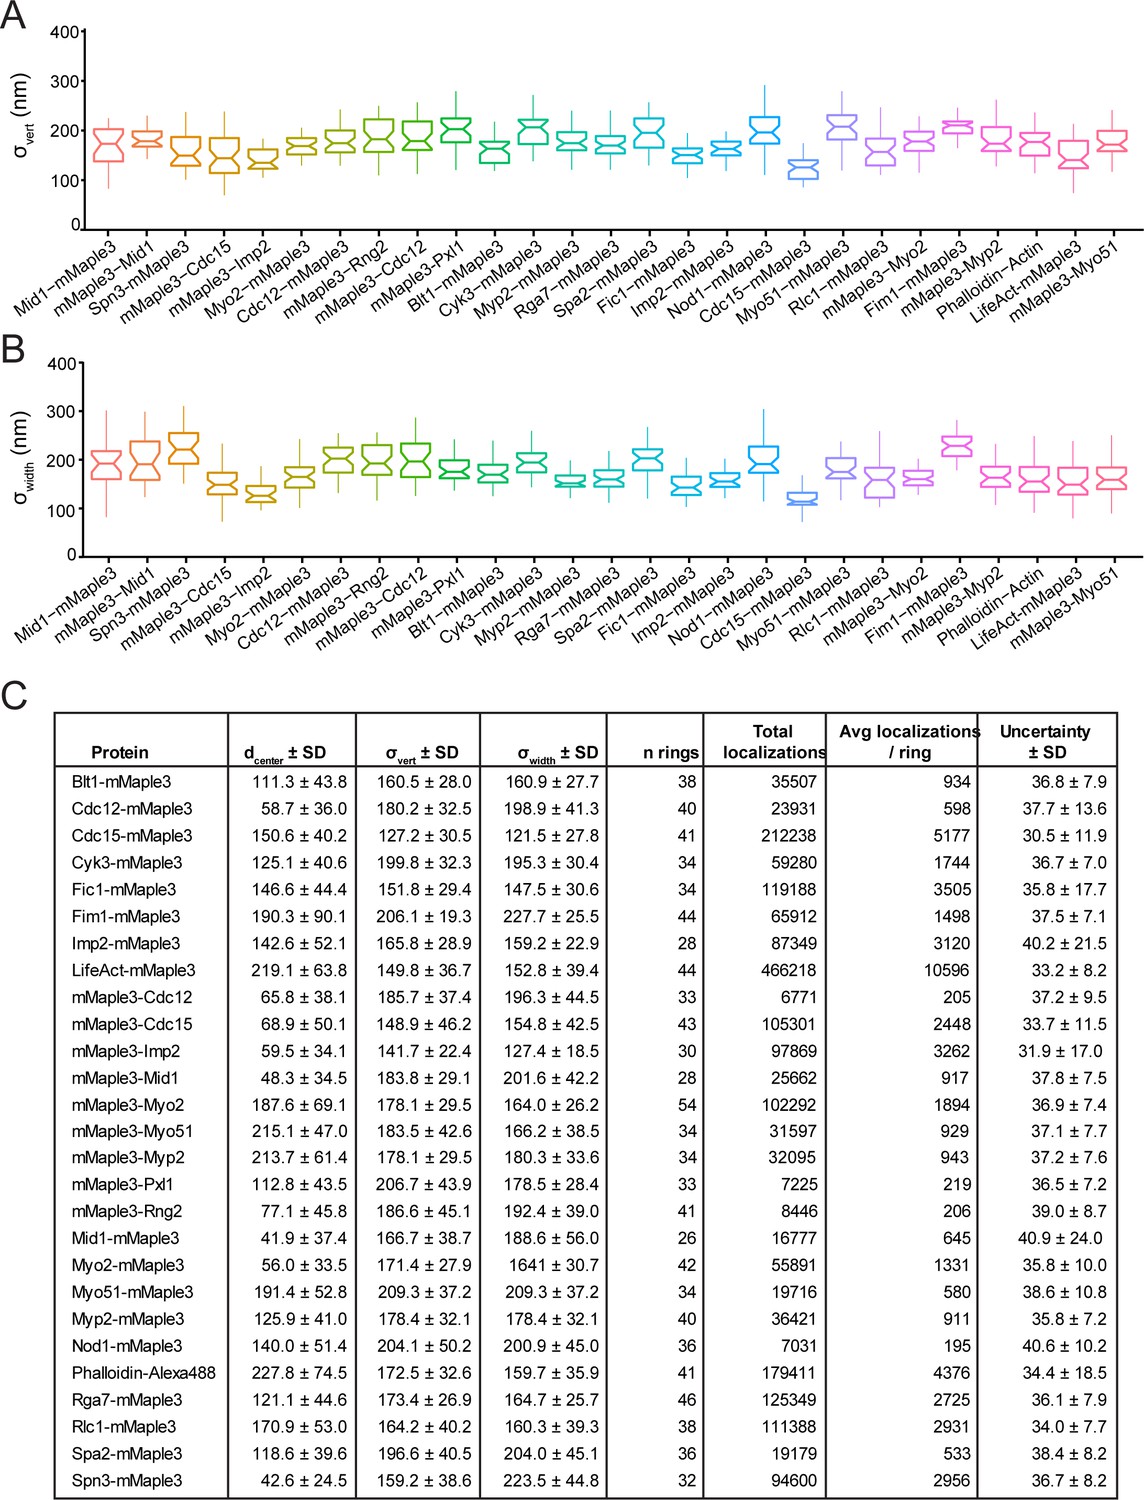
Vertical and horizontal width parameters (σvert and σwidth) and localization values for strains in Figure 2.
(A) Vertical width parameters (σvert) for structural contractile ring components in Figure 2. (B) Horizontal width parameters (σwidth) for structural contractile ring components in Figure 2. (C) Complete localization statistics for proteins in Figure 2.
Figure 2—figure supplement 2
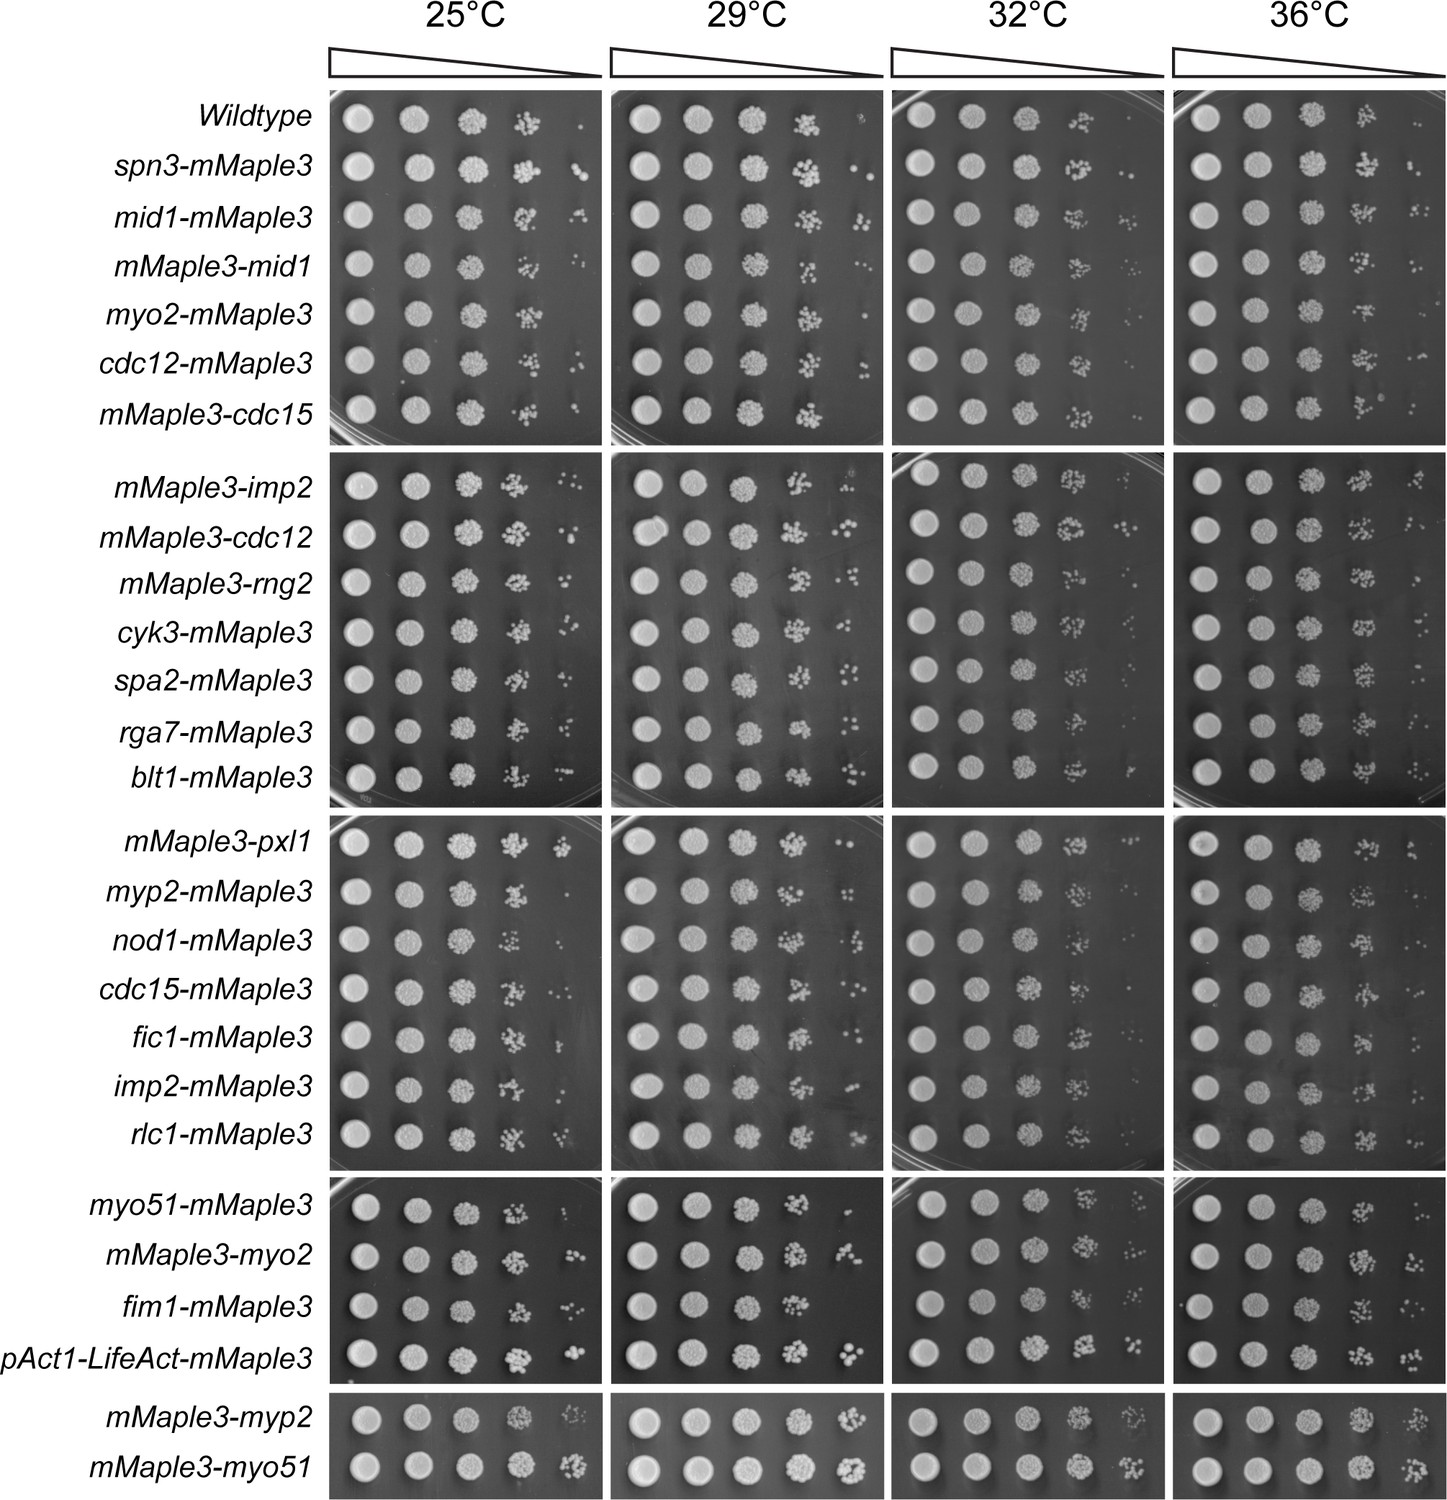
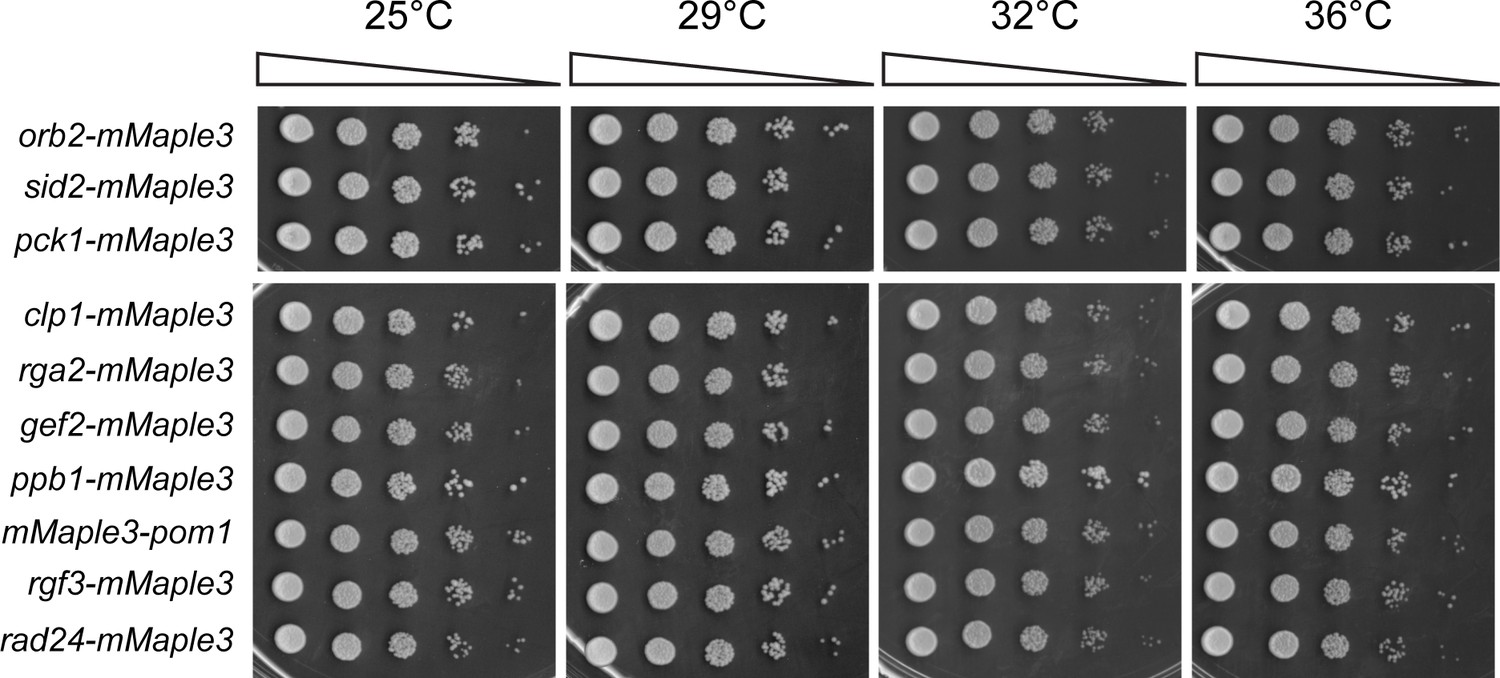
Endogenous mMaple3 tags do not perturb normal growth and division.
Serial dilutions of the strains used in Figure 2 were grown at the indicated temperatures.
Figure 3 with 2 supplements
Nanoscale organization of contractile ring signaling components.
(A) Representative fPALM images of signaling contractile ring components. Scale, 100 nm. Particles are visualized as normalized Gaussians with standard deviation = localization uncertainty. Dashed lines indicate plasma membrane edges. (B) Distance from the plasma membrane (dcenter) of signaling contractile ring components. Box plots depict 1st and 3rd quartiles and median; Whiskers, minimum and maximum; Notches, 95% confidence intervals.
Figure 3—figure supplement 1

Vertical and horizontal width parameters (σvert and σwidth) and localization values for strains in Figure 3.
(A) Vertical width parameters (σvert) for signaling contractile ring components in Figure 3. (B) Horizontal width parameters (σwidth) for signaling contractile ring components in Figure 3. (C) Complete particle statistics for proteins in Figure 3.
Figure 3—figure supplement 2
Endogenous mMaple3 tags do not perturb normal growth and division.
Serial dilutions of the strains used in Figure 3 were grown at the indicated temperatures.
Figure 4 with 1 supplement
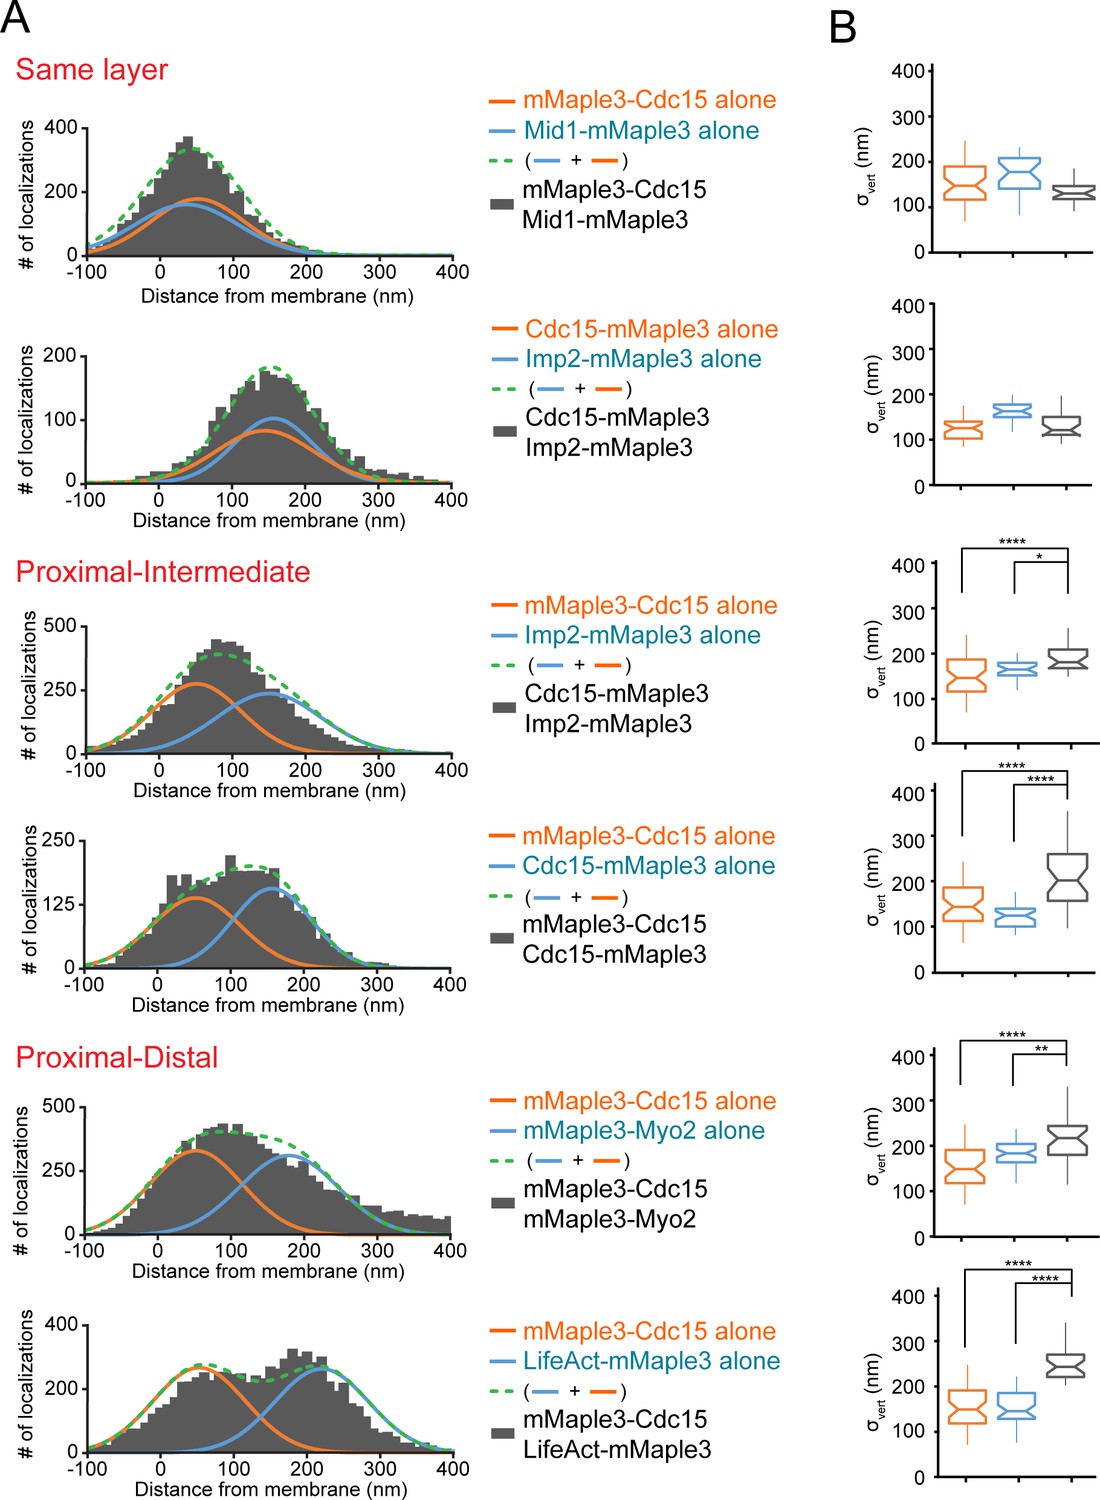
Distinguishing contractile ring layers with pairs of mMaple3-tagged proteins.
(A) Comparison of single mMaple3-tagged proteins in similar or disparate localizations in the contractile ring. Orange and blue lines represent average localization of individual proteins from Figures 2–3, while dashed green lines represent the theoretical localization of two individual proteins imaged simultaneously. Grey histograms depict actual localization data from the indicated dual mMaple3-tagged strains. (B) Comparison of σvert (localization spread) parameters between single and double tagged strains reveals wider peaks when two proteins are separated spatially. One way ANOVA tests were performed between the indicated samples. *p<0.05; **p<0.01; ****p<0.0001.
Figure 4—figure supplement 1
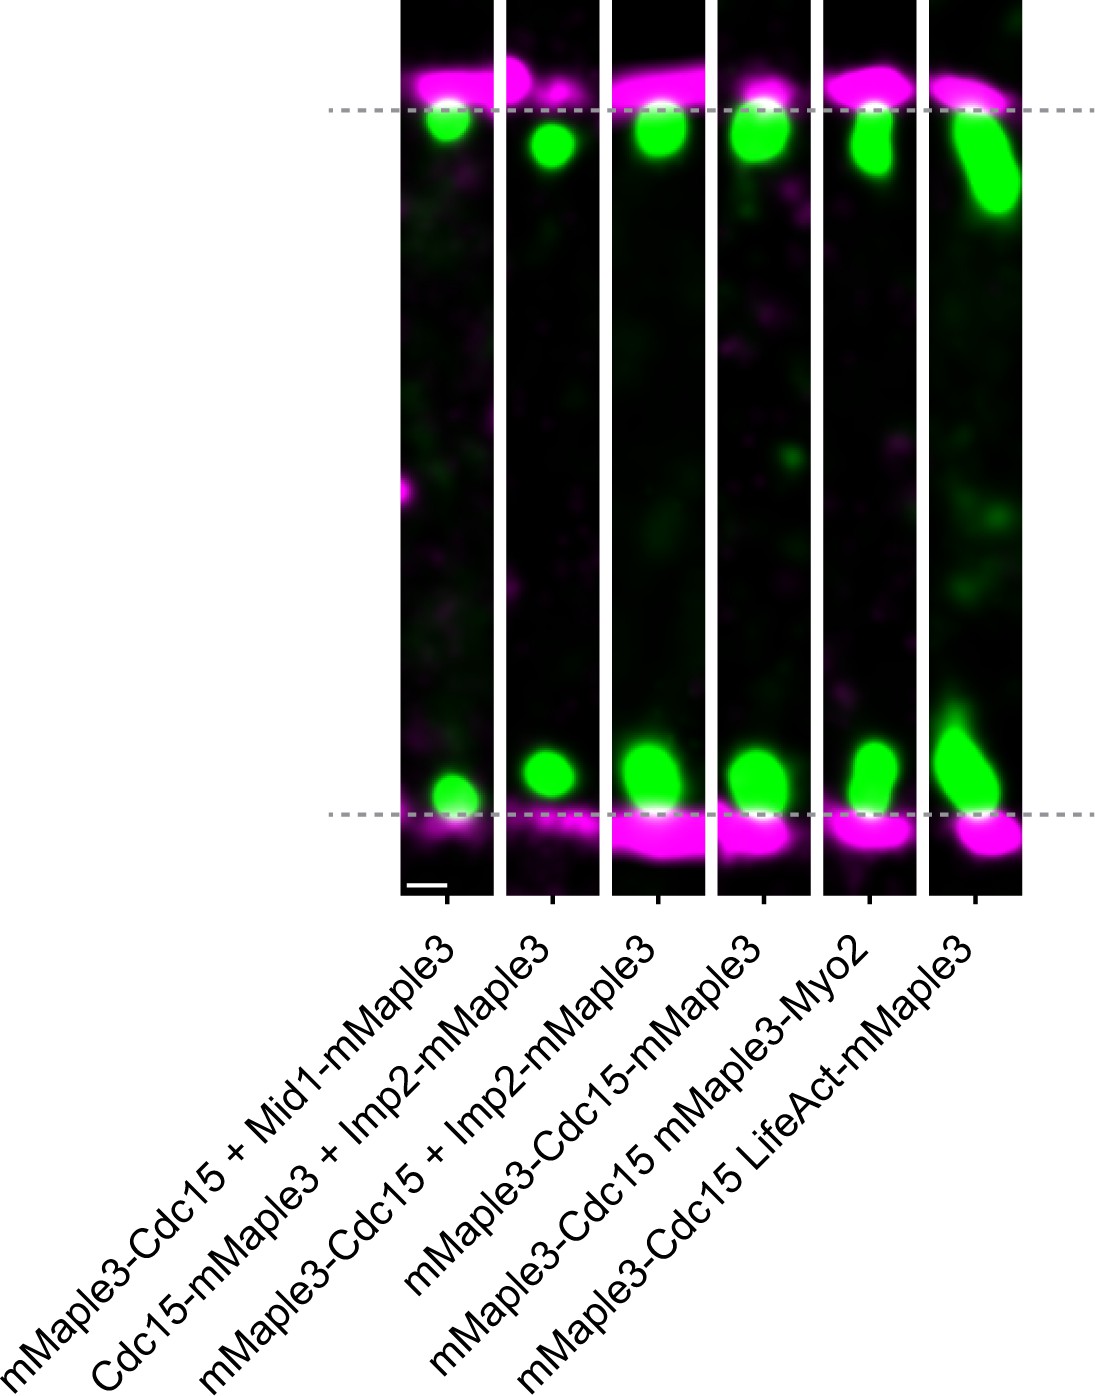
Visualizing pairs of mMaple3 tagged protein.
Representative f-PALM images of dual mMaple3-tagged strains. Particles are visualized as normalized Gaussians with standard deviation = localization uncertainty. Dashed lines indicate plasma membrane edges. Scale, 100 nm.
Figure 5 with 1 supplement

FRET confirms distinct layers around F-BAR proteins in the contractile ring.
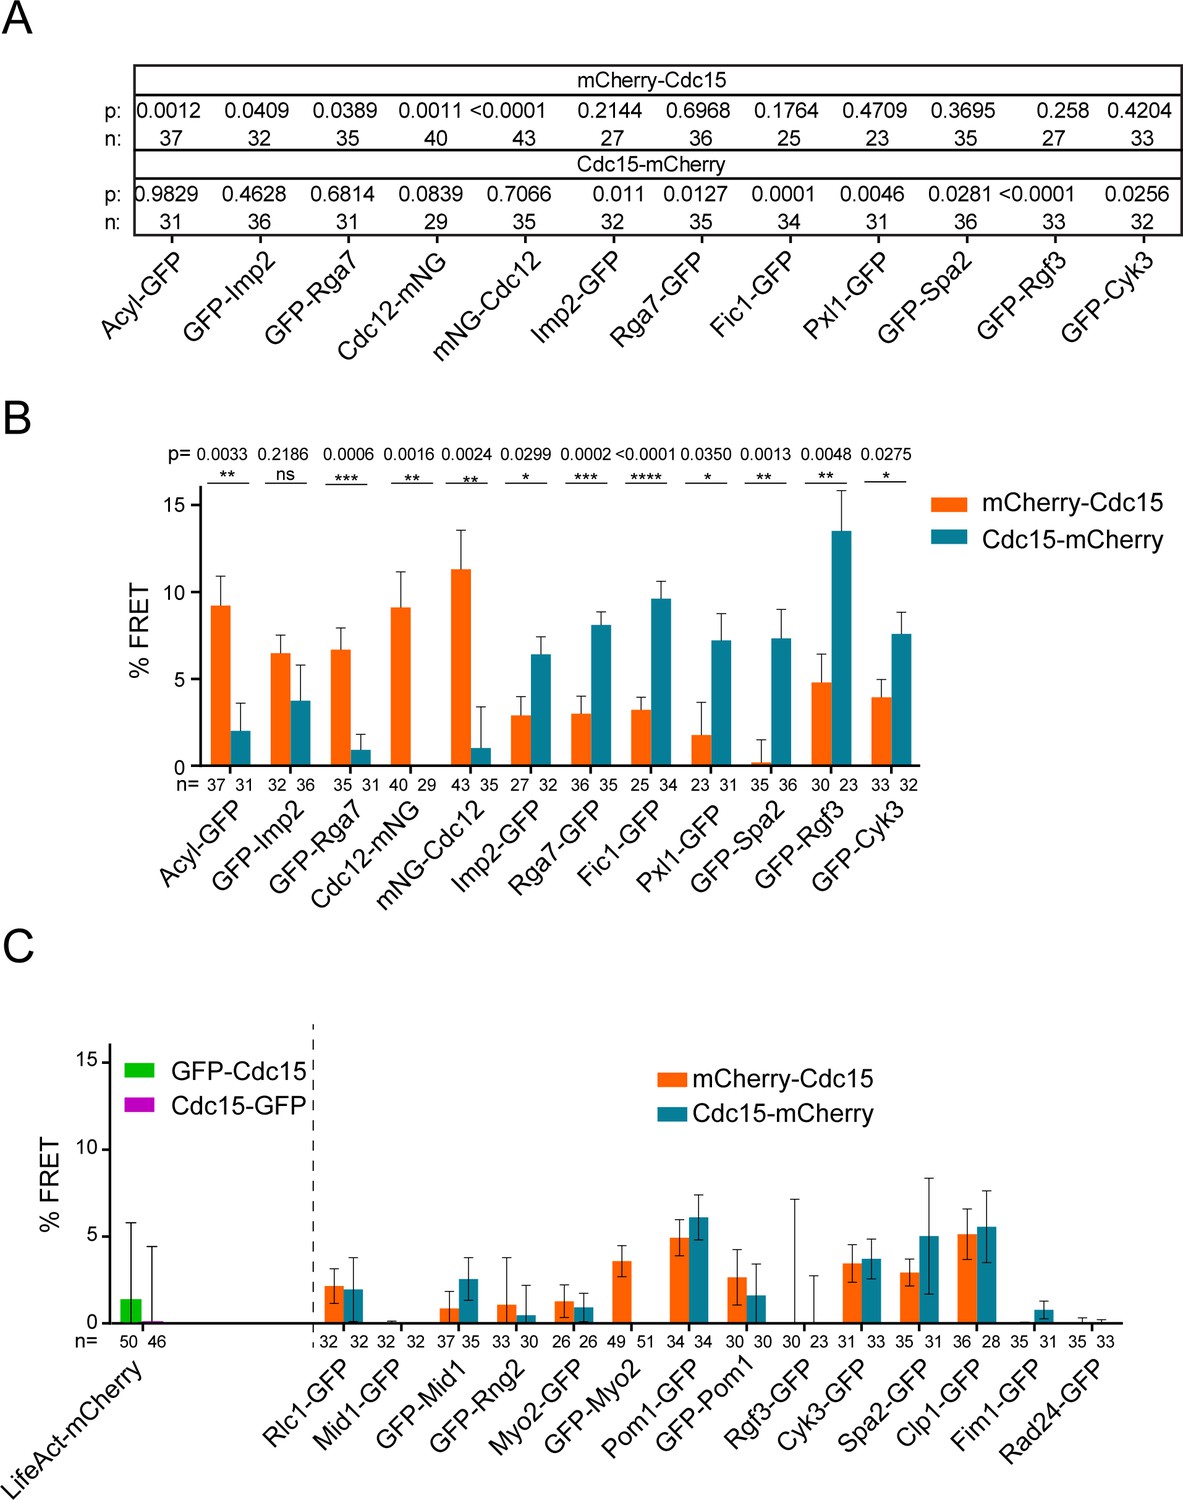
(A–B) Quantification of FRET between mCherry-Cdc15 (A) or Cdc15-mCherry (B) and GFP- or mNG-conjugated contractile ring components. See also Figure 5—figure supplement 1 for direct mCherry-Cdc15:Cdc15-mCherry comparisons. % FRET is the increase in GFP donor signal following mCherry acceptor photobleaching. One way ANOVA tests were performed for each strain against an Rlc1-GFP negative control. *p<0.05; **p<0.01; ***p<0.001; ****p<0.0001. (C–D) Cdc12-mNG and Fic1-GFP FRET signals at the contractile ring are specific to mCherry-Cdc15 (C) or Cdc15-mCherry (D). Scale = 4 µm.
Figure 5—figure supplement 1
Intermolecular FRET experiments.
(A) Statistics for data in Figure 5A–B. A one way ANOVA test was performed between each GFP strain and an Rlc1-GFP negative control and uncorrected p values are reported. (B) Comparison of FRET between mCherry-Cdc15 and Cdc15-mCherry combinations. The reported p values are from Fisher’s exact tests performed between mCherry-Cdc15 and Cdc15-mCherry conditions. (C) mCherry-Cdc15 and Cdc15-mCherry, as well as GFP-Cdc15 and Cdc15-GFP FRET combinations tested without significant FRET signals (ANOVA tests were performed versus the Rlc1-GFP negative control; all p’s >> 0.05).
Figure 6
Lateral organization of components in the contractile ring.
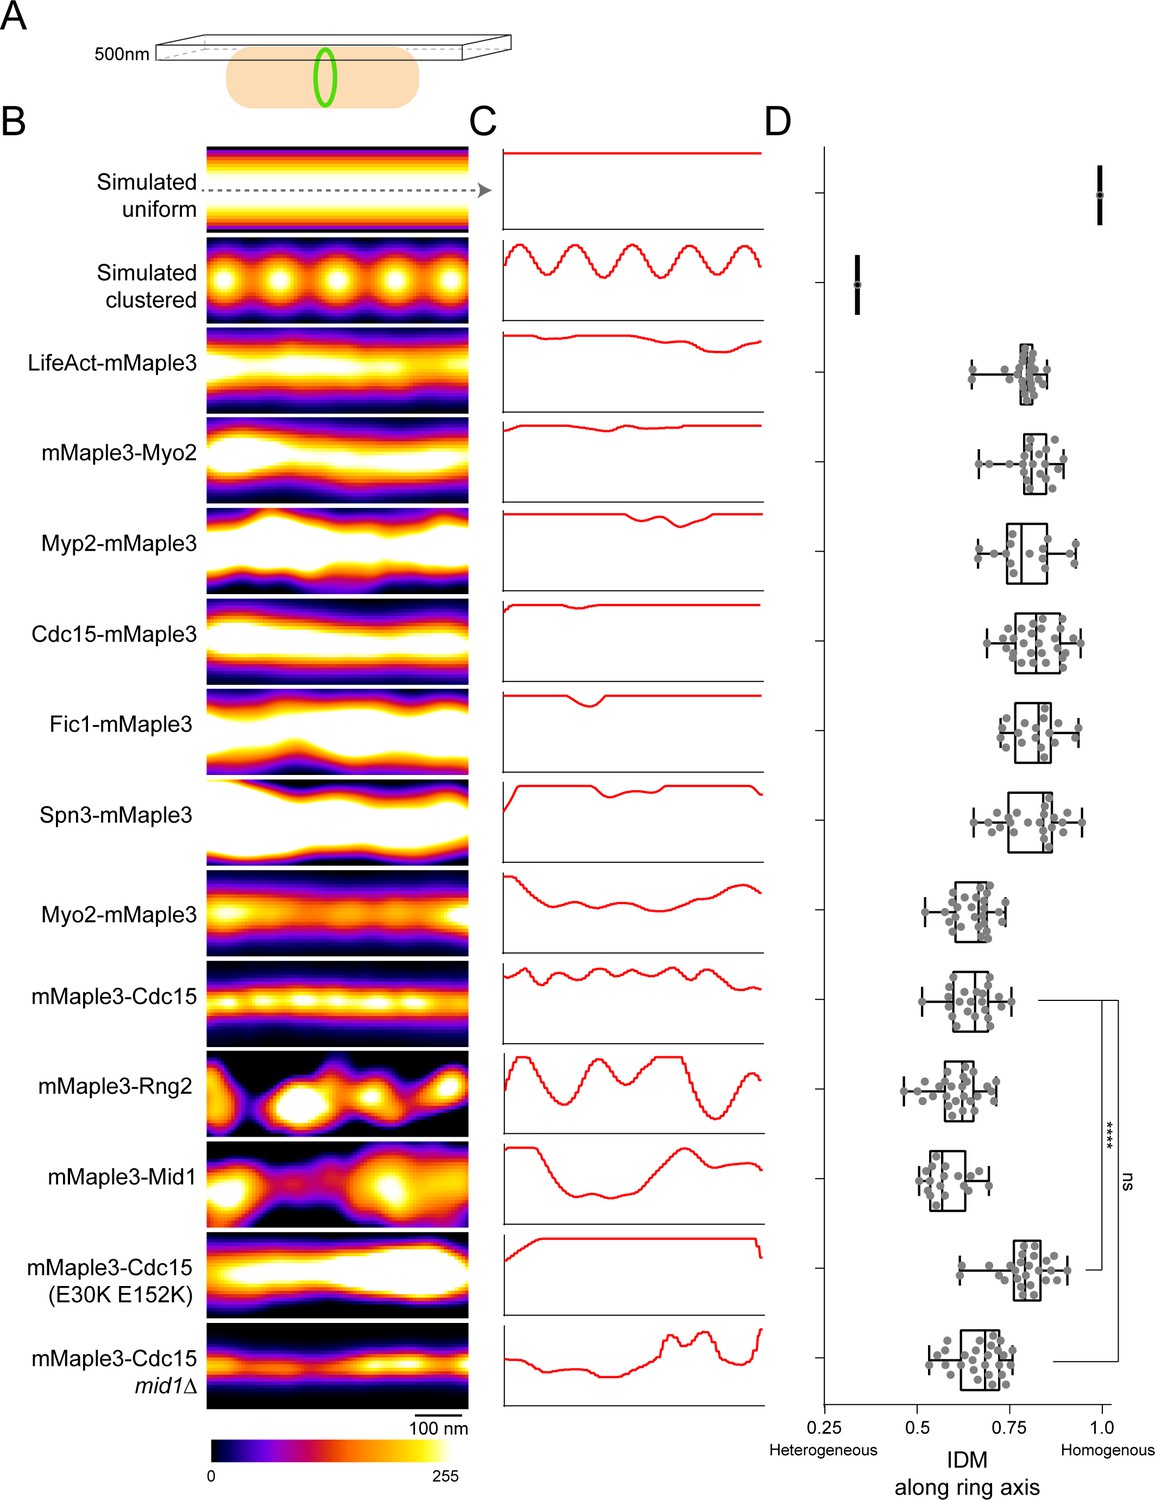
(A) Schematic of fPALM setup with Z focus at the top of cells. (B) Representative fPALM image of the top of contractile rings with the indicated components labeled. Simulated clustered or smooth ring examples are included for comparison. (C) Linescans through the center of images in (A). (C) Quantification of the Inverse Difference Moment (IDM) of a grey level co-occurance matrix along the contractile ring’s circumferential axis. IDM is a measure of local homogeneity, see Materials and methods. Lines indicate a one way ANOVA performed against mMaple3-Cdc15; ****p<0.0001.
Figure 7
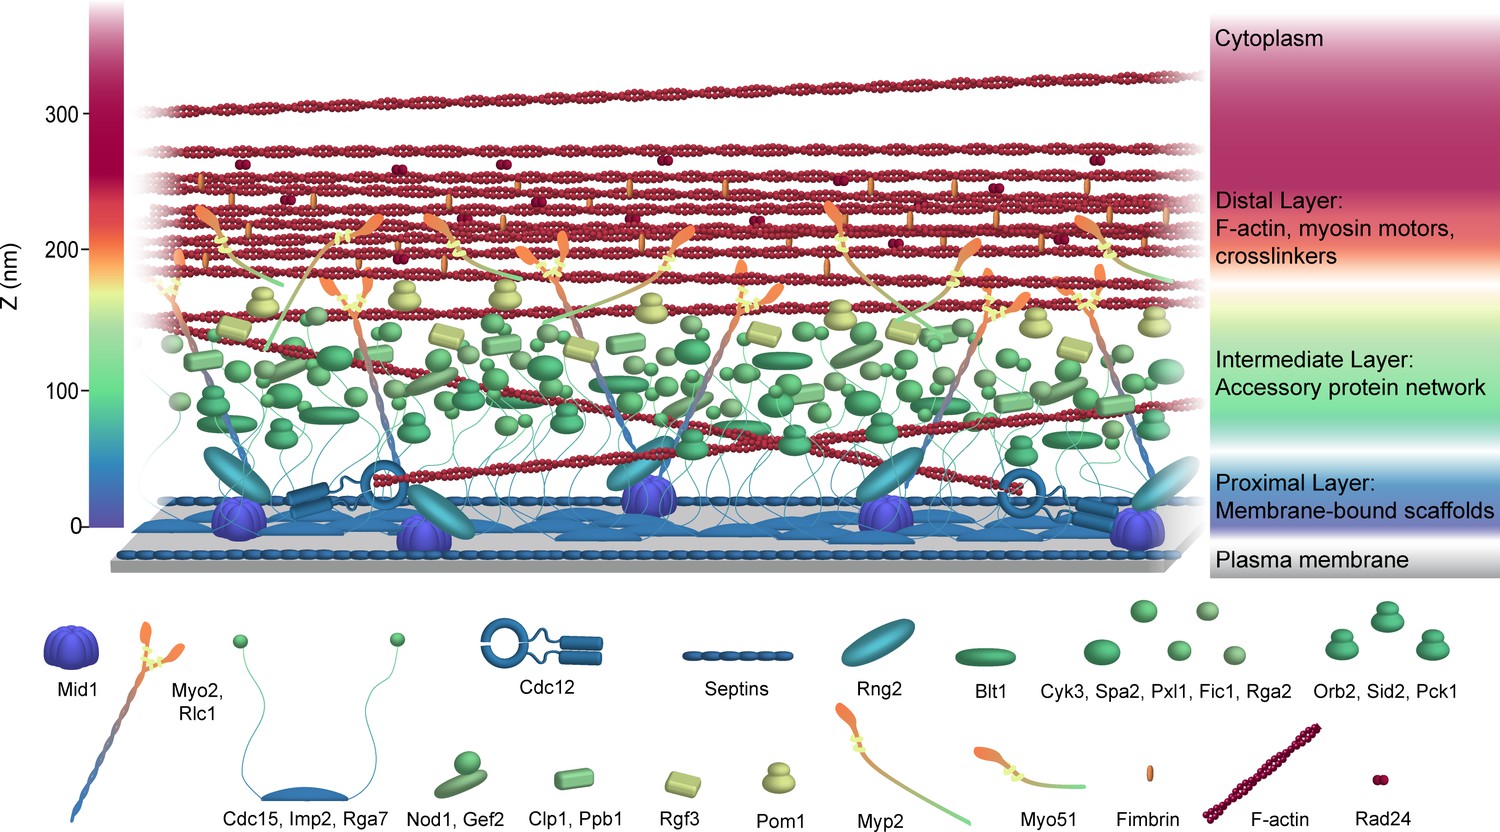
Schematic model of the S. pombe contractile ring molecular architecture.
Depicted protein positions were calculated experimentally and are color-coded in the Z dimension. Note that this model does not incorporate stoichiometry. See also Video 1.
Videos
Video 1
Animated schematic model of the S. pombe contractile ring molecular architecture.
Depicted protein positions were calculated experimentally and are color-coded in the Z dimension. Note that this model does not incorporate stoichiometry.
Additional files
-
Supplementary file 1
S. pombe strains used in this study.
- https://doi.org/10.7554/eLife.28865.017
-
Transparent reporting form
- https://doi.org/10.7554/eLife.28865.018
Download links
A two-part list of links to download the article, or parts of the article, in various formats.
Downloads (link to download the article as PDF)
Open citations (links to open the citations from this article in various online reference manager services)
Cite this article (links to download the citations from this article in formats compatible with various reference manager tools)
Nanoscale architecture of the Schizosaccharomyces pombe contractile ring
eLife 6:e28865.
https://doi.org/10.7554/eLife.28865


