Luqin-like RYamide peptides regulate food-evoked responses in C. elegans
- Graduate School of Science, The University of Tokyo, Japan
- National Cerebral and Cardiovascular Center Research Institute, Japan
- Institute of Life Sciences, Kurume University, Japan
- Frontier Science Research Center, University of Miyazaki, Japan
- University of Miyazaki, Japan
Figures
Figure 1 with 2 supplements
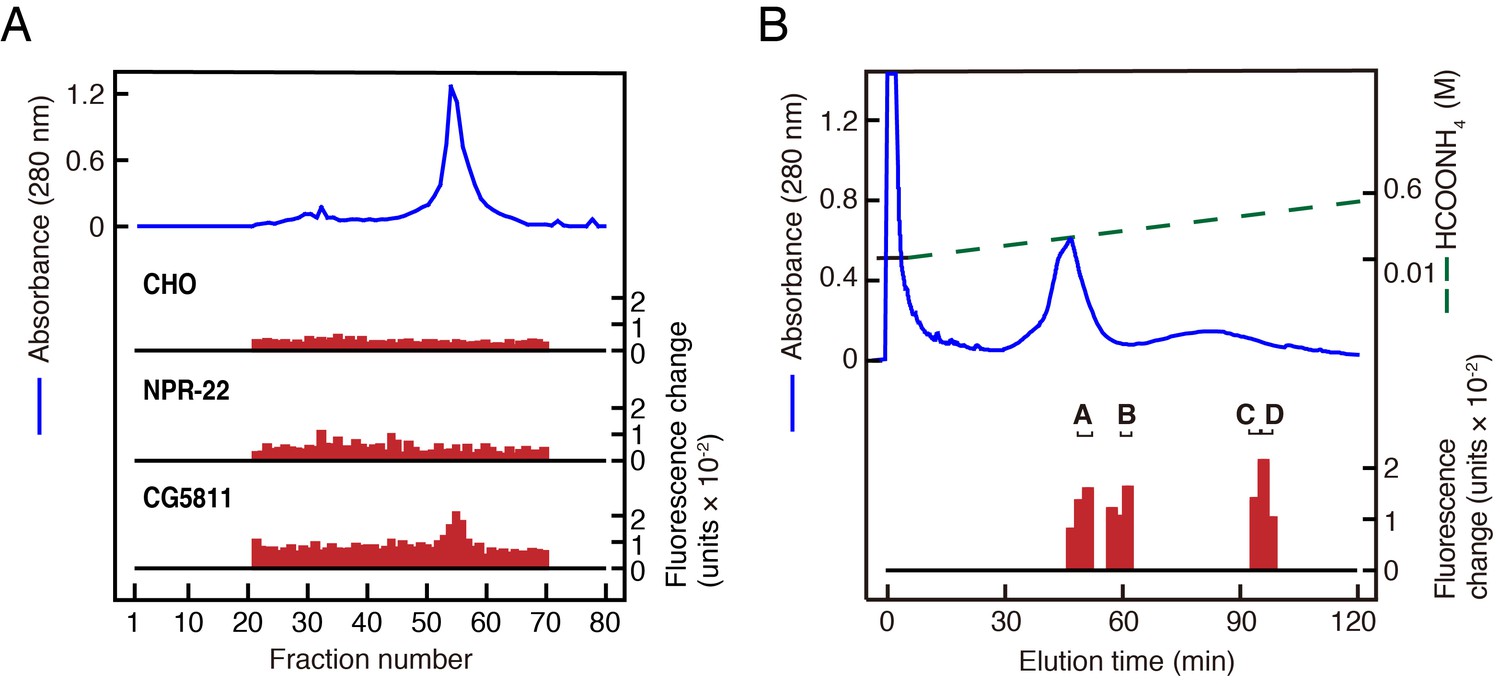
Purification of LURY-1 peptides.
(A) Gel filtration on Sephadex G-50 (fine) of the SP-III fraction obtained from C. elegans. Red bars indicate fluorescence changes owing to [Ca2+]i increase in receptor expressing cells. (top) Non-transfected CHO cells. (middle) CHO-NPR-22a cells. (bottom) CHO-CG5811 cells. The amount of worm extracts in each [Ca2+]i assay was approximately equivalent to that from 20 mg (top, middle) or 2 mg (bottom) frozen weight of C. elegans. (B) CM-HPLC (pH 6.5) of the active fractions on the gel filtration. Red bars indicate [Ca2+]i changes in CHO-CG5811 cells. Active fractions that were further fractionated are depicted as A to D. (A, B) Blue lines indicate total protein content in each fraction as measured by absorbance at 280 nm.
Figure 1—figure supplement 1
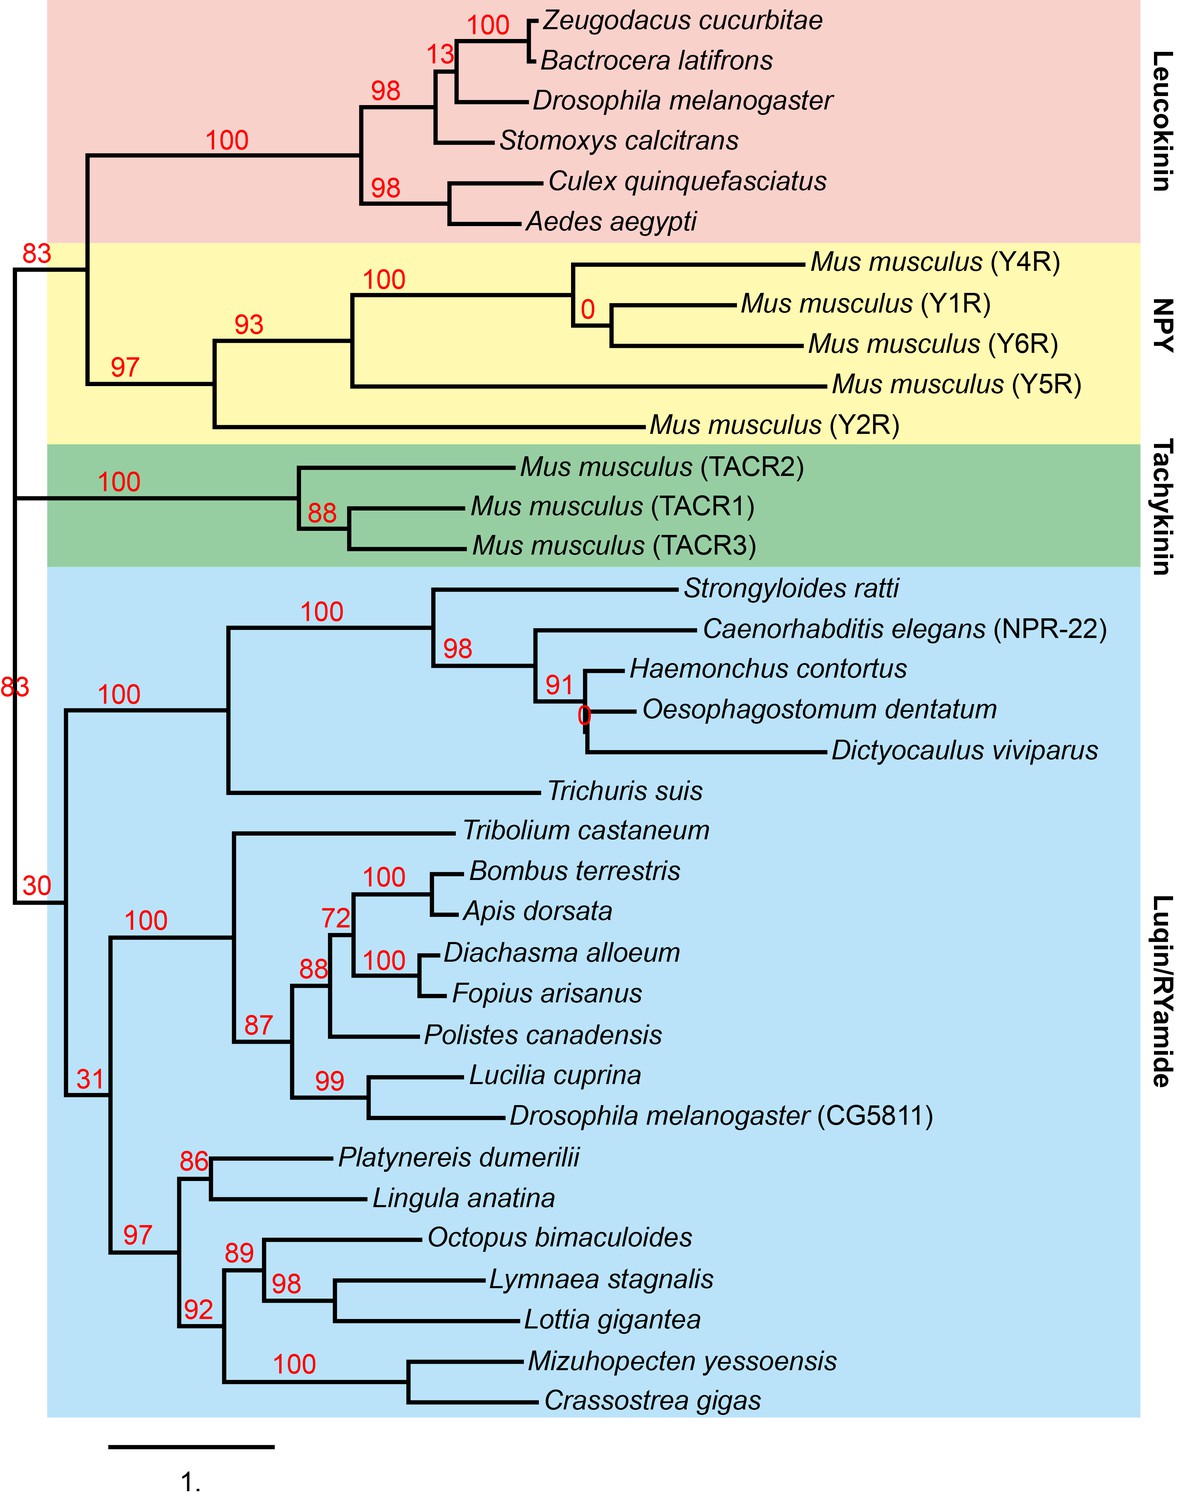
Phylogenetic analysis of C. elegans NPR-22 with neuropeptide GPCRs.
Phylogenetic tree constructed by Maximum likelihood analysis using the ‘One Click’ mode (without Gblocks) on the online Phylogeny.fr platform (http://www.phylogeny.fr/, Dereeper et al., 2008). The numbers next to the nodes are branch support values. The accession numbers of the sequences used in this analysis are: Zeugodacus cucurbitae, XP_011182823.1; Bactrocera latifrons, XP_018786122.1; Drosophila melanogaster, NM_139711.3; Stomoxys calcitrans, XP_013116217.1; Culex quinquefasciatus, XP_001862450.1; Aedes aegypti, AAT95982.1; Mus musculus Y4R, NP_032945.3; Mus musculus Y1R, NP_035064.1; Mus musculus Y6R, Q61212.1; Mus musculus Y5R, NP_057917.2; Mus musculus Y2R, NP_032757.2; Mus musculus TACR2, AAI06960.1; Mus musculus TACR1, EDK99033.1; Mus musculus TACR3, EDL12172.1; Strongyloides ratti, CEF70748.1; Caenorhabditis elegans NPR-22, NP_001023540; Haemonchus contortus, CDJ93635.1; Oesophagostomum dentatum, KHJ95408.1; Dictyocaulus viviparous, KJH45375.1; Trichuris suis, KFD65303.1; Tribolium castaneum RYamide receptor, ADZ17181; Bombus terrestris, XP_020721062.1; Apis dorsata, XP_006608028.1; Diachasma alloeum, XP_015108325.1; Fopius arisanus, XP_011313674.1; Polistes canadensis, XP_014599240.1; Lucilia cuprina, KNC20611.1; Drosophila melanogaster CG5811, NP_524525; Platynereis dumerilii luqin receptor, AKP24072.1; Lingula anatine, XP_013402794.1; Octopus bimaculoides, XP_014786450.1; Lymnaea stagnalis luqin receptor, AAB92258.1; Lottia gigantea, XP_009060304.1; Mizuhopecten yessoensis, OWF56520.1; Crassostrea gigas, XP_011456887.1.
Figure 1—figure supplement 2
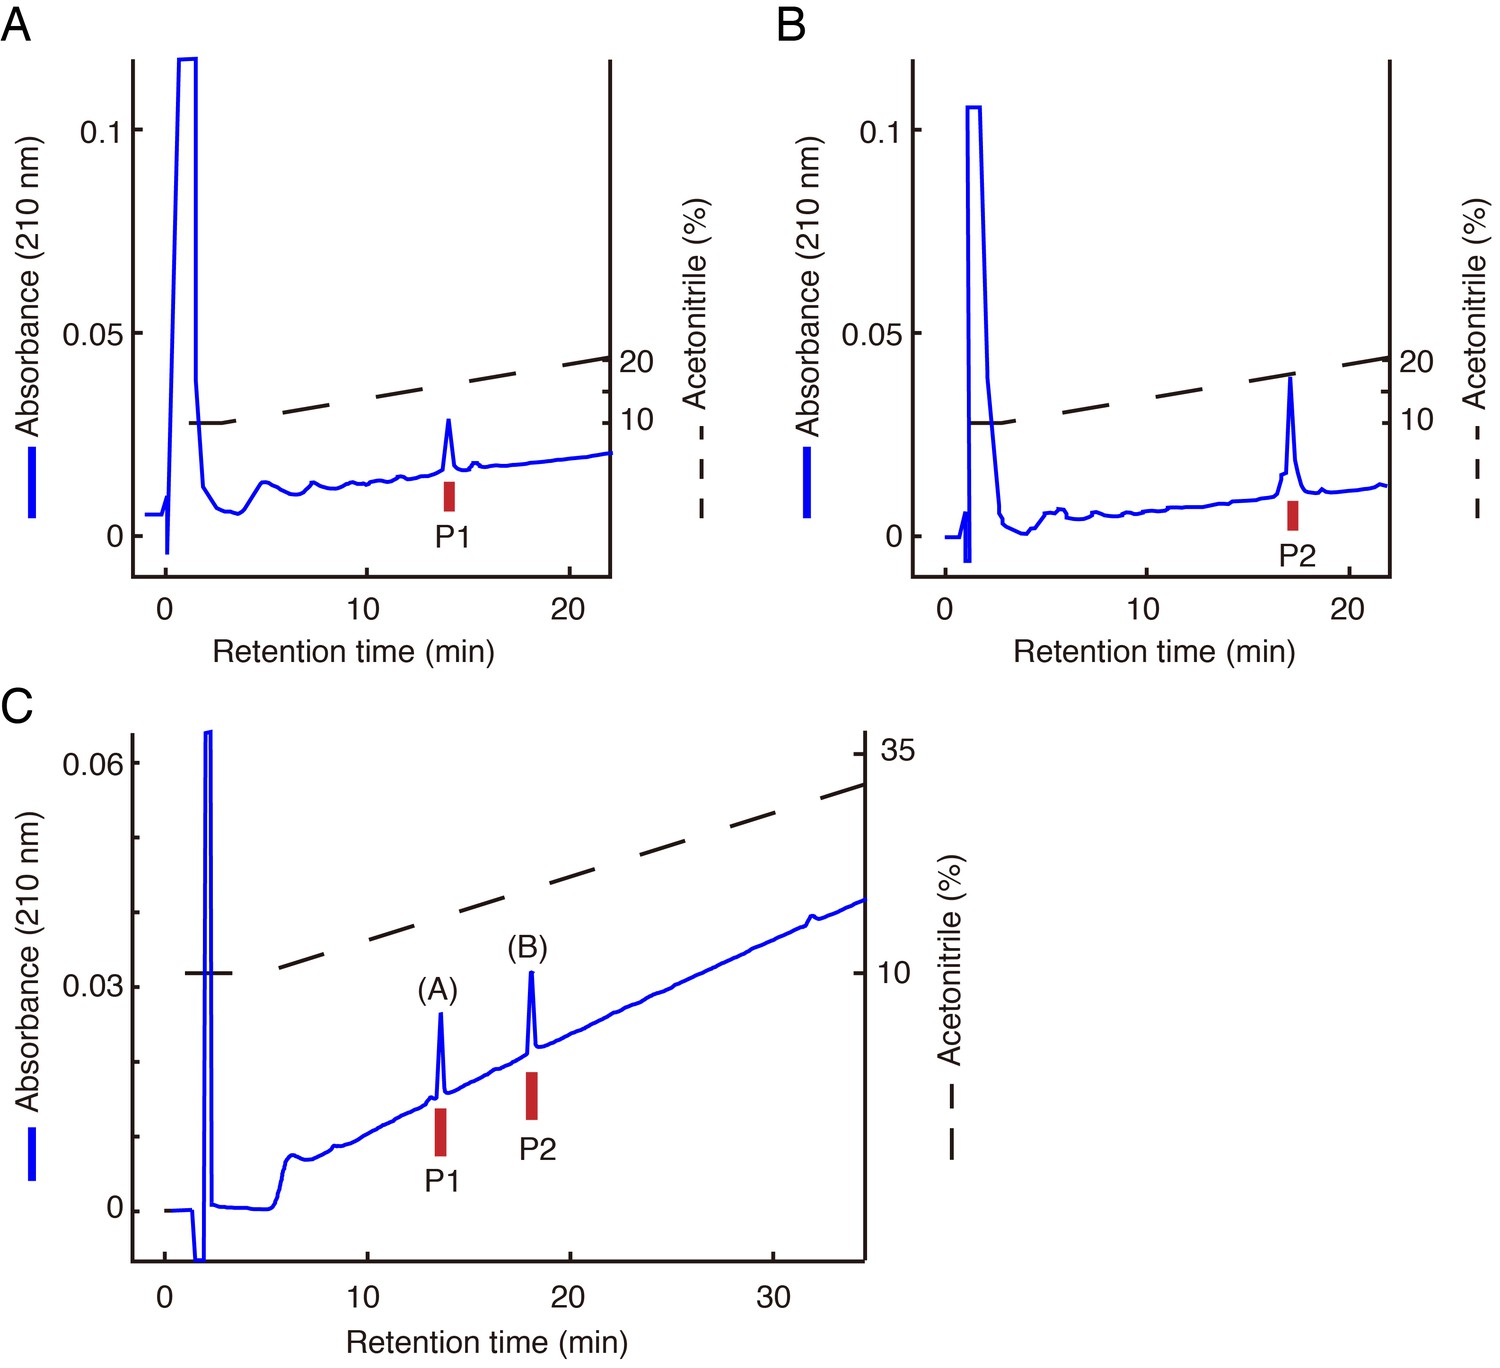
Identification of LURY-1 peptides.
(A, B) Final purification of the active peptides P1 (A) and P2 (B) from fraction A on CM-HPLC at pH 6.5. (C) Chromatographic comparison using RP-HPLC of natural LURY-1 peptides and synthetic LURY-1 peptides. Each peptide was applied to a Symmetry C18 column with a linear gradient elution for 80 min. Synthetic LURY-1 peptides represent identical retention time to natural peptides, P1 and P2. (A): synthetic LURY-1-2. (B): synthetic LURY-1-1. (A–C) Red bars indicate [Ca2+]i change in CHO-CG5811 cells.
Figure 2 with 1 supplement
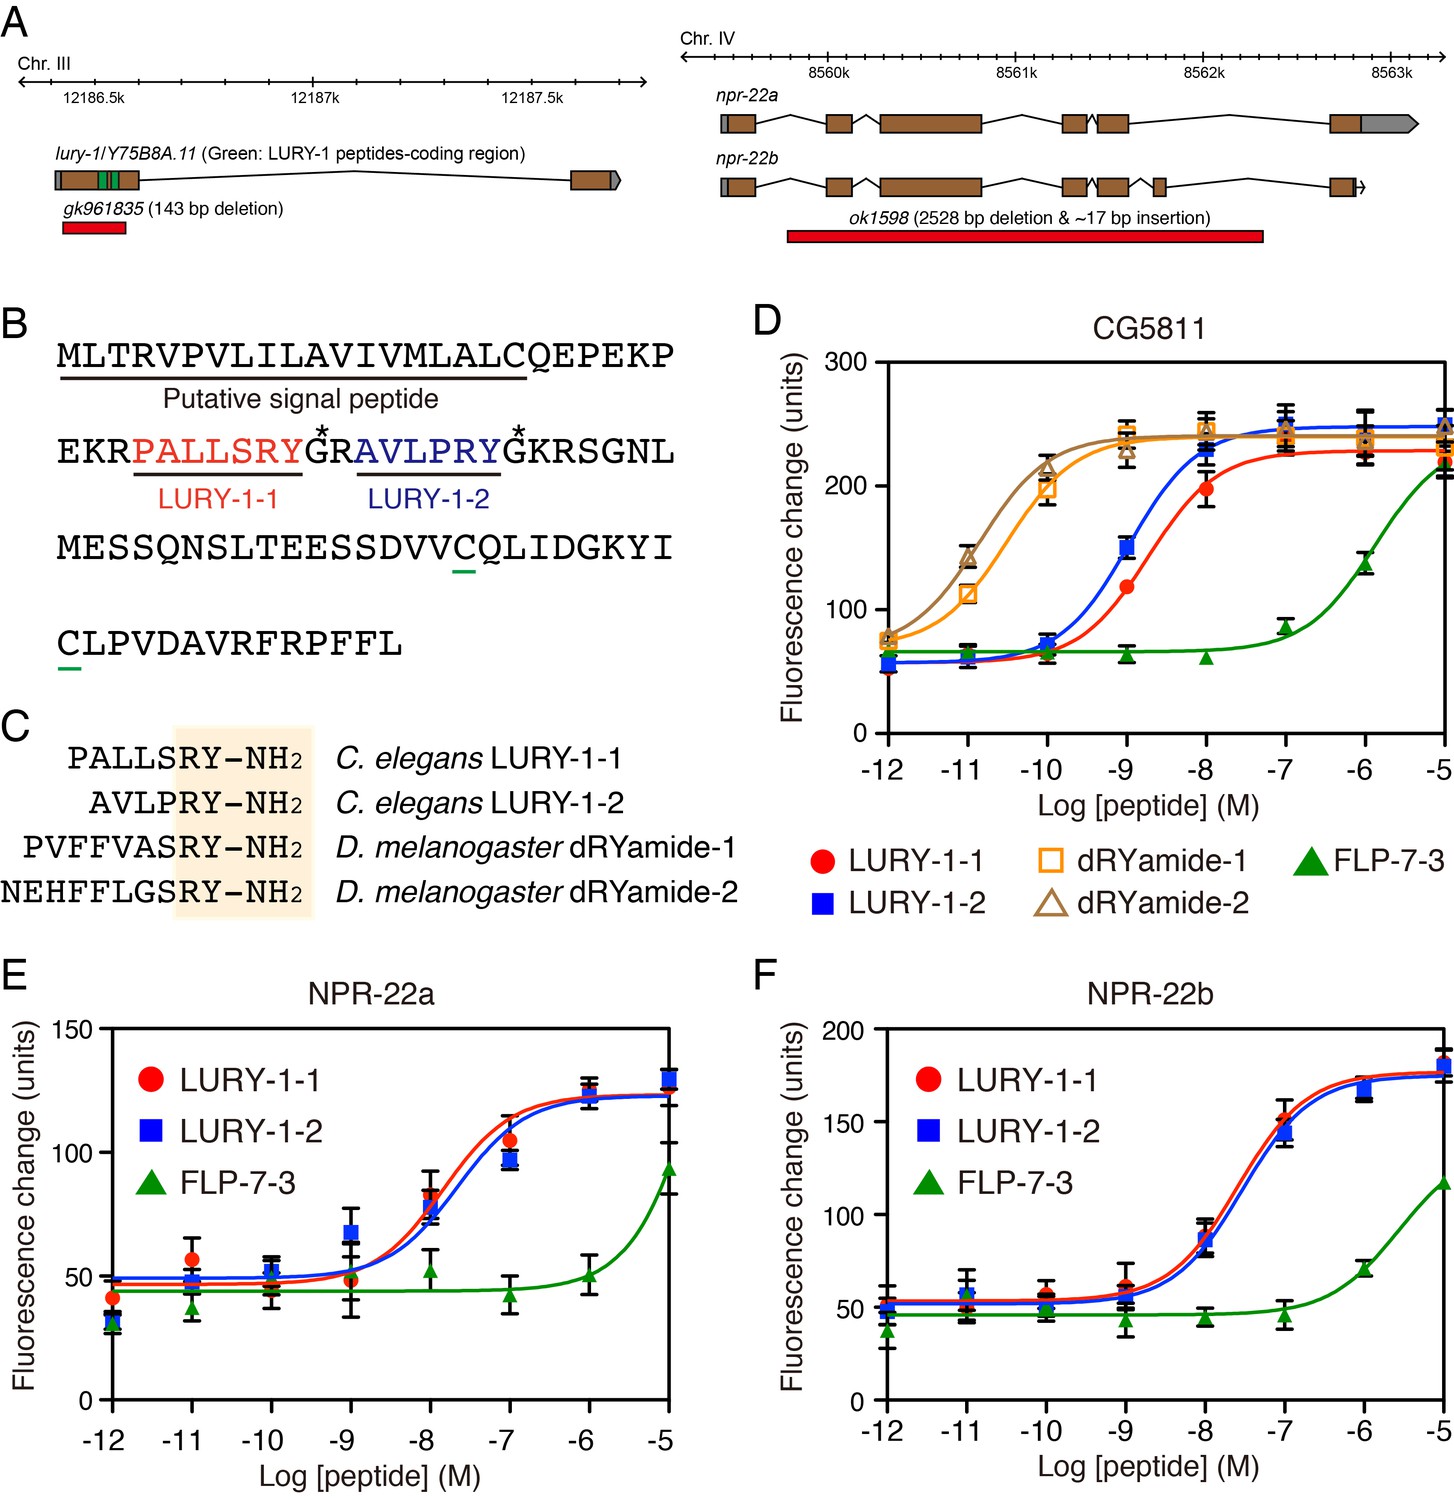
LURY-1 peptides are potent ligands for NPR-22.
(A) Genomic organization of the lury-1/Y75B8A.11 (left) and npr-22 (right) loci and the lesions in mutant alleles. (B) Amino acid sequences of LURY-1-1 (red) and LURY-1-2 (blue) in the LURY-1 prepropeptide. lury-1 encodes an 89-residue peptide. The asterisks show glycine residues, which serve as amide donors for C-terminal amidation. The green underlines show cysteine residues which are conserved among propeptides of the luqin family. (C) Sequences comparison of C. elegans LURY-1 peptides and Drosophila dRYamides. RYamide structures conserved between the peptides are shaded. (D) Pharmacological characterization of synthetic peptides using CG5811 stably expressed in CHO cells. Dose-response relationships of changes in [Ca2+]i for LURY-1-1 (red), LURY-1-2 (blue), dRYamide-1 (orange), dRYamide-2 (brown), and FLP-7-3 (green) in CHO-CG5811 cells. (E, F) Pharmacological characterization of synthetic peptides using the A isoform (E) and the B isoform (F) of C. elegans NPR-22 stably expressed in CHO cells. Dose-response relationships of changes in [Ca2+]i for LURY-1-1 (red), LURY-1-2 (blue), and FLP-7-3 (green) in CHO-NPR-22a/b cells. Data points are means ±S.E.M. of 6 replicates for each experiment.
Figure 2—figure supplement 1

Pharmacological characterization of synthetic peptides.
(A, B) Responses to synthetic peptides in CHO cells transiently expressing Drosophila CG5811. Dose-response relationships of changes in [Ca2+]i for (A) dRYamide-1, dRYamide-2 and (B) LURY-1-1, LURY-1-2 in CHO-CG5811 cells. Neither dRYamides nor LURY-1 peptides induced a response in CHO cells transfected with vector alone (Mock). EC50: dRYamide-1, 4.50 × 10⁻¹¹ M; dRYamide-2, 1.30 × 10⁻¹¹ M; LURY-1-1, 3.66 × 10⁻⁸ M; LURY-1-2, 7.34 × 10⁻⁹ M. (C) Responses to synthetic peptides in CHO cells stably expressing the A isoform of C. elegans NPR-22. Dose-response relationships of changes in [Ca2+]i for LURY-1-1 and LURY-1-2 in CHO-NPR-22a cells. Each RFamide-containing peptide purified from C. elegans extracts had no effect on CHO-NPR-22a cells. EC50: LURY-1-1, 3.05 × 10⁻⁸ M; LURY-1-2, 2.07 × 10⁻⁸ M. (A–C) Data points are means ±S.E.M. of triplicates for each experiment.
Figure 3 with 2 supplements
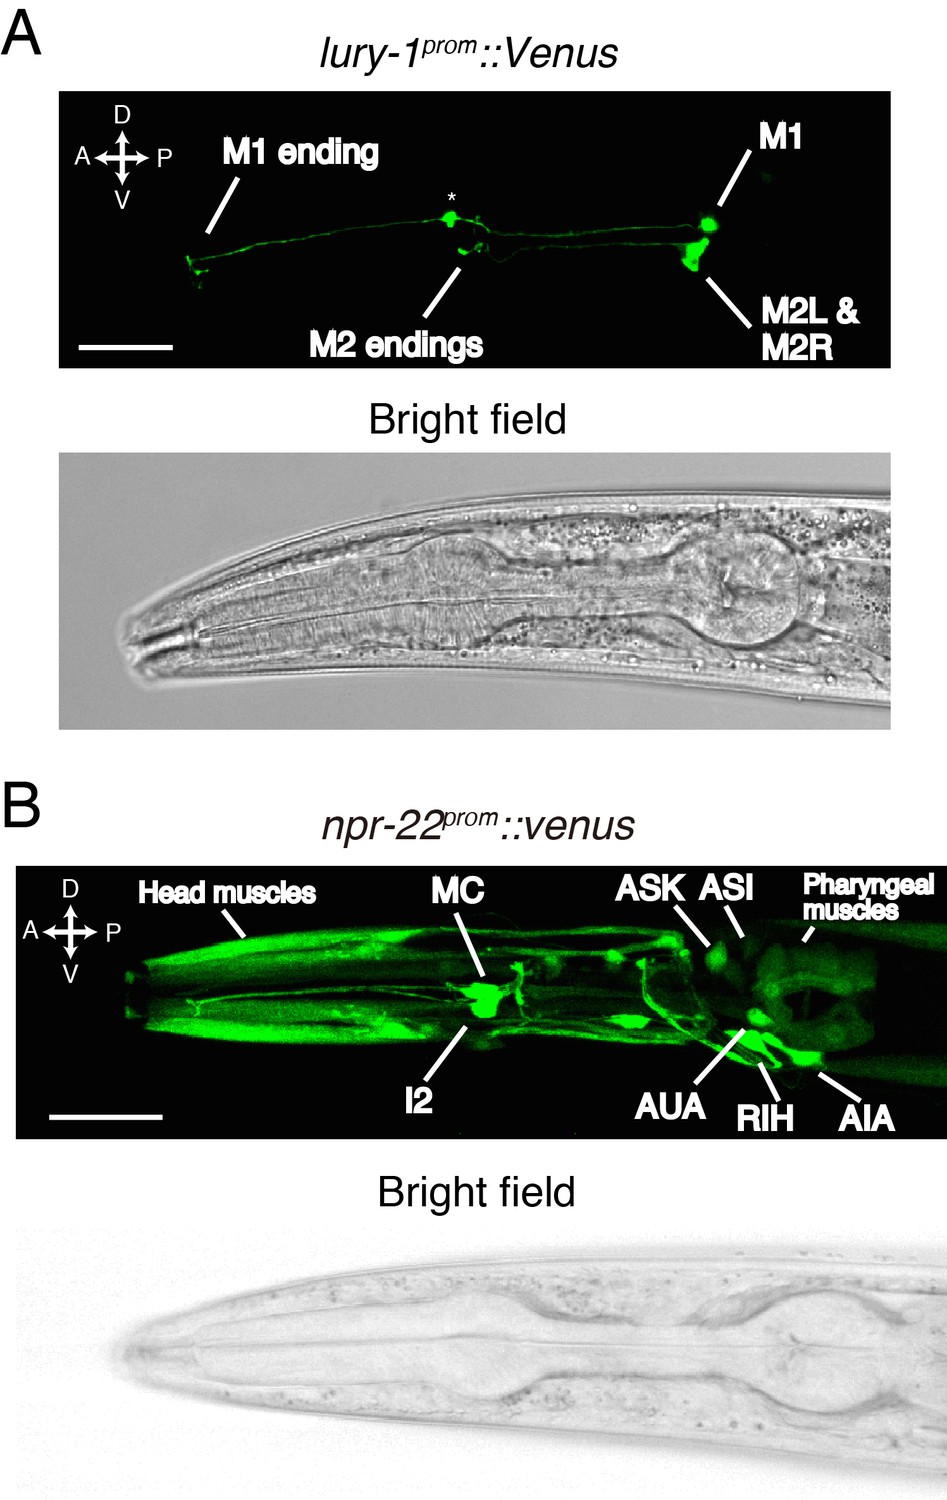
LURY-1 peptides are expressed in the pharyngeal M1 and M2 neurons, while NPR-22 is broadly expressed.
(A) Expression pattern of lury-1prom::Venus reporter in the head region of an adult worm. Fluorescence of lury-1prom::venus was specifically observed in the M1 and M2 pharyngeal neurons in adult worms. Asterisk, a knot-like structure in the M1 axon occasionally generated by the expression of fluorescent proteins. (B) Expression pattern of Venus reporter driven by the npr-22 promoter in the head region of an adult worm. (A, B) White scale bars, 20 µm.
Figure 3—figure supplement 1
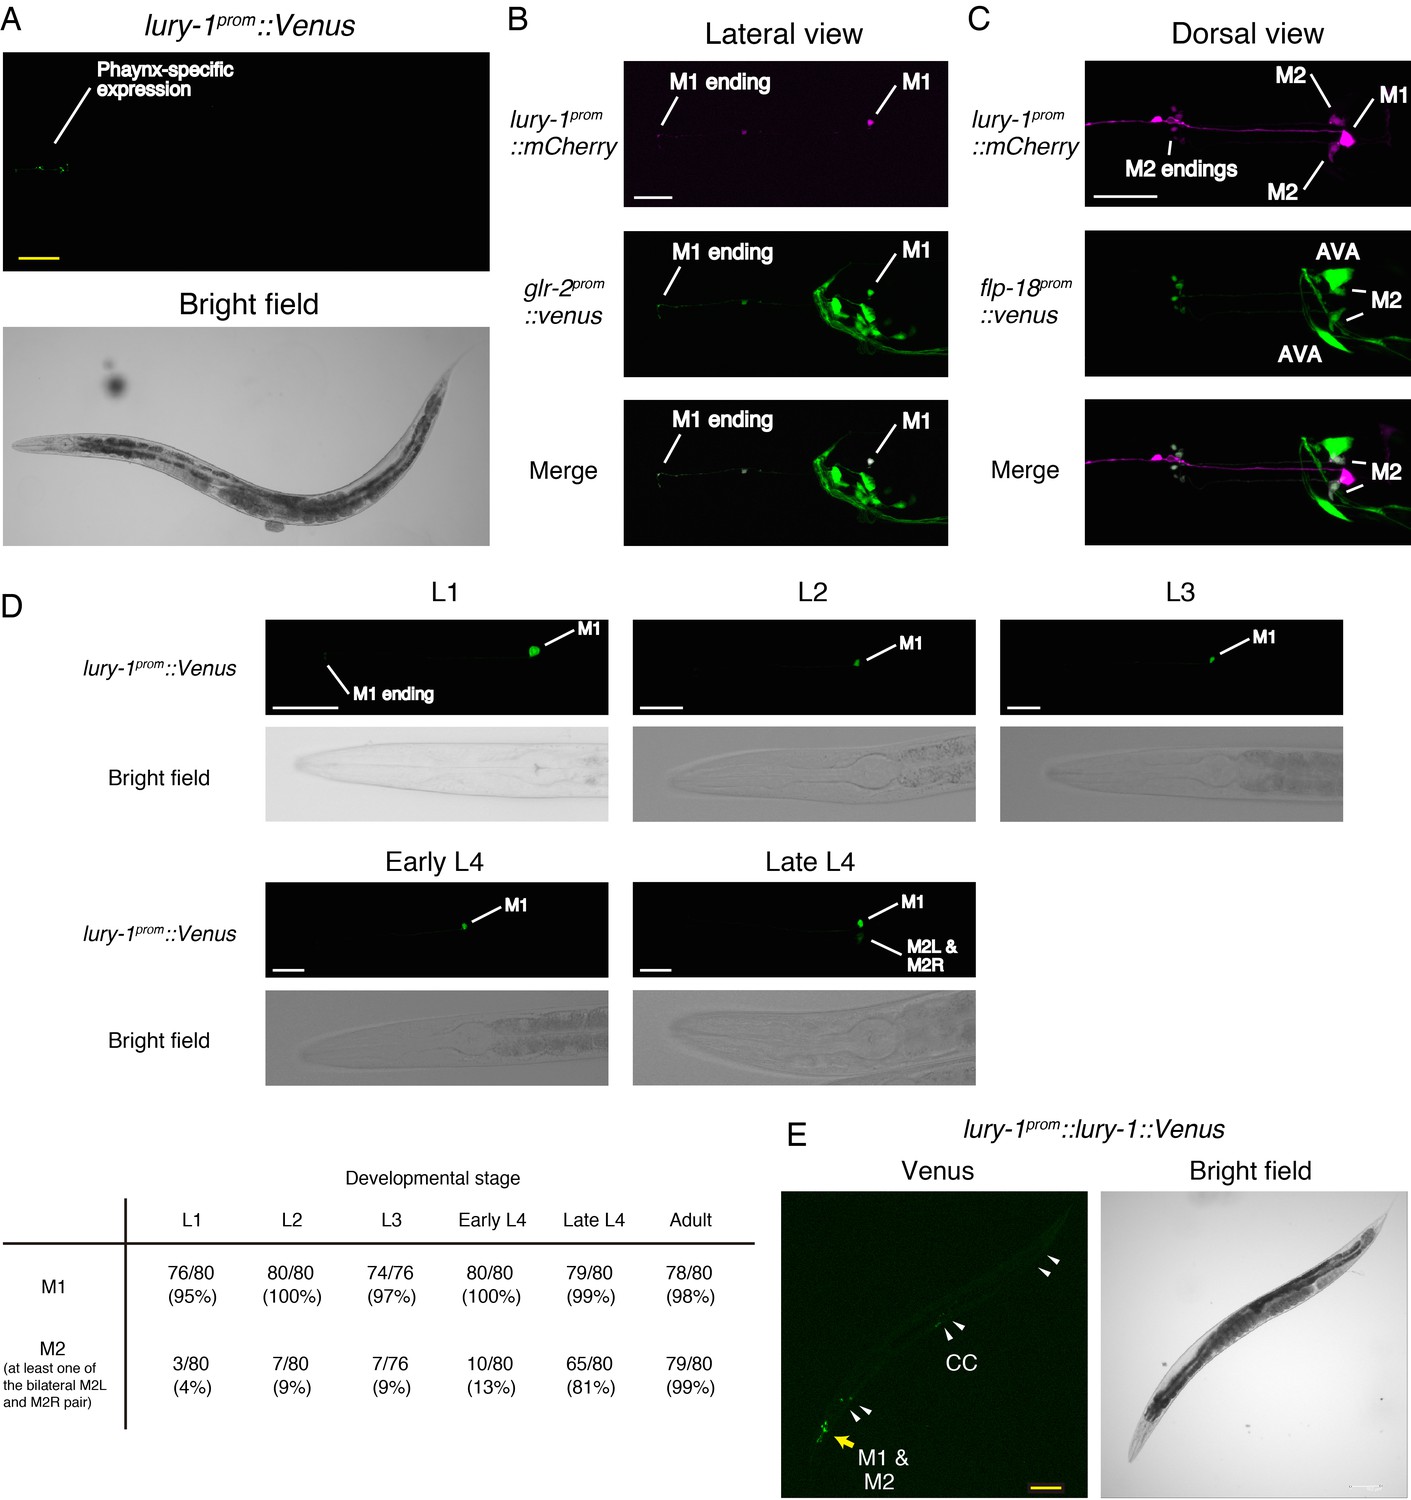
Expression patterns of lury-1.
(A) Expression pattern of lury-1prom::Venus reporter in an adult worm. lury-1prom::venus was specifically expressed in pharynx. (B) Co-expression of lury-1prom::mCherry and glr-2prom::Venus in M1. (C) Co-expression of lury-1prom::mCherry and flp-18prom::Venus in M2. (D) Expression of lury-1prom::Venus reporter during development. The number of worms showing detectable expression in the indicated cell type is shown at the bottom. (E) Expression pattern of lury-1prom::lury-1(with intron)::Venus translational reporter in an adult worm. Arrowheads, coelomocytes (CC). (A–E) Yellow scale bars, 100 µm. White scale bars, 20 µm.
Figure 3—figure supplement 2

Expression patterns of npr-22.
(A) Expression pattern of npr-22prom::Venus reporter in an adult worm. White arrowheads, ventral nerve cord neurons. (B) Co-expression of npr-22prom::mCherry and flp-15prom::Venus in I2. (C) Co-expression of npr-22prom::mCherry and ceh-19prom::Venus in MC. (D) Co-expression of npr-22prom::mCherry and cat-1prom::Venus in RIH. (E) Co-expression of npr-22prom::mCherry and slt-1prom::Venus in RIH. (F) Co-expression of npr-22prom::Venus and ins-1prom::mCherry in AIA. (G) Co-expression of npr-22prom::mCherry and npr-1prom::Venus in AUA. (H) Co-expression of npr-22prom::mCherry and acr-5prom::Venus in B-type motor neurons. (A–H) Yellow scale bars, 100 µm. White scale bars, 20 µm.
Figure 4 with 2 supplements
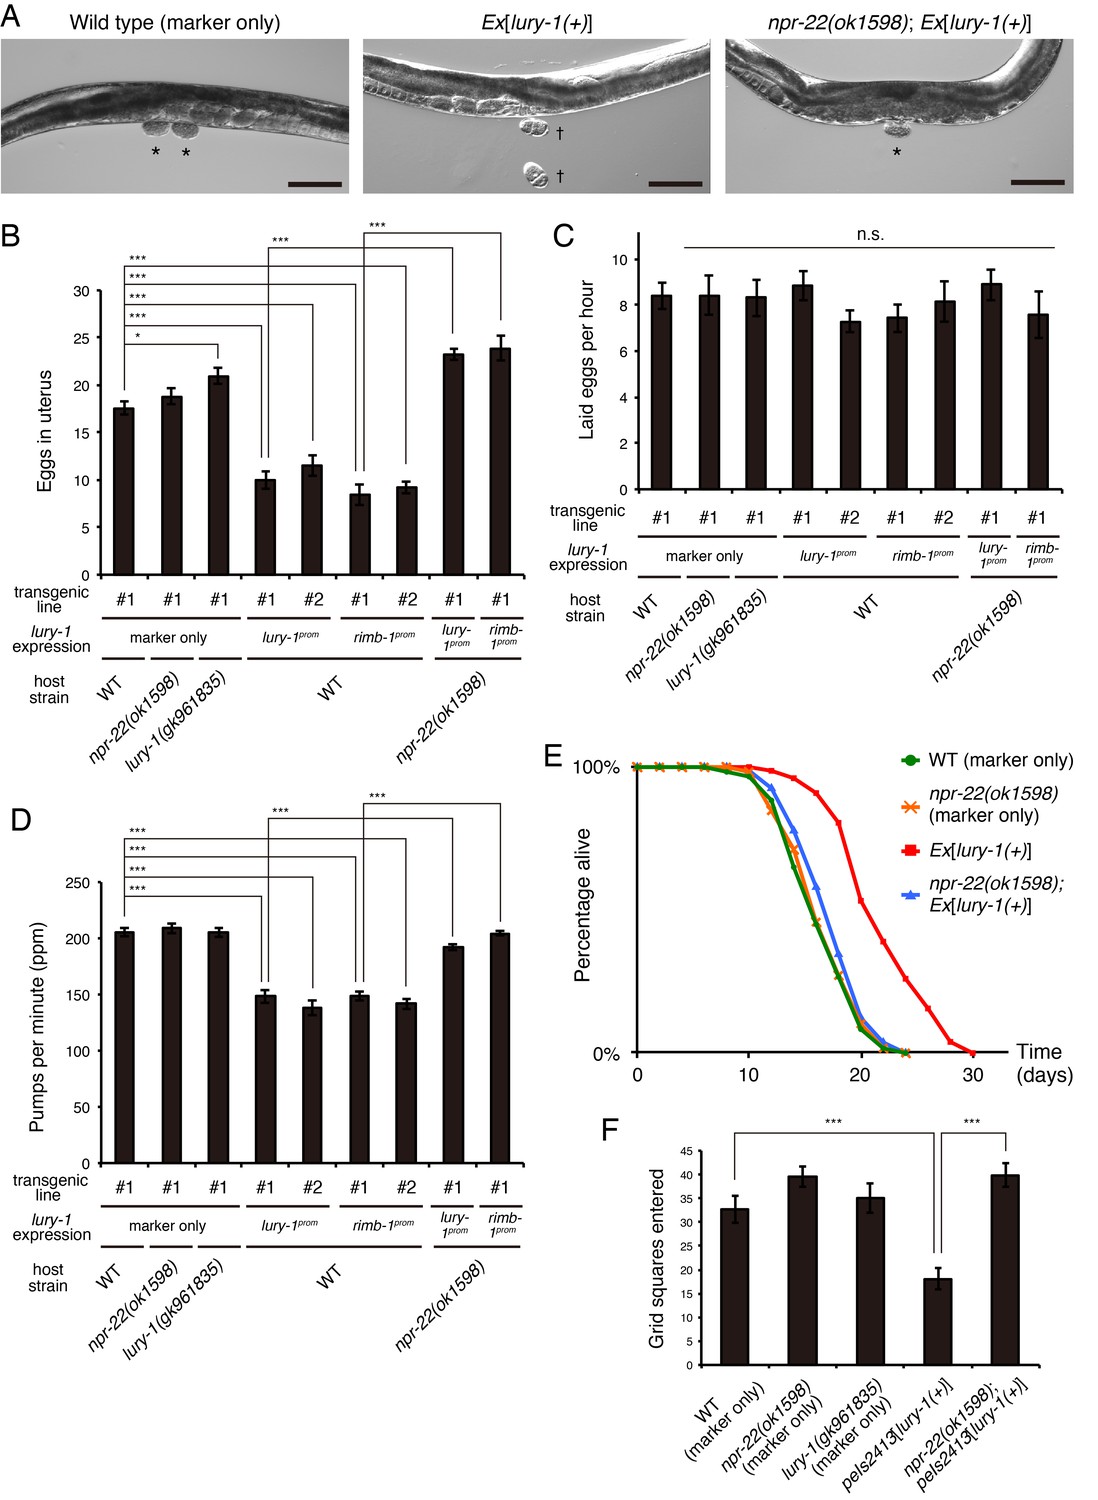
Multicopy expression of lury-1(+) causes multiple food-related phenotypes in an NPR-22-dependent manner.
(A) Lateral views near the uterus of synchronized adult worms (36 hr after the L4 white-crescent stage) of wild type, Ex[lury-1(+)], and npr-22(ok1598); Ex[lury-1(+)]. Asterisk, ~30 cell stage eggs laid on agar pads during immobilization. Daggers, 2- to 4 cell stage eggs laid on an agar pad during immobilization. The number of eggs retained in the uterus is decreased in the Ex[lury-1(+)] strain. Black scale bars, 100 µm. (B) Number of unlaid eggs in the uterus of lury-1- and npr-22-related strains. N = 29, 25, 30, 24, 21, 18, 18, 24, and 18 animals (from left to right in order of each group). ***p<0.001, *p<0.05 (ANOVA with Tukey’s post-test). (C) Number of eggs laid per animal per hour. N = 8, 8, 8, 8, 8, 7, 7, 8, and 7 animals (from left to right in order of each group). ANOVA with Tukey’s post-test. n.s., not significant. (D) Pharyngeal pumping rate of lury-1- and npr-22-related strains. N = 25, 25, 26, 27, 17, 26, 17, 26, and 25 animals (from left to right in order of each group). ***p<0.001 (ANOVA with Tukey’s post-test). (E) Lifespans of lury-1- and npr-22-related strains. Details are shown in Supplementary file 1. (F) Roaming behavior of lury-1- and npr-22-related strains. Tracks of worm movement generated on food over a 4 hr period were examined. N = 12 animals. ***p<0.001 (ANOVA with Tukey’s post-test). (A–F) All strains have the myo-3prom::venus transgene as a transgenic marker. Bars represent mean ±S.E.M.
Figure 4—figure supplement 1
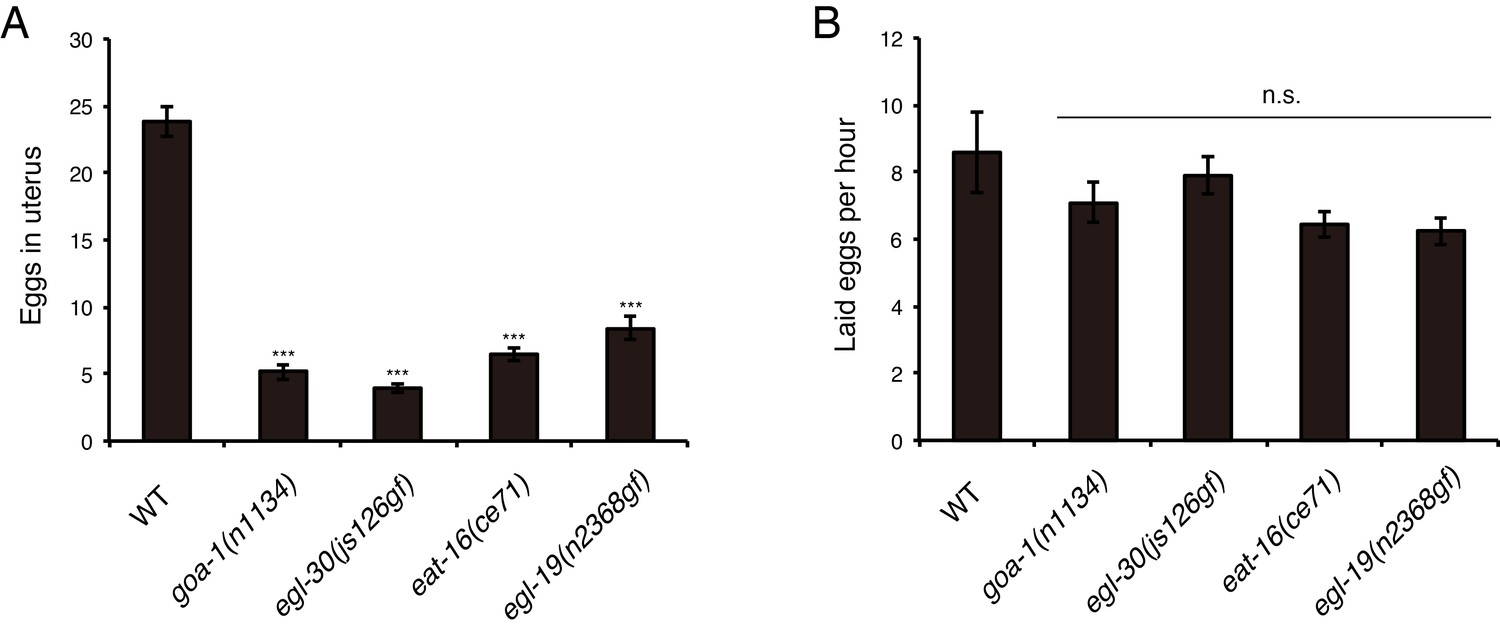
Egg-laying phenotypes of canonical Egl-c mutants.
(A) Number of unlaid eggs in the uterus of adult goa-1(n1134), egl-30(js176gf), eat-16(ce71), and egl-19(n2368gf) worms (36 hr after the L4 white-crescent stage). N = 12 animals. ***p<0.001 (ANOVA with Dunnett’s post-test). (B) Number of eggs laid per animal per hour. N = 12 animals. ANOVA with Dunnett’s post-test. n.s., not significant. Bars represent mean ±S.E.M.
Figure 4—figure supplement 2
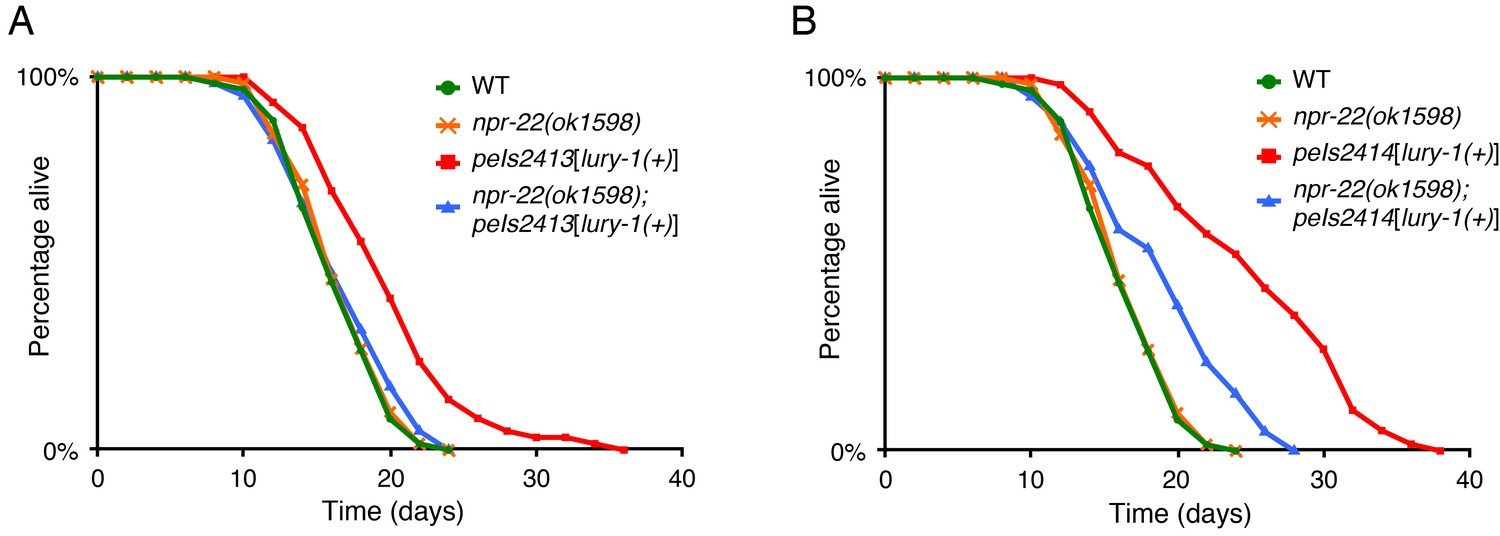
Multicopy expression of LURY-1 extends lifespan in an NPR-22-depndent manner.
(A, B) Lifespans of peIs2413 (A) and peIs2414 (B) strains, in which the lury-1(+) transgene is integrated into genomic DNA. The results of wild type and npr-22(ok1598) are the same as shown in Figure 4E. Details are shown in Supplementary file 1.
Figure 5 with 1 supplement
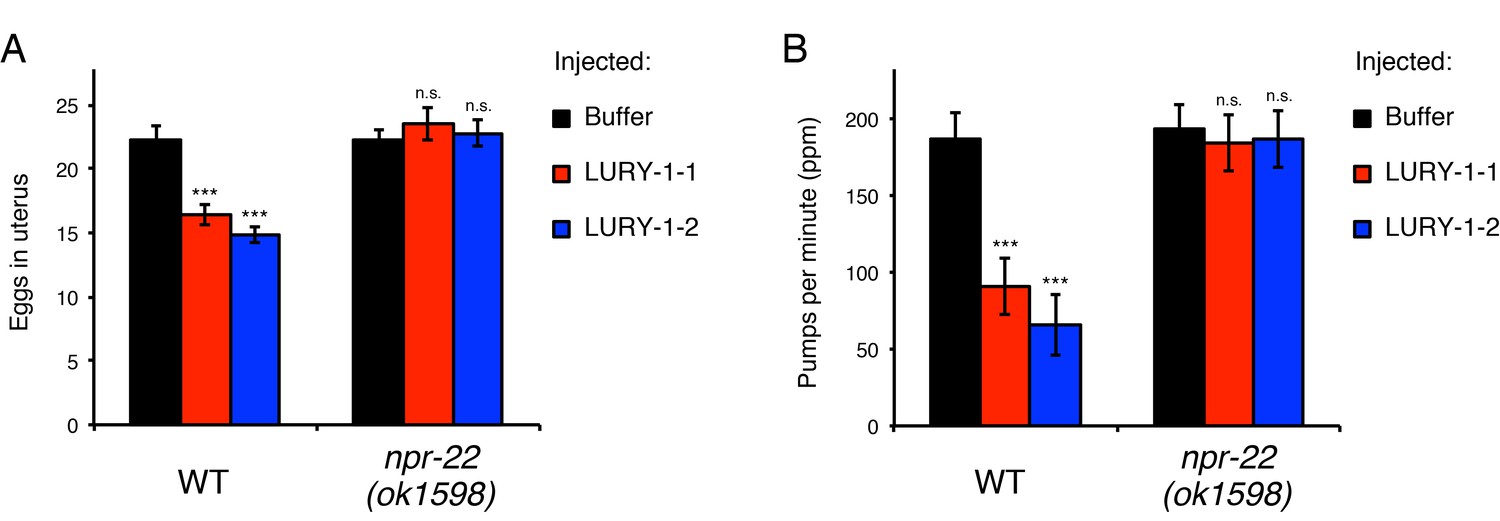
LURY-1 peptides stimulate egg-laying and suppress feeding through NPR-22.
(A, B) Effects of administration of LURY-1 peptides on the number of retained eggs (A) and pharyngeal pumping (B). Each of synthetic LURY-1 peptides was injected to wild-type and npr-22(-) worms at a concentration of 10 µM. M9 dilution buffer was injected as a control. N = 16 animals. ***p<0.001 compared with buffer controls (ANOVA with Dunnett’s post-test). n.s., not significant. Bars represent mean ±S.E.M.
Figure 5—figure supplement 1
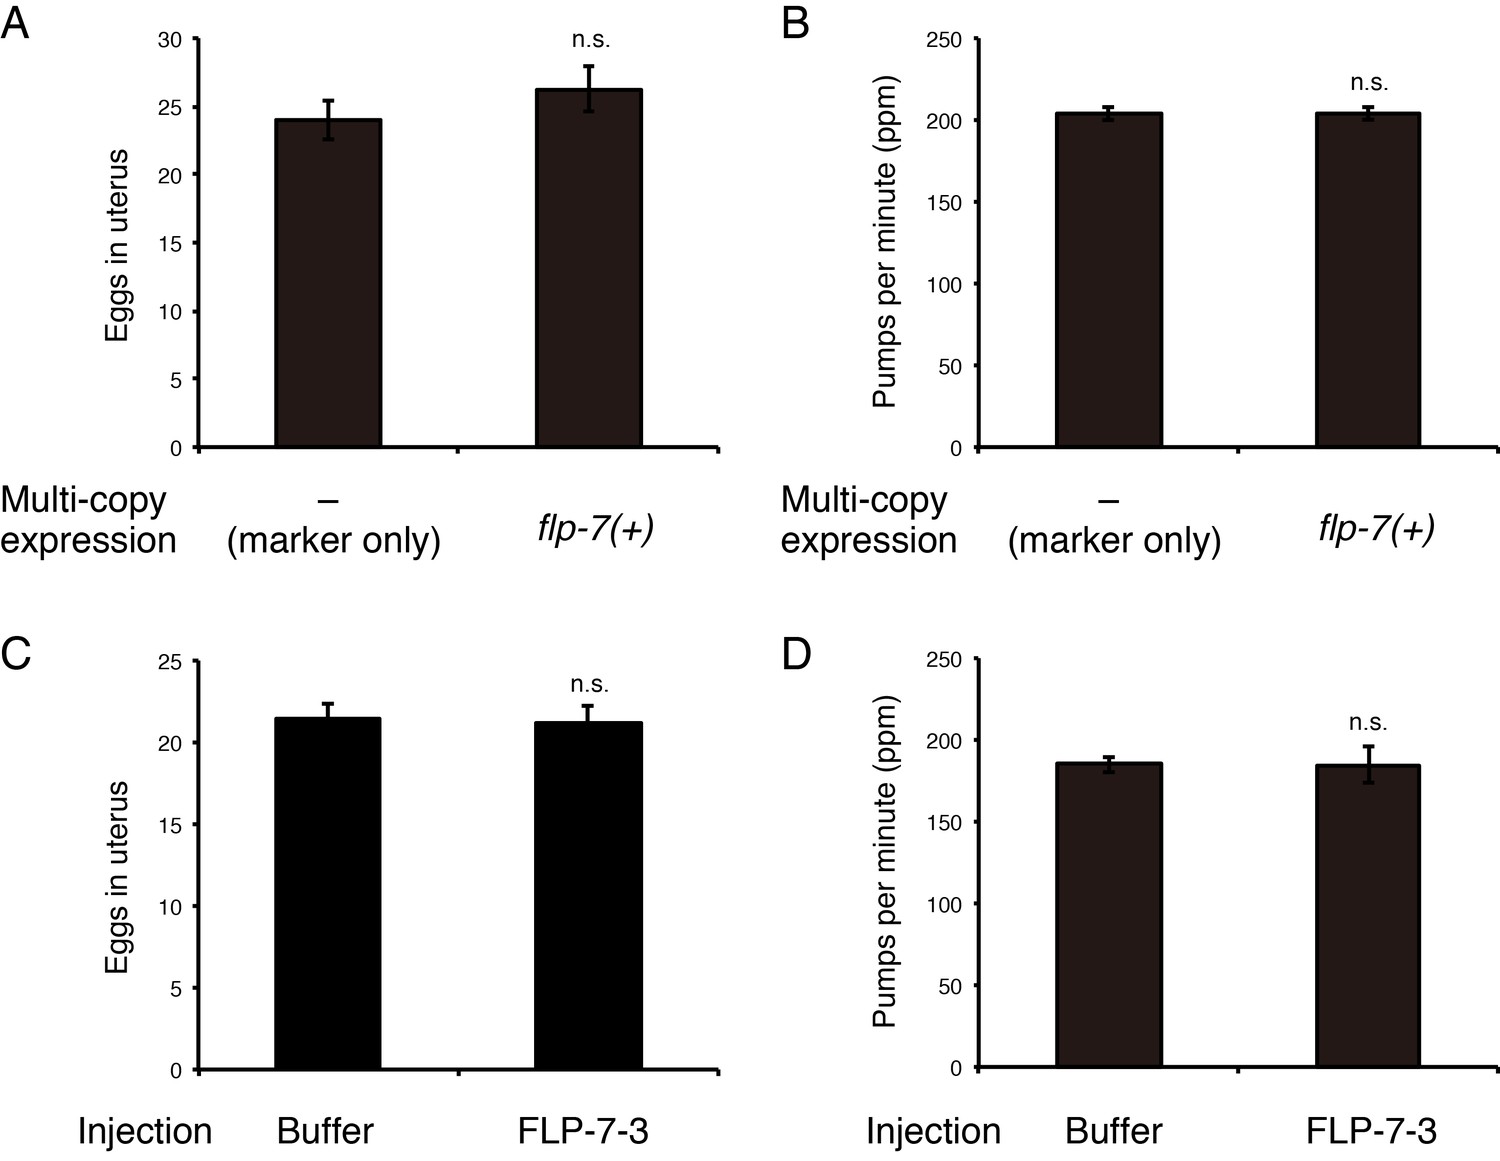
Administration of FLP-7–3 does not affect egg-laying or feeding.
(A) Number of unlaid eggs in the uterus of animals carrying an extrachromosomal flp-7(+) array. N = 18 animals. (B) Pharyngeal pumping rate of animals carrying an extrachromosomal flp-7(+) array. N = 16 animals. (C) Number of unlaid eggs in the uterus of animals into which synthetic FLP-7–3 peptide was injected at a concentration of 10 µM. N = 16 animals. (D) Pharyngeal pumping rate of animals into which synthetic FLP-7–3 peptide was injected at a concentration of 10 µM. N = 16 animals. (C, D) M9 dilution buffer was injected as a control. ns., not significant (two-tailed t test). Bars represent mean ±S.E.M.
Figure 6 with 1 supplement

LURY-1 peptides are secreted in a food-dependent manner and essential for satiety-induced behavioral changes.
(A) The fluorescence of lury-1prom::lury-1::venus reporter in worms that had been fed (top), fasted (middle), or fasted and refed (bottom). White arrowheads, coelomocytes (CC). Scale bars, 100 μm. (B) The secretion of the LURY-1::Venus reporter, expressed as ratios of fluorescence in coelomocytes to that in the M1 and M2 cell bodies, was quantified in worms that had been fed (naive), starved for two hours, or refed for 30–120 min after the 2 hr starvation. N = 15, 20, 16, 16, and 16 animals (from left to right in order of each condition). ***p<0.001 (ANOVA with Dunnett’s post-test). (C) Changes in number of unlaid eggs in the uterus. Animals were starved for two hours, and then refed for 15, 30, or 60 min. The results of animals that did not experience starvation are also shown (‘naïve’). N = 16, 15, 16, 16, and 15 animals (from left to right in order of each condition). ***p<0.001, **p<0.01, *p<0.05 compared with wild-type animals (ANOVA with Dunnett’s post-test). (D) Number of eggs laid per animal during 30 min refeeding. After animals were starved for two hours, they were transferred back to fresh E. coli-seeded plates. N = 16 animals. **p<0.01, *p<0.05 compared with wild-type animals (ANOVA with Dunnett’s post-test). (E) Changes in pharyngeal pumping rate. Worms were starved for two hours, and then refed for 15, 30, 60, or 120 min. The results of animals that did not experience starvation are also shown (”naive’). ***p<0.001, **p<0.01 compared with wild-type animals. ns., not significant. Bars represent mean ±S.E.M.
Figure 6—figure supplement 1

The activities of coelomocytes and the lury-1 promoter are unaffected by starvation or refeeding.
(A) Coelomocyte uptake of signal sequence-tagged GFP (ssGFP), which was expressed in body wall muscles under the myo-3 promoter. White arrowheads, coelomocytes. Scale bar, 100 μm. (B) The fluorescence of myo-3prom::ssGFP in coelomocytes was quantified in worms that had been fed (naive), starved for two hours, or refed for one hour after the 2 hr starvation. N = 18 animals. (C) The fluorescence of lury-1prom::Venus in the cell bodies of M1, M2L, and M2R was quantified in worms that had been fed (naive), starved for two hours, or refed for one hour after the 2 hr starvation. The peak fluorescence intensities in the three neurons were averaged. N = 19 animals. ns., not significant (ANOVA with Dunnett’s post-test). Bars represent mean ±S.E.M.
Figure 7 with 1 supplement
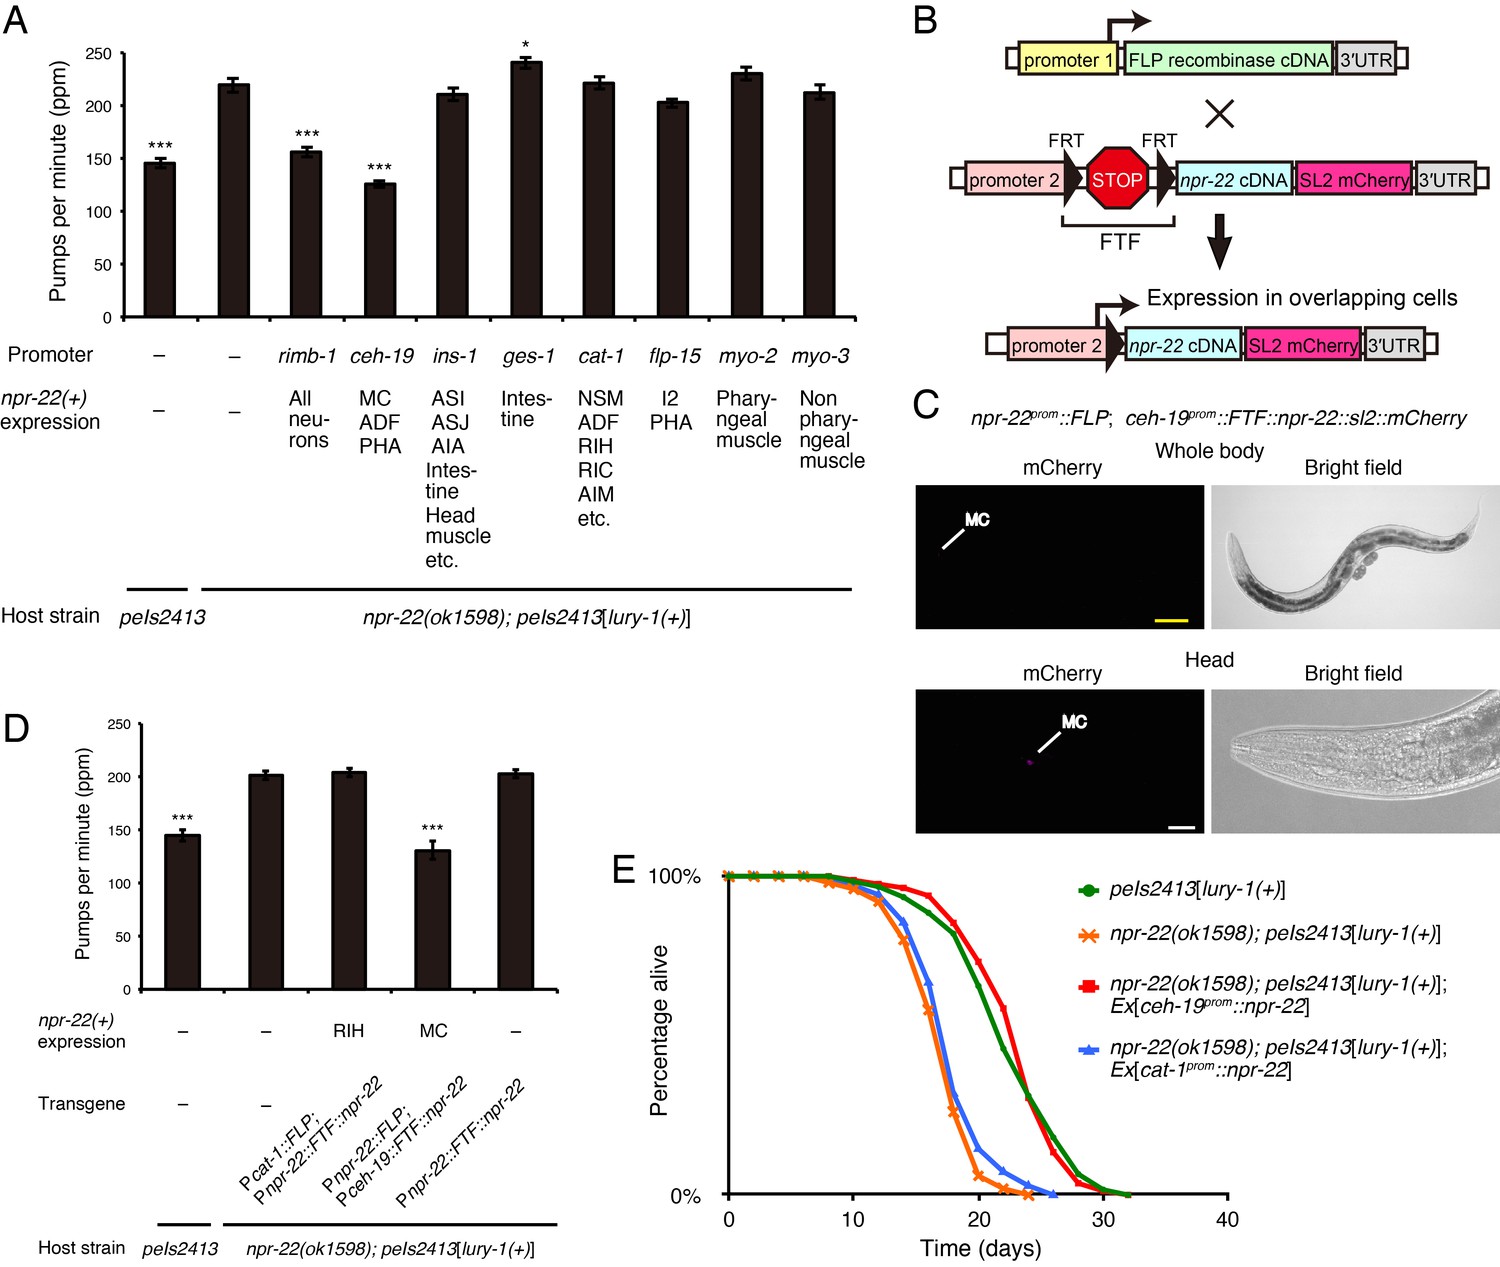
NPR-22 acts in MC to control feeding and lifespan.
(A) Pharyngeal pumping rate of animals expressing npr-22a under indicated promoters. N = 13, 12, 12, 12, 12, 12, 12, 12, 12, and 12 animals (from left to right in order of each group). (B) Schematic of the FLP recombinase technology to restrict the npr-22 expression to single cells. (C) MC-specific expression of the mCherry reporter driven by the combination of npr-22prom::FLP and ceh-19prom::FTF::npr-22::sl2::mCherry transgenes. The magnified view of the head is shown in the lower panels. Yellow scale bar, 100 µm. White scale bar, 20 µm. (D) Pharyngeal pumping rate of animals expressing npr-22a specifically in RIH or MC. N = 16 animals. (E) Lifespans of animals expressing npr-22a driven by the ceh-19 or cat-1 promoter. Details are shown in Supplementary file 1. (A, D) ***p<0.001, *p<0.05 compared with npr-22(ok1598); peIs2413 animals carrying only the transformation marker (−) (ANOVA with Dunnett’s post-test). Bars represent mean ±S.E.M.
Figure 7—figure supplement 1

Both NPR-22a and NPR-22b are functional for the regulation of feeding.
(A) Pharyngeal pumping rate of animals expressing the npr-22a or npr-22b isoform. N = 12 animals. (B) Pharyngeal pumping rate of animals expressing npr-22a under the acr-2 promoter. N = 16 animals. (A, B) ***p<0.001, **p<0.01 compared with npr-22(ok1598); peIs2413 animals carrying only the transformation marker (−) (ANOVA with Dunnett’s post-test). n.s., not significant. Bars represent mean ±S.E.M.
Figure 8 with 1 supplement
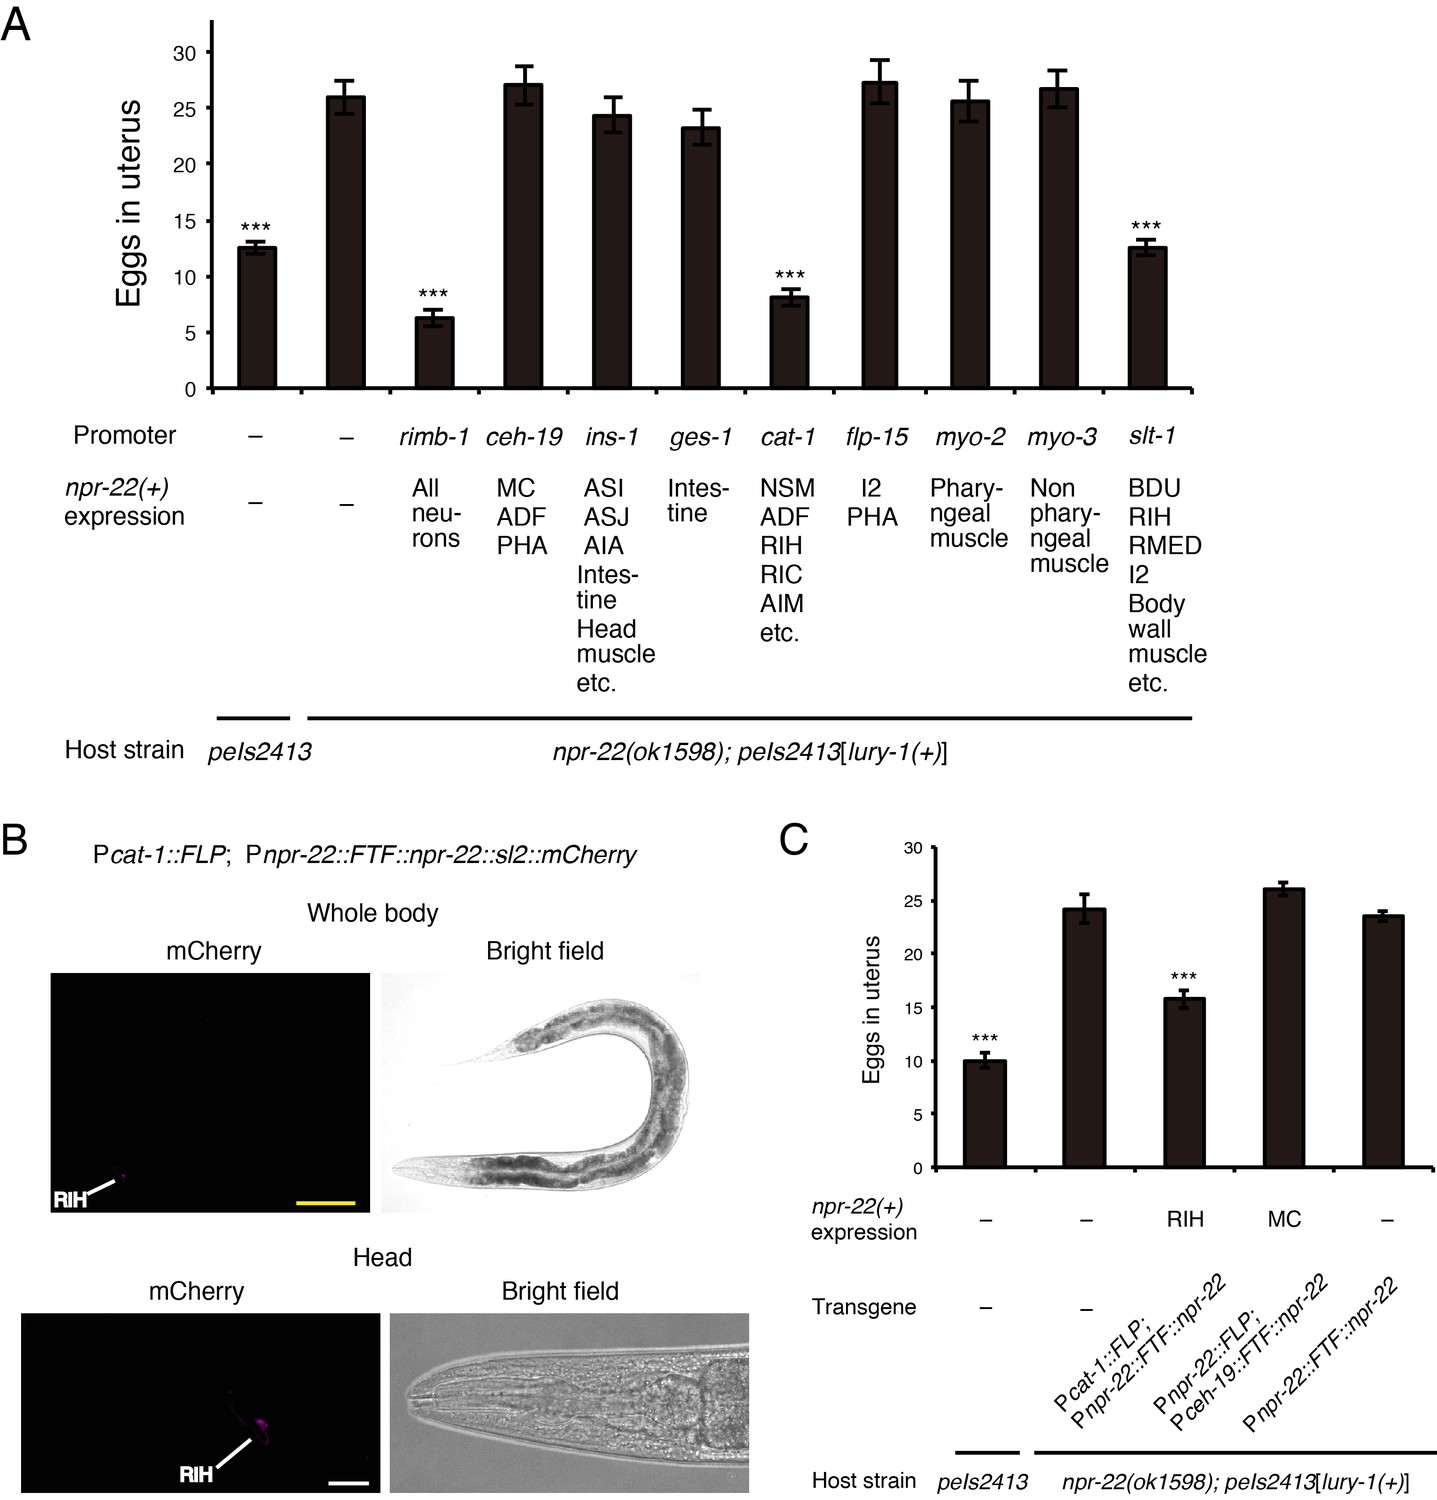
NPR-22 acts in RIH to control egg-laying.
(A) Number of unlaid eggs in the uterus of animals expressing npr-22a under indicated promoters. N = 18, 18, 18, 19, 18, 18, 20, 18, 18, 19, and 18 animals (from left to right in order of each group). (B) RIH-specific expression of the mCherry reporter driven by the combination of cat-1prom::FLP and npr-22prom::FTF::npr-22::sl2::mCherry transgenes. The magnified view of the head is shown in the lower panels. Yellow scale bar, 100 µm. White scale bar, 20 µm. (C) Number of unlaid eggs in the uterus of animals expressing npr-22a specifically in RIH or MC. N = 16 animals. (A, C) ***p<0.001 compared with npr-22(ok1598); peIs2413 animals carrying only the unc-122prom::mCherry transformation marker (−) (ANOVA with Dunnett’s post-test). Bars represent mean ±S.E.M.
Figure 8—figure supplement 1
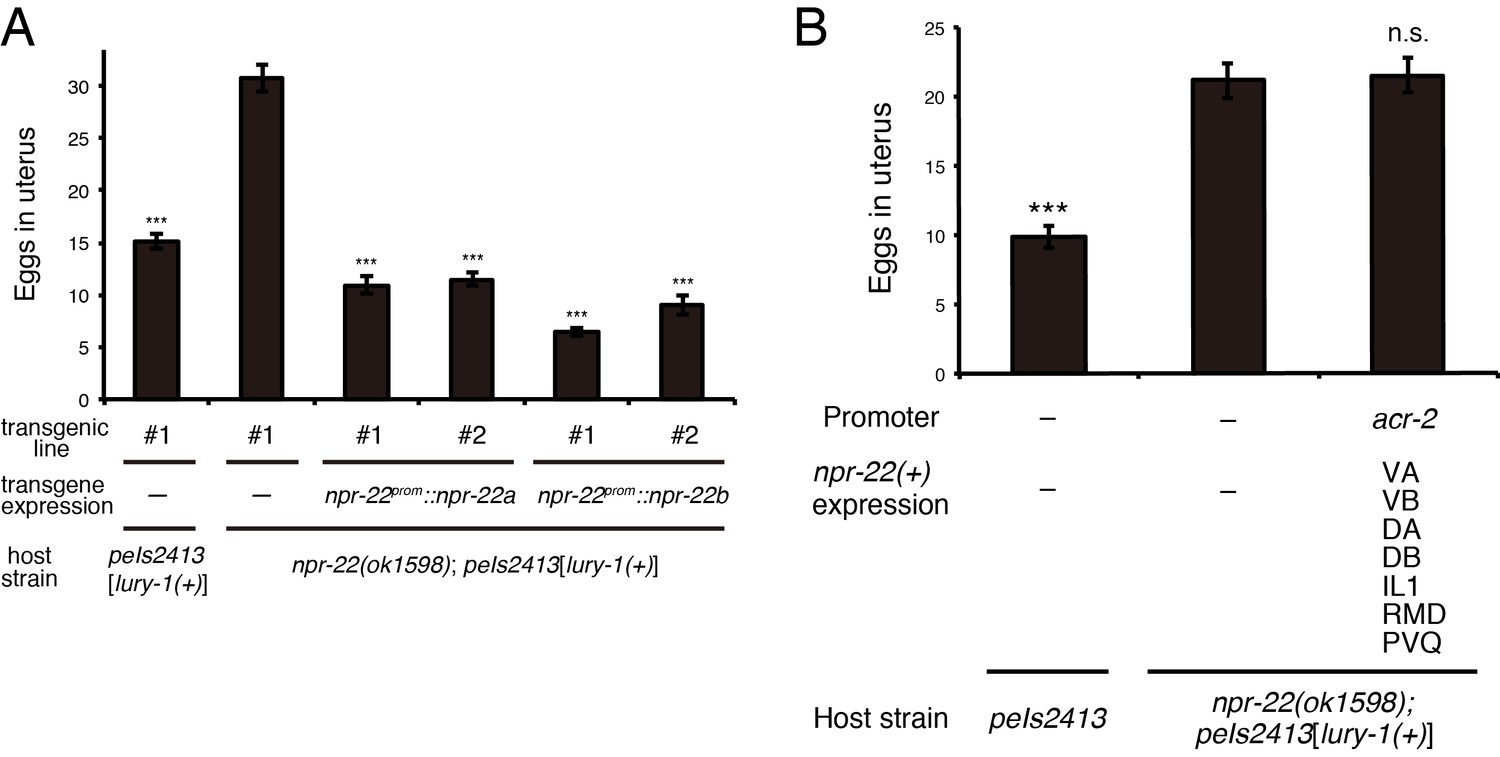
Both NPR-22a and NPR-22b are functional for the regulation of egg-laying.
(A) Number of unlaid eggs in the uterus of animals expressing the npr-22a or npr-22b isoform. N = 18, 18, 18, 18, 16, and 18 animals (from left to right in order of each group). (B) Number of unlaid eggs in the uterus of animals expressing npr-22a under the acr-2 promoter. N = 16 animals. (A, B) ***p<0.001 compared with npr-22(ok1598); peIs2413 animals carrying only the transformation marker (−) (ANOVA with Dunnett’s post-test). n.s., not significant. Bars represent mean ±S.E.M. Additional files.
Figure 9
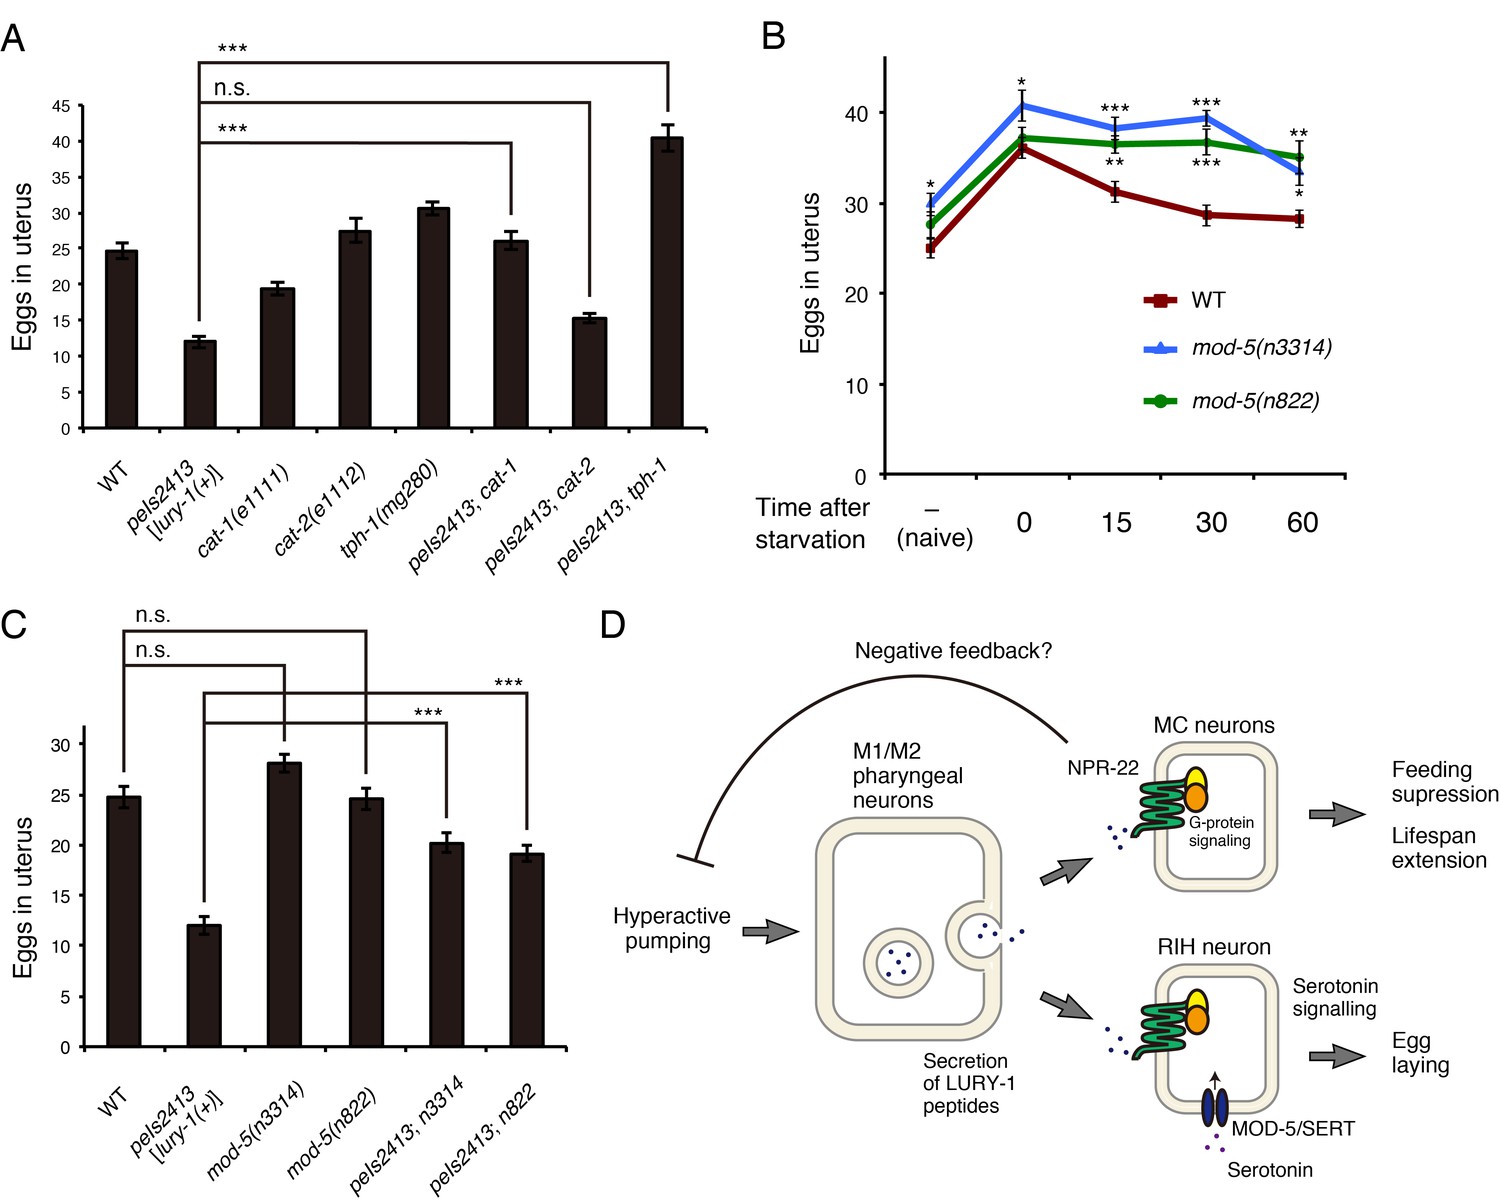
Serotonin signaling is essential for the LURY-1 peptide-dependent stimulation of egg-laying.
(A) Genetic interaction between peIs2413[lury-1(+)] and monoamine-related genes in number of unlaid eggs in the uterus. N = 20 animals. (B) Changes in number of unlaid eggs in the uterus. Animals were starved for two hours, and then refed for 15, 30, or 60 min. The results of animals that did not experience starvation are also shown (‘naïve’). N = 16 animals for each condition. (C) Genetic interaction between peIs2413[lury-1(+)] and two alleles of mod-5 in number of unlaid eggs in the uterus. N = 20 animals. The data for WT and pe2413 are the same as shown in (A). ***p<0.001 (ANOVA with Tukey’s post-test). (D) Schematic model representing the mechanism of action of LURY-1 peptides. (A, B) ***p<0.001, **p<0.01, *p<0.05 (ANOVA with Dunnett’s post-test). n.s., not significant. Bars represent mean ±S.E.M.
Tables
Table 1
Active fractions of each chromatography and the amino acid sequences of the purified peptides.
https://doi.org/10.7554/eLife.28877.007| Ion-exchange- HPLC Elution time (min) | Reversed-phase- HPLC Retention time (min) | Observed mass (MH+) | Theoretical mass (MH+) | Sequence | Precursor gene | Peptide name* | |
|---|---|---|---|---|---|---|---|
| pH 6.5 | pH4.8 | ||||||
| 48–52 (Fr. A) | 46–48 | 13–13.5 | 717.25 | 717.42 | AVLPRY-NH2 | lury-1 | LURY-1-2 |
| 17–18 | 818.34 | 818.46 | PALLSRY-NH2 | lury-1 | LURY-1-1 | ||
| 60–62 (Fr. B) | 56–60 | 25.5–26.5 | 792.29 | 792.43 | PNFLRF-NH2 | flp-1 | FLP-1-6 |
| 92–94 (Fr. C) | 108–112 | 27.5–28.5 | 1255.45 | 1255.68 | RNKFEFIRF-NH2 | flp-12 | FLP-12 |
| 94–96 (Fr. D) | 86–88 | 15.5–16.5 | 901.27 | 901.45 | KSAYMRF-NH2 | flp-6 | FLP-6-1 |
| 90–92 | 23–23.5 | 1108.33 | 1108.55 | SPSAKWMRF-NH2 | flp-22 | FLP-22 | |
-
*Peptide names other than LURY-1 peptides are taken from Li and Kim, 2008.
Additional files
-
Supplementary file 1
Results of lifespan analyses.
- https://doi.org/10.7554/eLife.28877.023
-
Supplementary file 2
Strains used in this study.
- https://doi.org/10.7554/eLife.28877.024
-
Transparent reporting form
- https://doi.org/10.7554/eLife.28877.025
Download links
A two-part list of links to download the article, or parts of the article, in various formats.
Downloads (link to download the article as PDF)
Open citations (links to open the citations from this article in various online reference manager services)
Cite this article (links to download the citations from this article in formats compatible with various reference manager tools)
Luqin-like RYamide peptides regulate food-evoked responses in C. elegans
eLife 6:e28877.
https://doi.org/10.7554/eLife.28877


