Diagnostic potential for a serum miRNA neural network for detection of ovarian cancer
- Brigham and Women’s Hospital, Dana-Farber Cancer Institute, United States
- Harvard Medical School, United States
- Brigham and Women’s Hospital, United States
- Medical University of Lodz, Poland
- Dana-Farber Cancer Institute, United States
- Harvard School of Public Health, United States
Figures
Figure 1
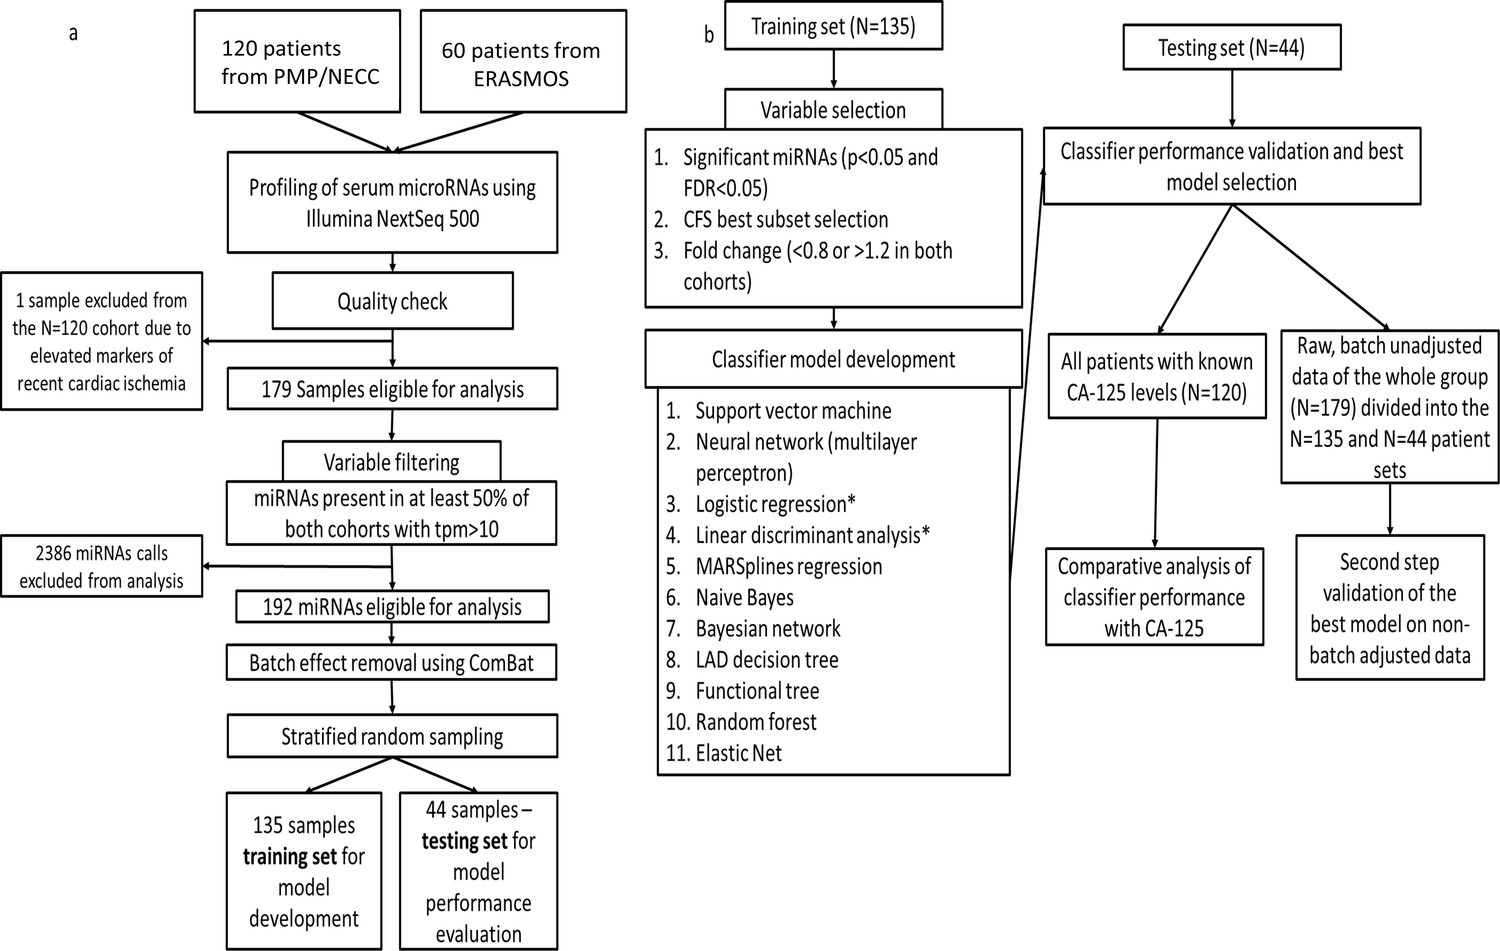
Flowchart of study design.
(a) Protocol for miRNA sequencing, filtering, batch adjustment and separation into the training and testing sets. (b) Protocol for model development and testing.
Figure 2
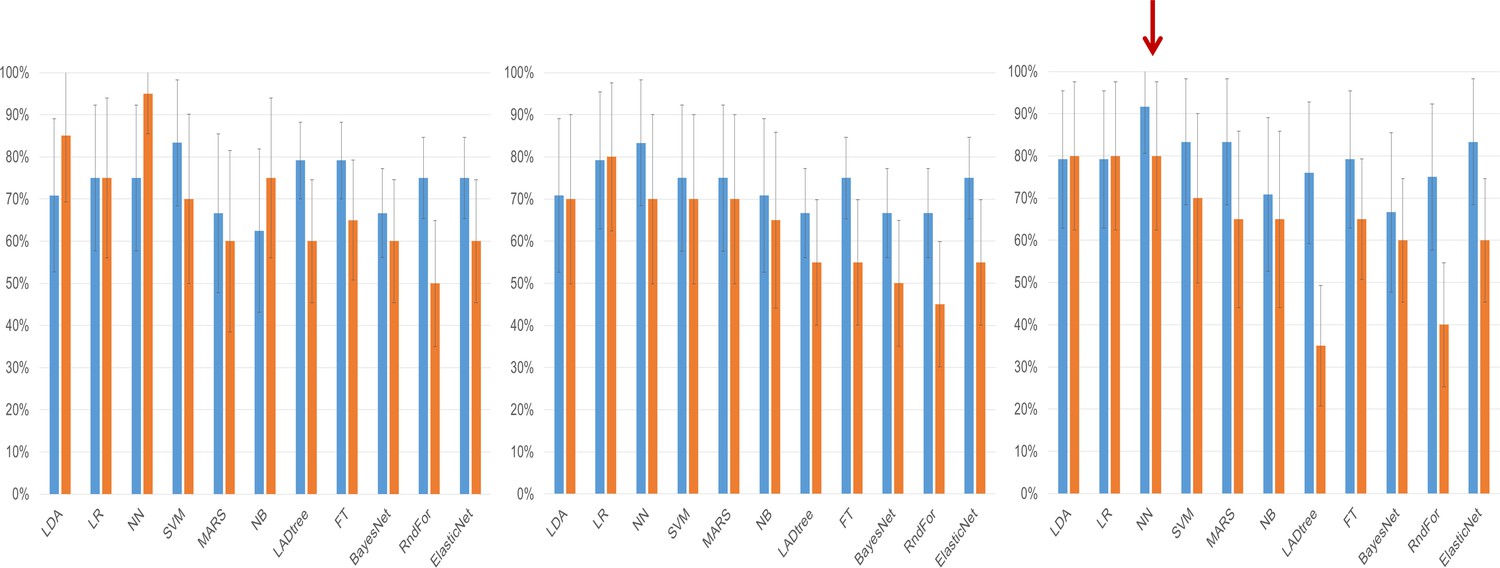
Clinical performance characteristics of the tested models.
Sensitivity (blue bars) and specificity (orange bars) of the classifiers on the testing set depending on the method of variable selection. Whiskers denote 95% Confidence Intervals. (a) – Performance of models created on the subset of miRNAs selected using the significance-based filter. (b) Performance of models created on variables selected using the CFS subset algorithm. (c) Performance of models created using variables selected by the fold change-based filter. The red arrow denotes the model with the best performance characteristics, the neural network analysis using the fold change-based filter variable.
Figure 3
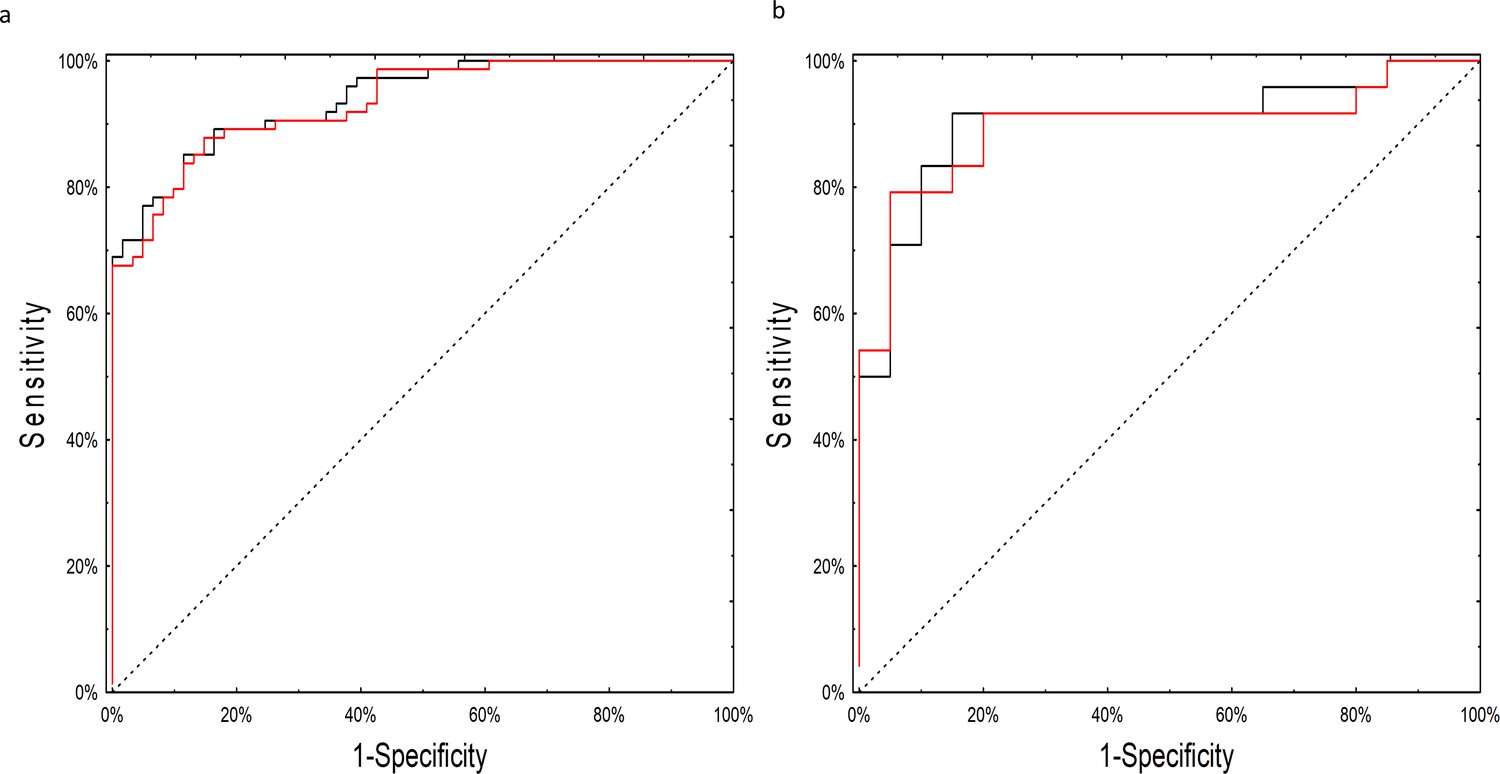
ROC curves for the neural network analysis.
(a) Performance of the neural network on the training set of raw, non-batch-adjusted data (red line) and in the batch-adjusted training set (black line) (b) Performance of the neural network on raw (red line) and batch-adjusted (black line) data in the testing set.
Figure 4 with 2 supplements
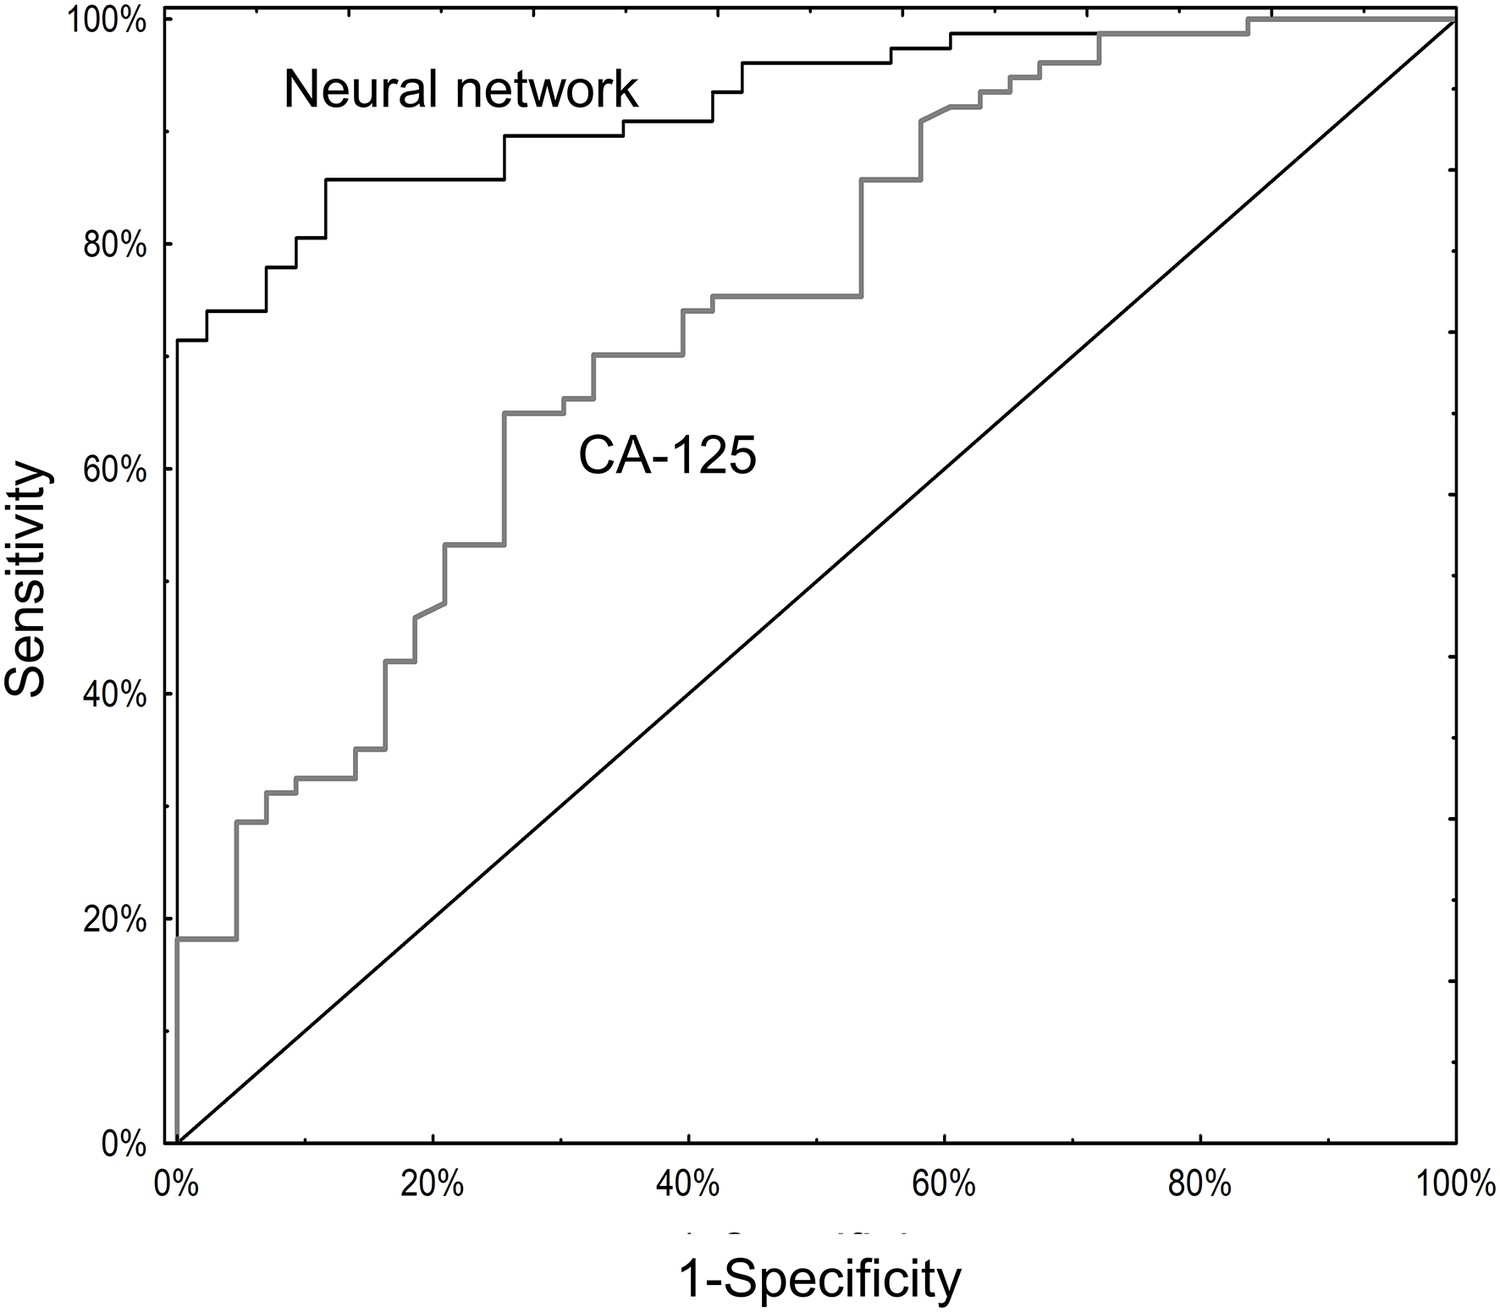
ROC curves for neural network analysis compared to CA-125.
The neural network (AUC 0.93; 95% CI 0.88–0.97) significantly outperformed CA125 (AUC 0.74; 95% CI 0.65–0.83) in terms of overall operating characteristics (p=0.001).
Figure 4—figure supplement 1
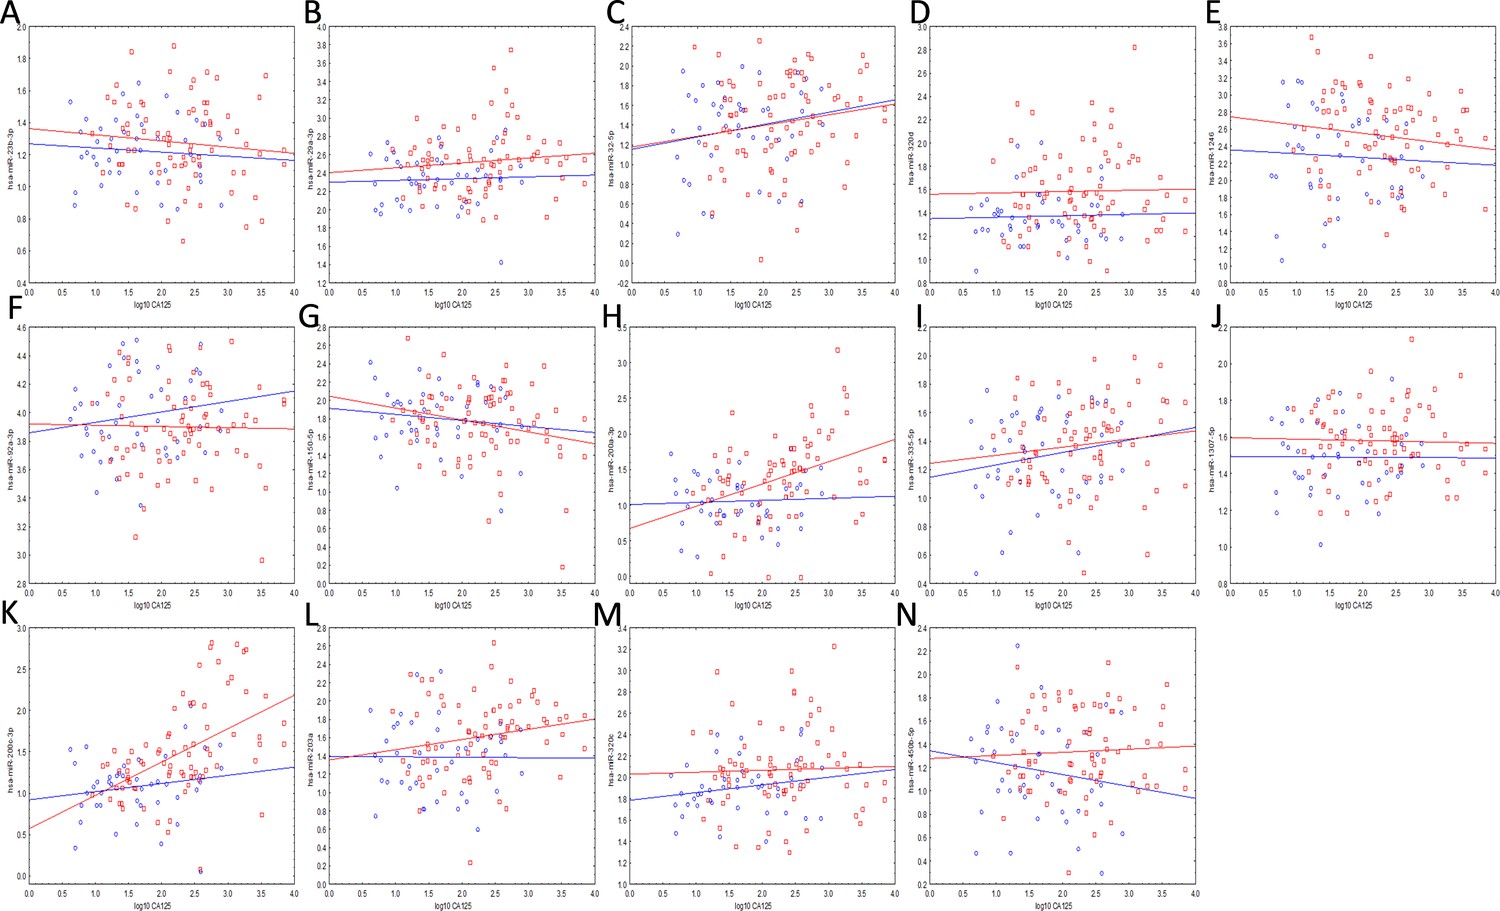
Correlations between the miRNAs (vertical axes) of the neural network and CA-125 (horizontal axes) in the cancer (red markers) and benign/borderline/control (blue markers) groups.
(a) miR-23b (b) miR-29a (c) miR-32 (d) miR-320d (e) miR-1246 (f) miR-92a (g) miR-150 (h) miR-200a (i) miR305 (j) miR-1307 (k) miR-200c (l) miR-203a (m) miR-320c (n) miR-450b. None of the correlations were significant in either the training or testing set.
Figure 4—figure supplement 2
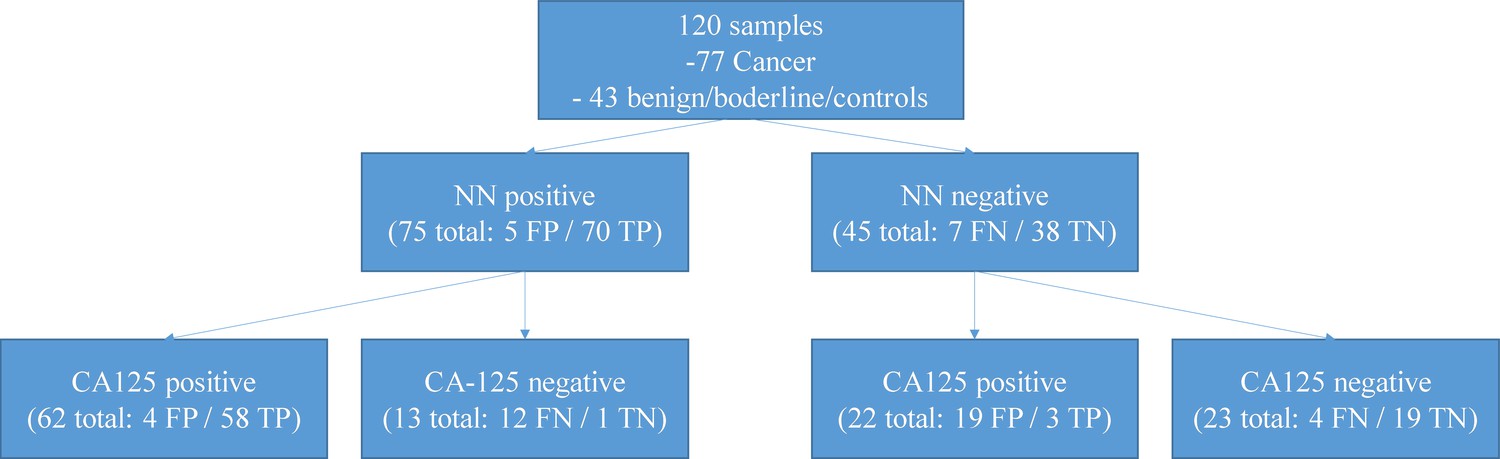
Performance of a two-tiered algorithm for ovarian cancer diagnosis incorporating both the neural network (NN) and a CA-125 cut-off of 35 U/ml.
Subjecting all negative neural network algorithm results to a second review with CA-125 would increase the probability of a false positive test result from 4.2% (5/120) to 19.2% (23/120) and a false negative rate from 5.8% (7/120) to 13.3% (16/120). If the tests were considered hierarchical so that only samples classified as negative by the neural network were then examined by CA-125, this would identify three additional cases of invasive cancer but at the expense of 19 additional false positive results. FP – false positive, TP – true positive, FN – false negative, TN – true negative.
Figure 5
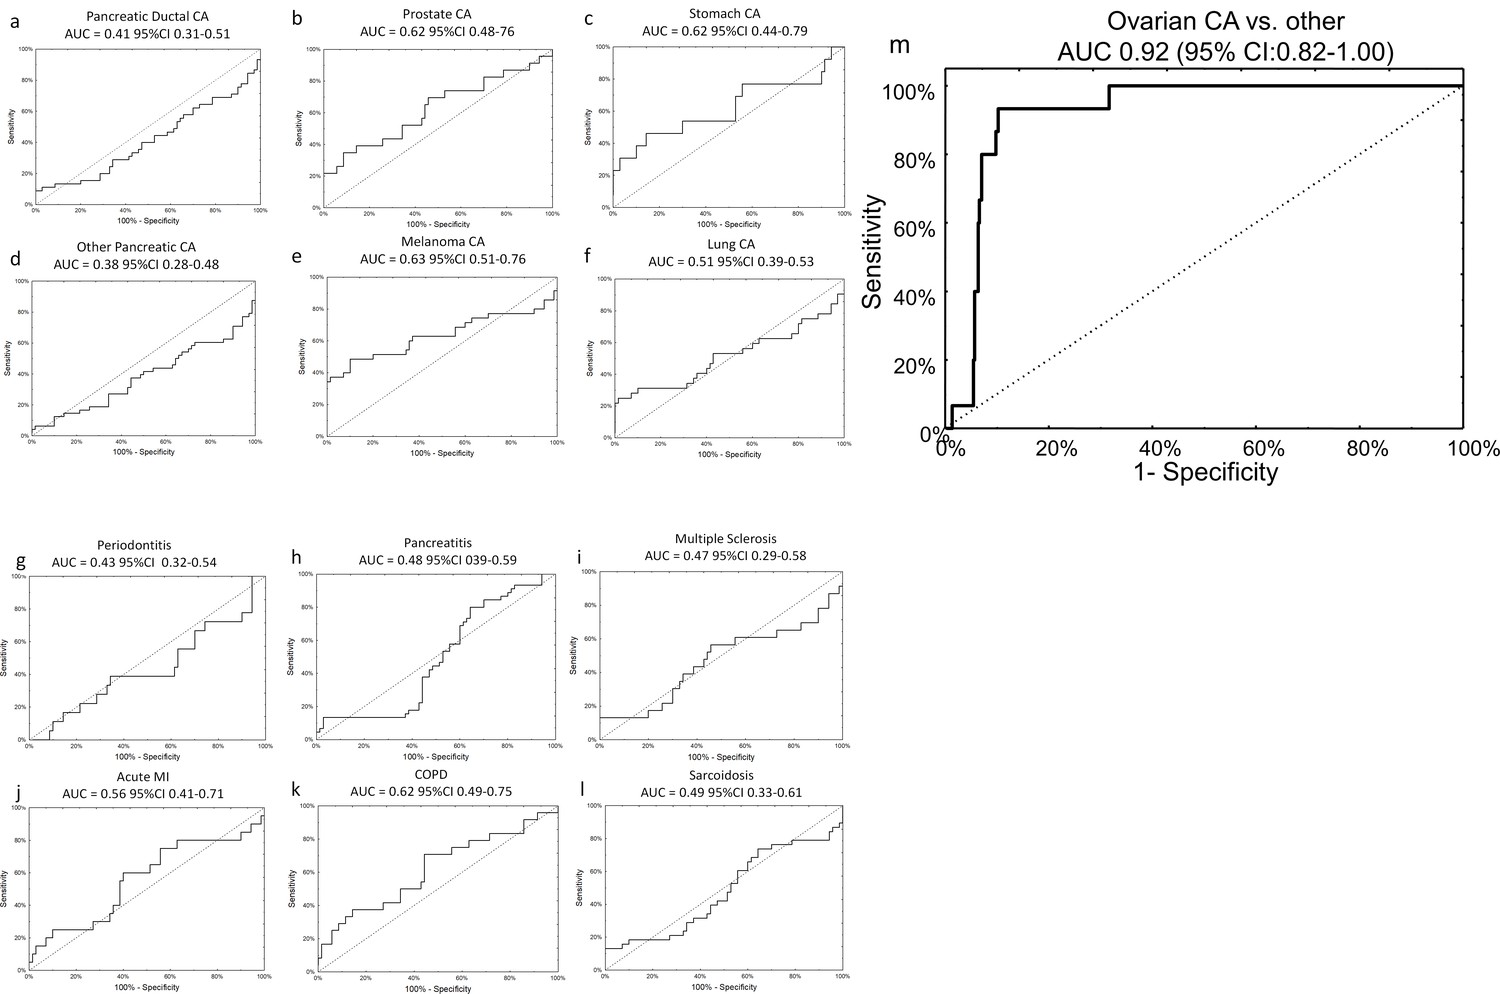
Specificity of miRNA signature for ovarian cancer compared to other diagnoses.
The neural network 14 miRNA signature did not separate any other diagnoses from the control group in the published dataset by Keller, et al 13. The study also included 70 healthy controls. The number of subjects (n) denotes the number of cases of the given diagnosis in the Keller, et al dataset. (a) Pancreatic ductal cancer (n = 45); (b) Prostate cancer (n = 23); (c) Stomach cancer (n = 13); (d) Other pancreatic cancers (n = 48); (e) Melanoma (n = 35); (f) Lung cancer (n = 32); (g) Periodontitis (n = 18); (h) Pancreatitis (n = 38); (i) Multiple sclerosis (n = 23); (j) Acute MI (n = 20); (k) Chronic obstructive pulmonary disease (n = 24); (l) Sarcoidosis (n = 45). (m) Overall, neural network was highly specific for ovarian cancer cases against all other diagnoses (i.e. healthy controls or other cancers).
Figure 6
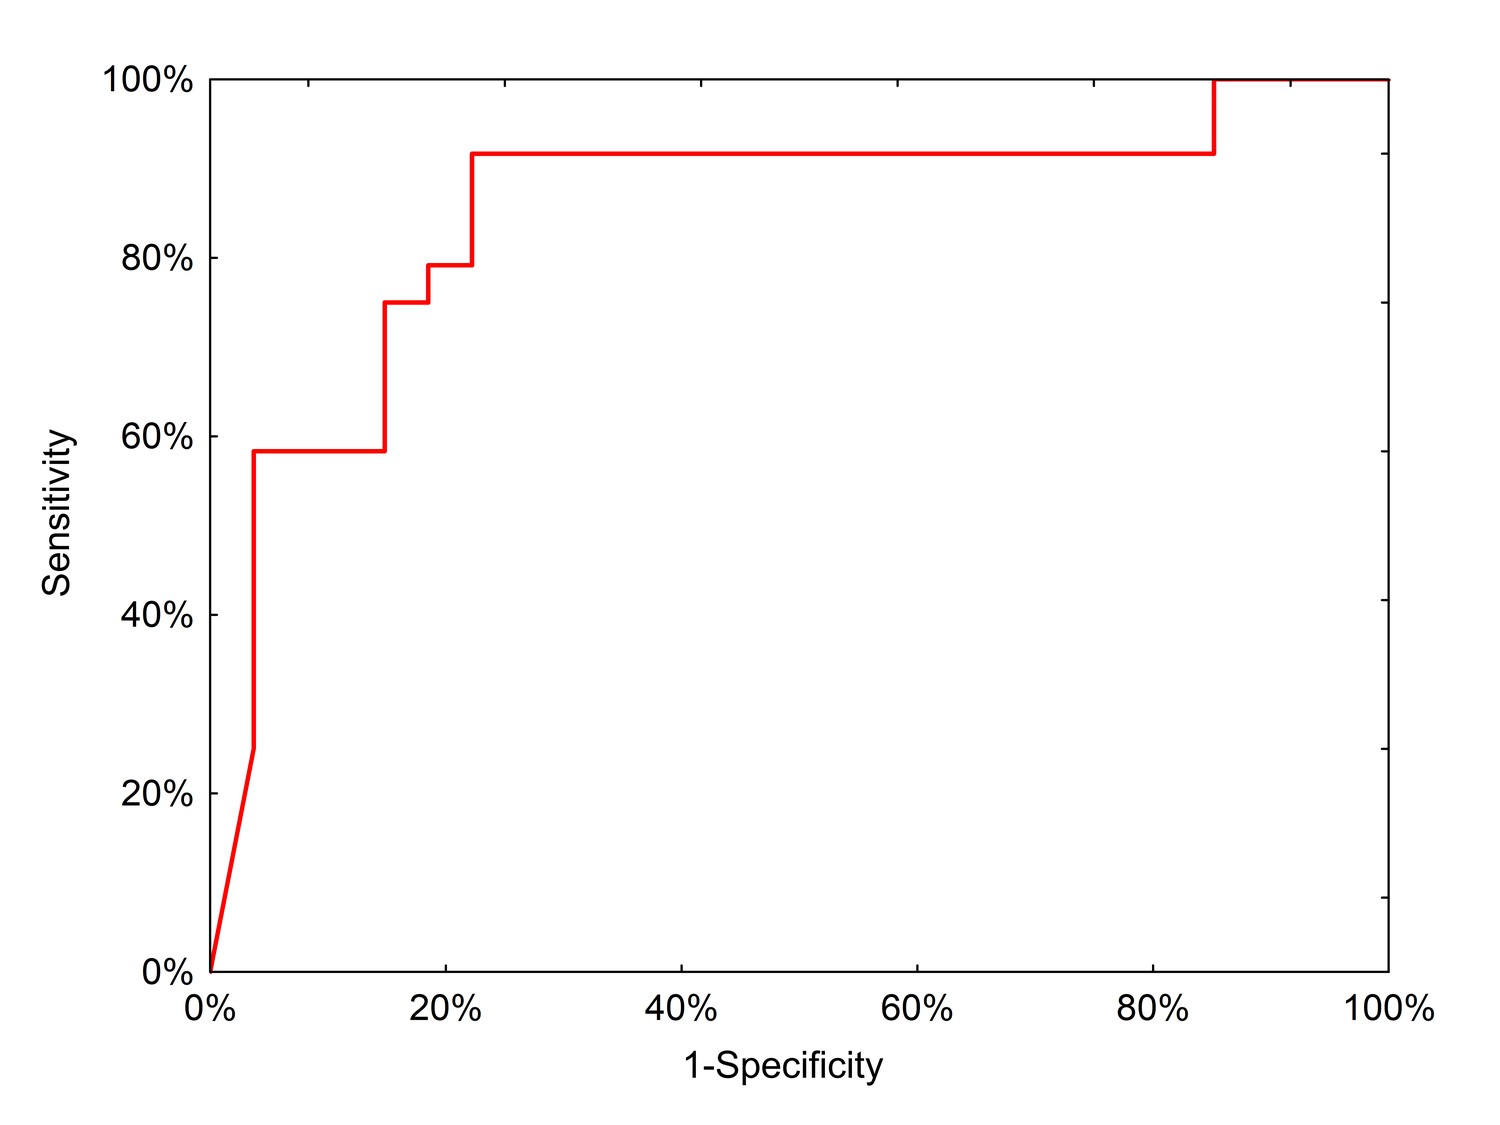
ROC curve for neural network analysis using qPCR inputs from the clinical test set.
https://doi.org/10.7554/eLife.28932.015
Figure 7
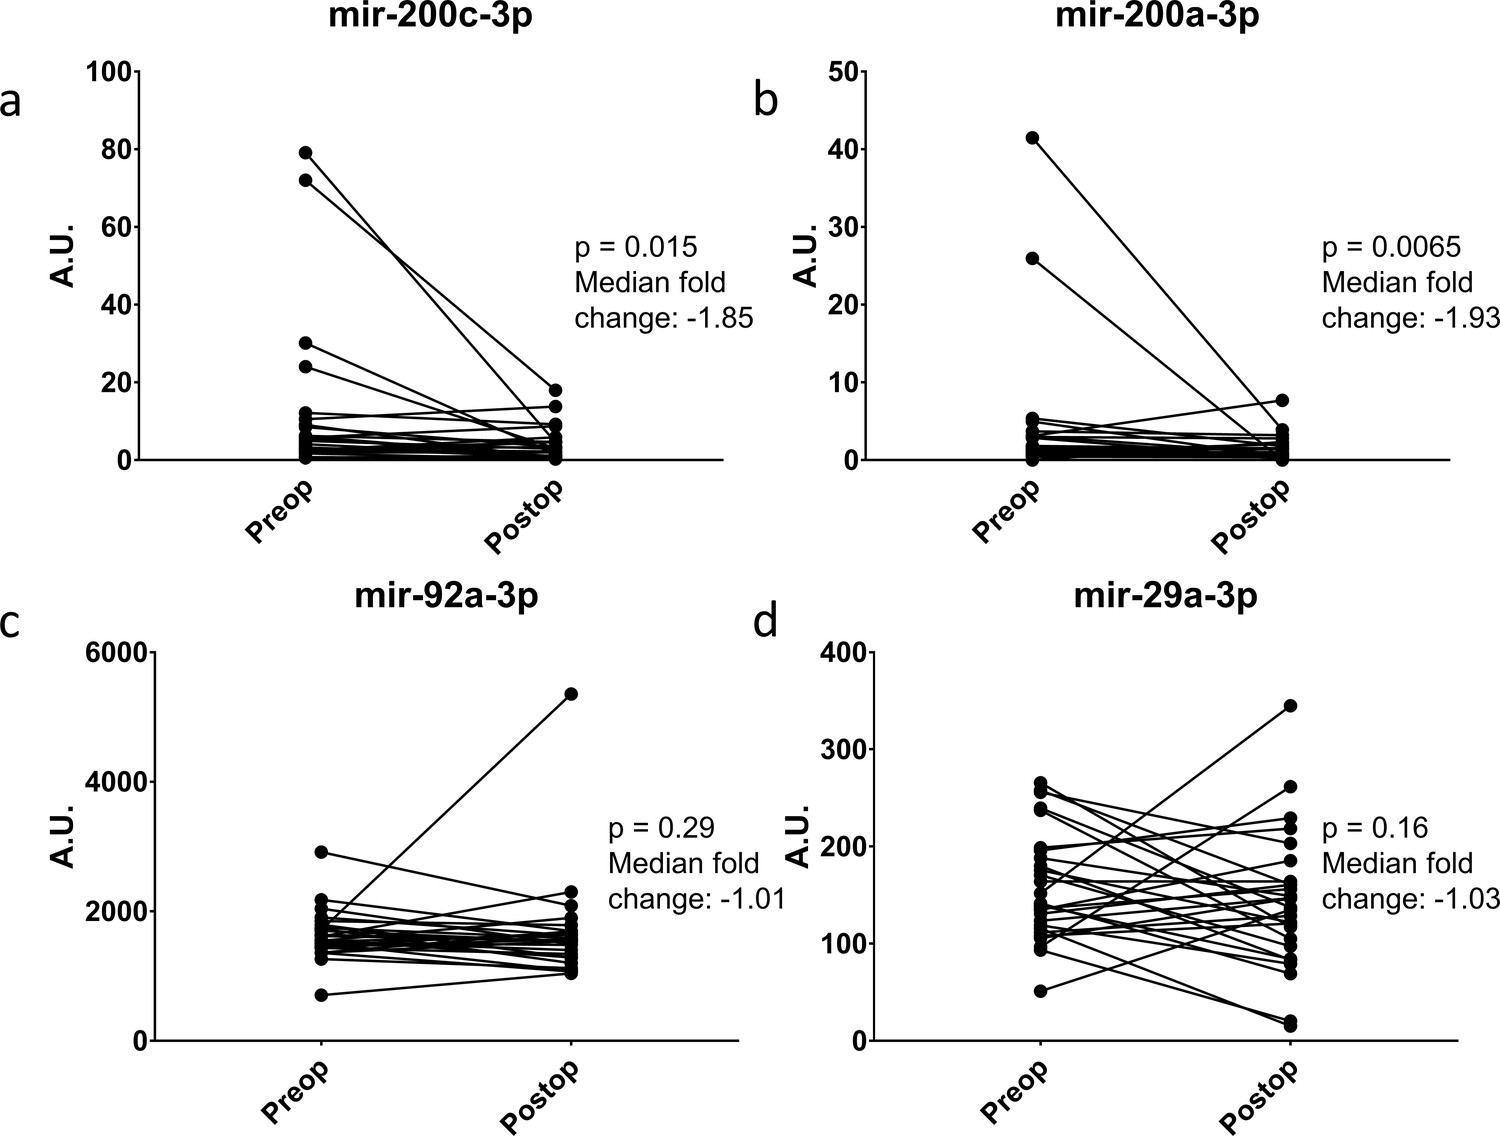
Change in miRNA expression from preop to post-operative day three after surgical cytoreduction.
n = 27.
Figure 8

In situ expression of selected miRNAs from the serum signature.
Sections of fallopian tubes showing serous tubal intraepithelial carcinoma (STIC) lesions and Stage I high grade serous ovariancancer (HGSOC). Lesional cells are indicated by TP53 and Ki-67 staining. (top) STIC lesion in continuity with normal fallopian tube. 20x. (middle) STIC lesion in continuity with normal fallopian tube and invasive cancer with p53-null lesion. 10x. (bottom) HGSOC intraluminal to the fallopian tube. 10x.
Figure 9
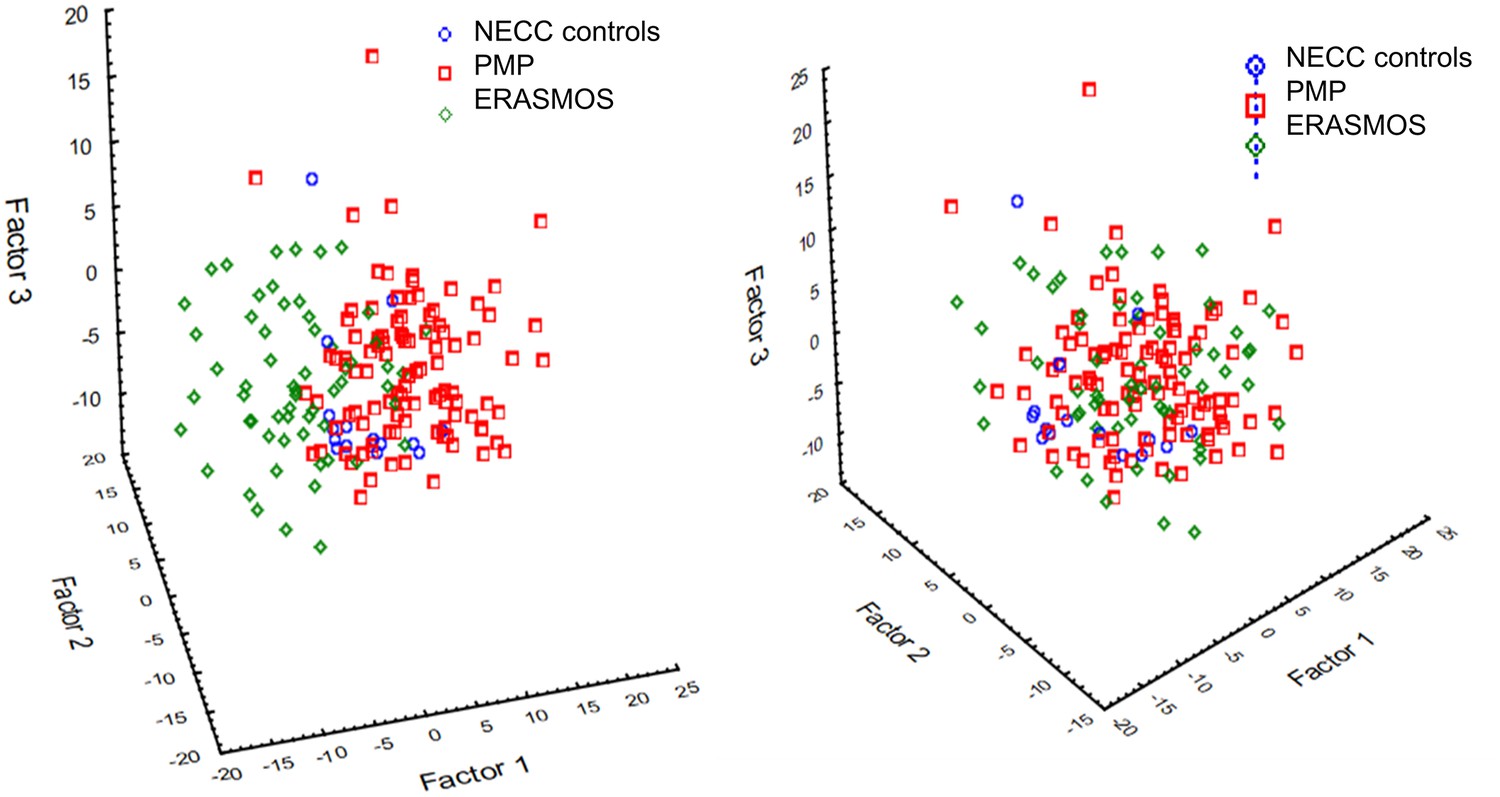
Principal component analysis identified a prominent batch effect among the study populations.
(Left) Before batch effect removal. (Right) After batch effect removal using ComBat . ERASMOS – Effects of Regional Analgesia on Serum miRNA after Oncology Surgery Study. PMP – Pelvic Mass Protocol. NECC – New England Case Control study.
Figure 10
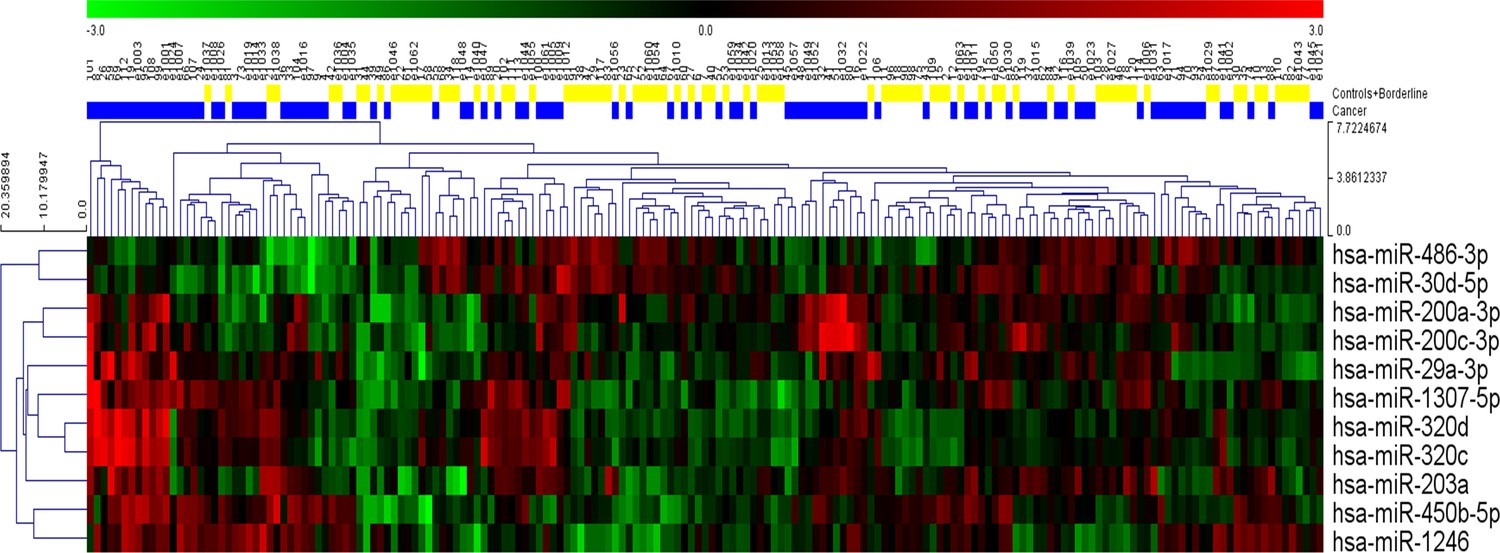
Hierarchical clustering of the eleven statistically significant miRNAs identified using univariate analysis.
While most of the patients with cancer clustered together, considerable heterogeneity was evident, and no clear separation of the groups could be achieved using any single miRNA.
Tables
Table 1
Demographics of patients in the model study populations.
https://doi.org/10.7554/eLife.28932.004| ERASMOS (n = 60) | PMP/NECC (n = 119*) | p-value | |
|---|---|---|---|
| Age, years, median (SD)† | 57 (9.8) | 56 (7.1) | 0.44 |
| CA-125, units/ml, median (SD) † | 155 (689.8) | 88.1 (1335.5) | 0.72 |
| Histology, n (%)‡ | |||
| Control | 0 (0) | 15 (12.6) | <0.0001 |
| Serous cystadenoma/cystadenofibroma | 7 (11.7) | 14 (11.8) | |
| Endometrioma | 0 (0) | 15 (12.6) | |
| Other benign lesion | 9 (15.0) | 0 (0) | |
| Borderline mucinous tumor | 2 (3.3) | 0 (0) | |
| Borderline serous tumor | 5 (8.3) | 15 (12.6) | |
| Stage I/II serous adenocarcinoma | 5 (8.3) | 20 (16.8) | |
| Stage III/IV serous adenocarcinoma | 19 (31.2) | 10 (8.4) | |
| Stage I/II clear cell/endometrioid adenocarcinoma | 6 (10.0) | 20 (16.8) | |
| Stage III/IV clear cell/endometrioid adenocarcinoma | 0 (0) | 10 (8.4) | |
| Mucinous adenocarcinoma | 1 (1.7) | 0 (0) | |
| Other ovarian cancer | 10 (10.0) | 0 (0) | |
| Stage, n (%)‡ | |||
| Not applicable | 16 (26.7) | 59 (49.6) | <0.0001 |
| I | 9 (15.0) | 22 (18.5) | |
| II | 8 (13.3) | 18 (15.1) | |
| III | 19 (31.2) | 18 (15.1) | |
| IV | 8 (13.3) | 2 (1.7) | |
| Grade, n (%)‡ | |||
| Not applicable | 16 (26.7) | 44 (37.0) | 0.07 |
| Borderline | 7 (11.7) | 15 (12.6) | |
| 1 (well-differentiated) | 6 (10.0) | 12 (10.1) | |
| 2 (moderately differentiated) | 3 (5.0) | 12 (10.1) | |
| 3 (poorly differentiated) | 28 (46.7) | 36 (30.3) |
-
ERASMOS – Effects of Regional Analgesia on Serum miRNA after Oncology Surgery Study
PMP – Pelvic Mass Protocol
-
NECC – New England Case Control study
*15samples from NECC, 114 samples from PMP
-
†student’s t-test
‡chi-square test
Table 2
Demographics of patients after stratified random sampling into training and testing sets.
https://doi.org/10.7554/eLife.28932.005| Training (n = 135) | Testing (n = 44) | p-value | |
|---|---|---|---|
| Age, years, median (SD) * | 56 (8.1) | 56 (8.3) | 1.0 |
| CA-125, units/ml, median (SD) * | 126.5 (1193.5) | 105.6 (577.8) | 0.91 |
| Pathology, n (%)† | 1.0 | ||
| Control | 11 (8.1) | 4 (9.1) | |
| Benign lesions | 34 (25.2) | 11 (25.0) | |
| Borderline tumors | 16 (11.9) | 5 (11.4) | |
| Stage I/II invasive cancers | 41 (30.4) | 12 (27.3) | |
| Stage III/IV invasive cancers | 33 (24.4) | 12 (27.3) |
-
*student’s t-test
†chi-square test
Table 3
miRNA variables used in model building identified through univariate testing
https://doi.org/10.7554/eLife.28932.007| Significance-based selection | Correlation-based feature subset selection | Expression fold change selection |
|---|---|---|
| miR-29a-3p | miR-16-2-3p | miR-23b-3p |
| miR-30d-5p | miR-200a-3p | miR-29a-3p |
| miR-200a-3p | miR-200c-3p | miR-32–5 p |
| miR-200c-3p | miR-320b | miR-92a-3p |
| miR-320d | miR-320d | miR-150–5 p |
| miR-320c | miR-200a-3p | |
| miR-450b-5p | miR-200c-3p | |
| miR-203a | miR-203a | |
| miR-486–3 p | miR-320c | |
| miR-1246 | miR-320d | |
| miR-1307–5 p | miR-335–5 p | |
| miR-450b-5p | ||
| miR-1246 | ||
| miR-1307–5 p |
Table 4
Performance of the eleven statistical models on the testing set by variable selection method.
Results are shown for the testing set.
| Variable selection method | |||
|---|---|---|---|
| Statistical model | Significance-based variable subset AUC (95% CI) | Correlation-based feature selection subset AUC (95% CI) | Fold change-based variable subset AUC (95% CI) |
| Linear discriminant analysis | 0.80 (0.66–0.93) | 0.76 (0.62–0.90) | 0.78 (0.64–0.92) |
| Logistic regression | 0.81 (0.68–0.94) | 0.75 (0.61–0.90) | 0.82 (0.70–0.94) |
| Neural network | 0.84 (0.72–0.96) | 0.75 (0.60–0.89) | 0.90 (0.81–0.99) |
| Support vector machine | 0.77 (0.63–0.91) | 0.73 (0.58–0.87) | 0.77 (0.63–0.91) |
| Multivariate adaptive regression splines | 0.57 (0.40–0.74) | 0.66 (0.49–0.82) | 0.73 (0.58–0.88) |
| Naive Bayes classifier | 0.75 (0.60–0.89) | 0.68 (0.52–0.84) | 0.75 (0.60–0.89) |
| Least Absolute Deviation regression tree | 0.77 (0.63–0.91) | 0.61 (0.44–0.78) | 0.69 (0.53–0.84) |
| Functional tree | 0.78 (0.64–0.91) | 0.77 (0.63–0.91) | 0.68 (0.52–0.84) |
| Bayesian network | 0.72 (0.56–0.87) | 0.67 (0.52–0.83) | 0.72 (0.56–0.87) |
| Random forest | 0.78 (0.64–0.91) | 0.71 (0.56–0.86) | 0.76 (0.62–0.90) |
| Elastic net | 0.80 (0.67–0.93) | 0.76 (0.62–0.90) | 0.79 (0.66–0.92) |
Table 5
Clinical characteristics of the qPCR model set.
https://doi.org/10.7554/eLife.28932.014| Characteristic | qPCR model set (N = 325) |
|---|---|
| Age, years, median (SD) | 58.0 (10.1) |
| Grade, n (%) | |
| Borderline | 15 (4.6) |
| 1 | 21 (6.4) |
| 2 | 27 (8.3) |
| 3 | 100 (30.8) |
| unspecified | 10 (3.1) |
| Not applicable | 150 (46.2) |
| FIGO Stage, n (%) | |
| I/II | 75 (23.1) |
| III/IV | 83 (25.5) |
| Not applicable | 167 (51.4) |
| Histology, n (%) | |
| Control | 123 (37.8) |
| Serous cystadenoma/cystadenofibroma | 14 (4.3) |
| Endometrioma | 15 (4.6) |
| Borderline serous tumor | 15 (4.6) |
| Serous adenocarcinoma | 100 (30.8) |
| Endometrioid/clear cell adenocarcinoma | 48 (14.8) |
| Mucinous adenocarcinoma | 10 (3.8) |
Table 6
Clinical characteristics of the external validation set.
https://doi.org/10.7554/eLife.28932.016| Characteristic | Polish external validation set (N = 51) |
|---|---|
| Age, years, median (SD) | 55.5 (16.1) |
| Grade, n (%) | |
| Borderline | 4 (7.8) |
| 1 | 2 (3.9) |
| 2 | 7 (13.7) |
| 3 | 13 (25.5) |
| unspecified | 3 (5.9) |
| Benign | 22 (43.1) |
| FIGO Stage, n (%) | |
| I | 7 (13.7) |
| II | 3 (5.9) |
| III | 18 (35.3) |
| IV | 1 (2.0) |
| Benign | 22 (43.1) |
| Histology, n (%) | |
| Serous cystadenoma/cystadenofibroma | 6 (11.8) |
| Endometrioma/endometriosis | 10 (19.6) |
| Mature teratoma | 6 (11.8) |
| Borderline serous tumor | 2 (3.9) |
| Borderline seromucinous tumor | 2 (3.9) |
| Serous adenocarcinoma | 4 (7.8) |
| Mucinous adenocarcinoma | 1 (2.0) |
| Endometrioid adenocarcinoma | 1 (2.0) |
| Clear Cell Adenocarcinoma | 9 (17.6) |
| Mixed adenocarcinoma | 3 (5.9) |
| Adenocarcinoma unspecified | 7 (13.7) |
Additional files
-
Source code 1
miRNA-seq neural network source code.
- https://doi.org/10.7554/eLife.28932.021
-
Source code 2
qPCR 14-miRNA neural network source code.
- https://doi.org/10.7554/eLife.28932.022
-
Source code 3
qPCR 7-miRNA neural network source code.
- https://doi.org/10.7554/eLife.28932.023
-
Source code 4
neural network applied to the Keller, et al dataset.
- https://doi.org/10.7554/eLife.28932.024
-
Supplementary file 1
Performance of the various prediction models on the unadjusted datasets.
(A) Area under the ROC curve analyses for the various testing methods depending on the variable selection protocol using data without batch adjustment. Like the batch-adjusted data, the neural network using the fold change variable outperformed the other methods in terms of classifier accuracy and did not overfit the predictions to the training set. (B) Individual sample predictions of the tested classification models built on the unadjusted fold change-based variable selection miRNA subset.
- https://doi.org/10.7554/eLife.28932.025
-
Supplementary file 2
Post-hoc secondary analyses of the neural network.
(A) Misclassification matrices for the neural network and CA125 predictions with detailed histopathological data. (B) Misclassification matrices for the neural network stratified by age. (C) miRNA expression by tumor histology and stage.
- https://doi.org/10.7554/eLife.28932.026
-
Supplementary file 3
Characteristics of CA125 expression in the study populations.
(A) Serum CA125 measurements among cancer and non-cancer cases in the two study populations. (B) Relationship between CA125 and miRNAs in the neural network.
- https://doi.org/10.7554/eLife.28932.027
-
Supplementary file 4
Comparison of the neural network to existing datasets.
(A) Mapping of the 14-miRNA dataset from the miRNA-sequencing study onto the GSE31568 dataset published by Keller, et al. (B) Comparison of the neural network (NN) classifier with the tissue-based MiROvaR signature by Bagnoli et al.
- https://doi.org/10.7554/eLife.28932.028
-
Supplementary file 5
Univariate comparison of miRNA average expression values between patients with cancer and patients in the benign/borderline/control group.
- https://doi.org/10.7554/eLife.28932.029
-
Supplementary file 6
Supplementary datasets.
Supplementary Dataset (1) TPM data from miRNA sequencing. Supplementary Dataset (2) Batch adjusted, log10-transformed miRNA expression data, filtered for miRNA detection levels in both cohorts. Supplementary Dataset (3) qPCR Validation of neural network. Supplementary Dataset (4) Raw qPCR data. Supplementary Dataset (5) Background Filtered qPCR data. Supplementary Dataset (6) Normalized qPCR data. Supplementary Dataset (7) Normalized expression data from the Keller et al. dataset. Supplementary Dataset (8) Normalized expression data of preoperative and postoperative miRNA expression.
- https://doi.org/10.7554/eLife.28932.030
-
Transparent reporting form
- https://doi.org/10.7554/eLife.28932.031
-
Reporting standard 1
- https://doi.org/10.7554/eLife.28932.032
Download links
A two-part list of links to download the article, or parts of the article, in various formats.
Downloads (link to download the article as PDF)
Open citations (links to open the citations from this article in various online reference manager services)
Cite this article (links to download the citations from this article in formats compatible with various reference manager tools)
Diagnostic potential for a serum miRNA neural network for detection of ovarian cancer
eLife 6:e28932.
https://doi.org/10.7554/eLife.28932


