Conserved noncoding transcription and core promoter regulatory code in early Drosophila development
- Cold Spring Harbor Laboratory, United States
Figures
Figure 1 with 2 supplements
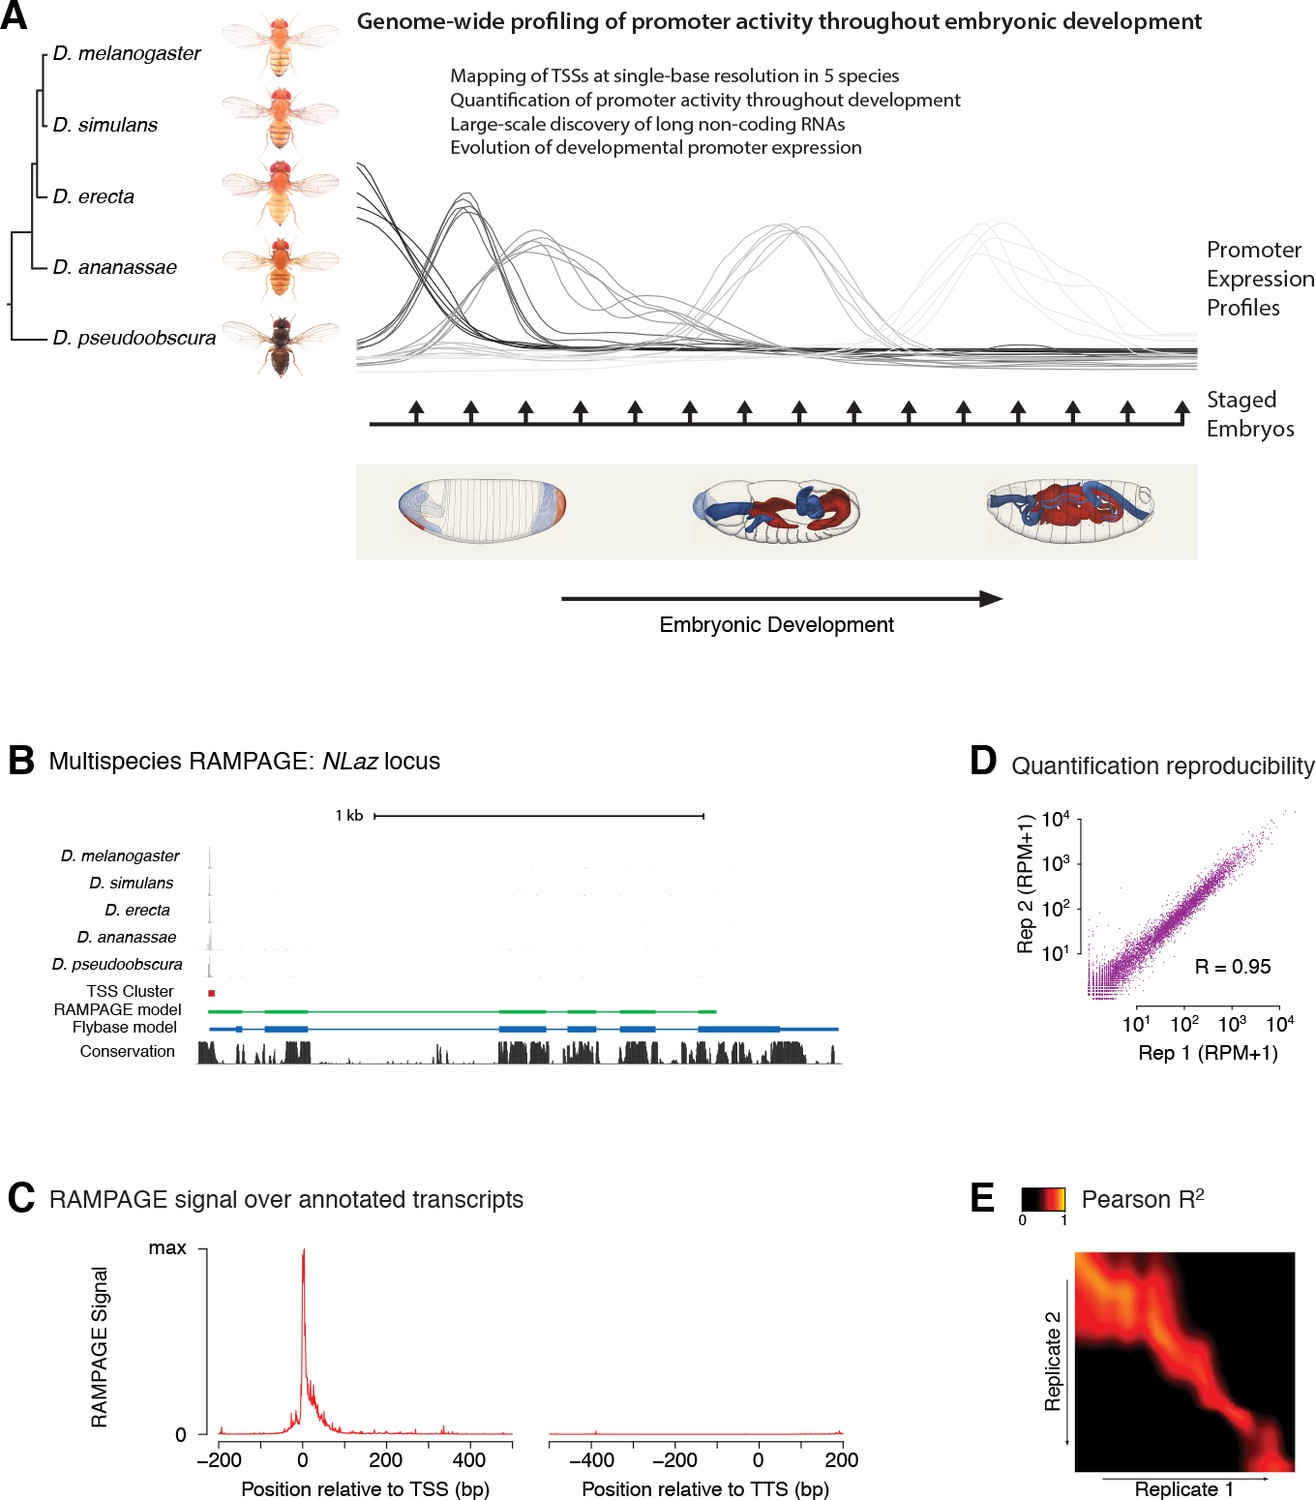
Comparative profiling of embryonic promoter activity.
(A) Genome-wide TSS usage maps were generated by RAMPAGE assays for developmental series in five species. These datasets constitute single-nucleotide measurements of transcriptional activity at 1 hr resolution throughout embryonic development, and a global survey of its evolution over 25-50MY. Fly photographs (N. Gompel) and embryo drawings (V. Hartenstein, CSHL Press 1993) reproduced with permission from FlyBase. (B) This panel illustrates the 5-species RAMPAGE data at a conserved locus (NLaz). The top five tracks show the density of RAMPAGE read 5’ ends over the locus. The non-melanogaster data was aligned to the appropriate genome references and projected for visualization onto the orthologous positions in D. melanogaster. The next tracks show the Transcription Start Site Cluster (TSC) called from this 5’ end data in D. melanogaster, and the partial transcript model reconstructed for this TSC from the full sequencing reads. Note the agreement with the transcript annotated in FlyBase, in blue, for the portion covered by the data. The last track shows phastCons sequence conservation scores. (C) Metagene profile of RAMPAGE read 5’ ends over FlyBase-annotated mature transcripts (introns excluded). (D) Reproducibility of RAMPAGE signal quantification for individual TSCs (n = 9,299) for two biological replicates of the first D. melanogaster time point (0–1 hr). TSCs with no signal in either replicate were excluded. (E) Correlation matrix for the D. melanogaster time series biological replicates. The heatmap shows the correlation of TSC expression (n = 24,832 TSCs) after upsampling, smoothing and alignment of the time series (see Materials and methods).
Figure 1—figure supplement 1
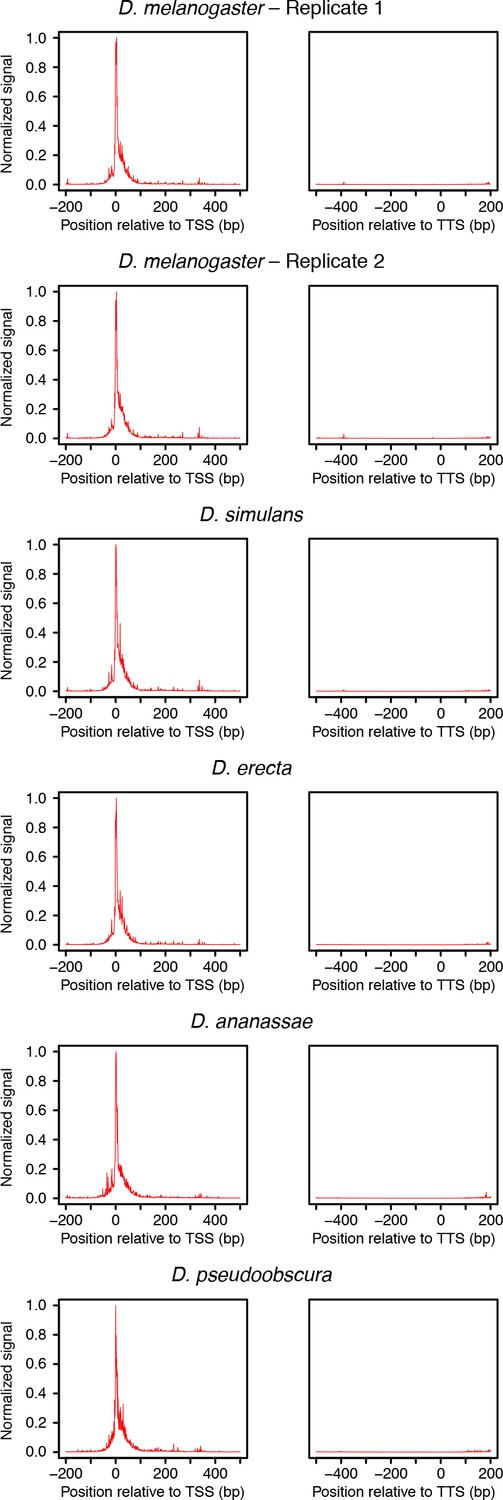
Distribution or raw RAMPAGE signal over transcript annotations.
For each species, RAMPAGE reads were mapped to the appropriate genome. The raw 5’ signal was then converted to orthologous D. melanogaster coordinates using chained pairwise alignments from UCSC. Metagene profiles were constructed by summing signal intensity over FlyBase r5.49 mRNA annotations.
Figure 1—figure supplement 2
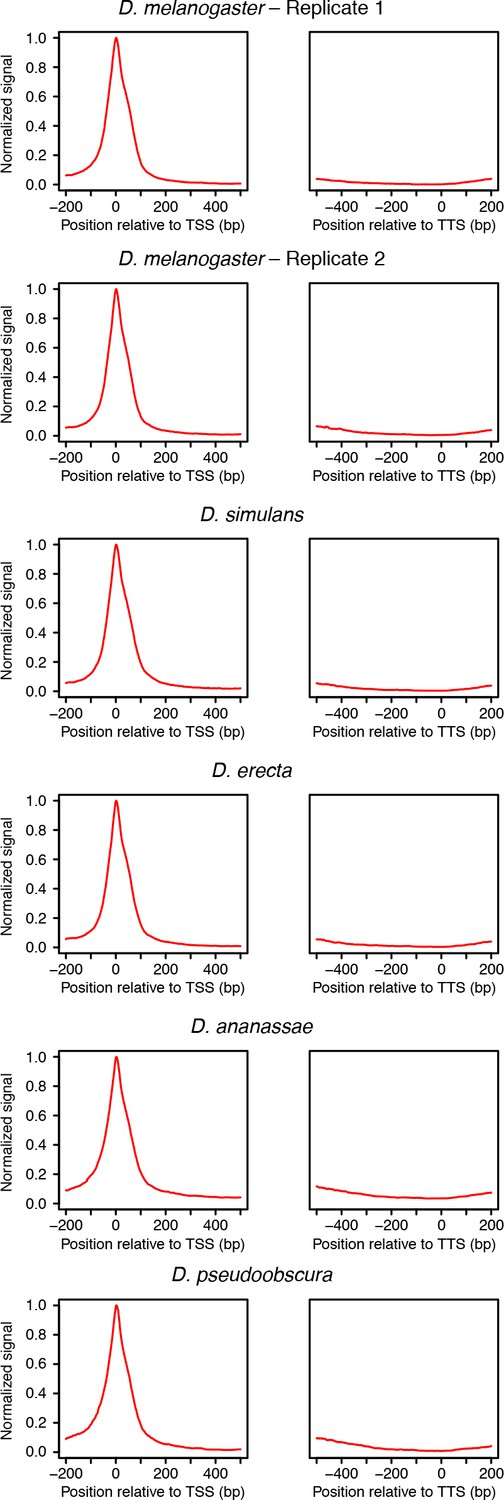
Distribution or RAMPAGE peaks over transcript annotations.
For each species, RAMPAGE reads were mapped to the appropriate genome and peaks called as de- scribed in Materials and methods. The peak coordinates were then converted to orthologous D. melanogaster coordinates using chained pairwise alignments and the liftOver tool from the UCSC Genome Browser. Metagene profiles were constructed by summing signal intensity over FlyBase r5.49 mRNA annotations.
Figure 2 with 4 supplements
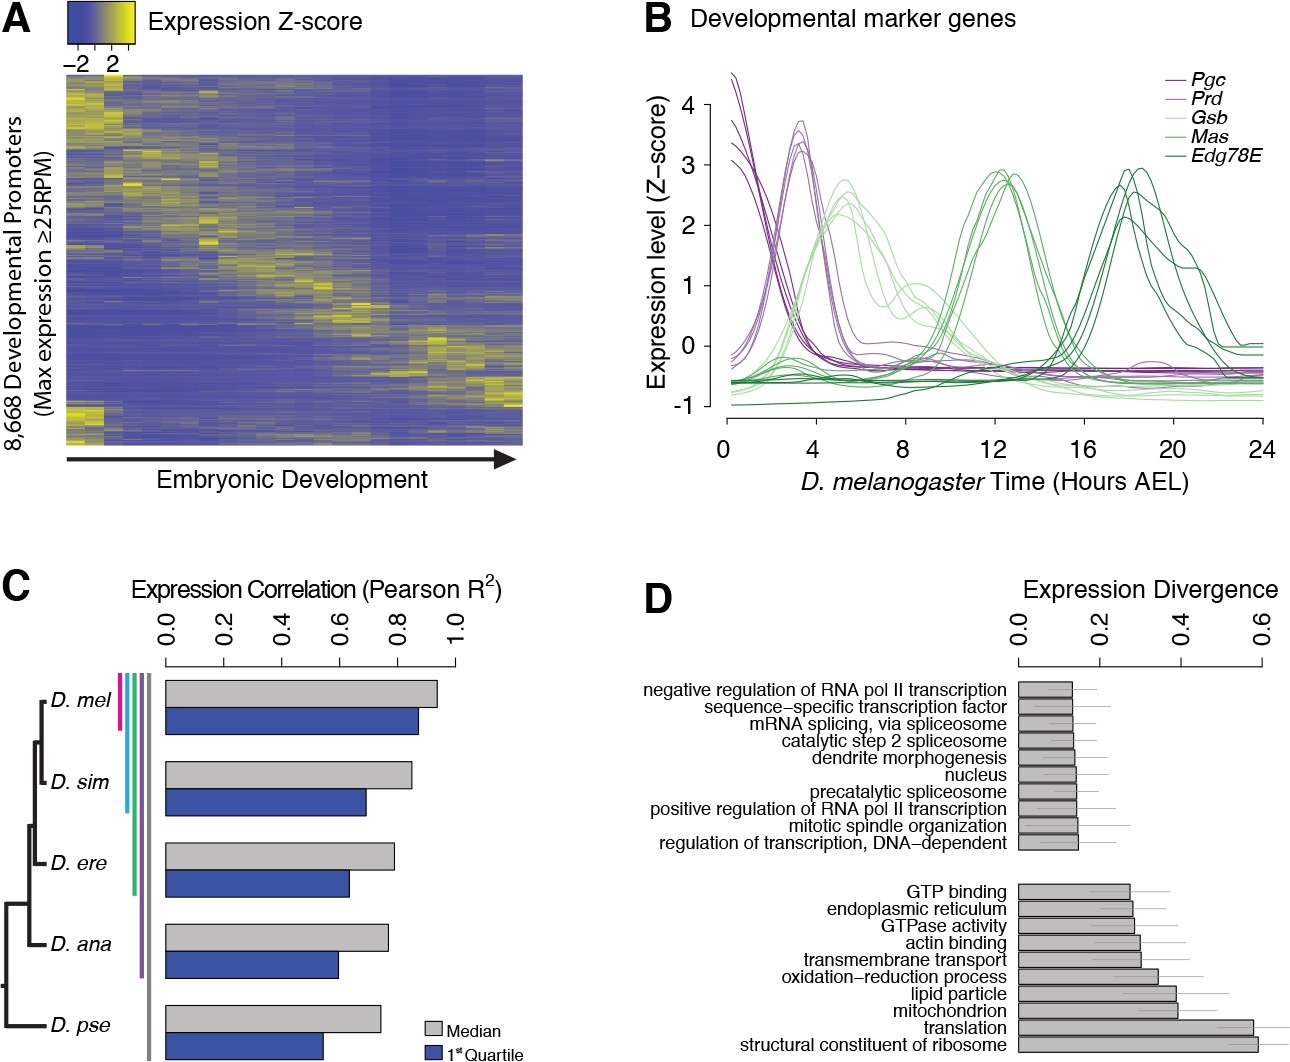
Evolutionary divergence of the developmental timing of promoter activity.
(A) Hierarchically clustered expression profiles for individual D. melanogaster promoters throughout embryogenesis (24 time points; replicate 1). Only promoters with a maximum expression level ≥25 RPM (n = 8,668), for which quantification reproducibility is very high, are included. (B) Expression profiles for five developmental marker genes, after global alignment of all time series to D. melanogaster (see Materials and methods). The five curves for each gene correspond to the five species. (C) Conservation of the temporal expression profiles of individual promoters for all subclades of the phylogeny (subclades include all species descended from a common ancestor, and are coded by color bars next to the tree). For each subclade, we computed the average correlation coefficient between all pairs of species for each individual gene. The graph shows the median and first quartile over all genes with orthologs throughout the subclade. (D) The evolutionary divergence of expression specificity varies widely between Gene Ontology (GO) categories (p<10−16, one-way ANOVA). For each gene with a GO annotation, orthologs in all five species, maximum expression ≥25 RPM and expression changes ≥5 fold (n = 2,690), we computed a measure of overall divergence across the clade (see Materials and methods). The bar plot shows the average divergence by GO category, for the 20 categories with the lowest (top) and greatest (bottom) divergence. Error bars show ±1 standard deviation.
Figure 2—figure supplement 1
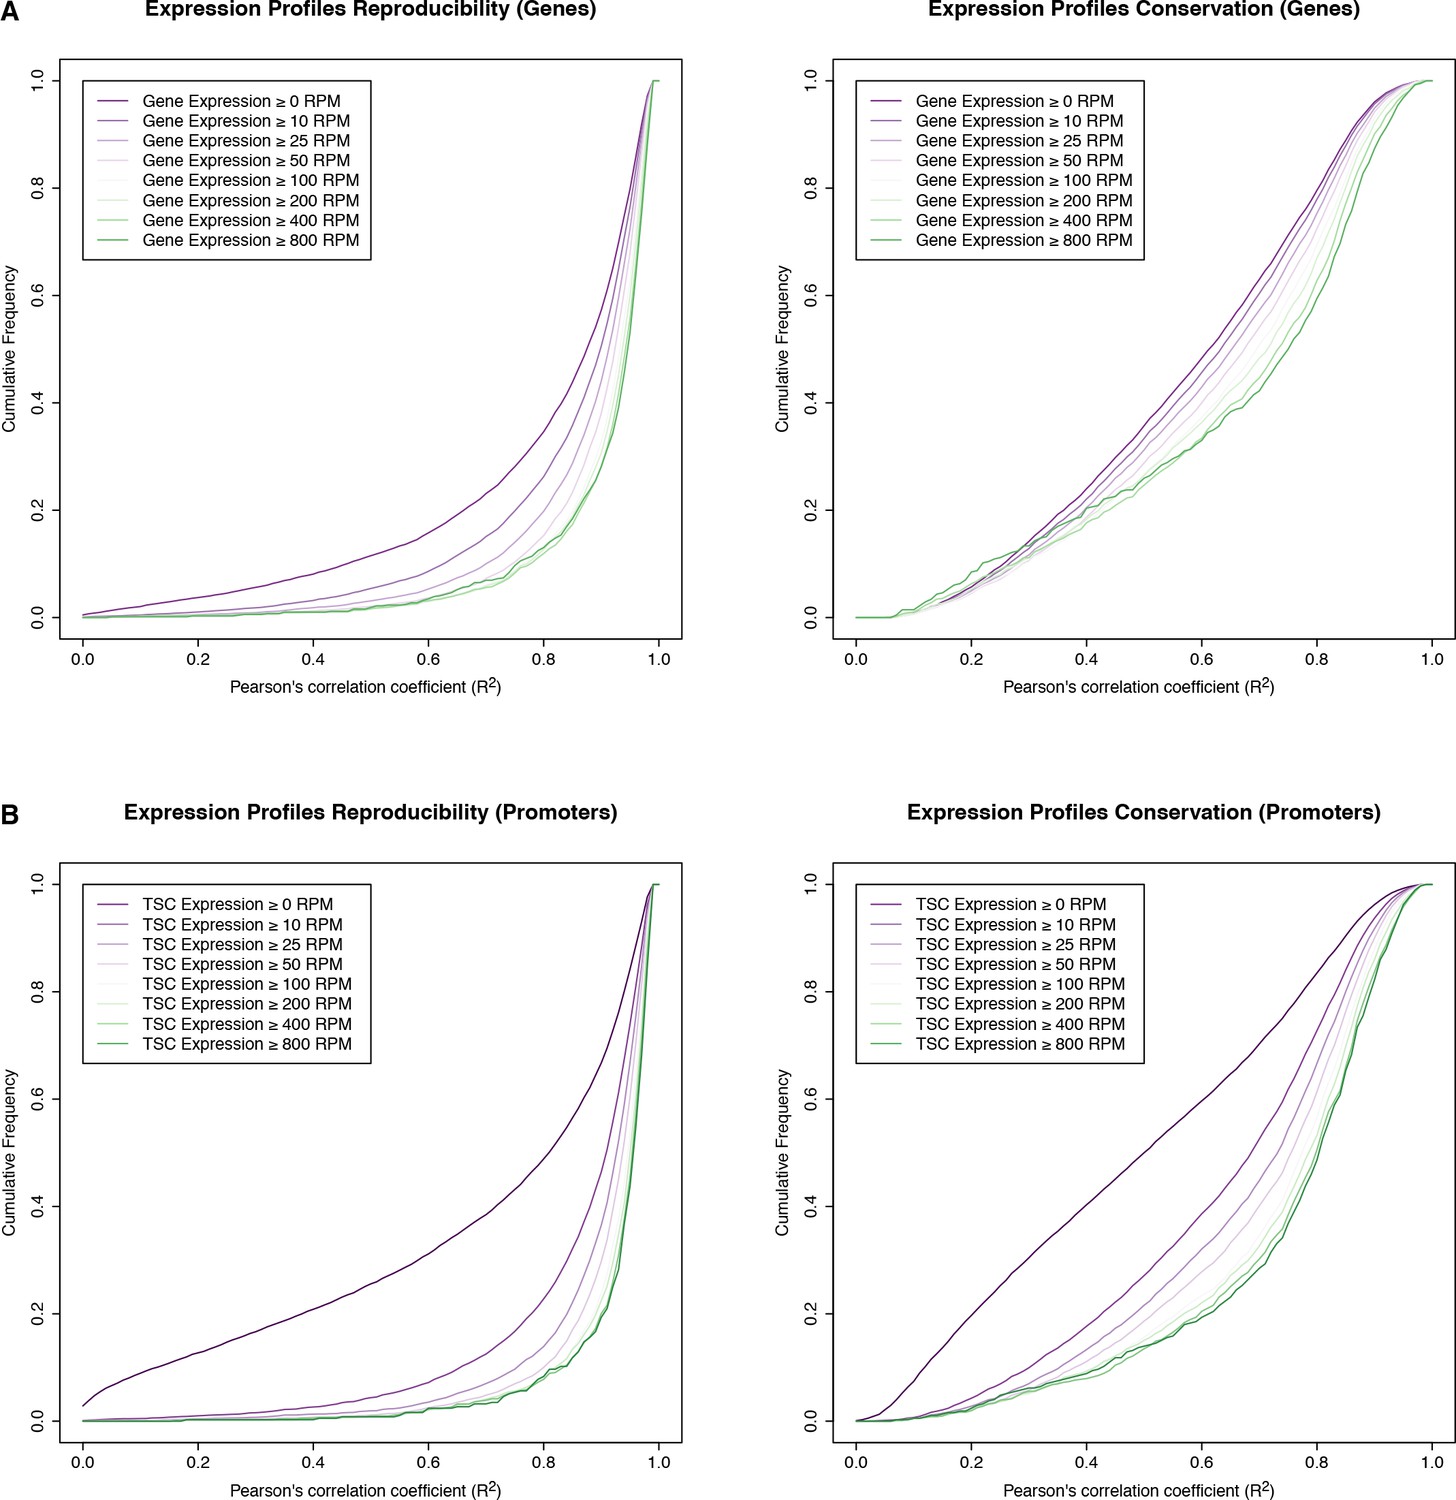
Reproducibility of expression time series.
Reproducibility of expression profile measurements for genes (A) and individual TSCs (B). The graphs represent cumulative distributions of expression profile correlations across D. melanogaster biological replicates (left), and across all species (right). We only considered genes whose maximum expression level throughout the D. melanogaster time series (replicate 1) exceeded a given threshold (see legends; RPM: reads per million). Note that the variation across species vastly exceeds the variation across replicates, at all expression thresholds considered.
Figure 2—figure supplement 2
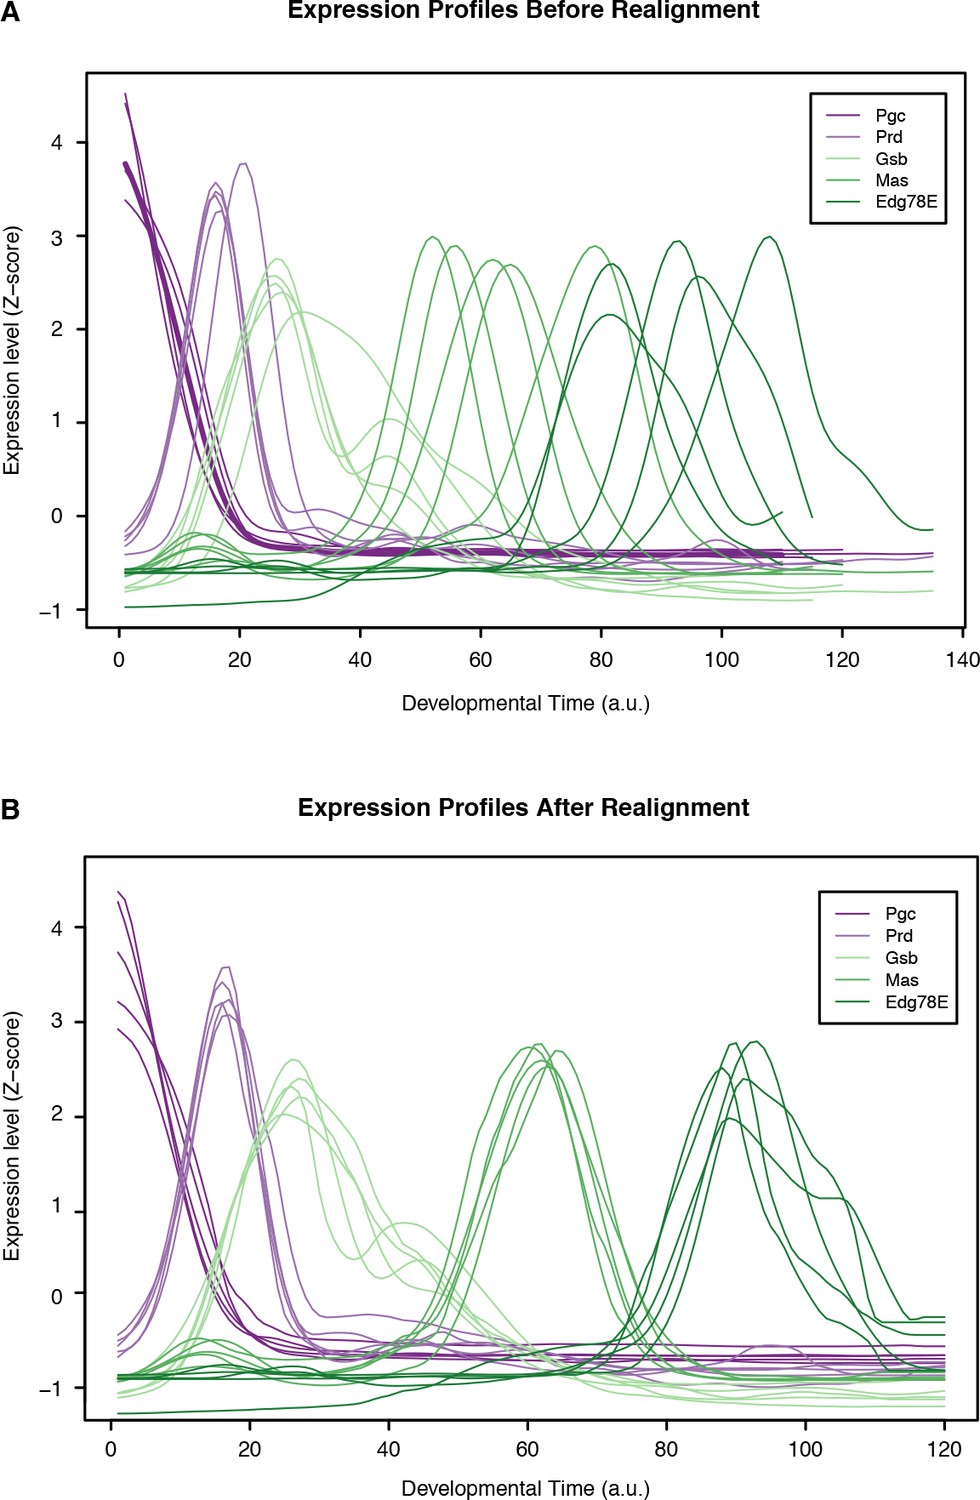
Time series alignment by time-warping of gene expression profiles.
Global gene expression profiles from all species were aligned to the D. melanogaster time series as de- scribed in Materials and methods. This figure shows the expression profiles for well-characterized developmental regulators before (A) and after (B) alignment. The time scale corresponds to the absolute D. melanogaster developmental time (24 hr divided into 120 units by upsampling).
Figure 2—figure supplement 3
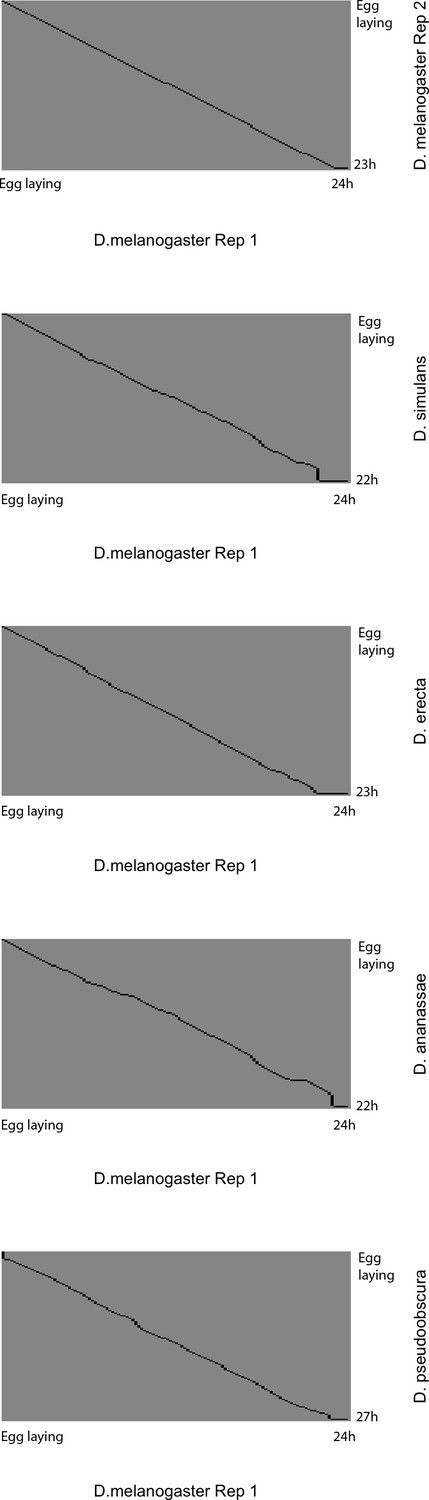
Global alignment of time series to D. melanogaster reference.
Each panel shows the global alignment path for each developmental time series to the D. melanogaster Replicate 1 reference. The black lines show the best-estimate alignment path that maximizes the global similarity of gene expression profiles for the entire time series. Note that the alignments consist primarily of largely linear transformations (expansion/compression) throughout the entire series, rather than local distortions. The poor quality of the alignments at the very end of time series is due partly to the fact that not all developmental series ended at exactly orthologous time points, and partly to the poorer performance for alignment ends that is inherent to the algorithm.
Figure 2—figure supplement 4
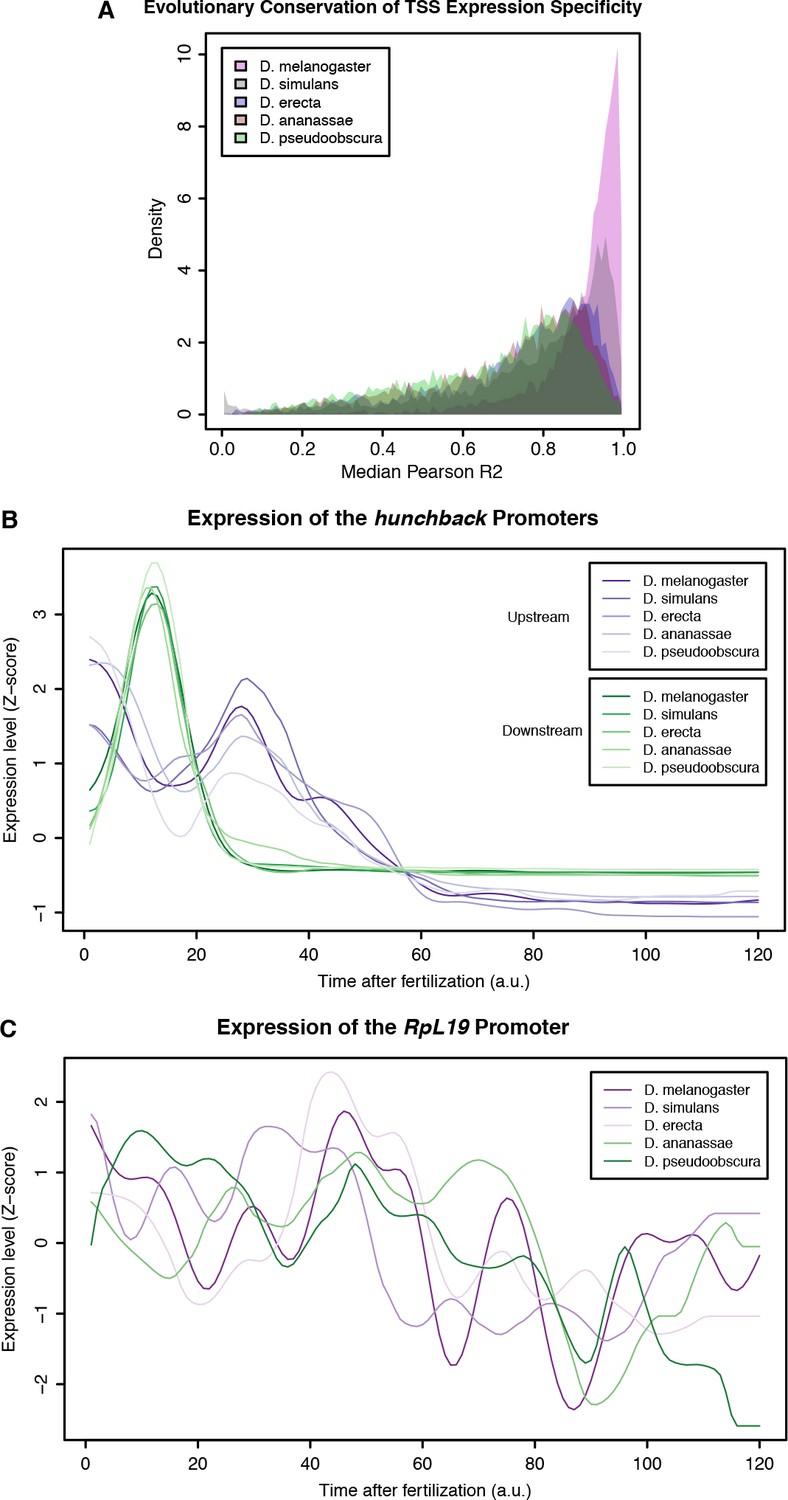
Evolutionary conservation of TSC expression profiles.
(A) Distribution of average correlation coefficients for all orthologous TSCs between pairs of species. (B) Aligned expression profiles for the 2 promoters of the hunchback gene. (C) Aligned expression profiles for the RpL19 gene.
Figure 3 with 1 supplement

Core promoter structure defines three broad phases of embryonic development.
(A) Clustering of expression profiles for 3462 promoters (maximum expression ≥10 RPM) defined as housekeeping (H, n = 240) or developmentally regulated (D, n = 3,222). Developmentally regulated promoters are divided into eight groups based on hierarchical clustering of expression profiles (see Materials and methods). Core promoter structure defines three broad developmental phases (color sidebar). (B) Relative enrichment of core promoter motifs in each expression cluster. Three major clusters can be defined (bottom color bar), which correspond to 3 phases of embryonic development (see (A); Early: 817 TSCs; Intermediate: 2,047; Late: 598). (C) Clustering of core promoter motifs based on their co-occurrence in the same promoters. This approach yields the same three major sets of motifs previously defined based on expression profiles (see (B)). (D) Predictions of expression timing from core promoter structure. Quadratic discriminant analysis on log-transformed motif scores was used to predict the developmental phase in which promoters are expressed. The performance of the classifier in leave-one-out cross-validation (color bars) is compared to random expectation (grey bars; FDR-corrected chi-square tests applied to individual contingency tables as appropriate). (E) Distinct sets of TFBSs are enriched near the core promoters active in the three developmental phases. The top three motifs for each core promoter class are shown. (F) The conservation of core promoter motif composition between D. melanogaster and D. pseudoobscura confirms the biological relevance of the motifs. (Grey bars: conservation of shuffled motifs; FDR-corrected chi-square tests). (G) Many TFBSs are strongly associated with specific sets of core promoter motifs. Results are shown for the three motifs most enriched near the promoters of each expression cluster. (H) The three major core promoter classes display distinct profiles of sequence conservation. Lines: median phastCons scores across promoters of the class. Envelope: standard error in the estimate of the median, computed by bootstrapping.
Figure 3—figure supplement 1
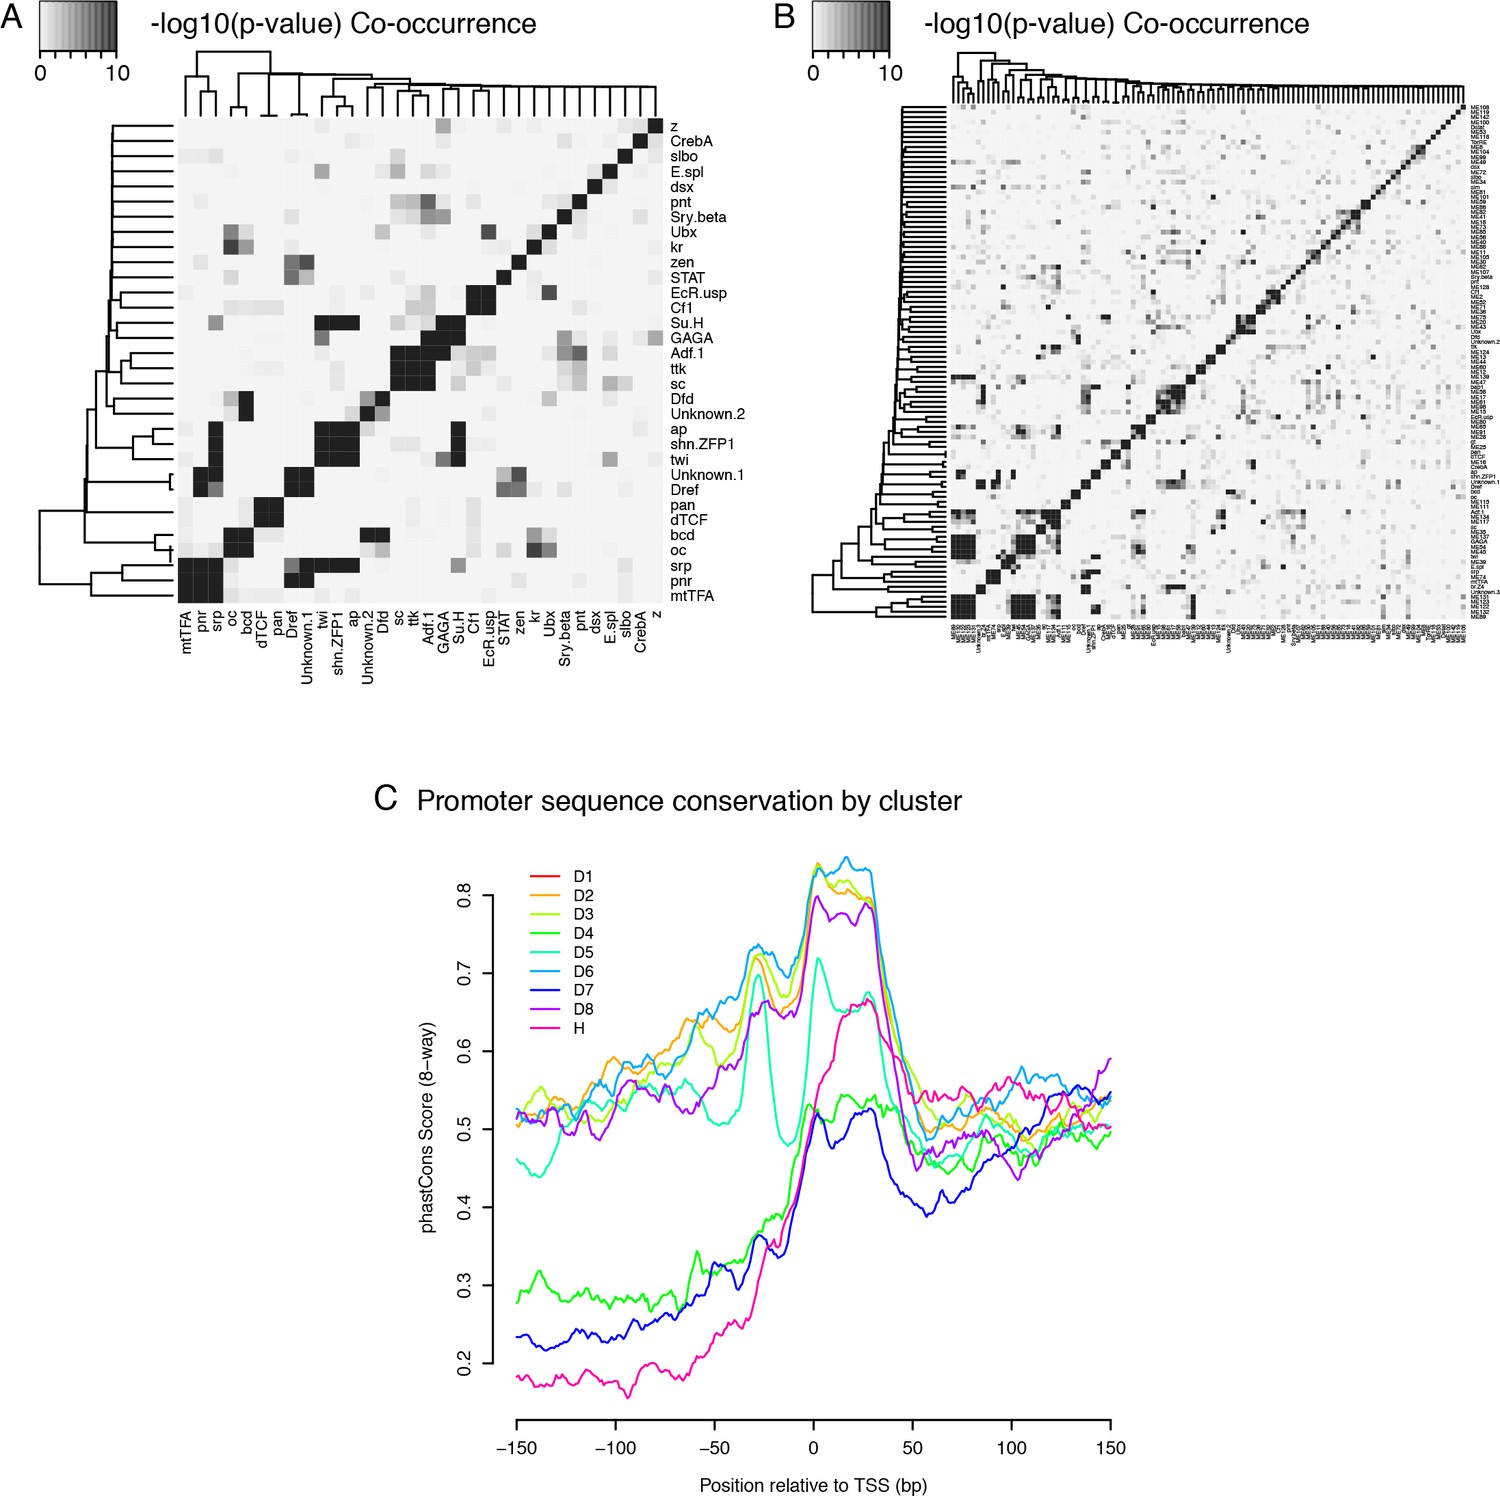
Core promoter types: Co-occurence of TFBSs and Sequence conservation profiles.
(A) Co-occurence of TFBSs within the same promoter regions (top three motifs for each of the nine expression clusters) (B) Co-occurence of TFBSs within the same promoter regions (top 10 motifs for each cluster) (C) Median sequence conservation profiles of the promoter regions of the nine clusters (8-way phastCons scores).
Figure 4 with 1 supplement
Selection on expression specificity shapes promoter sequence evolution.
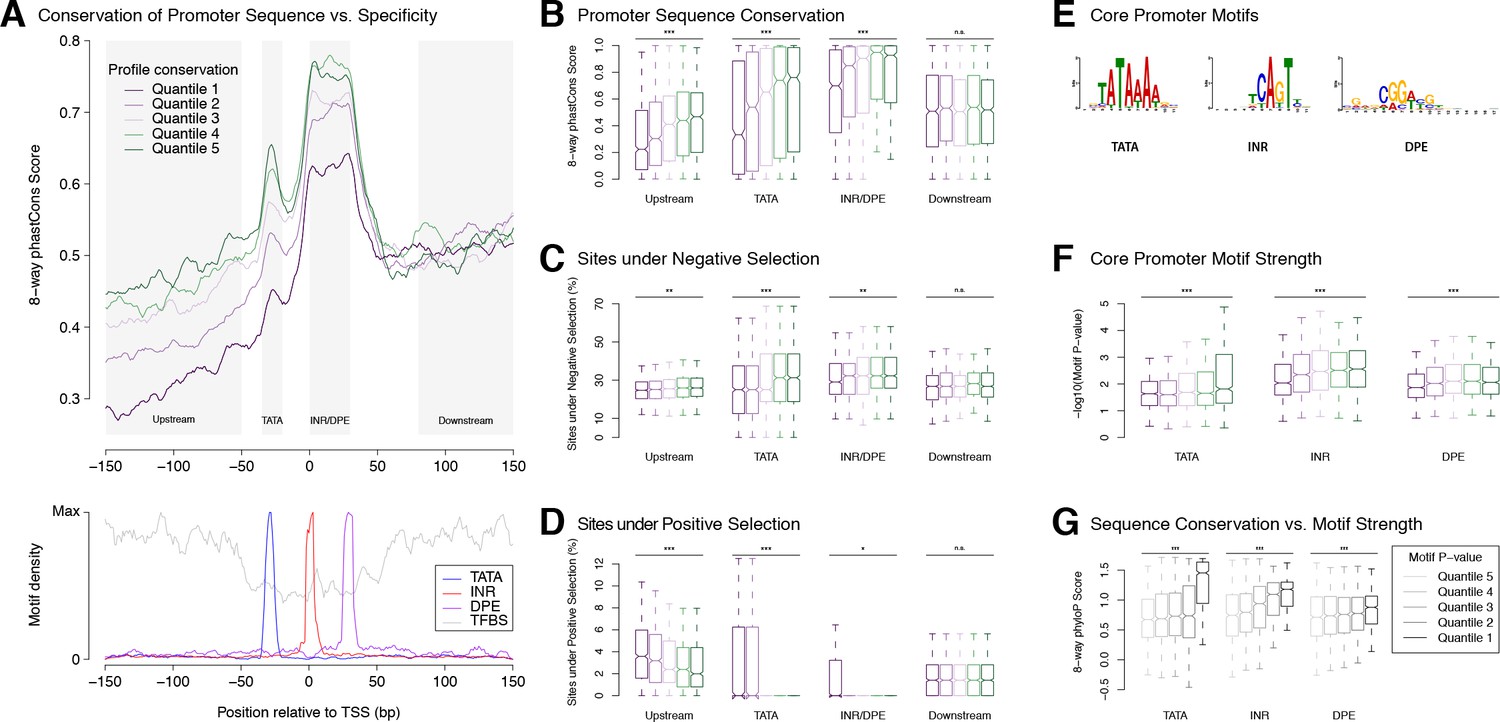
(A) Upper panel: average sequence conservation for D. melanogaster promoters, by expression profile conservation quantile. All D. melanogaster promoters with maximum expression ≥25 RPM and functionally conserved in all five species were included (n = 4,973). Lower panel: density of core promoter elements and TFBSs over all promoters. TATA box, INR, DPE: respective consensus sequences STATAAA, TCAGTY or TCATTCG, KCGGTTSK or CGGACGT (FitzGerald et al., 2006); TFBS motifs from Jaspar. (B) Correlation between expression profile and promoter sequence conservation. For each of the subregions depicted as shaded areas in A (except Downstream), there is a significant correlation between expression profile conservation and phastCons score across all promoters analyzed (*** p-value<10−8 for Pearson correlation test between profile conservation and sequence conservation; **p<10−4; *p<10−2; n.s. not significant. Upstream region runs from −300 to −50 bp). For graphical display, promoters were grouped into expression conservation quantiles, and the boxplots show the distribution of phastCons scores for each quantile. (C) Proportion of bases under purifying selection (phyloP score >0.1). (D) Proportion of bases under positive selection – that is, evolving faster than neutral sequences (phyloP score <−0.1) – at promoter subregions for each profile conservation quantile. (E) Core motif position weight matrices derived de novo from promoter sequences (see Materials and methods). (F) Core motif strength correlates with expression profile conservation. (G) Core motif sequence conservation correlates with proximity to motif consensus.
Figure 4—figure supplement 1
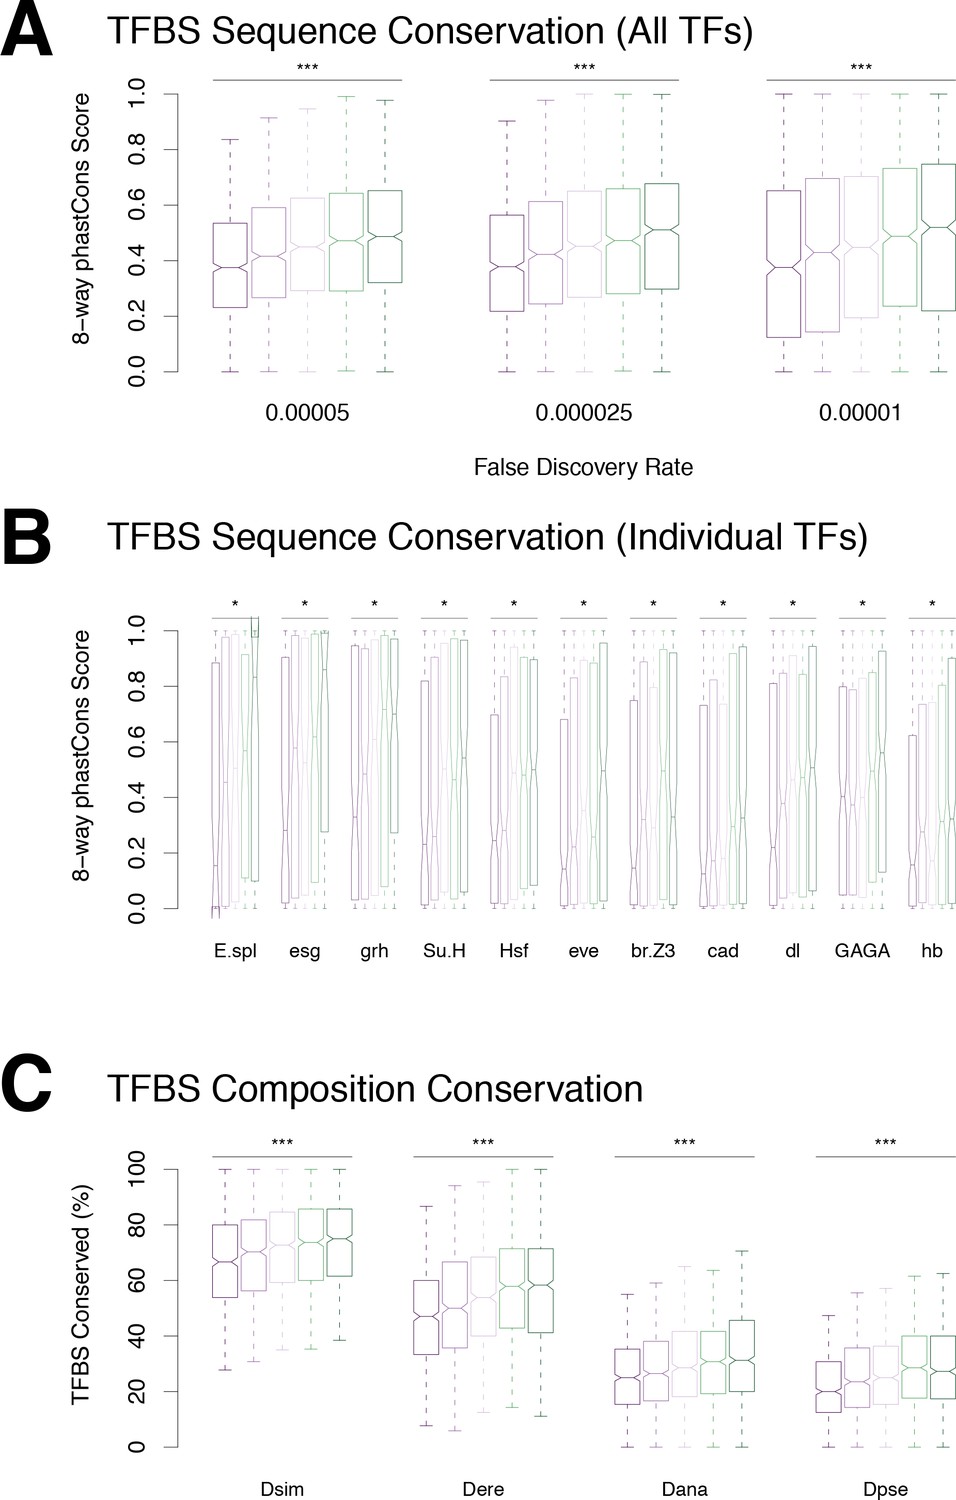
Conservation of transcription factor binding sites.
(A) TFBS sequence conservation versus profile conservation. (B) Conservation of individual motif types. We found a significant correlation between motif sequence conservation and promoter profile conservation for 20 motif types (Bonferroni-corrected p-value<0.01). (C) Conservation of promoter TFBS composition, regardless of TFBS position.
Figure 5 with 4 supplements

Widespread evolutionary gain and loss of promoters.
(A) Proportion of D. melanogaster TSCs reproducibly detected in biological duplicates (first pair of bars) and functionally conserved in all species of subclades of increasing sizes. A TSC called in D. melanogaster Replicate 1 is deemed lost in another species (or replicate) if the orthologous region shows ≥100 fold reduced signal across the time course (see Materials and methods). Subclades include all descendants of a common ancestor, and are designated by the species that is most distantly related to D. melanogaster. (B) The species phylogeny can be accurately reconstructed from patterns of TSC gain and loss. The presence/absence of each TSC was treated as a discrete character and the unrooted tree reconstructed using the Phylip software package. (C) Average profiles of sequence conservation over the TSCs functionally conserved across all five species and those specific to D. melanogaster. The shaded areas represent the standard deviation, estimated from 1000 bootstraps. (D) TSCs driving the expression of annotated genes display a far higher degree of functional conservation than ‘orphan’ TSCs (p<0.01 for all pairwise comparisons; chi-square test with Bonferroni correction).
Figure 5—figure supplement 1
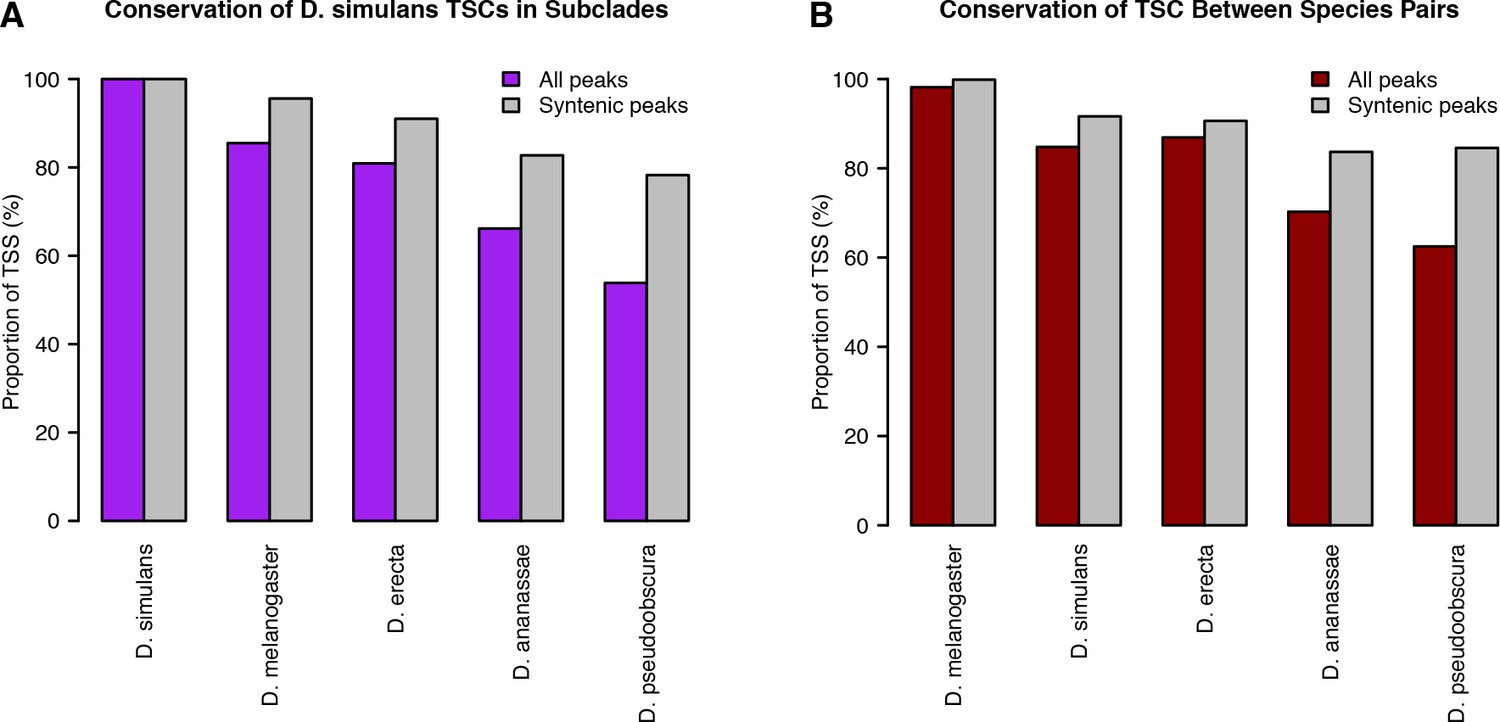
Alternative analyses of TSC conservation.
TSC conservation was quantified as described in Materials and methods. (A) D. simulans-centric analysis. (B) Quantification of TSC conservation between species pairs, as opposed to subclades.
Figure 5—figure supplement 2
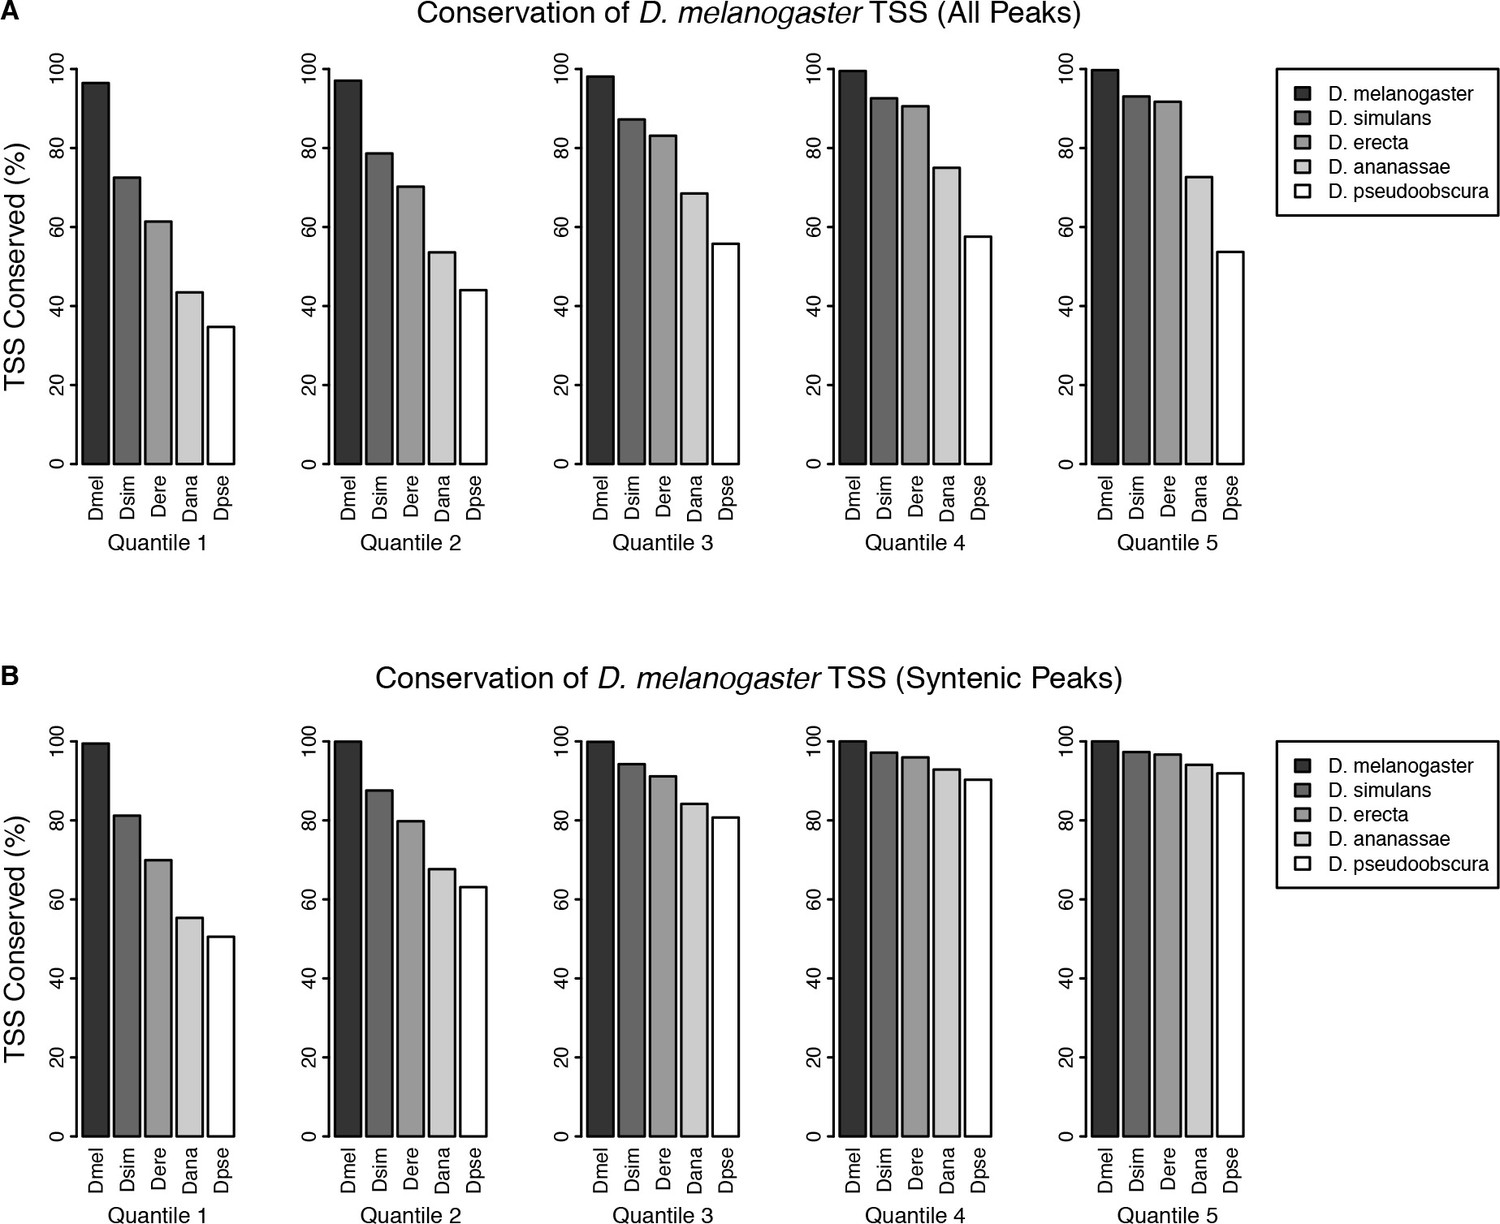
TSC conservation by expression quantiles.
D. melanogaster TSCs were categorized into five expression quantiles based on total raw signal for the full time series. Functional conservation was assessed as described in Materials and methods. (A) Conservation of all TSCs. (B) Conservation of TSCs with syntenic alignments in all five species.
Figure 5—figure supplement 3
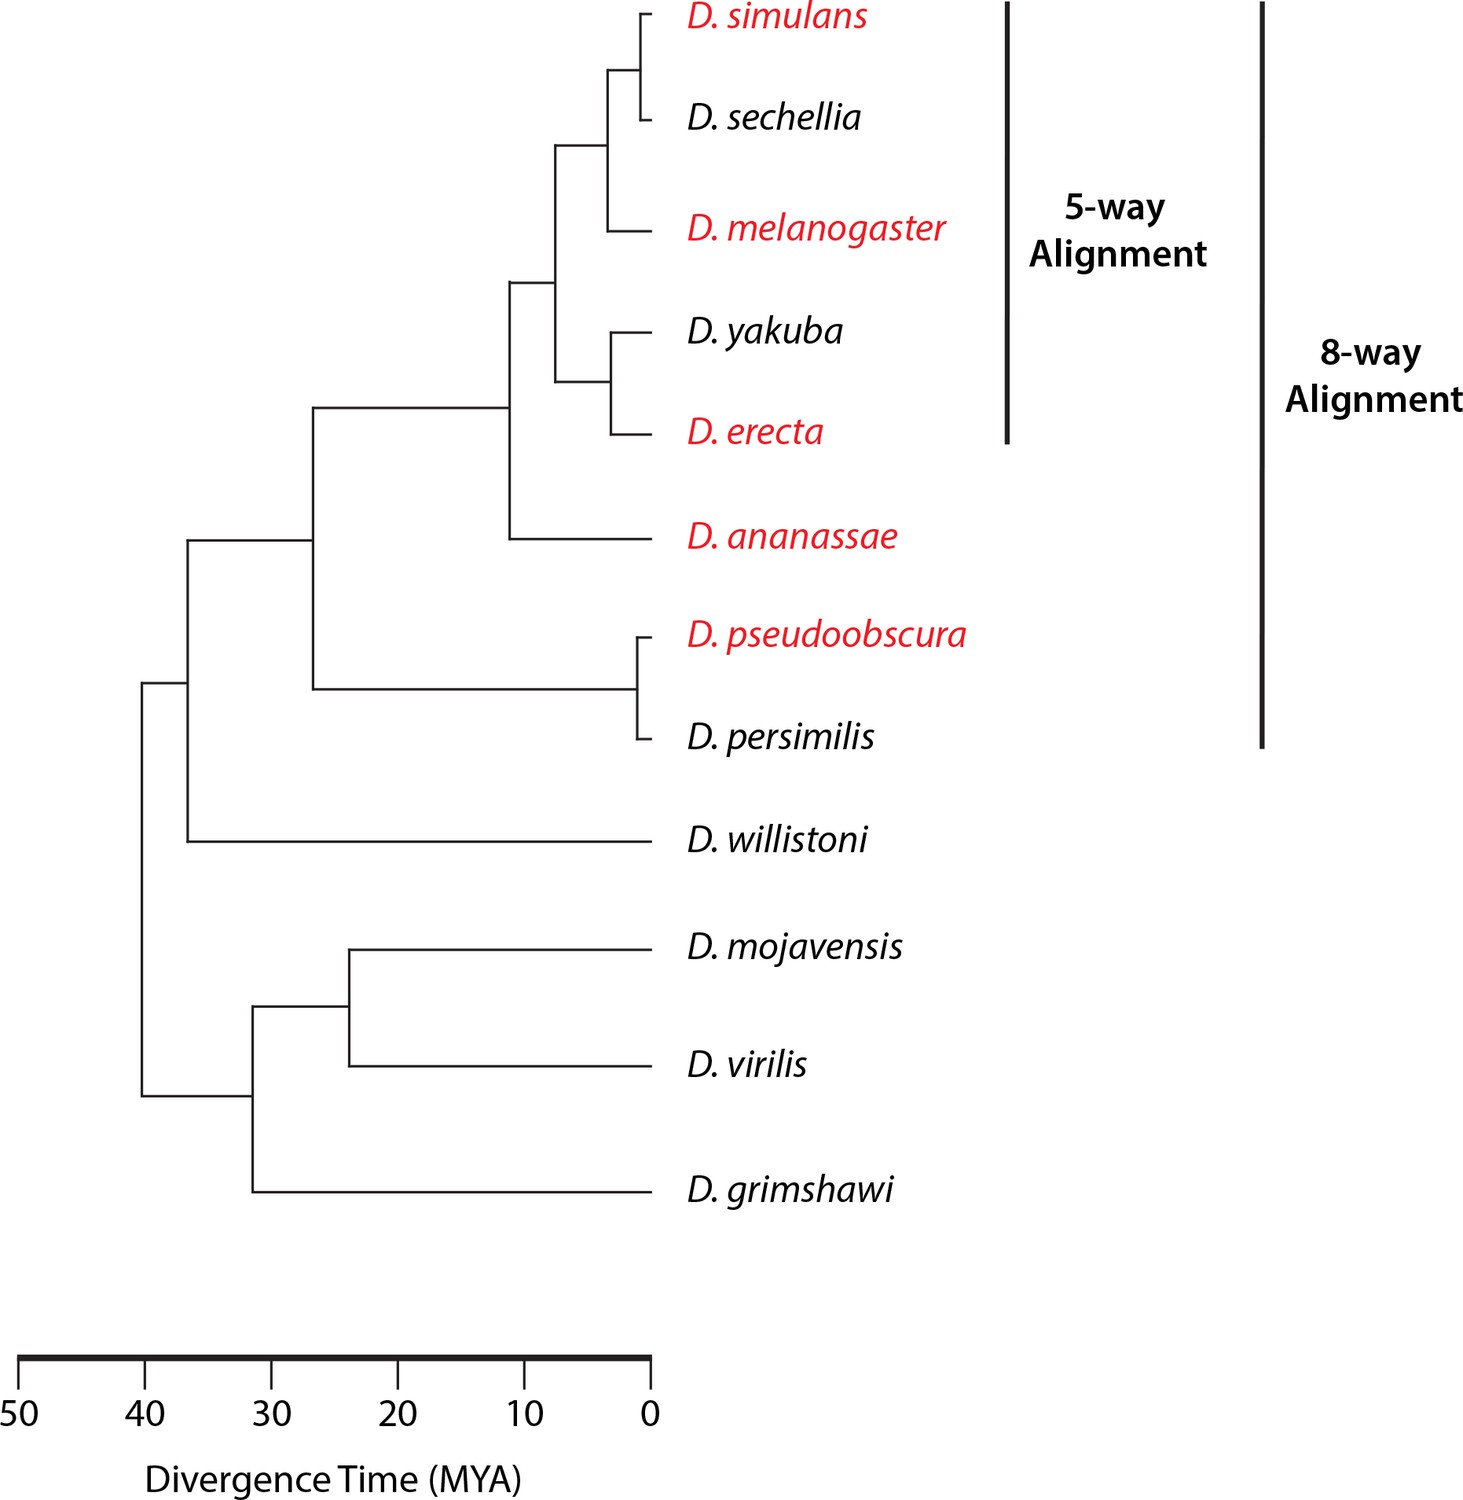
Phylogeny of sequenced species.
The species for which we gathered data appear in red. When assessing sequence conservation for features conserved across all five species studied, we included the genome sequences of the five species studied and the three additional sequenced species from the same monophyletic group (8-way alignment). When assessing conservation throughout the melanogaster subgroup, we used the genomes of our three species and the other two from the subgroup (5-way alignment).
Figure 5—figure supplement 4
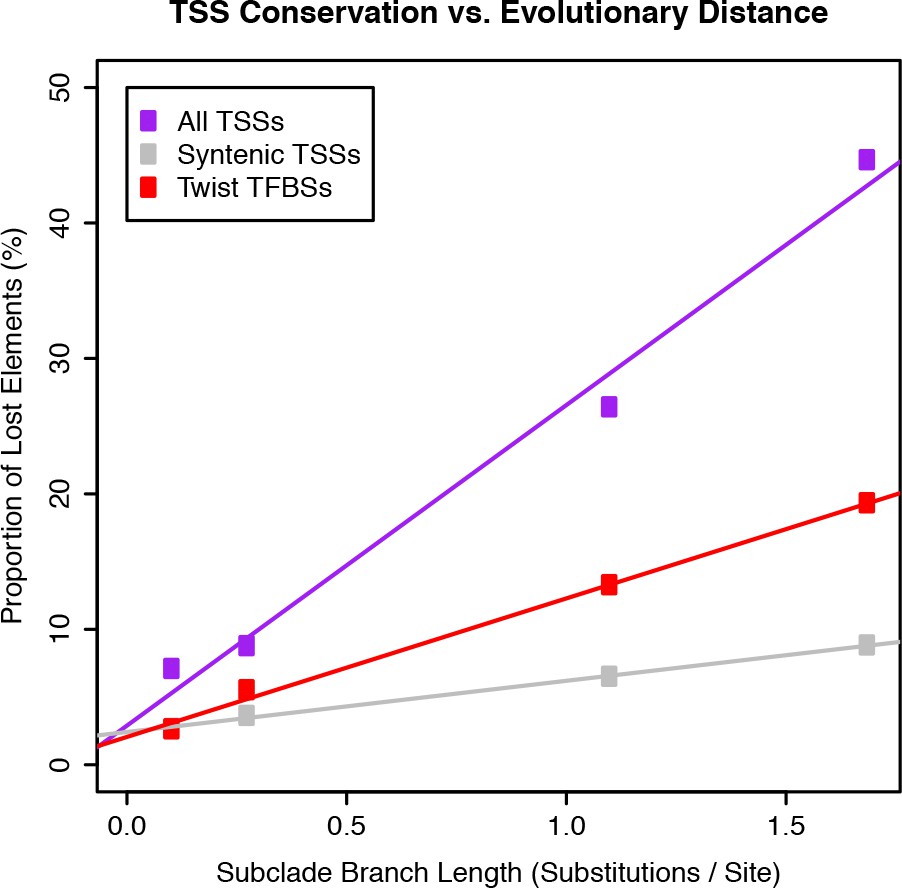
Evolutionary rates of gain and loss for TSCs and Twist TFBSs.
Twist TFBS data from He et al. (2011).
Figure 6 with 6 supplements
Strong purifying selection on long noncoding RNA promoters.
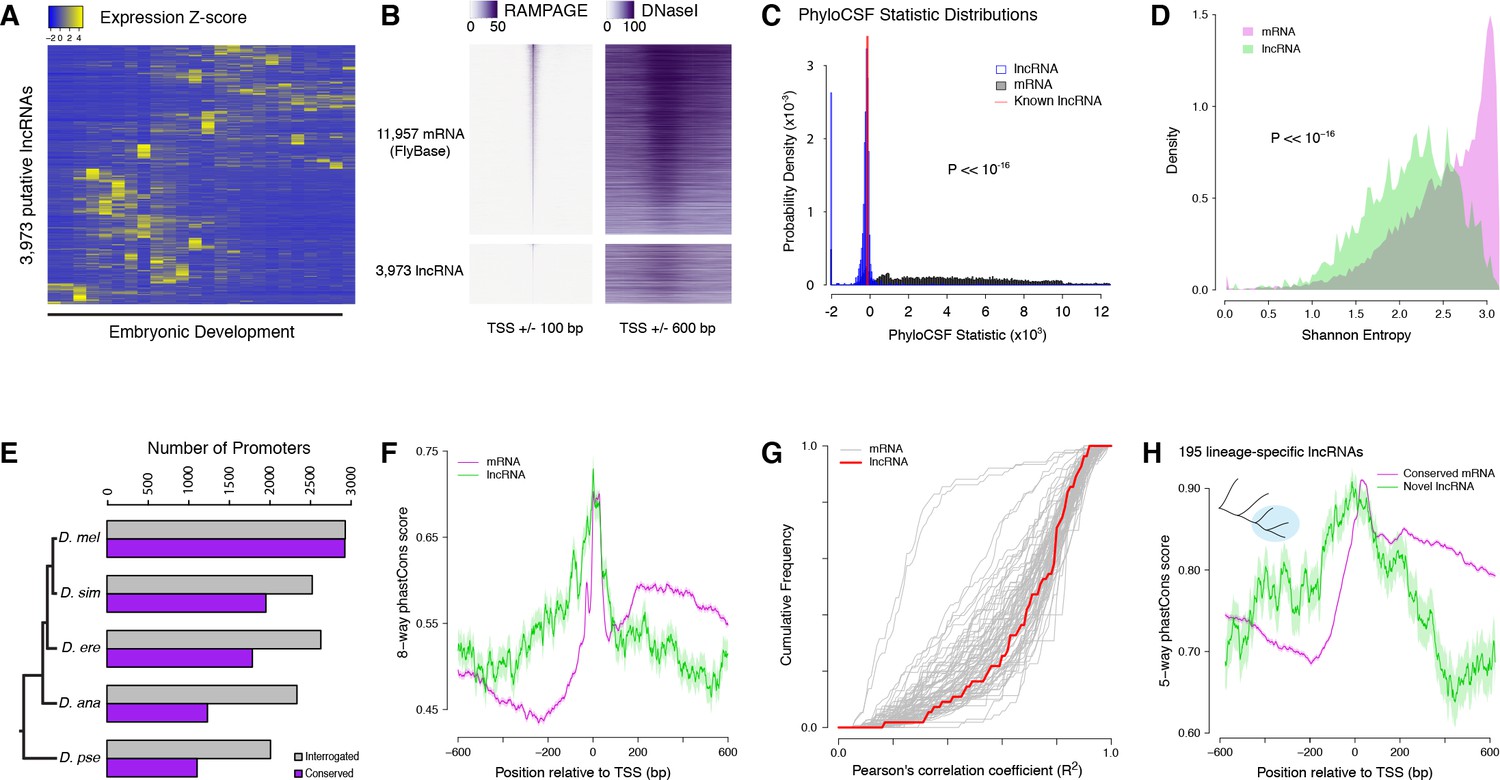
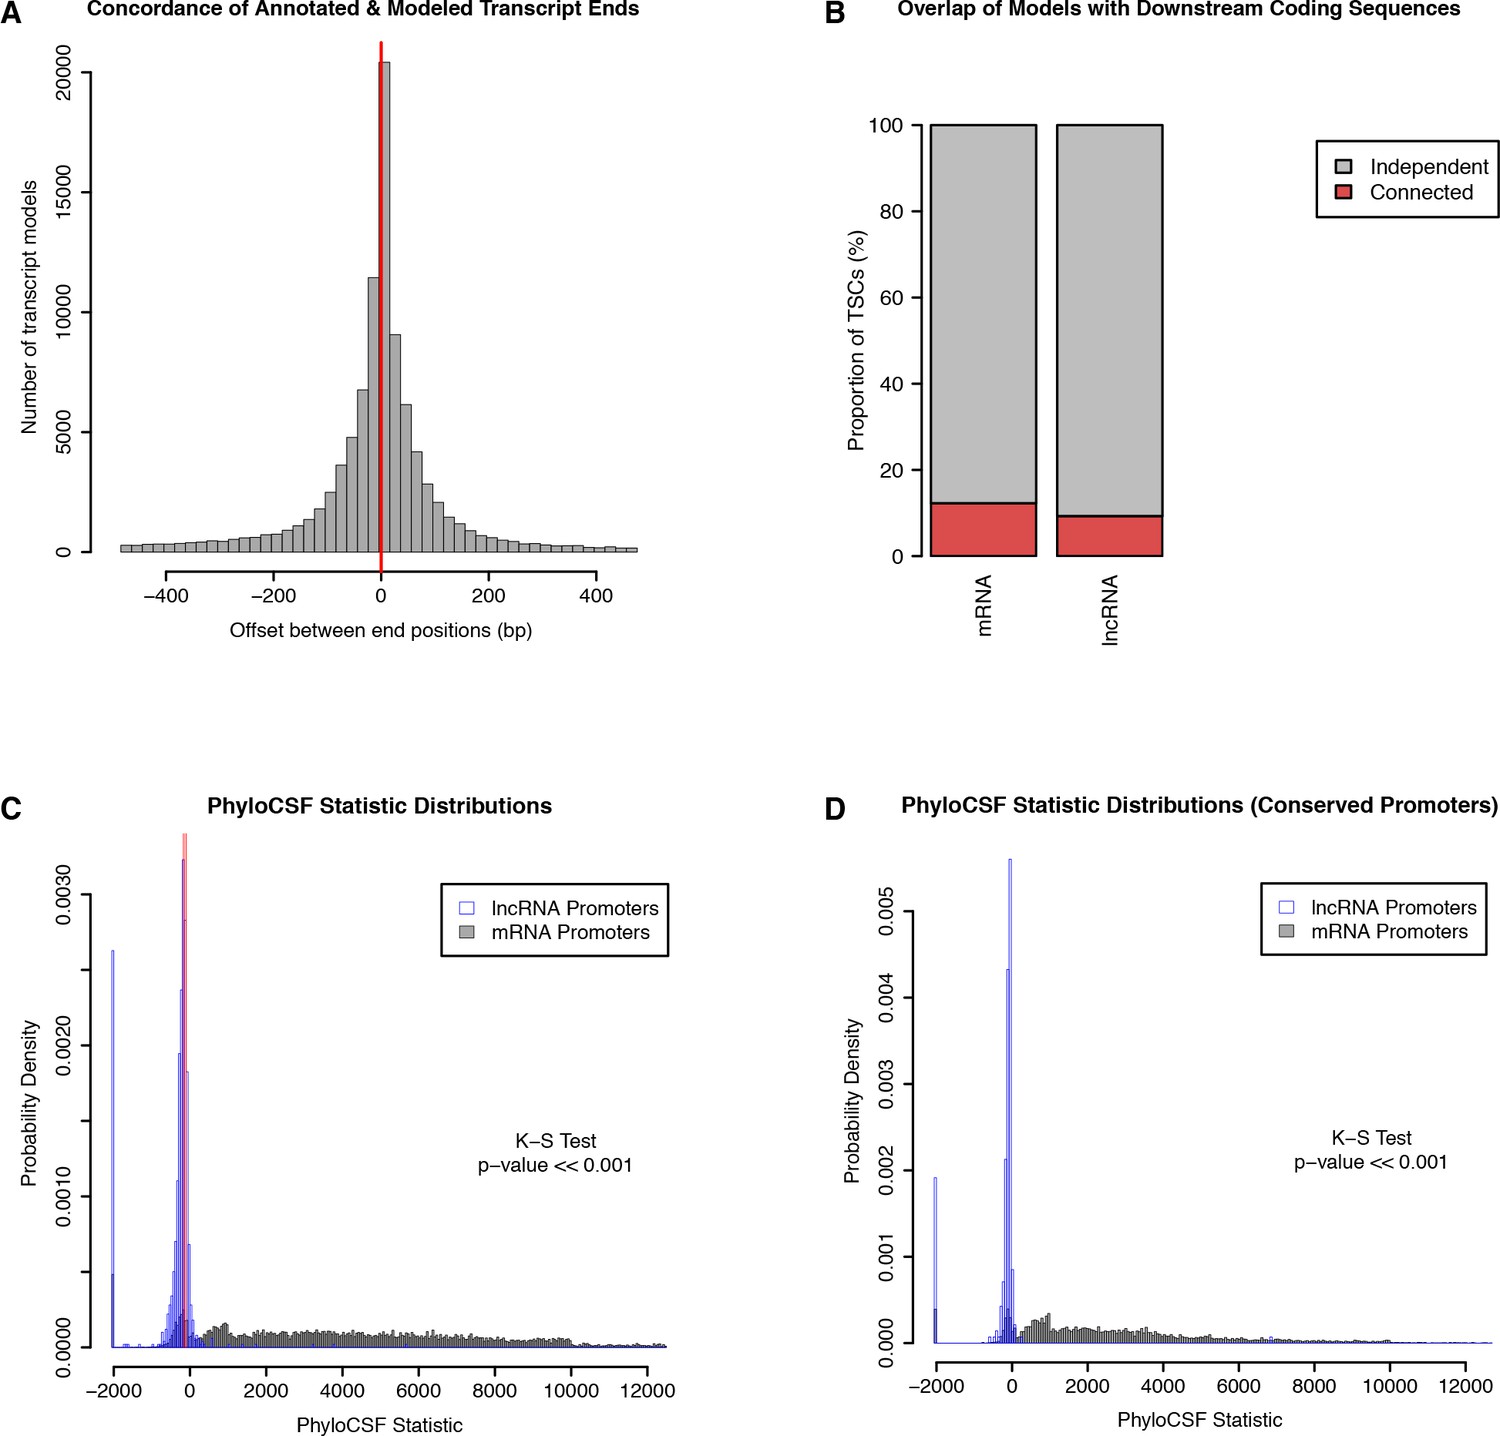
(A) Developmental expression profiles of putative lncRNA promoters (n = 3,973). (B) Heatmaps of RAMPAGE signal (left; number of reads) and DNase-seq signal (right; arbitrary uits) over individual TSCs. We are comparing TSCs that overlap FlyBase-annotated mRNA transcription start sites (top), which we use as positive controls, to the TSCs of putative lncRNAs (bottom). In each group, TSCs are sorted by total RAMPAGE signal intensity. (C) Distribution of phyloCSF scores for transcript models corresponding to putative lncRNAs (n = 1,475) and mRNAs (n = 16,105). Transcript models were built from publicly available RNA-seq data using Cufflinks. The phyloCSF metric quantifies the protein-coding potential of transcripts, based on the presence and conservation of ORFs. (D) Shannon entropy of the temporal expression profiles for lncRNA (n = 2,397) and mRNA (n = 18,067) promoters with maximum expression ≥2 RPM. Overall, the profiles of lncRNA promoters have lower entropy, reflecting more acutely stage-specific expression. (E) Number of D. melanogaster lncRNA promoters functionally preserved in other species. The grey bars represent the number of promoters for which the multiple sequence alignments passed our filtering criteria, and therefore could be interrogated. (F) Promoter sequence conservation. Considering all promoters that are functionally preserved in all five species, the sequences of lncRNA promoters (n = 631) are under comparable selective pressure to those of protein-coding genes. (G) The developmental expression profiles of functionally conserved lncRNA promoters are far more constrained than those of many categories of protein-coding genes. We considered all promoters with maximum expression ≥25 RPM and expression changes ≥5 fold (n = 55 lncRNA promoters). (H) We identified 195 D. melanogaster lncRNA promoters that are functionally preserved within the melanogaster subgroup, but not in the two outgroup species, and are therefore likely to have been recently acquired specifically in this lineage (inset, top left). Lineage-specific lncRNA promoters display a level of sequence conservation within the subgroup similar to that of conserved protein-coding gene promoters.
Figure 6—figure supplement 1
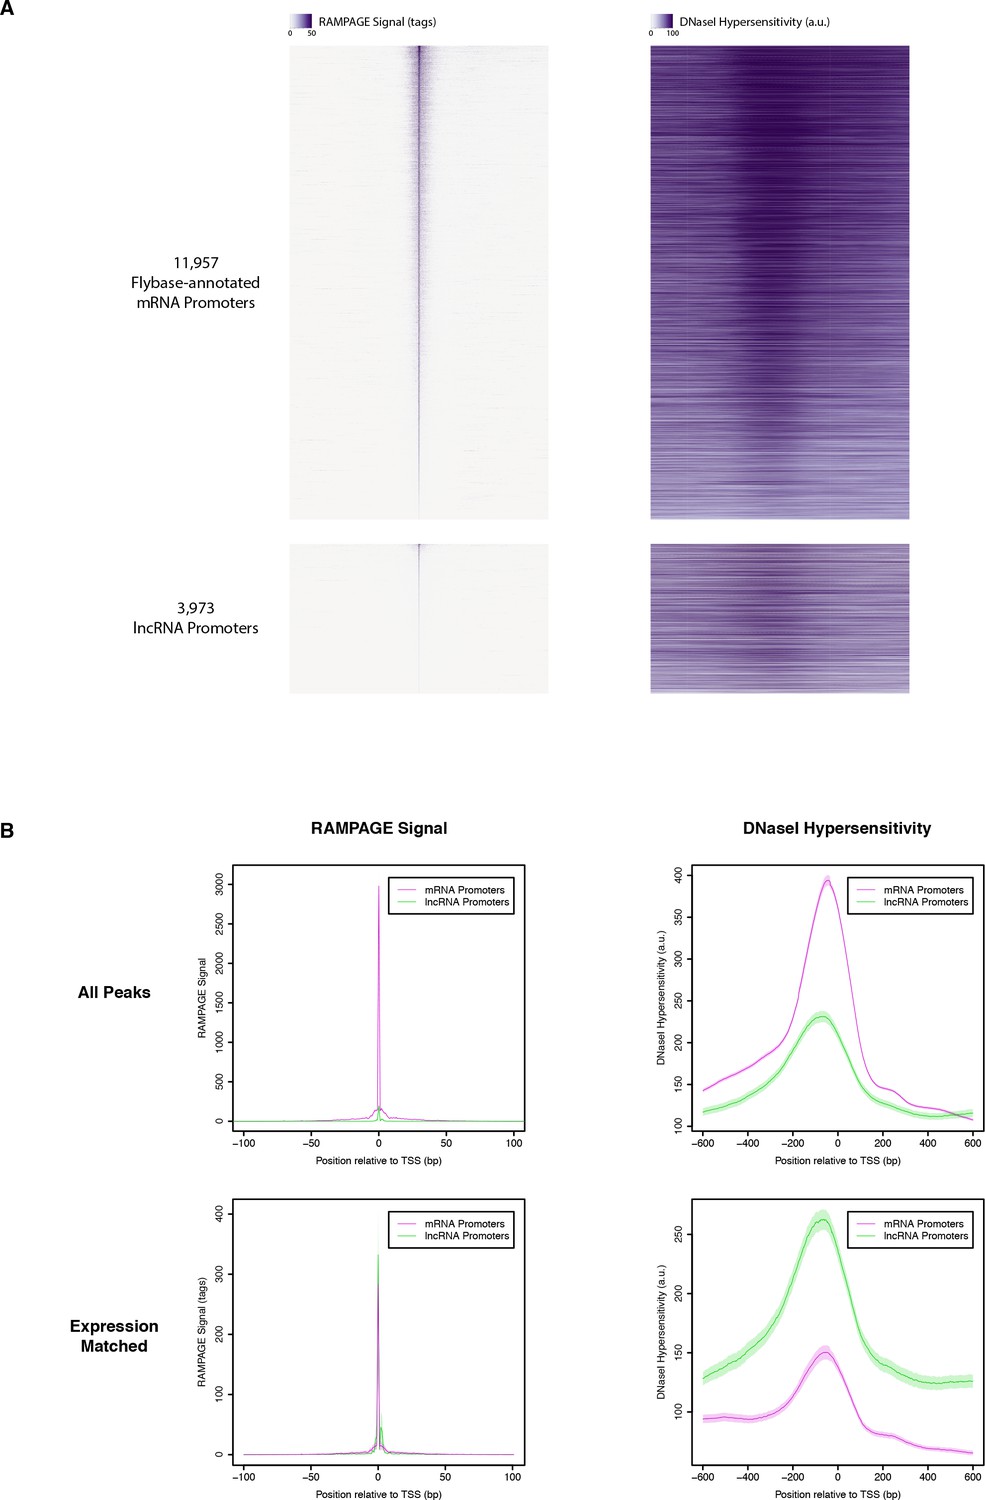
DNase I hypersensitivity at RAMPAGE TSCs.
(A) Heatmaps of RAMPAGE signal (left) and DNase-seq signal (right) over individual TSCs. We are comparing TSCs that overlap FlyBase-annotated mRNA transcription start sites (top), which we use as positive controls, to the TSCs of putative lncRNAs (bottom). In each group, TSCs are sorted by total RAMPAGE signal intensity. (B) Class-wise average profiles of RAMPAGE signal (left) and DNase-seq signal (right). The lines represent median profiles, the shaded areas cover ±1 standard deviation as estimated by bootstrapping. When considering all peaks (top), lncRNA promoters show weaker DNase sensitivity than FlyBase-annotated controls, but the latter also have considerably stronger RAMPAGE signal. When matching RAMPAGE signal distributions (bottom), this trend is reversed. Shaded areas represent ±1 standard deviation, as estimated by downsampling and bootstrapping.
Figure 6—figure supplement 2
Independence and protein-coding potential of putative lncRNAs.
We used published D. melanogaster embryo RNA-seq data and Cufflinks to generate transcript models, and only considered those starting within 150 bp of a TSC. (A) Concordance of annotated and Cufflinks-modeled 3’ ends. For each Cufflinks model starting at a protein-coding gene TSC, we are rep- resenting the distance to the closest annotated transcript 3’ end. (B) Fraction of TSCs for which at least one transcript model overlaps a downstream annotated CDS. Note that while a minority of lncRNA TSC transcript models overlap a downstream protein-coding genes, we observed a similar propensity of Cufflinks models to fuse together consecutive protein-coding genes. (C) PhyloCSF score distributions of protein-coding and putative lncRNA transcript models, as a measure of protein-coding potential. For each TSC, we only considered the transcript model with the highest score. Transcripts with no ORF were assigned a default score of −2000. Red lines: scores for known lncRNAs (roX1, roX2, bithoraxoid). (D) PhyloCSF analysis restricted to TSCs that are functionally conserved across all five species.
Figure 6—figure supplement 3

Clustering of D. melanogaster developmental expression profiles.
In order to analyze co-expression between putative lncRNA and protein-coding gene promoters, we first grouped protein-coding gene promoter expression profiles by k-means clustering (10 clusters) to define reference co-expression sets (A). We then clustered both lncRNA and protein-coding gene promoter profiles together, and extracted the lncRNA promoter profiles corresponding to each expression cluster previously defined (see B).
Figure 6—figure supplement 4
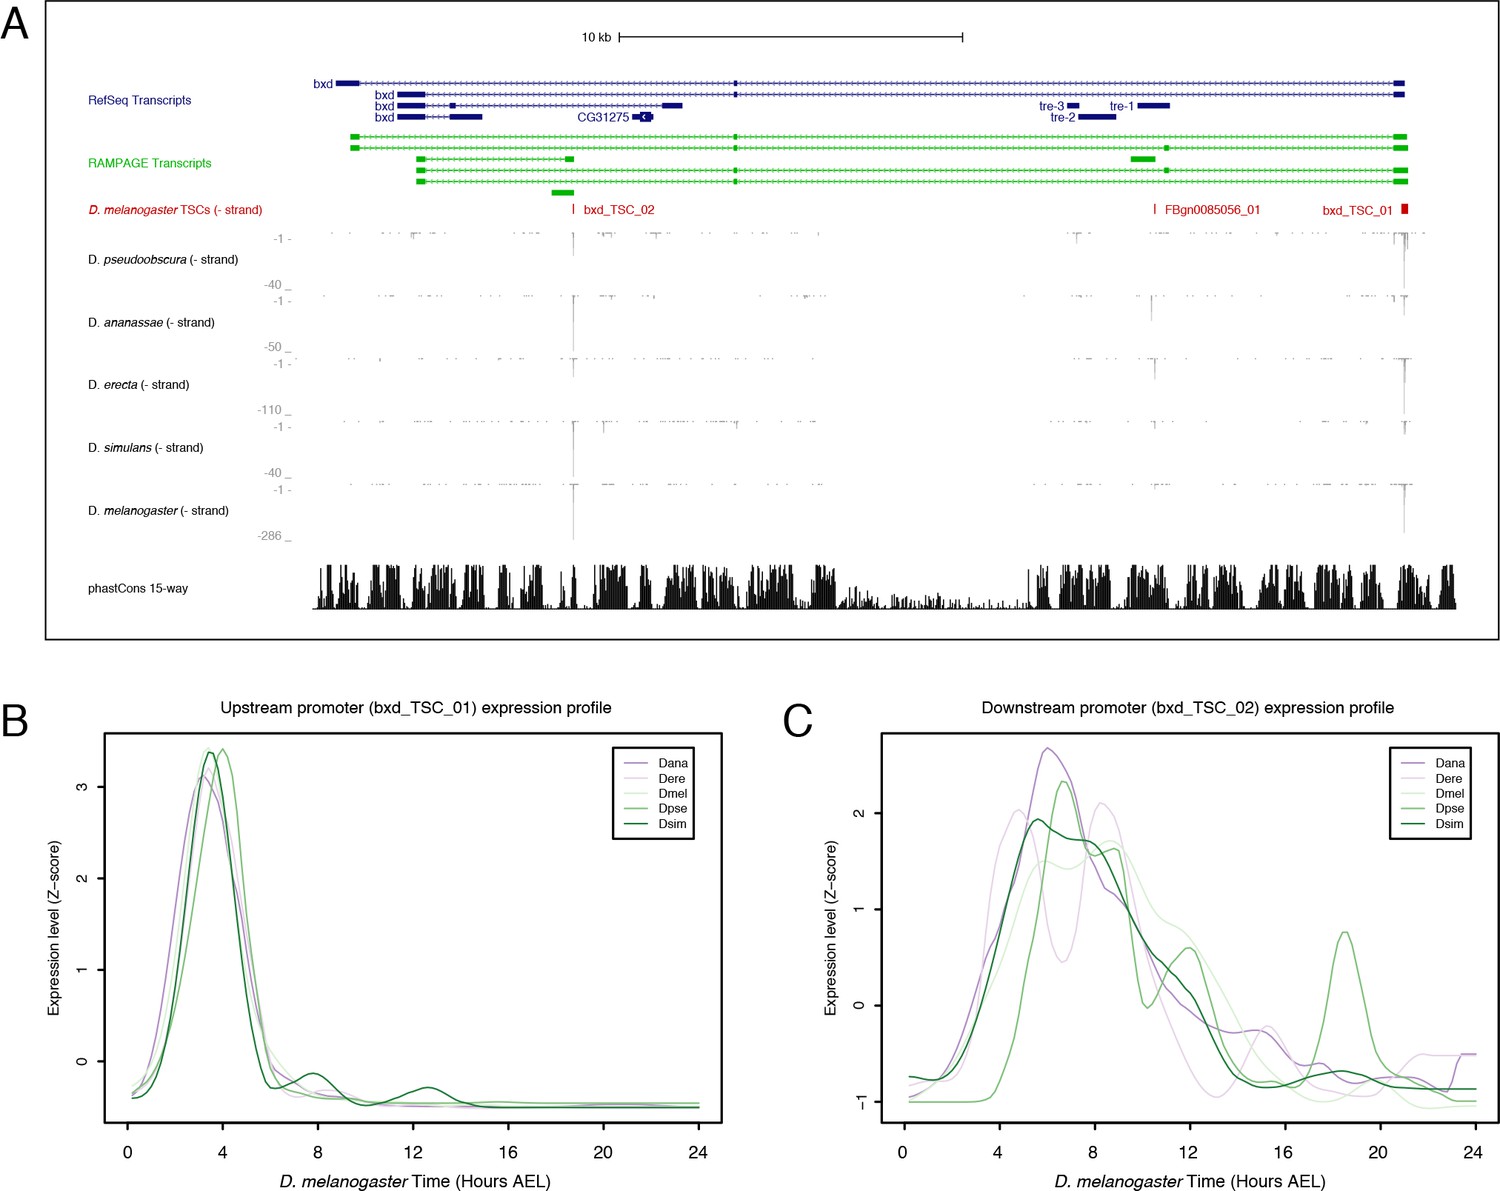
Bithoraxoid locus.
(A) Organization of the bithoraxoid locus (Figure generated with the UCSC Genome Browser). (B) Expression profiles of the upstream bxd promoter in the five species studied. (C) Expression of the downstream promoter.
Figure 6—figure supplement 5

Conservation of melanogaster subgroup lncRNA TSCs.
(A) Promoter sequence conservation. melanogaster subgroup-specific phastCons scores over lncRNA or protein-coding gene promoters that are shared across the three species of the subgroup. These phastCons scores were computed by including exclusively the genomes of the five sequenced melanogaster subgroup species in the input multiple sequence alignment. (B) Expression specificity conservation. All functionally shared promoters with maximum 25 RPM and 5-fold expression changes in D. melanogaster were included in the analysis (130 lncRNA promoters).
Figure 6—figure supplement 6
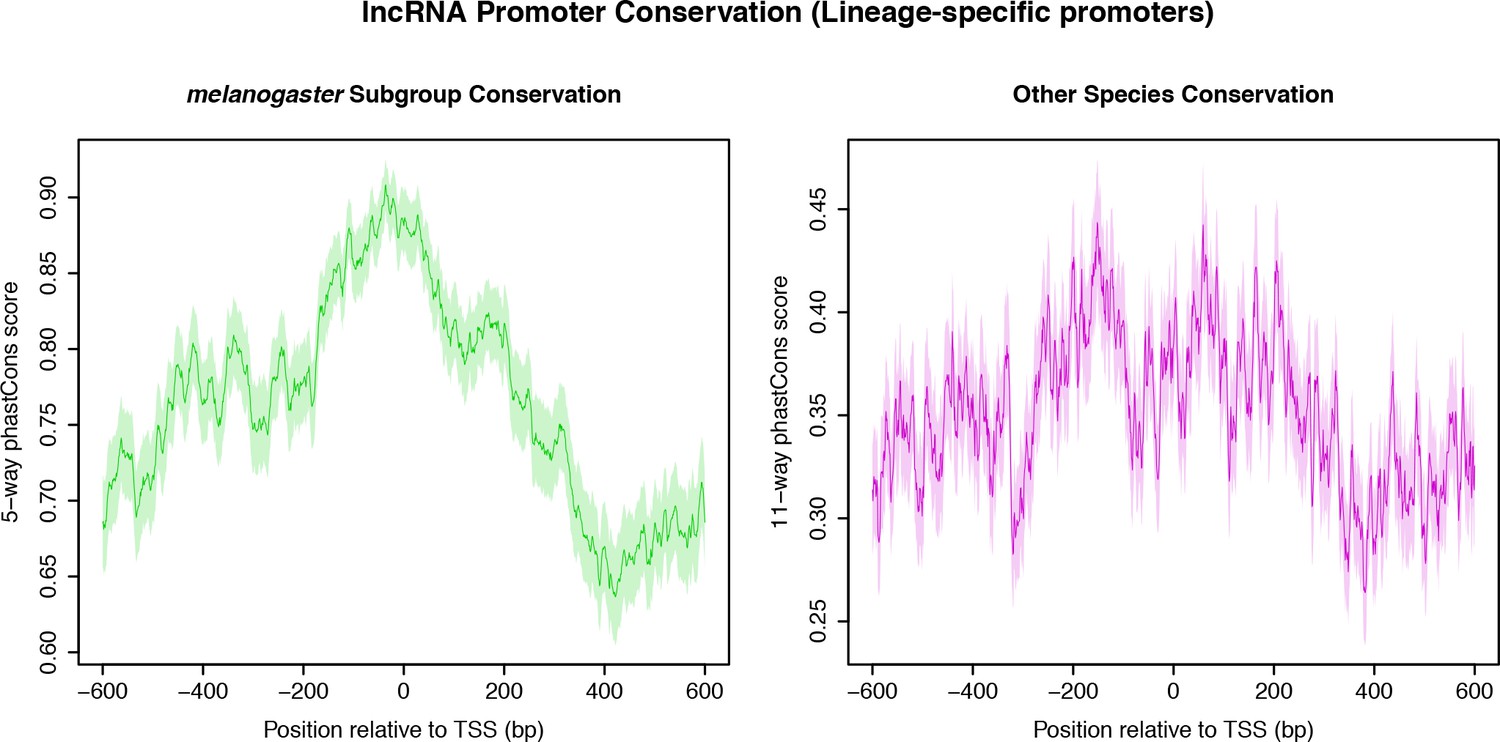
Sequence conservation over melanogaster subgroup-specific lncRNA TSCs.
(A) Sequence conservation within the melanogaster subgroup (5-way phastCons scores). (B) Sequence conservation (phastCons scores based on the alignment of the D. melanogaster genome to all outgroup genomes).
Figure 7 with 4 supplements
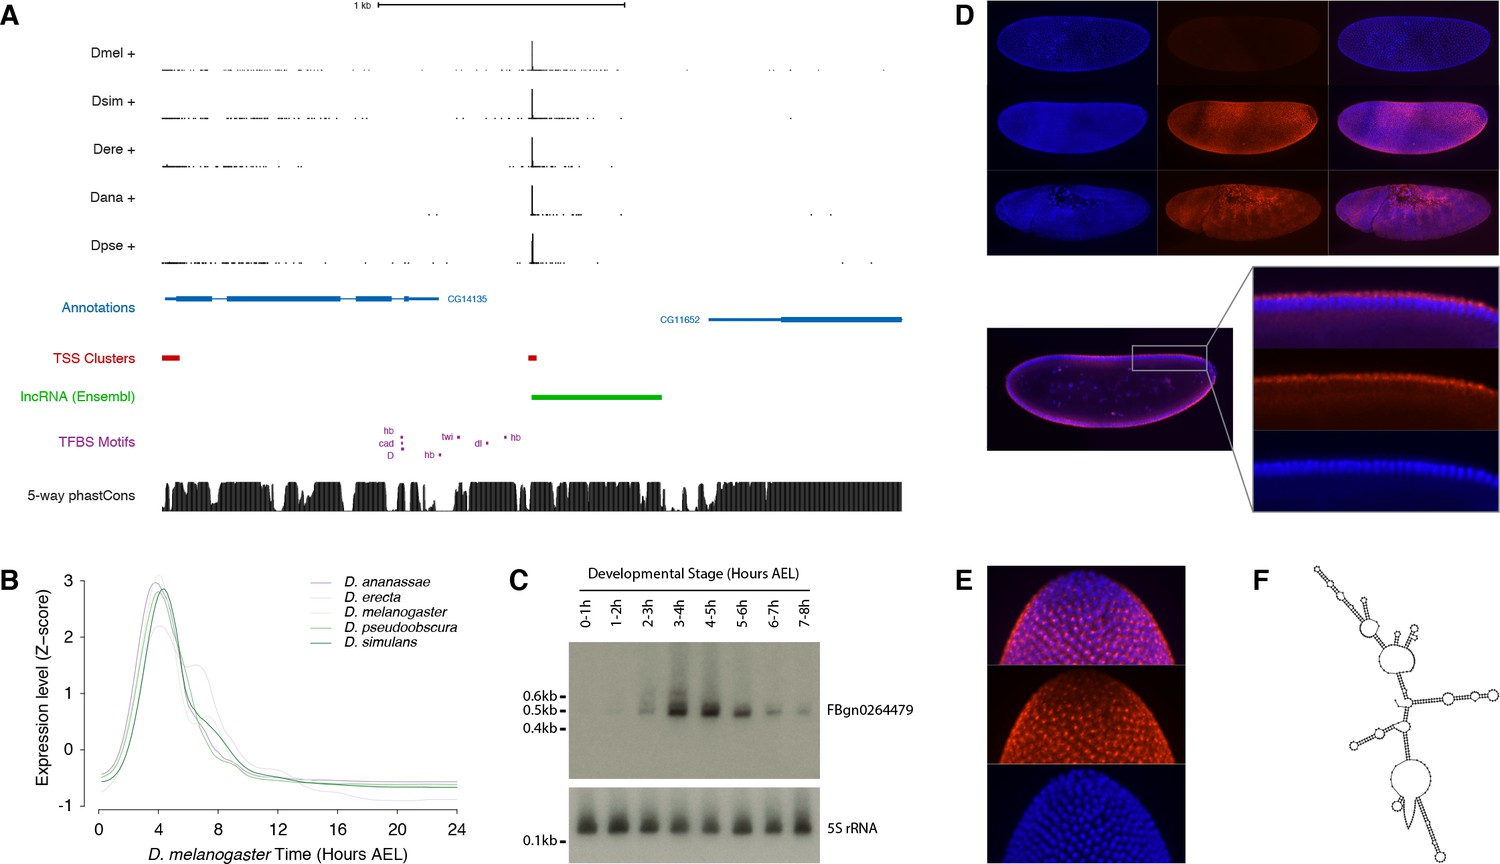
Functional characterization of the FBgn0264479 locus.
(A) Organization of the FBgn0264479 locus (UCSC Genome Browser). Data tracks, from top to bottom: RAMPAGE signal in five species (five upper tracks), FlyBase gene annotations (blue), D. melanogaster TSCs (red), transcript annotation from Ensembl (green), TFBS motif predictions around the FBgn0264479 promoter (purple), sequence conservation within the melanogaster subgroup (black). (B) FBgn0264479 transcript expression profiles in five species. (C) Northern-blot against the FBgn0264479 RNA. The 5S ribosomal RNA was used as a loading control (lower panel). (D) RNA-FISH for the FBgn0264479 transcript. Upper panel, top to bottom: maximum-intensity projections of confocal series for embryos at stages 4, 5 and 7 (Blue: DAPI, red: FISH). Bottom panel: Single confocal section from the embryo in the middle of the top panel. Controls with sense probes showed very little background. (E) FBgn0264479 RNA-FISH; lateral view of the posterior pole of a stage five embryo. (F) Mfold-predicted secondary structure of the RNA.
Figure 7—figure supplement 1
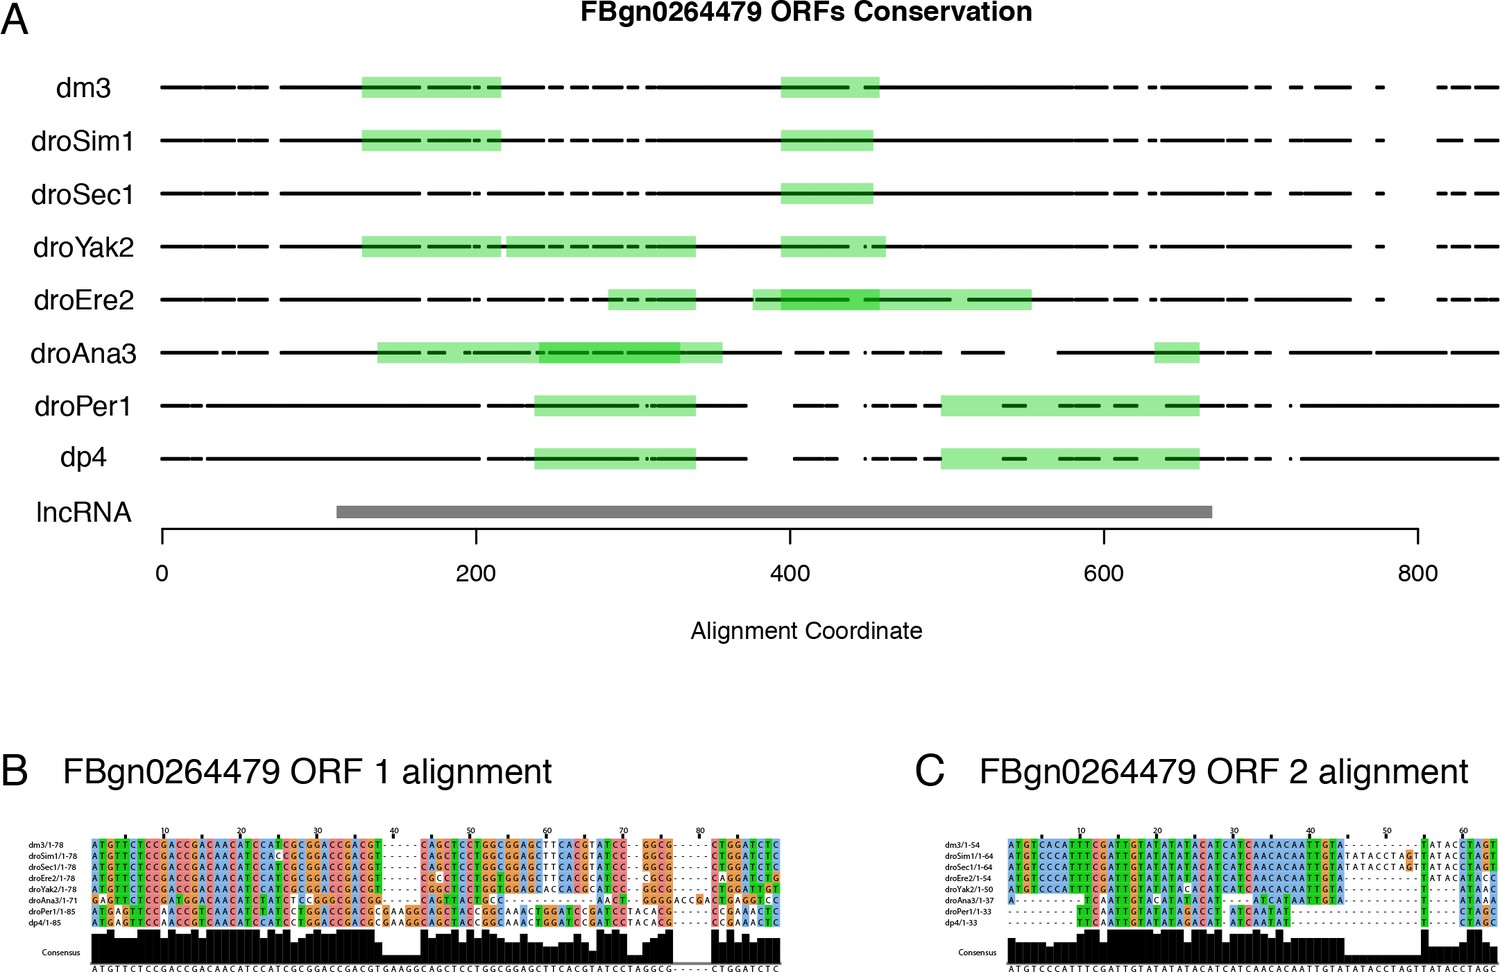
FBgn0264479 protein-coding potential.
(A) Projection of the putative ORFs in all orthologs onto the multiZ multiple sequence alignment (UCSC). Black points: bases aligned to D. melanogaster (match or mismatch). White spaces: alignment gaps. lncRNA: D. melanogaster transcript. Note the absence of any ORF conserved in all species that express the FBgn0264479 transcript. (B) Multiple sequence alignment for D. melanogaster ORF #1. (C) Multiple sequence alignment for D. melanogaster ORF #2.
Figure 7—figure supplement 2
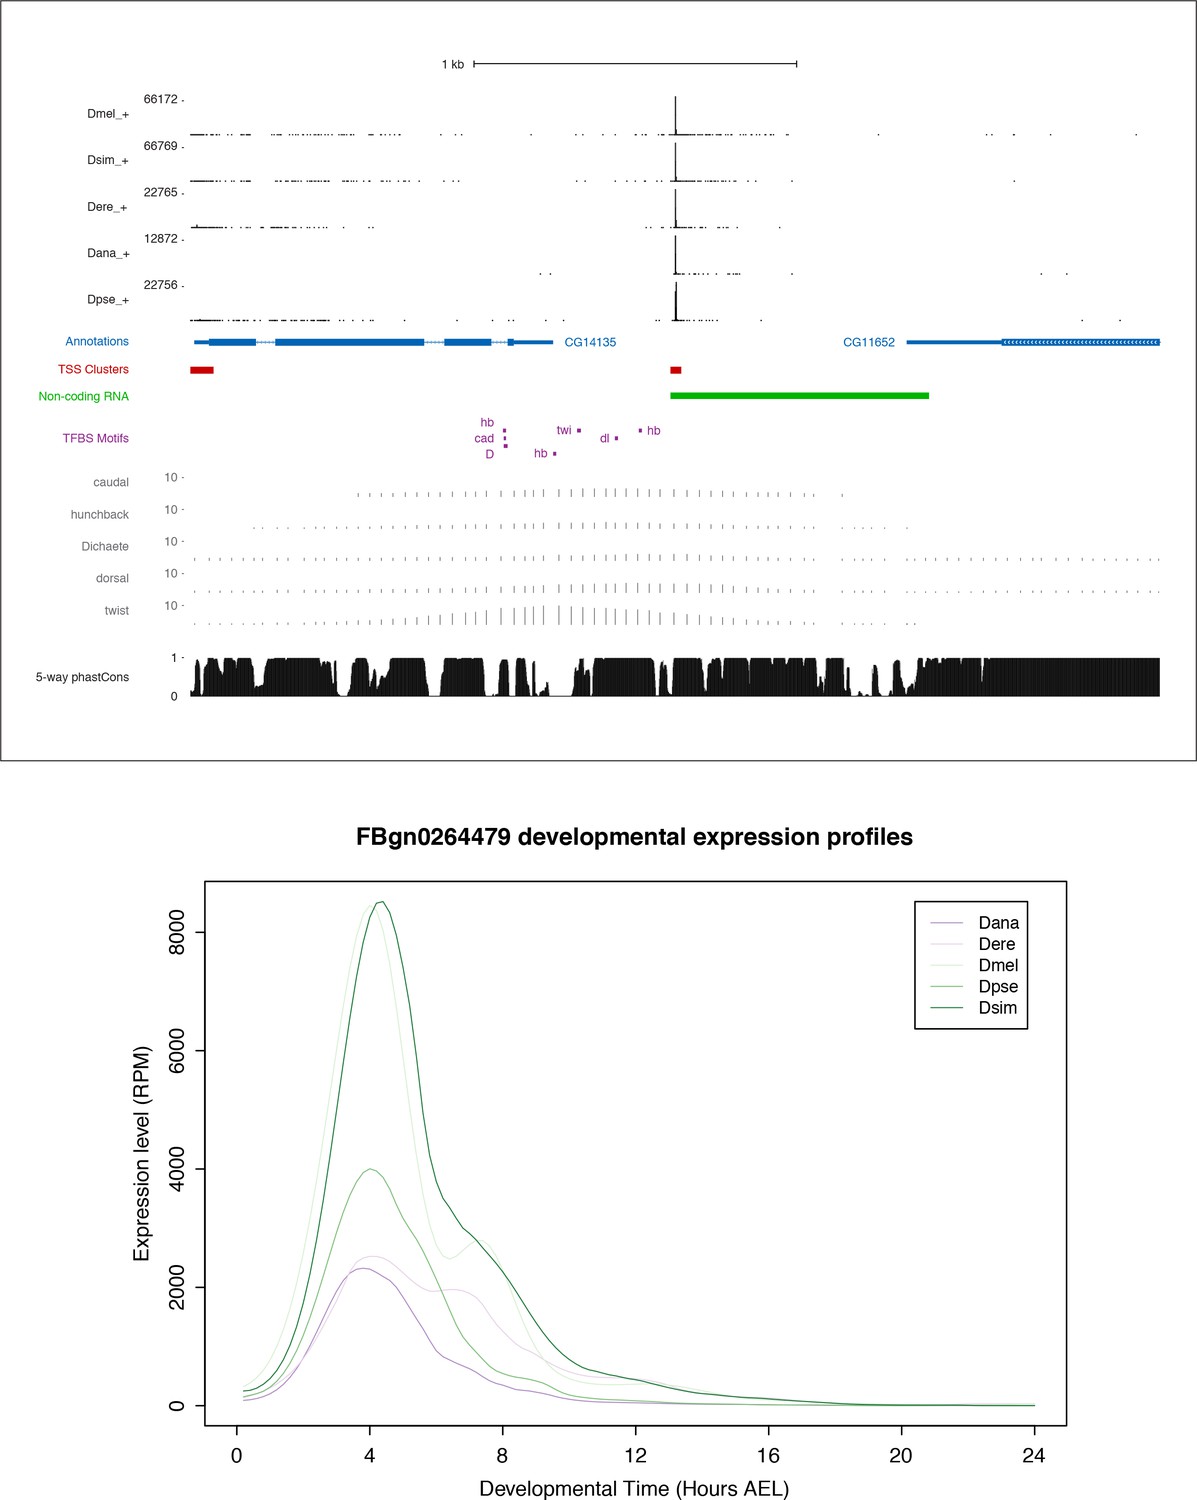
FBgn0264479 locus and expression.
Top: FBgn0264479 locus organization. Includes all data tracks from Figure 6A. In addition, the five tracks just above the phastCons scores represent the chromatin immunoprecipitation microarray data (ChIP-chip) for five transcription factors: caudal, hunchback, Dichaete, dorsal, twist (modENCODE data visualized on the UCSC Genome Browser). Bottom: Expression profiles in reads per million (RPM).
Figure 7—figure supplement 3
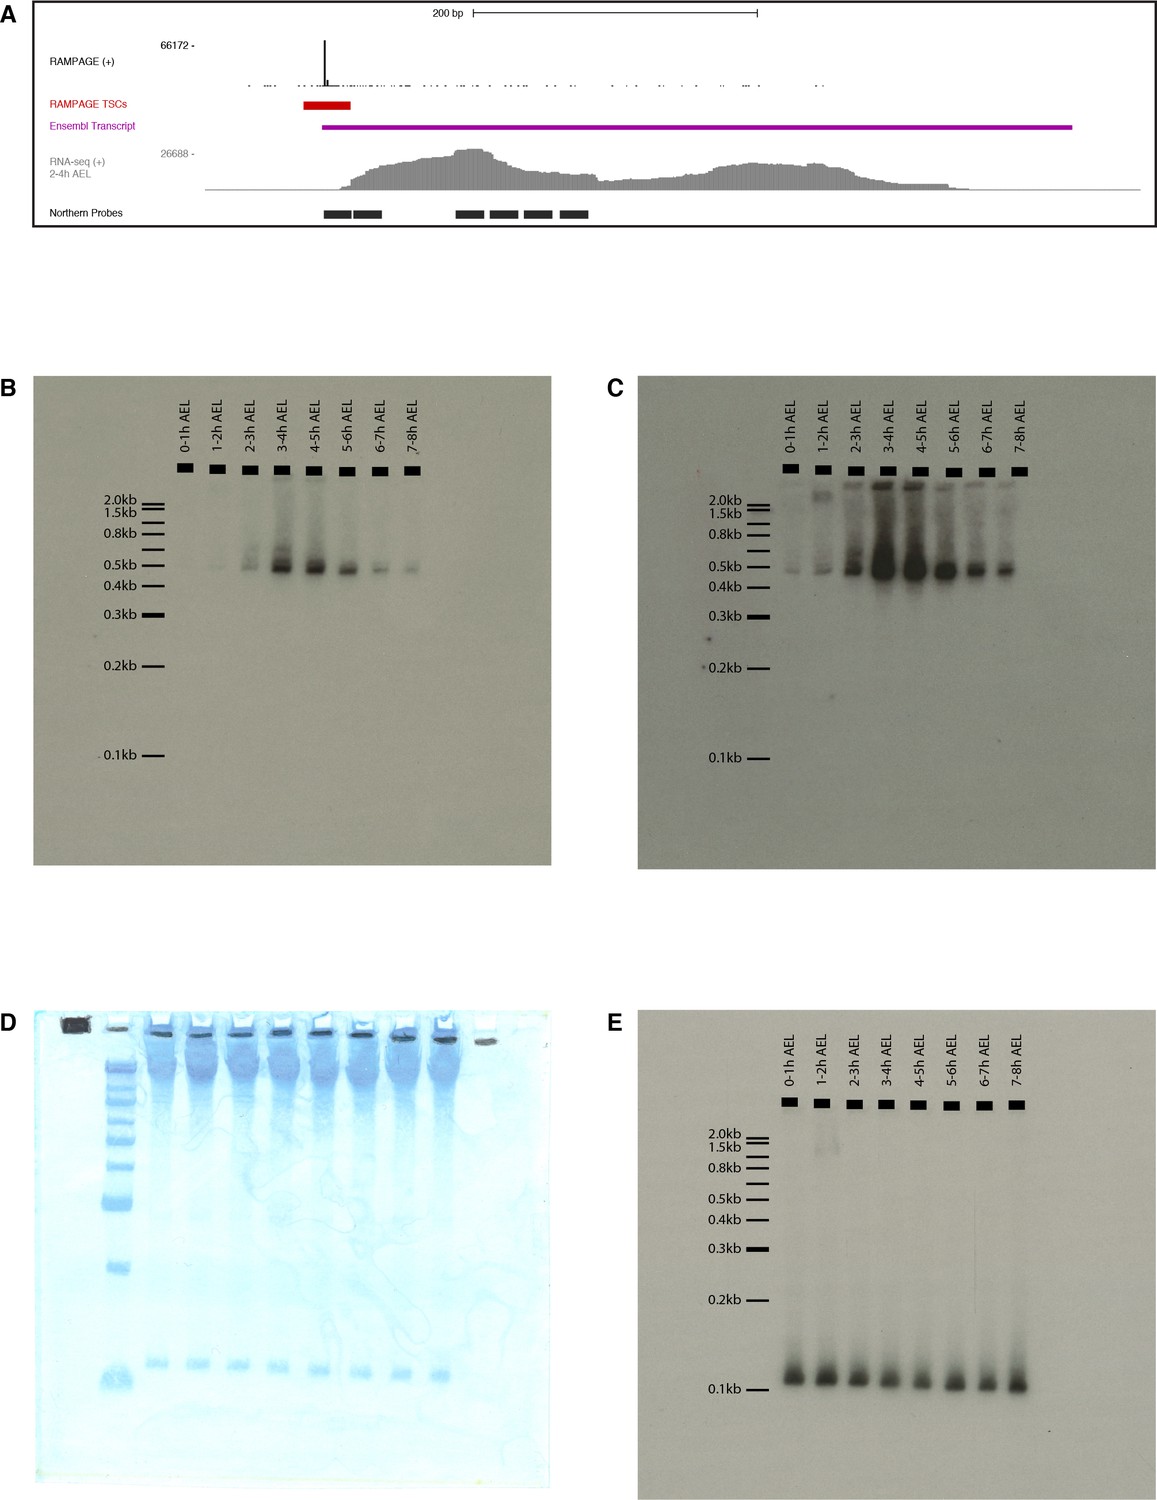
FBgn0264479 Northern-blot.
(A) Description of the probes. Tracks from top to bottom: RAMPAGE signal, TSC, Ensembl transcript annotation, RNA-seq signal (modENCODE, 2–4 hr time point), FBgn0264479 probes (antisense to target). We used a mix a all six radiolabeled oligonucleotide probes. (B) Exposure of the whole membrane, hybridized with anti-FBgn0264479 probes. (C) Same blot, longer exposure. (D) Methylene blue staining of the membrane prior to hybridization. First lane: Invitrogen 0.1–2.0 kb RNA ladder. (E) Hybridization with anti-5S rRNA probe.
Figure 7—figure supplement 4
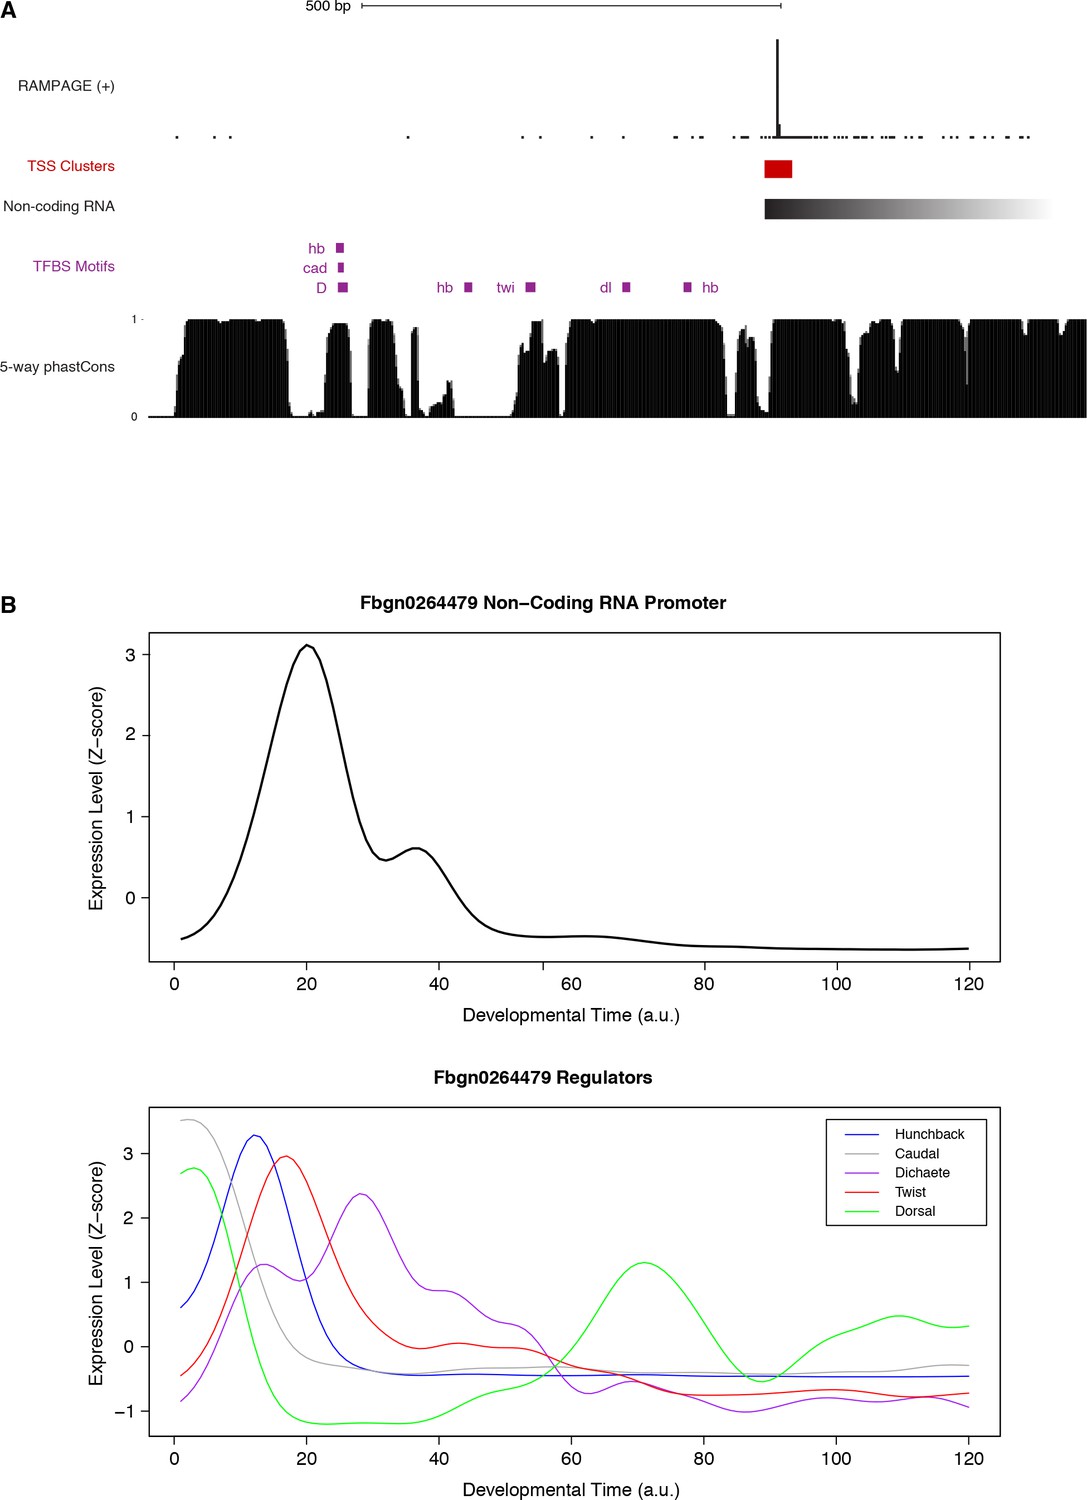
FBgn0264479 transcriptional regulation.
(A) Sequence conservation over the putative binding sites for the factors with ChIP-chip signal over the promoter (see Suppl. Figure 18). We used FIMO to search for Jaspar-defined motifs within 600 bp upstream of the main TSS. Note that all putative TFBSs but one are under strong purifying selection within the melanogaster subgroup. (B) Expression profiles of the genes encoding the putative regulators of FBgn0264479.
Additional files
-
Supplementary file 1
This table summarizes the most enriched Gene Ontology (GO) functional annotation categories for each gene expression cluster described in Figure 6—figure supplement 3.
- https://doi.org/10.7554/eLife.29005.031
-
Transparent reporting form
- https://doi.org/10.7554/eLife.29005.032
Download links
A two-part list of links to download the article, or parts of the article, in various formats.
Downloads (link to download the article as PDF)
Open citations (links to open the citations from this article in various online reference manager services)
Cite this article (links to download the citations from this article in formats compatible with various reference manager tools)
Conserved noncoding transcription and core promoter regulatory code in early Drosophila development
eLife 6:e29005.
https://doi.org/10.7554/eLife.29005


