The effect of perinatal brain injury on dopaminergic function and hippocampal volume in adult life
- King's College London, United Kingdom
- MRC Clinical Sciences Centre, Hammersmith Hospital, United Kingdom
- Imperial College London, Hammersmith Hospital, United Kingdom
- Icahn School of Medicine, United States
- University College London, United Kingdom
Figures
Figure 1
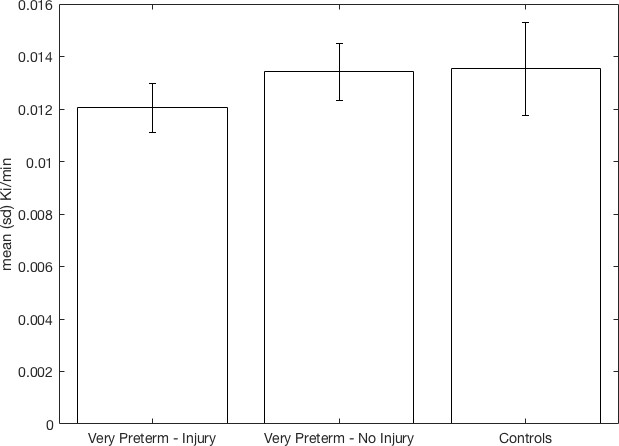
Whole striatal dopamine synthesis capacity by group.
Individuals who suffered macroscopic perinatal brain injury related to VPT birth had significantly lower dopamine synthesis capacity in the whole striatum compared to other adults born VPT with no macroscopic perinatal brain injury (corrected p=0.023, Cohen’s d = 1.36) and full term-born controls (corrected p=0.01, Cohen’s d = 1.07).
-
Figure 1—source data 1
fig1_source_data.csv – Can be used with create_fig1.m to recreate Figure 1.
- https://doi.org/10.7554/eLife.29088.005
Figure 2
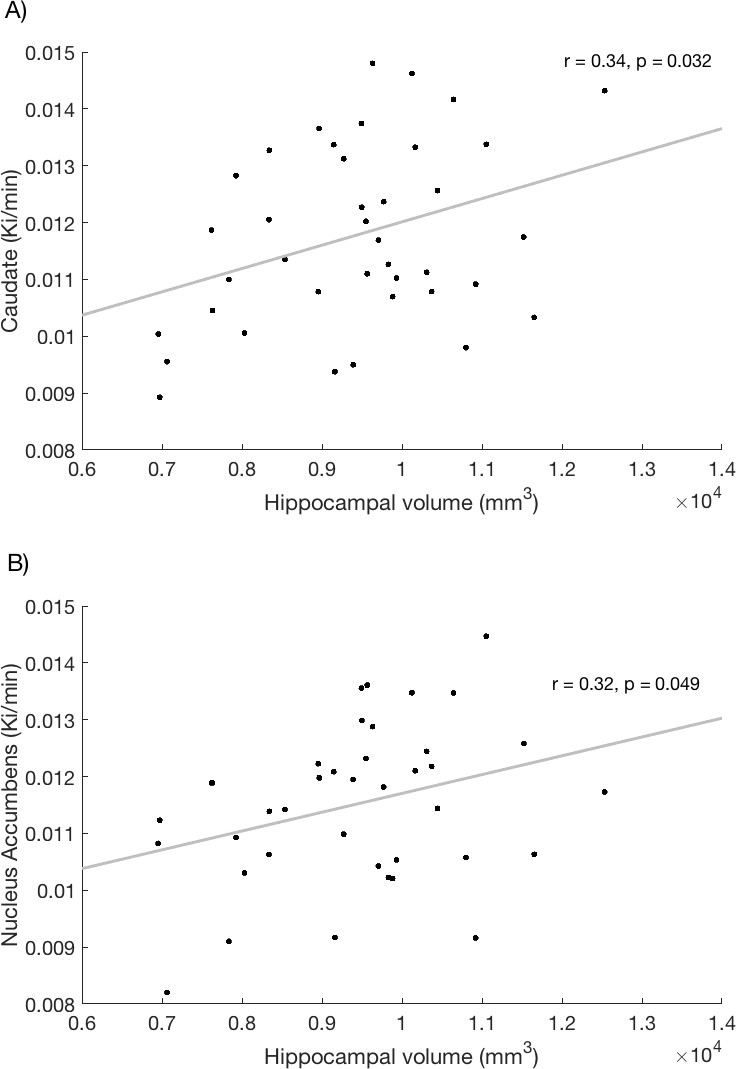
Relationship between hippocampal volume and dopamine synthesis capacity in the (A) caudate and (B) nucleus accumbens.
https://doi.org/10.7554/eLife.29088.008-
Figure 2—source data 1
fig2_source_data.csv - csv – Can be used with create_fig2.m to recreate Figure 2.
- https://doi.org/10.7554/eLife.29088.009
Tables
Table 1
Neonatal, socio-demographic, cognitive and scanning measures.
https://doi.org/10.7554/eLife.29088.003| Very preterm-perinatal brain injury | Very preterm-no diagnosed injury | Controls | Test statistic | Significance | |
|---|---|---|---|---|---|
| (n = 16) | (n = 13) | (n = 14) | |||
| Gestational age in weeks Mean (SD) | 28.44 (2.28) | 30.46 (1.76) | U27 = 47.00 | p=0.011 | |
| Birth weight in grams Mean (SD) | 1203.19 (304.95) | 1557.15 (364.98) | U27 = 46.50 | p=0.012 | |
| Age in years Mean (SD) | 30.21 (1.78) | 30.85 (2.09) | 29.81 (3.24) | F2,40 = 1.50 | p=0.236 |
| Sex (female:male) | 03:13 | 04:09 | 05:09 | X 22 = 1.14 | p=0.564 |
| High SES (%)* | 68.75 | 69.23 | 61.53 | X 22 =0.22 | p=0.894 |
| IQ Mean (SD) | 106.67 (14.52) | 107.73 (10.07) | 110.40 (10.52) | F2,33 = 0.28 | p=0.755 |
| Alcohol consumption (Units/week) | 7.40 (11.30) | 12.50 (11.99) | 5.50 (4.72) | X 22 =3.172 | p=0.205 |
| Injected dose (MBq) Mean (SD) | 146.44 (2.15) | 146.25 (2.52) | 145.73 (2.38) | F2,40 = 0.23 | p=0.793 |
-
*SES was collapsed into two groups; the percent of participants belonging to the high SES (level 1–2) category is presented in the table.
Table 2
Striatal subregion dopamine synthesis capacity†.
https://doi.org/10.7554/eLife.29088.006| Striatal subregion | Anova, group differences | Very preterm-perinatal brain injury vs controls | Very preterm-perinatal brain injury vs Very preterm-no diagnosed injury | Very preterm-no diagnosed injury vs controls |
|---|---|---|---|---|
| Whole Striatum | F = 6.07 p=0.010 partial eta-squared = 0.233 | t = −3.12 p=0.010 | t = −2.81 p=0.023 | t = −0.24 p=1; |
| Caudate | F = 7.75 p=0.004 partial eta-squared = 0.279 | t = −3.84 p=0.001 | t = −2.52 p=0.047 | t = −1.20 p=0.707 |
| Putamen | F = 2.98 p=0.062 | |||
| Nucleus Accumbens | F = 5.26 p=0.012 partial eta-squared = 0.208 | t = −2.41 p=0.045 | t = −2.95 p=0.016 | t = 0.45 p=1 |
-
†Statistically significant group differences are shown in bold. Displayed p-values are corrected for multiple comparisons (see methods).
Table 3
Subcortical volumes (mm3) *.
https://doi.org/10.7554/eLife.29088.007| Very preterm-perinatal brain injury mean (sd) | Very preterm-no diagnosed injury mean (sd) | Control mean (sd) | Anova | Very preterm-perinatal brain injury vs Control | Very preterm-perinatal brain injury vs very preterm-no diagnosed injury | Very preterm-no diagnosed injury vs Control | |
|---|---|---|---|---|---|---|---|
| Hippocampus | 8624 (1329) | 9557 (1113) | 10090 (1329) | F = 4.928 P=0.013 | t = -3.10 p = 0.011 | t = -1.97 p = 0.168 | t = -1.13 p = 0.802 |
| Striatum (whole) | 19098 (3217) | 19767 (2495) | 21487 (2322) | F = 2.70 P = 0.081 | t = -2.17 p = 0.092 | t = -0.59 p = 1 | t = -1.82 p = 0.341 |
| Caudate | 7491 (1516) | 7609 (998) | 8250 (910) | F =1.581 P =0.22 | t = -1.55 p = 0.322 | t = -0.23 p = 1 | t = -1.71 p = 0.514 |
| Putamen | 10541 (1682) | 10973 (1480) | 11977 (1655) | F =2.824 P =0.11 | t = -2.25 p = 0.079 | t = -0.70 p = 1 | t = -1.68 p = 0.343 |
| Nucleus Accumbens | 1066 (210) | 1185 (167) | 1260 (227) | F =3.023 P =0.11 | t = -2.26 p = 0.06 | t = -1.60 p = 0.43 | t = -0.96 p = 1 |
-
*Statistically significant group differences are shown in bold. p-values for ANOVA tests of the striatal subregions adjusted using FDR method for positively correlated samples. p-values for the post-hoc t-tests are corrected for multiple comparisons using the Bonferroni method.
Additional files
-
Transparent reporting form
- https://doi.org/10.7554/eLife.29088.010
Download links
A two-part list of links to download the article, or parts of the article, in various formats.
Downloads (link to download the article as PDF)
Open citations (links to open the citations from this article in various online reference manager services)
Cite this article (links to download the citations from this article in formats compatible with various reference manager tools)
The effect of perinatal brain injury on dopaminergic function and hippocampal volume in adult life
eLife 6:e29088.
https://doi.org/10.7554/eLife.29088


