Two single-point mutations shift the ligand selectivity of a pheromone receptor between two closely related moth species
- Institute of Zoology, Chinese Academy of Sciences, China
- University of Chinese Academy of Sciences, China
Figures
Figure 1
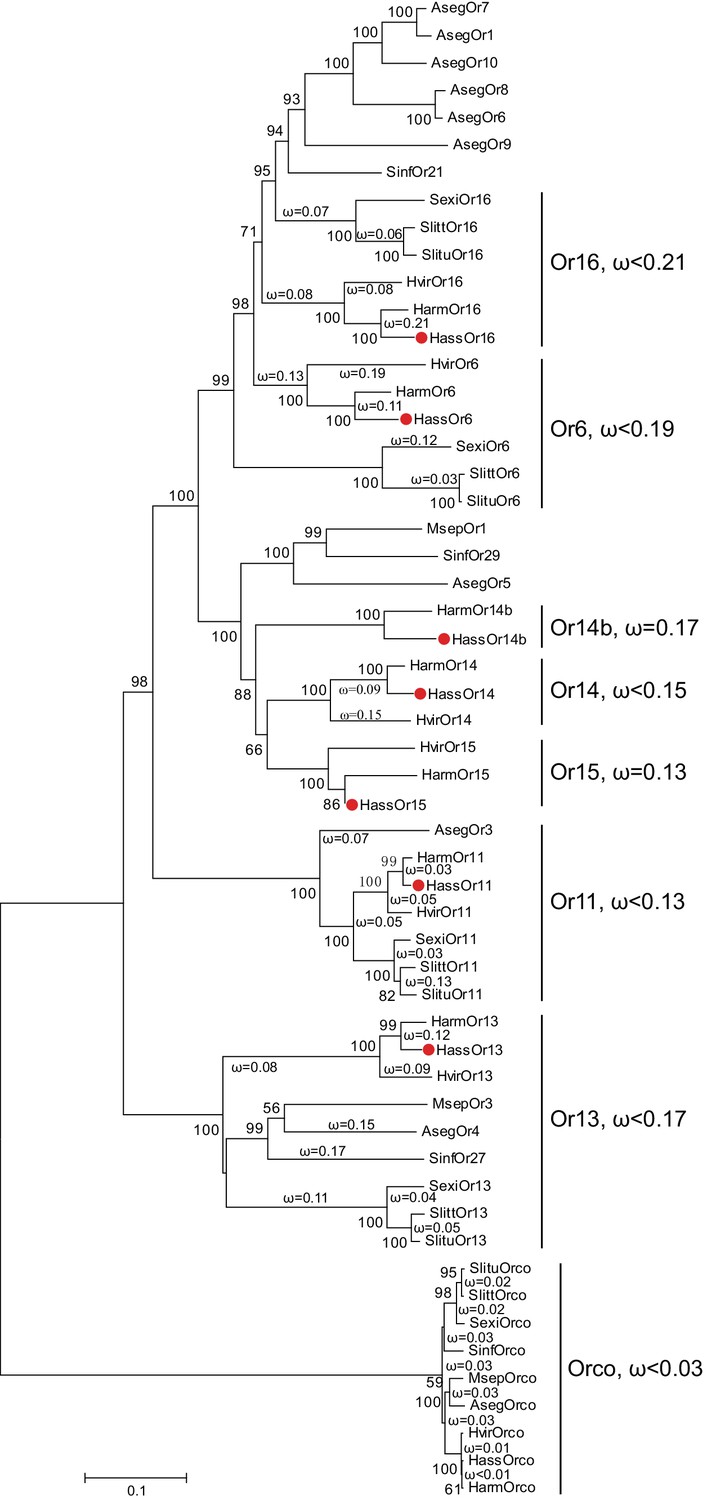
The phylogenetic tree of the PRs in Noctuidae.
The amino acid sequences are based on the reported transcriptome data of functionally identified PRs. The Orco lineage is defined as an outgroup. Bootstrap values are based on 1000 replicates, and values over 50 are shown at corresponding nodes. The bar indicates the phylogenetic distance value. The nonsynonymous (dN) to synonymous (dS) substitution ratio (ω) is labeled in the tree. Cluster Or14b and Or15 have a uniform ω value for all branches, whereas Cluster Or6, 11, 13, 14, and 16 have varying ω values for all branches within the lineage. The ω values of all clusters were less than 1, suggesting that all PRs were subjected to purifying selection. Abbreviations: Aseg, Agrotis segetum; Harm, H. armigera; Hass, H. assulta; Hvir, Heliothis virescens; Msep, Mythimna separata; Sexi, Spodoptera exigua; Slitt, Spodoptera littoralis; Slitu, Spodoptera litura; Sinf, Sesamia inferens. The PRs of H. assulta are indicated by red dots ‘’. The GenBank accession numbers of genes used in this analysis are listed in Supplementary file 2.
Figure 2 with 2 supplements

Relative mRNA expression levels of PRs by quantitative real-time PCR analysis in male and female antennae of H.
assulta. Hass♂, male antennae; Hass♀, female antennae. n = 3 replicates of 40–60 antennae each. Data are presented as mean ± SEM.
Figure 2—figure supplement 1
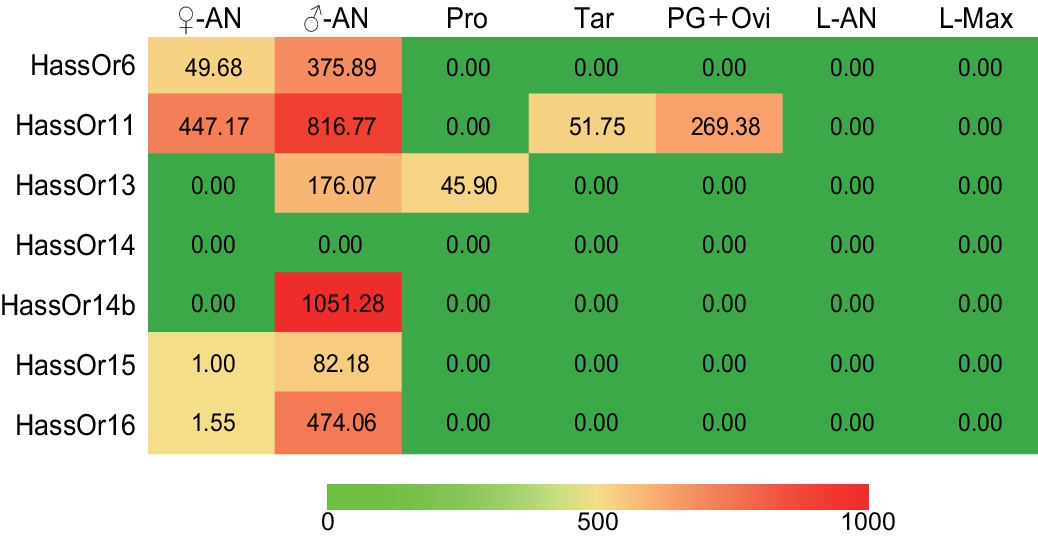
The tissue expression pattern of PRs in Helicoverpa assulta by Illumina read-mapping analysis.
In each box, the relative abundance value in fragments per kilobase of exon per million fragments mapped (FPKM) of each PR is indicated. Color scales were generated using Microsoft Excel. ♀An, female antennae; ♂An, male antennae; Pro, adult proboscis; Tar, adult tarsi; PG + Ovi, pheromone gland and ovipositor; L-AN, larval antennae; L-Max, larval maxillae.
Figure 2—figure supplement 2
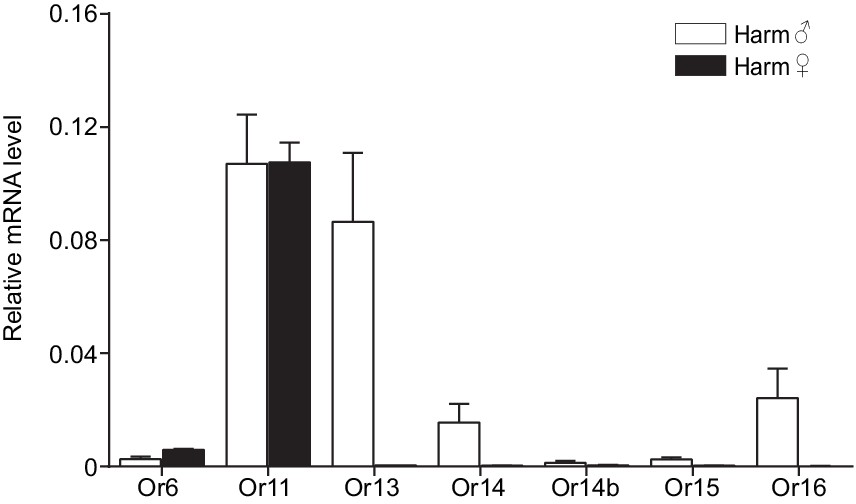
Relative mRNA expression levels of PRs by quantitative real-time PCR analysis in male and female antennae of Helicoverpa armigera.
Harm♂, male antennae; Harm♀, female antennae. n = 3 replicates of 40–60 antennae each. Data are presented as mean ± SEM.
Figure 3 with 3 supplements
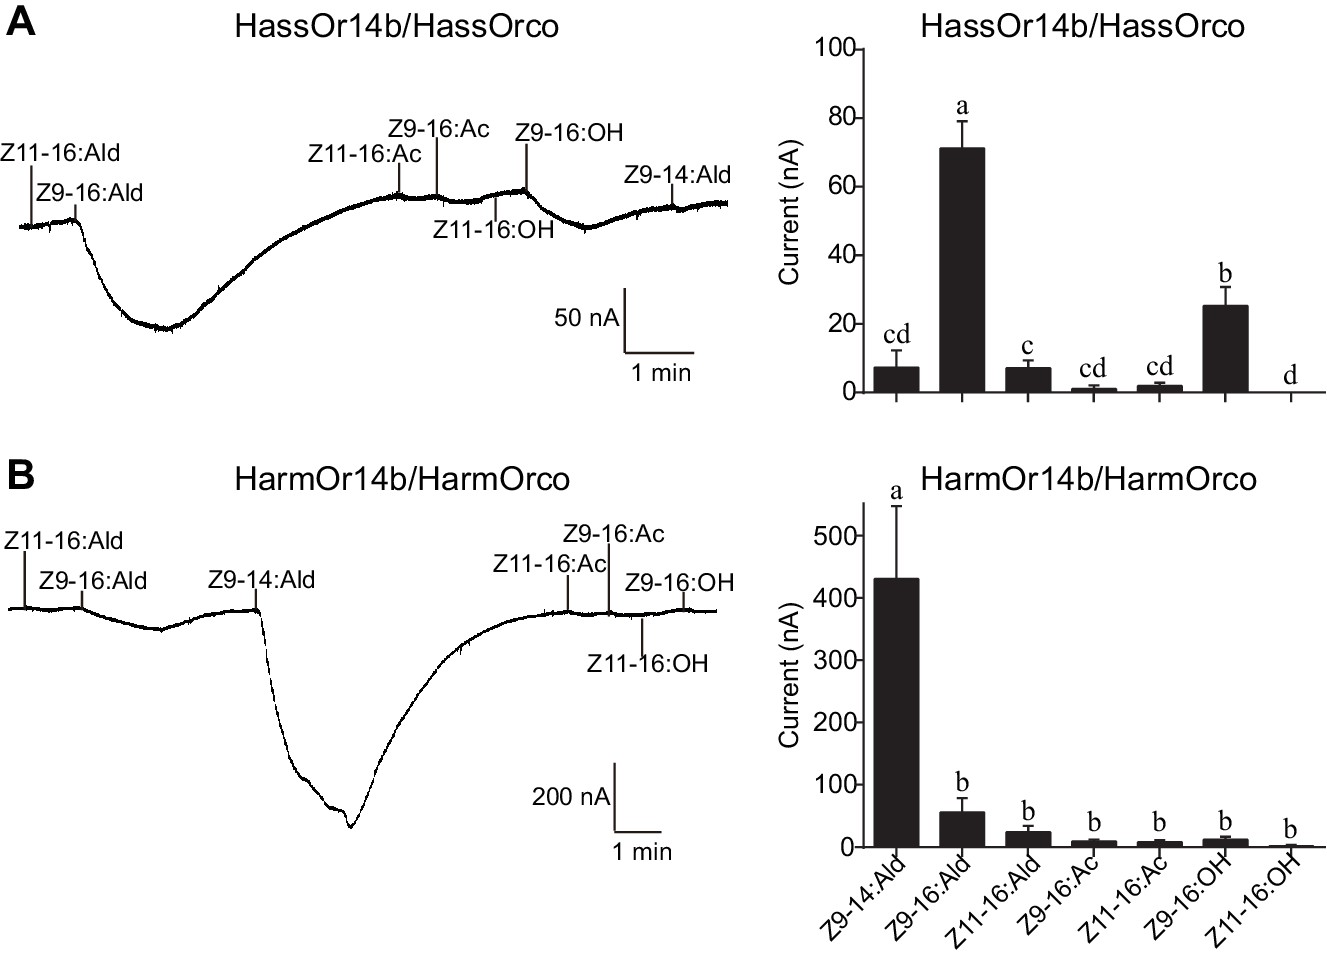
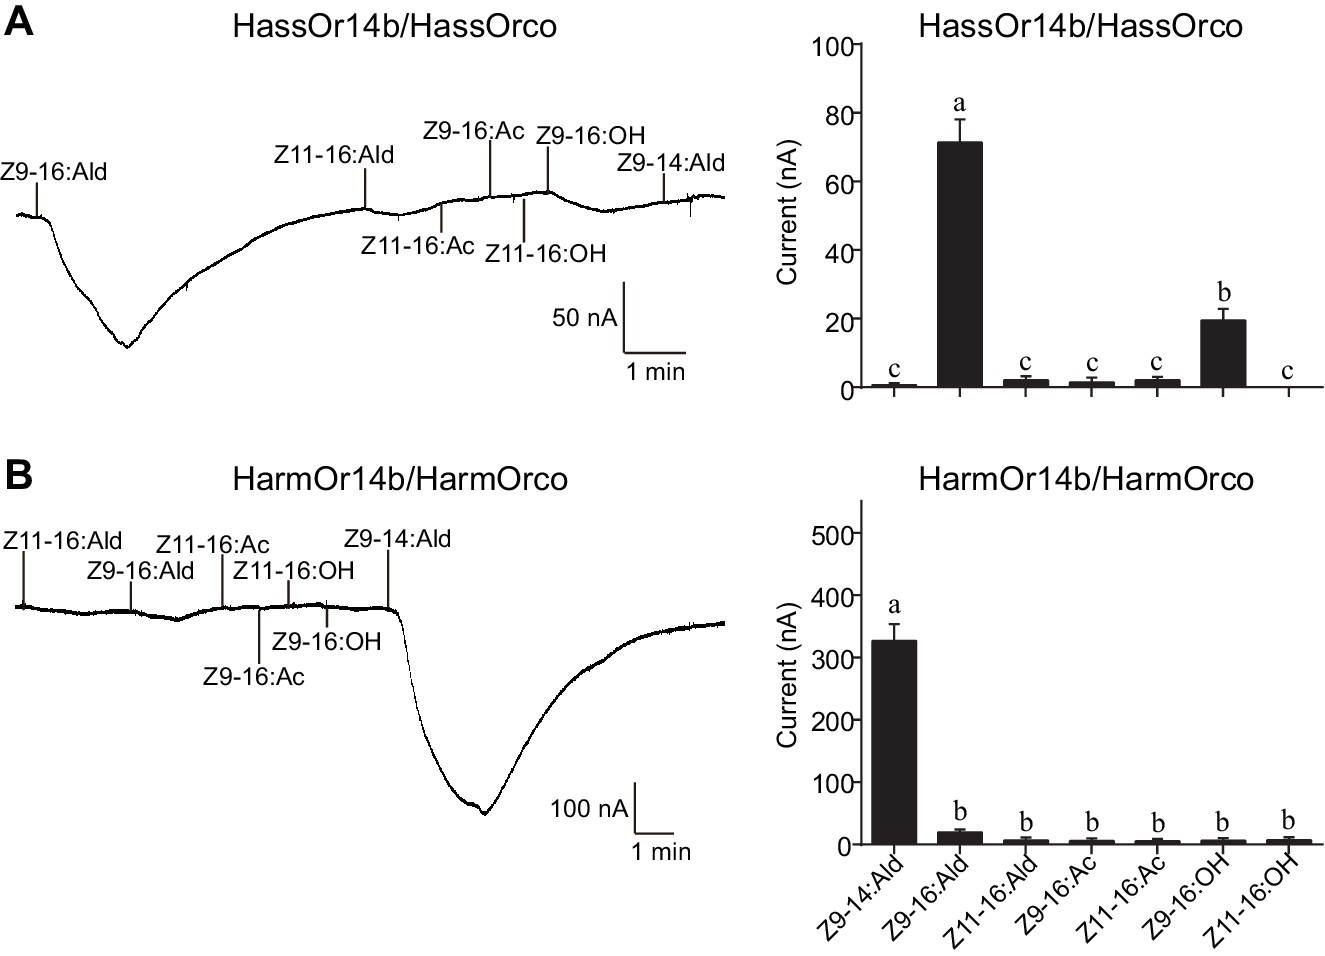
Two-electrode voltage-clamp recordings of Xenopus oocytes with co-expressed HassOr14b/HassOrco, and HarmOr14b/HarmOrco, stimulated with pheromone components and analogs.
(A) Inward current responses (left) and response profiles (right) of Xenopus oocytes expressing HassOr14b/HassOrco in response to 10−4 M concentrations of pheromone components and analogs. n = 7 replicates of cells, F = 31.75, p<0.001, one-way ANOVA, Tukey HSD test. (B) Inward current responses (left) and response profiles (right) of Xenopus oocytes expressing HarmOr14b/HarmOrco in response to 10−4 M concentrations of pheromone components and analogs. n = 7 replicates of cells, F = 17.67, p<0.001, one-way ANOVA, Tukey HSD test. Data are presented as mean ± SEM.
Figure 3—figure supplement 1
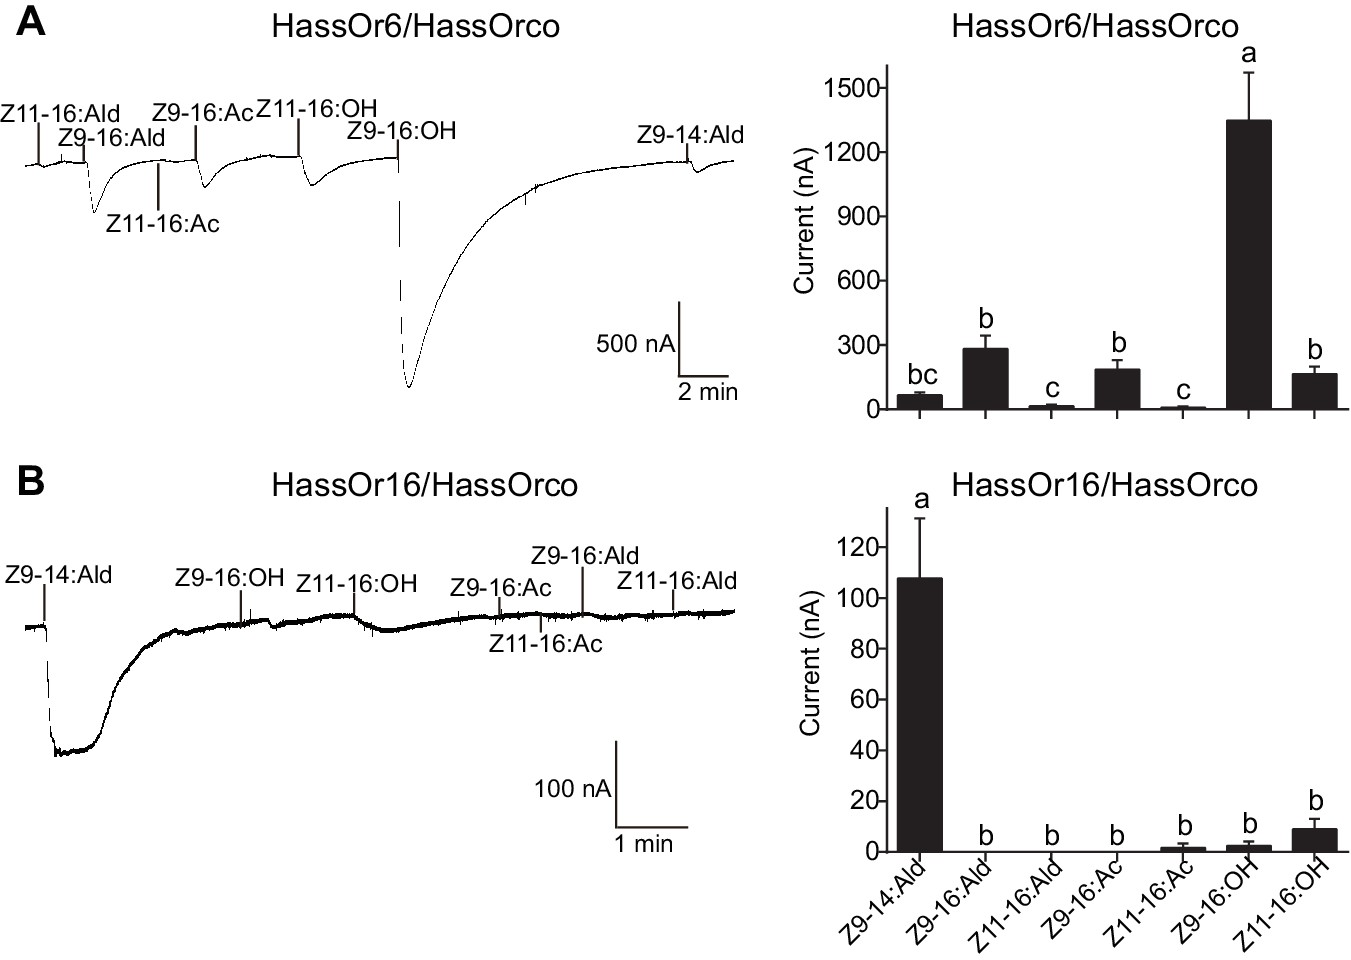
Two-electrode voltage-clamp recordings of Xenopus oocytes with co-expressed HassOr6/HassOrco and HassOr16/HassOrco to stimulation with pheromone compounds and analogs.
(A) Inward current responses (left) and response profiles (right) of Xenopus oocytes expressing HassOr6/HassOrco in response to 10−4 M concentrations of pheromone components and analogs. n = 6 replicates of cells, F = 27.29, p<0.001, one-way ANOVA, Tukey HSD test. (B) Inward current responses (left) and response profiles (right) of Xenopus oocytes expressing HassOr16/HassOrco in response to 10−4 M concentrations of pheromone components and analogs. n = 8 replicates of cells, F = 42.95, p<0.001, one-way ANOVA, Tukey HSD test. Data are presented as mean ± SEM.
Figure 3—figure supplement 2
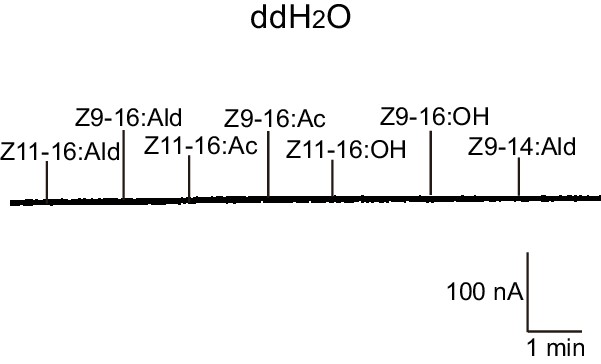
Two-electrode voltage-clamp recordings of Xenopus oocytes injected with distilled water and stimulated with pheromone compounds and analogs.
No inward current responses of distilled-water-injected Xenopus oocytes to pheromone components and analogs at 10–4 M.
Figure 3—figure supplement 3
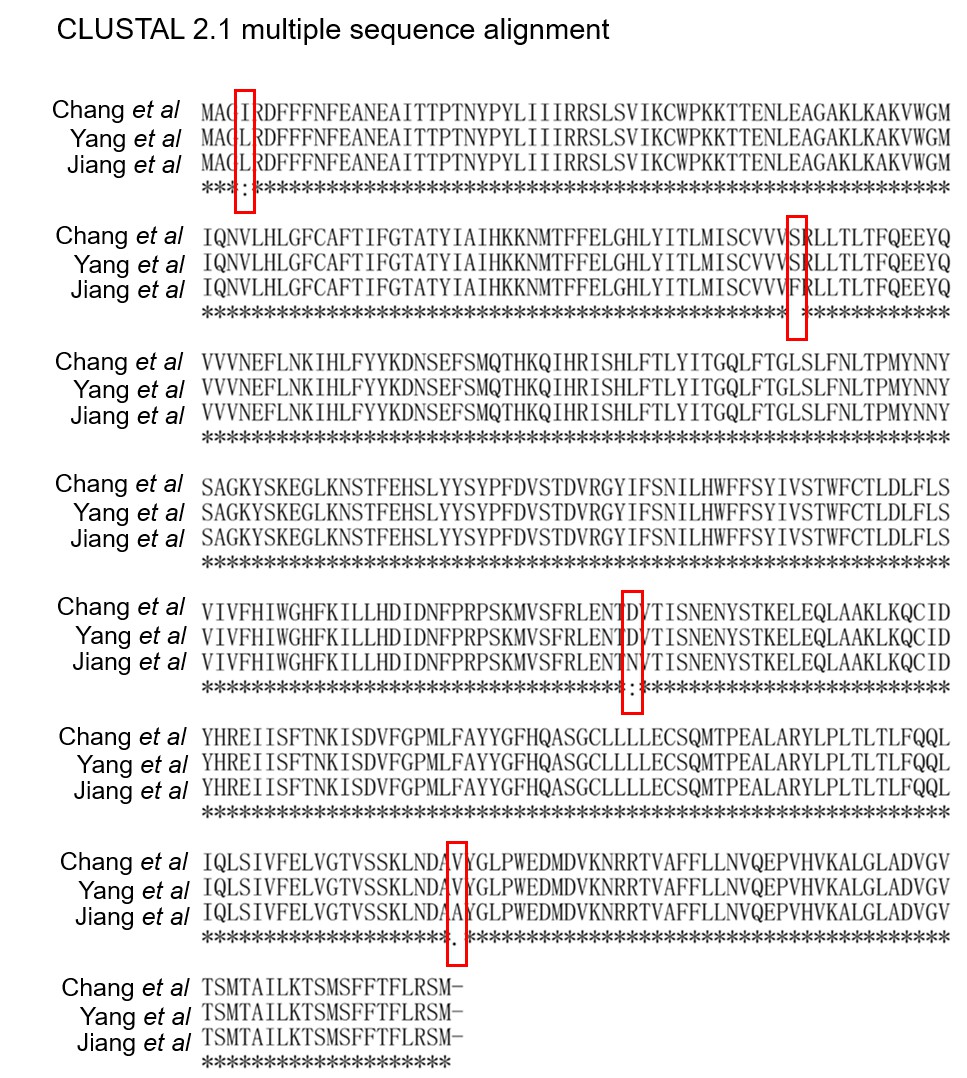
Alignment of amino acid sequences of HassOr14b in three studies: Yang et al.
(this study), Jiang et al. (Jiang et al., 2014), and Chang et al. (Chang et al., 2016). The same residues are marked by ‘*’, and the different residues are marked by the red box ‘’.
Figure 4 with 1 supplement
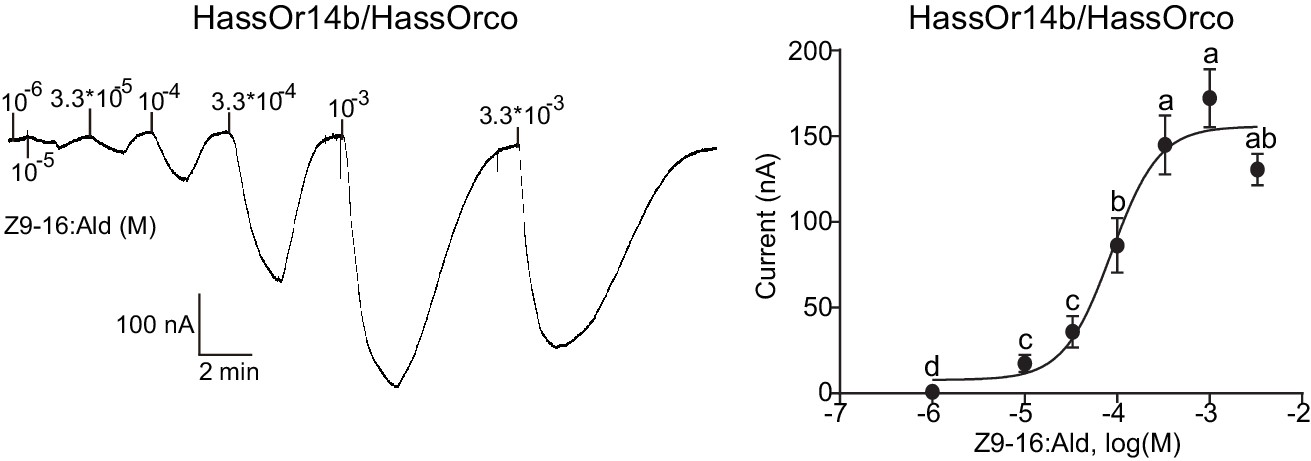
Dose responses of Xenopus oocytes with co-expressed HassOr14b/HassOrco stimulated with a range of Z9-16:Ald concentrations.
Inward current responses (left) and response profiles (right) of Xenopus oocytes expressing HassOr14b/HassOrco in response to Z9-16:Ald at serial concentrations. The EC50 value for Z9-16:Ald was 8.65 × 10⁻⁵ M. n = 7–9 replicates of cells, F = 54.57, p<0.001, one-way ANOVA, Tukey HSD test.
Figure 4—figure supplement 1
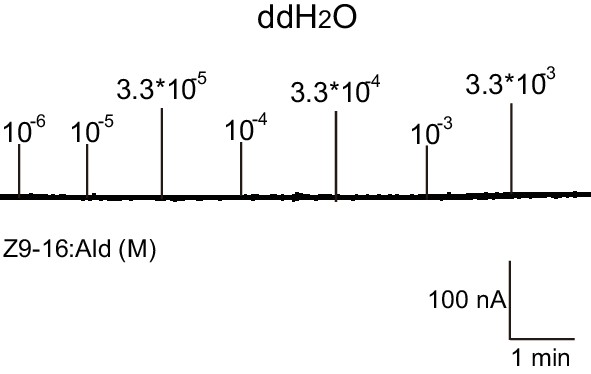
Two-electrode voltage-clamp recordings of Xenopus oocytes injected with distilled water and stimulated with pheromone compounds and analogs.
No inward current responses of distilled-water-injected Xenopus oocytes to a range of Z9-16:Ald concentrations.
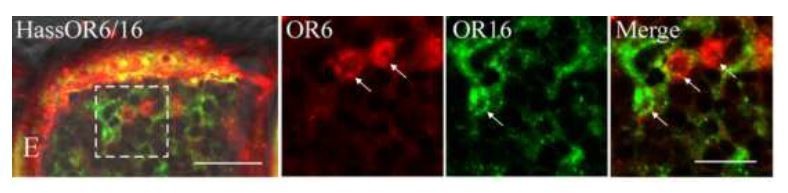
Figure 5
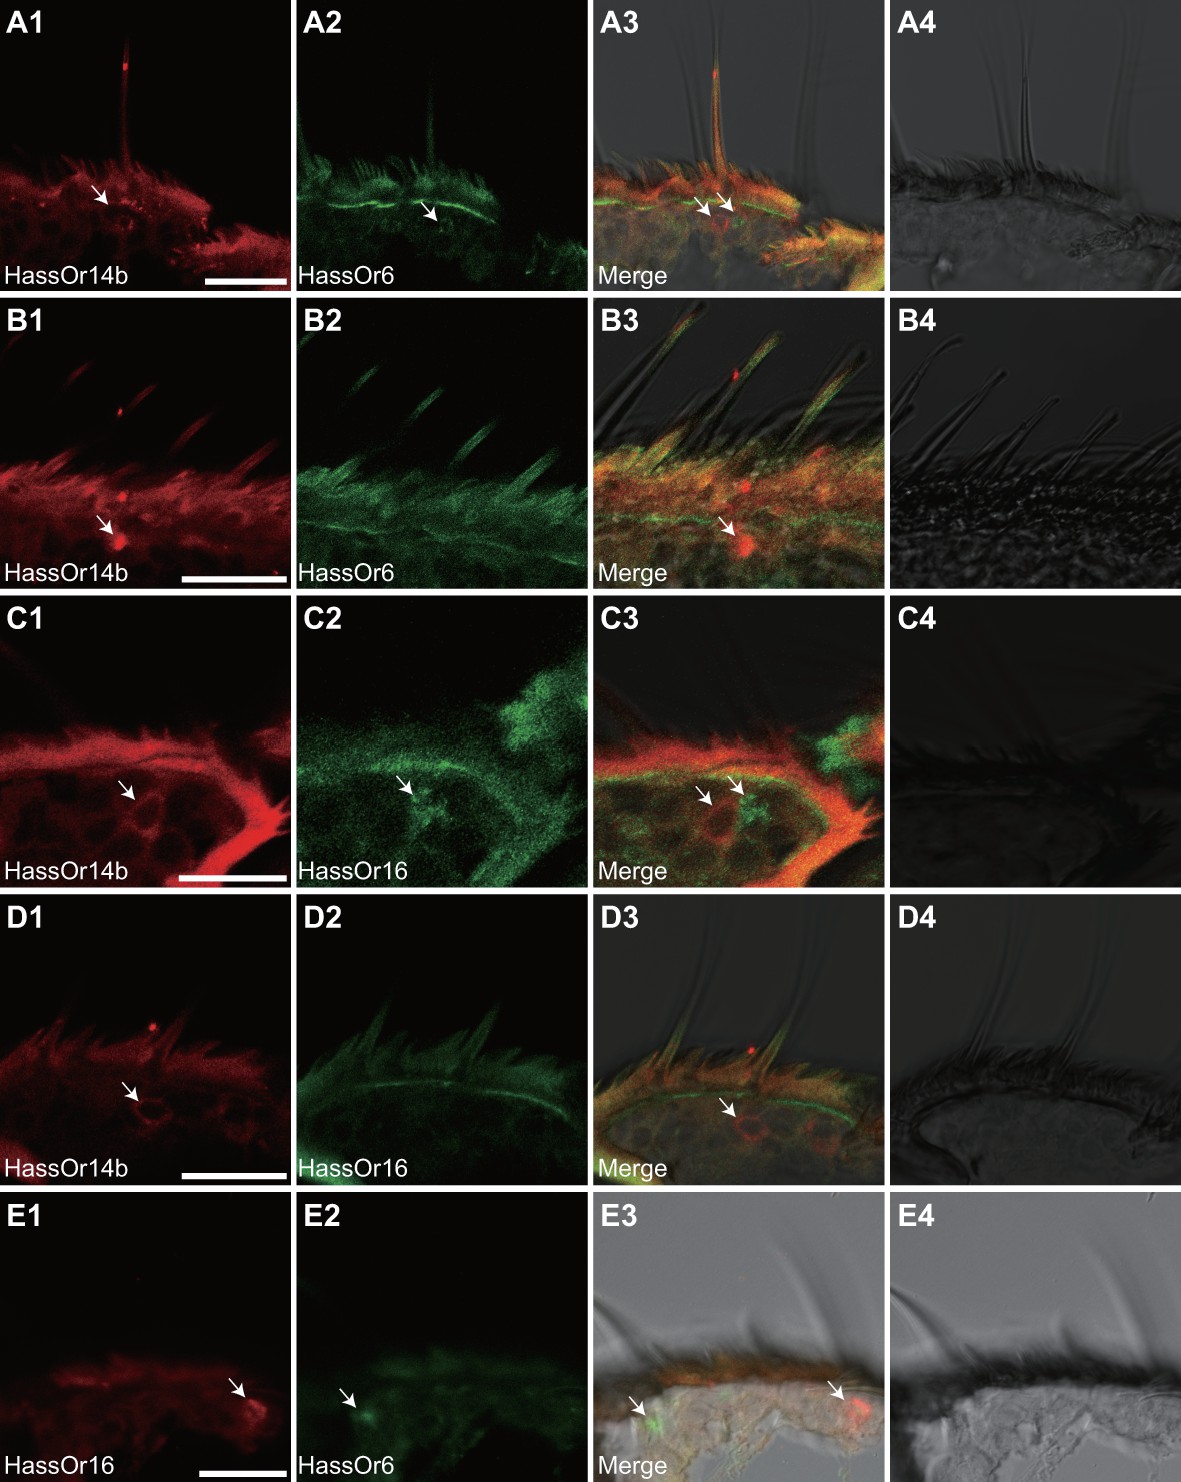
Two-colour in situ hybridization visualizing the combinations of HassOr14b/HassOr6, HassOr14b/HassOr16, and HassOr6/HassOr16 in male antennae of H.assulta.
(A, B) The localization of HassOr14b and HassOr6. (C, D) The localization of HassOr14b and HassOr16. (E) The localization of HassOr6 and HassOr16. Signals were visualized by red (digoxin-labeled probes) (A1, B1, C1, D1), green (biotin-labeled probes) (A2, B2, C2, D2), and both red and green (A3, B3, C3, D3) fluorescence. Bright-field images are presented as references (A4, B4, C4, D4). Arrows indicate the cell location. Scale bars: 20 μm.
Figure 6 with 1 supplement

Eight mutation regions in the predicted secondary structure of HassOr14b.
Each circle indicates an amino acid residue that differs between HassOr14b and HarmOr14b and is highlighted in orange. Black indicates mutation regions RI and RV; green indicates RII and RVI; grey indicates RIII and RVIII; blue indicates RIV and RVII. The image was constructed by TOPO2 software (http://www.sacs.ucsf.edu/TOPO2/) based on the secondary structure predicted by TOPCONS (topcons.net) models (Tsirigos et al., 2015). The structures of both HassOr14b and HarmOr14b were predicted and the model with a reliable 7-transmembrane structure was adopted.
Figure 6—figure supplement 1
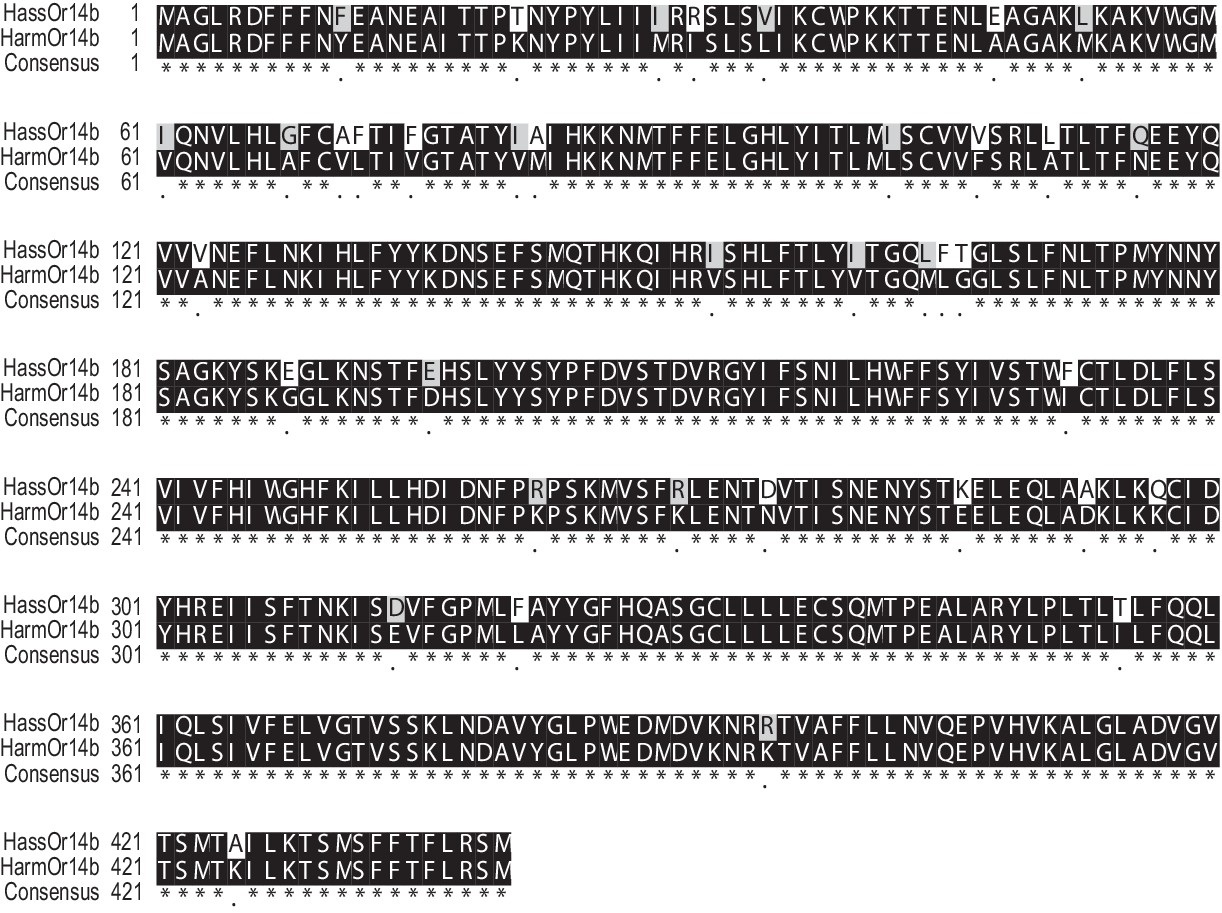
Alignment of amino acid sequences of HassOr14b and HarmOr14b.
The same residues are marked by ‘*’, and the different residues are marked by ‘•’.
Figure 7 with 2 supplements
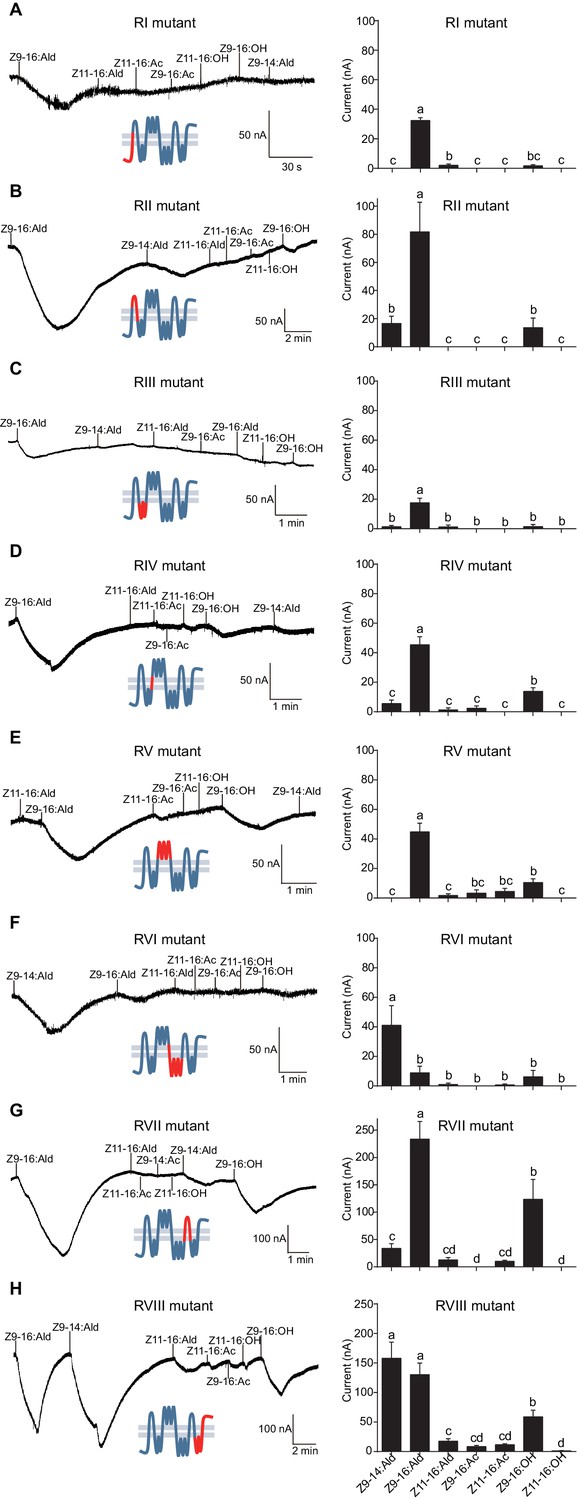
Two-electrode voltage-clamp recordings of Xenopus oocytes with co-expressed regional mutations and HassOrco stimulated with pheromone components and analogs.
(A) Inward current responses (left) and response profiles (right) of Xenopus oocytes expressing RI mutant/HassOrco in response to 10−4 M concentrations of pheromone components and analogs. n = 7 replicates of cells, F = 85.28, p<0.001. (B) Inward current responses (left) and response profiles (right) of Xenopus oocytes expressing RII mutant/HassOrco in response to 10−4 M concentrations of pheromone components and analogs. n = 6 replicates of cells, F = 29.11, p<0.001. (C) Inward current responses (left) and response profiles (right) of Xenopus oocytes expressing RIII mutant/HassOrco in response to 10−4 M concentrations of pheromone components and analogs. n = 5 replicates of cells, F = 24.94, p<0.001. (D) Inward current responses (left) and response profiles (right) of Xenopus oocytes expressing RIV mutant/HassOrco in response to 10−4 M concentrations of pheromone components and analogs. n = 6 replicates of cells, F = 31.12, p<0.001. (E) Inward current responses (left) and response profiles (right) of Xenopus oocytes expressing RV mutant/HassOrco in response to 10−4 M concentrations of pheromone components and analogs. n = 6 replicates of cells, F = 23.80, p<0.001. (F) Inward current responses (left) and response profiles (right) of Xenopus oocytes expressing RVI mutant/HassOrco in response to 10−4 M concentrations of pheromone components and analogs. n = 7 replicates of cells, F = 14.77, p<0.001. (G) Inward current responses (left) and response profiles (right) of Xenopus oocytes expressing RVII mutant/HassOrco in response to 10−4 M concentrations of pheromone components and analogs. n = 6 replicates of cells, F = 39.40, p<0.001. (H) Inward current responses (left) and response profiles (right) of Xenopus oocytes expressing RVIII mutant/HassOrco in response to 10−4 M concentrations of pheromone components and analogs. n = 10 replicates of cells, F = 41.57, p<0.001. Data are presented as mean ± SEM. One-way ANOVA, Tukey HSD test are used. Mutation regions are highlighted in red.
Figure 7—figure supplement 1
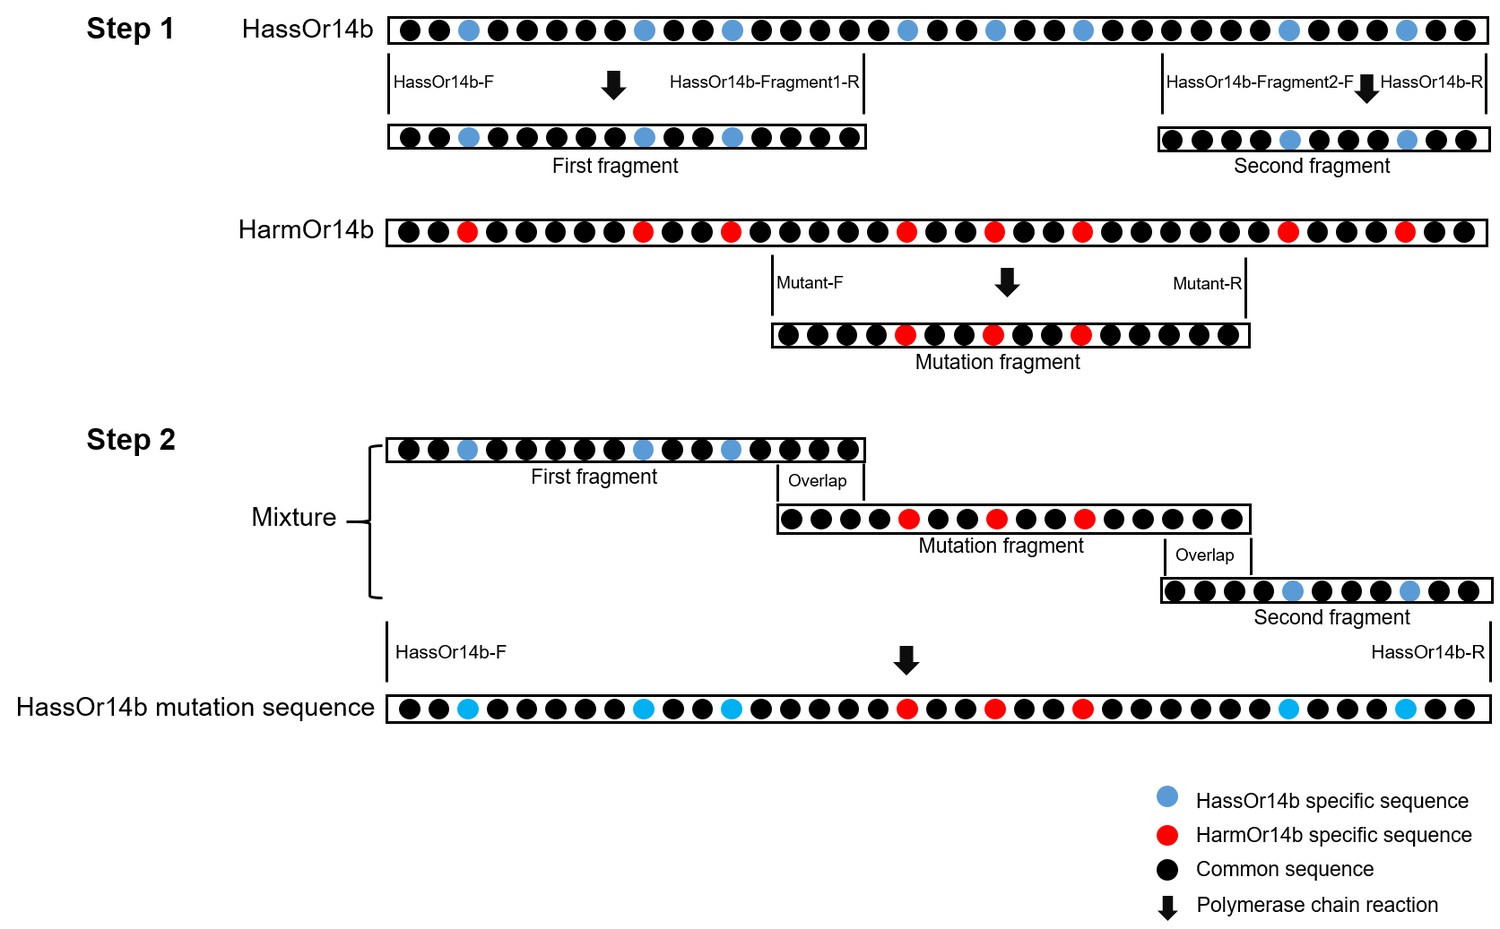
The construction strategy of HassOr14b mutation sequences.
(Step 1) The first and second fragments are cloned from the cDNA of H. assulta, by the primers of HassOr14b-F/HassOr14b-Fragment1-R and HassOr14b-Fragment2-F/HassOr14b-R; the mutation fragment is cloned from the cDNA of H. armigera, by the primers of Mutant-F/Mutant-R. (Step 2) The first fragment, the second fragment, and the mutation fragment (the mutation fragment has 25–60 bp overlap sequences with the other two fragments) are mixed as the template. The primers of HassOr14b-F/HassOr14b-R are used to generate the HassOr14b mutation sequence. The HassOr14b-specific sequence is indicated by blue dots ‘’, the HarmOr14b-specific sequence is indicated by red dots ‘,’ and the common sequence is indicated by black dots ‘●’. The polymerase chain reaction is indicated by black arrow ‘↓’.
Figure 7—figure supplement 2
Two-electrode voltage-clamp recordings of Xenopus oocytes with co-expressed wild-type HassOr14b/HassOrco, and wild type HarmOr14b/HarmOrco, stimulated with pheromone components and analogs.
(A) Inward current responses (left) and response profiles (right) of Xenopus oocytes expressing wild-type HassOr14b/HassOrco in response to 10−4 M concentrations of pheromone components and analogs. n = 6 replicates of cells, F = 61.44, p<0.001, one-way ANOVA, Tukey HSD test. (B) Inward current responses (left) and response profiles (right) of Xenopus oocytes expressing wild type HarmOr14b/HarmOrco in response to 10−4 M concentrations of pheromone components and analogs. n = 6 replicates of cells, F = 48.56, p<0.001, one-way ANOVA, Tukey HSD test. Data are presented as mean ± SEM.
Figure 8
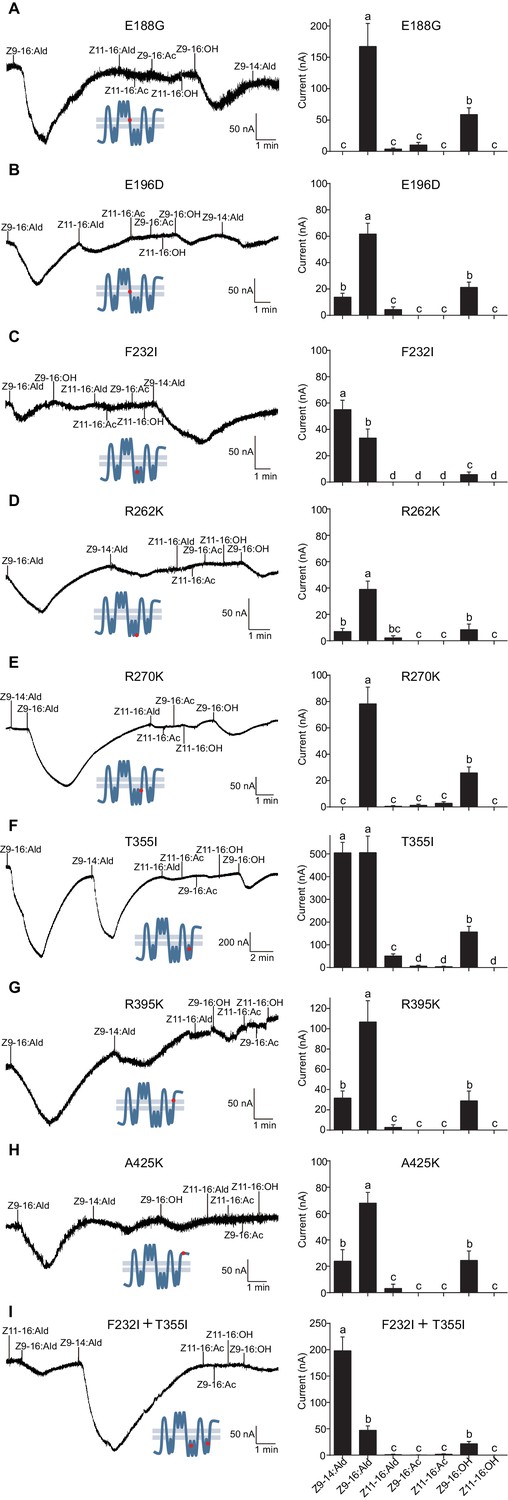
Two-electrode voltage-clamp recordings of Xenopus oocytes with co-expressed site mutations and HassOrco, stimulated with pheromone components and analogs.
(A) Inward current responses (left) and response profiles (right) of Xenopus oocytes expressing E188G/HassOrco in response to 10−4 M concentrations of pheromone components and analogs. n = 6 replicates of cells, F = 52.32, p<0.001. (B) Inward current responses (left) and response profiles (right) of Xenopus oocytes expressing E196D/HassOrco in response to 10−4 M concentrations of pheromone components and analogs. n = 7 replicates of cells, F = 65.87, p<0.001. (C) Inward current responses (left) and response profiles (right) of Xenopus oocytes expressing F232I/HassOrco in response to 10−4 M concentrations of pheromone components and analogs. n = 8 replicates of cells, F = 90.65, p<0.001. (D) Inward current responses (left) and response profiles (right) of Xenopus oocytes expressing R262K/HassOrco in response to 10−4 M concentrations of pheromone components and analogs. n = 8 replicates of cells, F = 31.96, p<0.001. (E) Inward current responses (left) and response profiles (right) of Xenopus oocytes expressing R270K/HassOrco in response to 10−4 M concentrations of pheromone components and analogs. n = 8 replicates of cells, F = 56.13, p<0.001. (F) Inward current responses (left) and response profiles (right) of Xenopus oocytes expressing T355I/HassOrco in response to 10−4 M concentrations of pheromone components and analogs. n = 9 replicates of cells, F = 85.70, p<0.001. (G) Inward current responses (left) and response profiles (right) of Xenopus oocytes expressing R395K/HassOrco in response to 10−4 M concentrations of pheromone components and analogs. n = 7 replicates of cells, F = 40.19, p<0.001. (H) Inward current responses (left) and response profiles (right) of Xenopus oocytes expressing A425K/HassOrco in response to 10−4 M concentrations of pheromone components and analogs. n = 5 replicates of cells, F = 24.24, p<0.001. (I) Inward current responses (left) and response profiles (right) of Xenopus oocytes expressing (F232I + T355I)/HassOrco in response to 10−4 M concentrations of pheromone components and analogs. n = 9 replicates of cells, F = 79.03, p<0.001. Data are presented as mean ± SEM. One-way ANOVA, Tukey HSD test are used. Mutation sites are highlighted by red dots ‘’.
Author response image 1
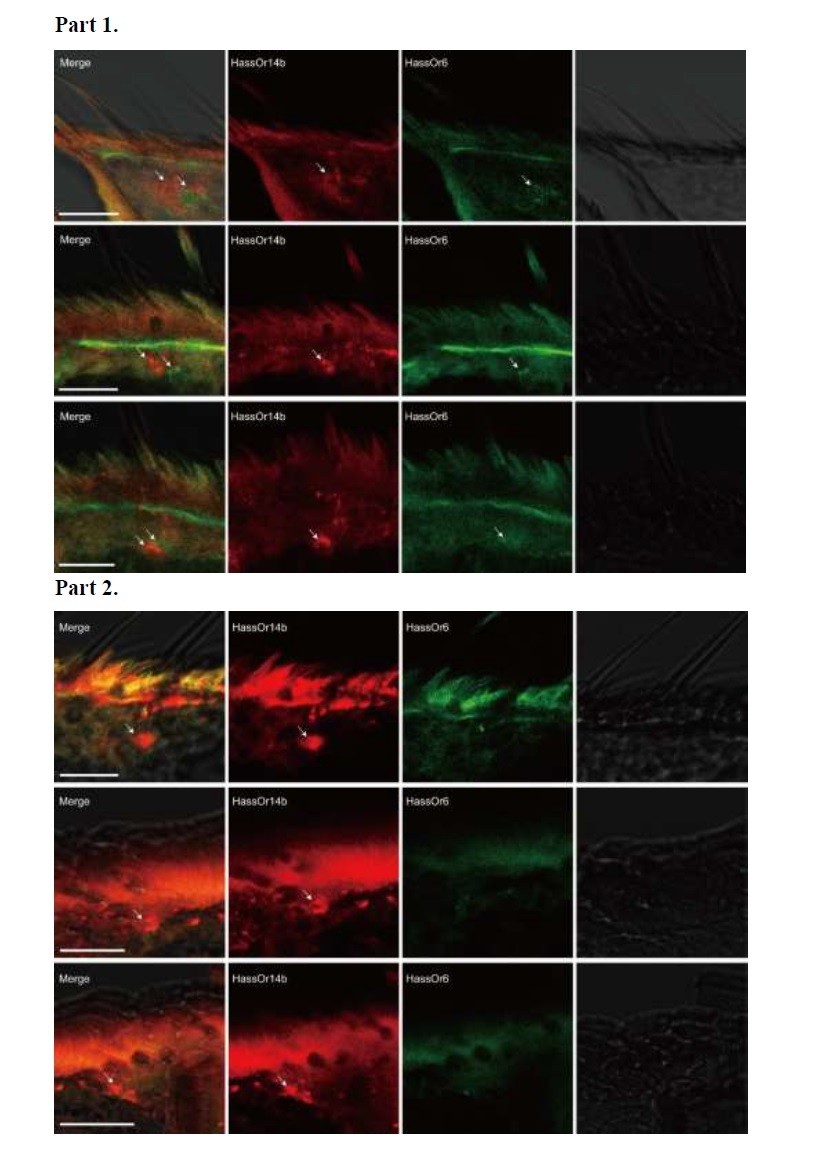
Two-colour in situ hybridization visualizing the combinations of HassOr14b and HassOr6 in male antennae of H. assulta.
Arrows indicate the cell location. Scale bars: 20 μm.
Author response image 2

Two-colour in situ hybridization visualizing the combinations of HassOr14b and HassOr16 in male antennae of H. assulta.
Arrows indicate the cell location. Scale bars: 20 μm.
Author response image 3

Two-colour in situ hybridization visualizing the combinations of HassOr16 and HassOr6 in male antennae of H. assulta.
Arrows indicate the cell location. Scale bars: 20 μm.
Author response image 4
Two-colour in situ hybridization visualizing the combinations of HassOr6 and HassOr16 in male antennae of H. assulta.
Arrows indicate the cell location. Scale bar: 20 μm; the boxed area: 10 μm (adapted from Figure 8E Chang et al., 2016).
Additional files
-
Supplementary file 1
Primers used for qPCR, in situ hybridization (In situ), Xenopus oocytes expression (XE) and amino acid mutation (MUT).
- https://doi.org/10.7554/eLife.29100.019
-
Supplementary file 2
The accession numbers of all PRs and Orcos used in phylogenetic analysis.
- https://doi.org/10.7554/eLife.29100.020
-
Transparent reporting form
- https://doi.org/10.7554/eLife.29100.021
Download links
A two-part list of links to download the article, or parts of the article, in various formats.
Downloads (link to download the article as PDF)
Open citations (links to open the citations from this article in various online reference manager services)
Cite this article (links to download the citations from this article in formats compatible with various reference manager tools)
Two single-point mutations shift the ligand selectivity of a pheromone receptor between two closely related moth species
eLife 6:e29100.
https://doi.org/10.7554/eLife.29100


