Neural stem cells induce the formation of their physical niche during organogenesis
- Centre for Organismal Studies Heidelberg, Germany
- University of Heidelberg, Germany
- University of Melbourne, Australia
- Nikon Imaging Center at the University of Heidelberg, Germany
Figures
Figure 1
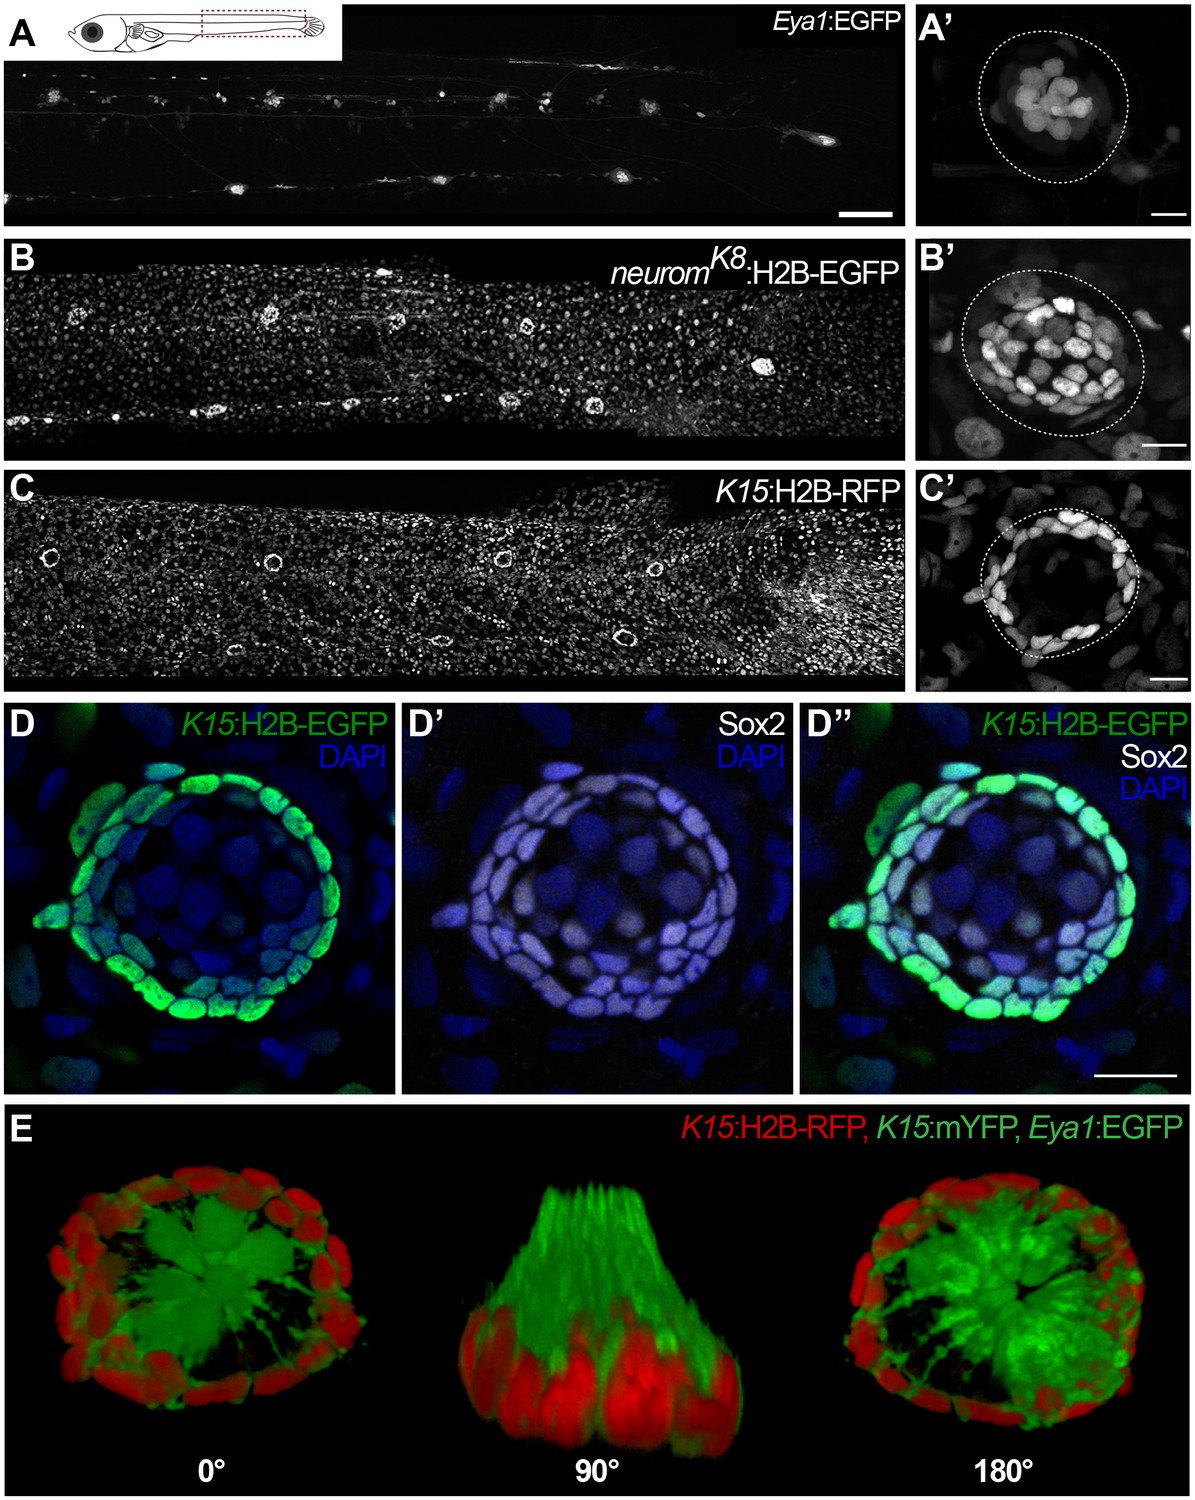
Specific transgenic lines label mantle, support and hair cells in mature medaka neuromasts.
Tg(Eya1:EGFP) allows visualisation of all neuromasts along the pLL (A), and labels hair cells and internal support cells (A’) (N=>20 neuromasts in >10 larvae). The enhancer trap neuromK8 line labels skin epithelia (B) and mantle and support cells of a mature neuromast (B’) (N=>20 neuromasts in >10 larvae). Tg(K15:H2B-RFP) also labels skin epithelia all over the body surface (C), but RFP expression in mature neuromasts is restricted to mantle cells (C’) (N=>10 neuromasts in >10 larvae). K15+mantle cells are Sox2 +as revealed by immunostainings (D–D’’) (N=>10 neuromasts in seven larvae). A 3D reconstruction of a mature neuromast (E) of the triple transgenic line Tg(K15:mYFP)Tg(Eya1:EGFP)Tg(K15:H2B-RFP) of an early juvenile. Six neuromast hair cells (green bundles) project outwards, surrounded by a ring of mantle cells (red nuclei and green membranes) that encapsulate the hair cell bundles in a cupula-like structure (N = 6 neuromasts in two larvae). Scalebars are 100 µm for entire trunks (A, B, C) and 10 µm in neuromast close-ups.
Figure 2
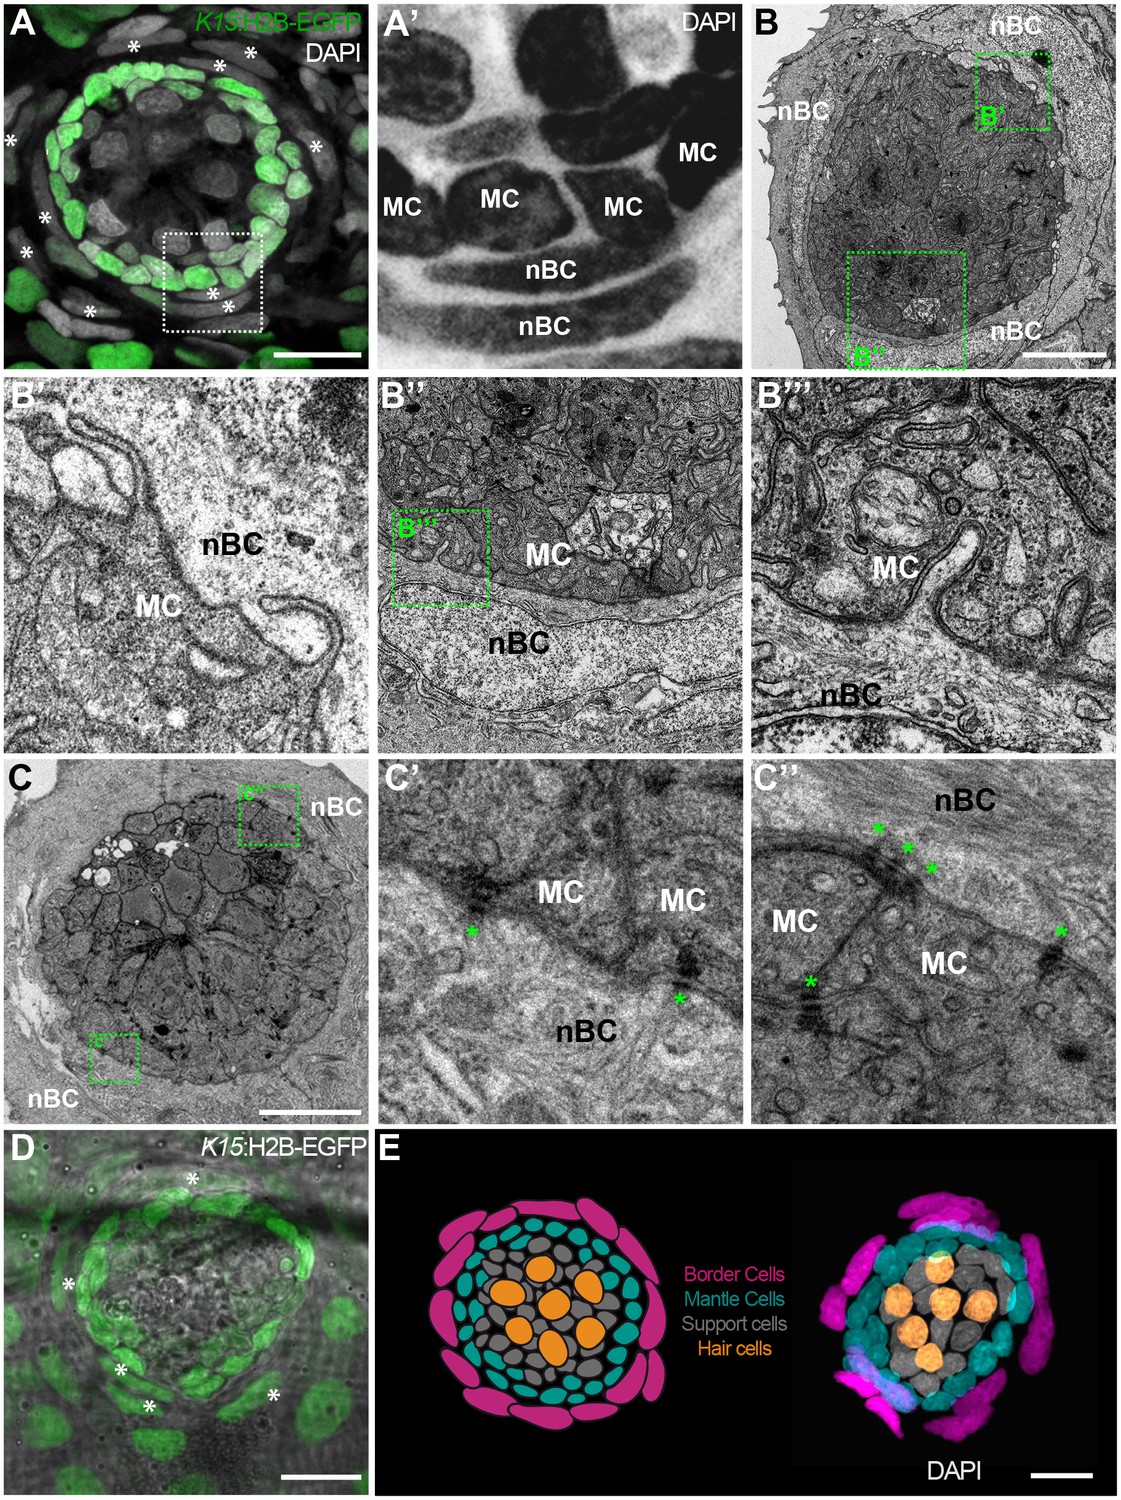
nBCs surround mantle cells of the neural lineage in mature neuromasts.
Early juvenile neuromasts from Tg(K15:H2B-GFP) show mantle cells (green in A, ‘MC’ in A’) that are closely surrounded by elongated nuclei (border cells, nBCs) visualised by DAPI (white asterisks in A, ‘nBC’ in A’) (N=>10 neuromasts in >5 larvae). DAPI is shown in grey (A) and black (A’) to enhance contrast. Electronmicroscopy reveals that nBC and K15 +mantle cells are in close contact (B–C’’) (N = 6 neuromasts in four fish). (B) Overview of a mature neuromast where mantle cells are surrounded by three nBCs. (B’–B’’’) Zoom-in panels from figure (B) reveal a close association between MCs and nBCs that includes cytoplasmic protrusions of each cell type into the other (B’–B’’’) (N = 6 neuromasts in four fish). (C) An upper section on a neuromast where mantle cells are surrounded by two nBCs. The darker dots (green asterisks) are cytoplasmic plaques of desmosomes formed between mantle cells and nBCs (C’, C’’) (N = 2 neuromasts in one fish). (D) A younger neuromast than the one depicted in (A) from Tg(K15:H2B-GFP) shows that nBCs are also labelled with GFP (white asterisks in D) (N=>10 neuromasts in >5 larvae). (E) Pseudo-coloured DAPI neuromast and scheme depicting the four cell types observed in every mature neuromast organ. Hair cells are shown in yellow, support cells in grey, mantle cells in green and border cells in magenta. Scalebars are 10 µm.
Figure 3 with 2 supplements

Mature neuromasts are composed of two separate lineages.
(A) Experimental outline of clonal induction and short-term lineage tracing. t2 = 15 dpf. for B’ and D’, and 27 dpf for C’. (B–D’’) Iterative imaging of the same clones (H2B-EGFP) after recombination via tamoxifen reveals different behaviour of neuromast cells. Live imaging of clones containing mantle cells at t1, which expanded into the support cell domain (B,B’ and scheme in B’’) and even further to generate hair cells (C, C’ and scheme in C’). Clones that contain labelled nBCs at t1 were restricted to the nBCs domain later on (D, D’ and scheme in D’), revealing a separate lineage for MCs-SCs-HCs and nBCs. Scalebars are 10 µm. (Ntotal = 152 clones in 111 neuromasts of 21 embryos).
Figure 3—figure supplement 1
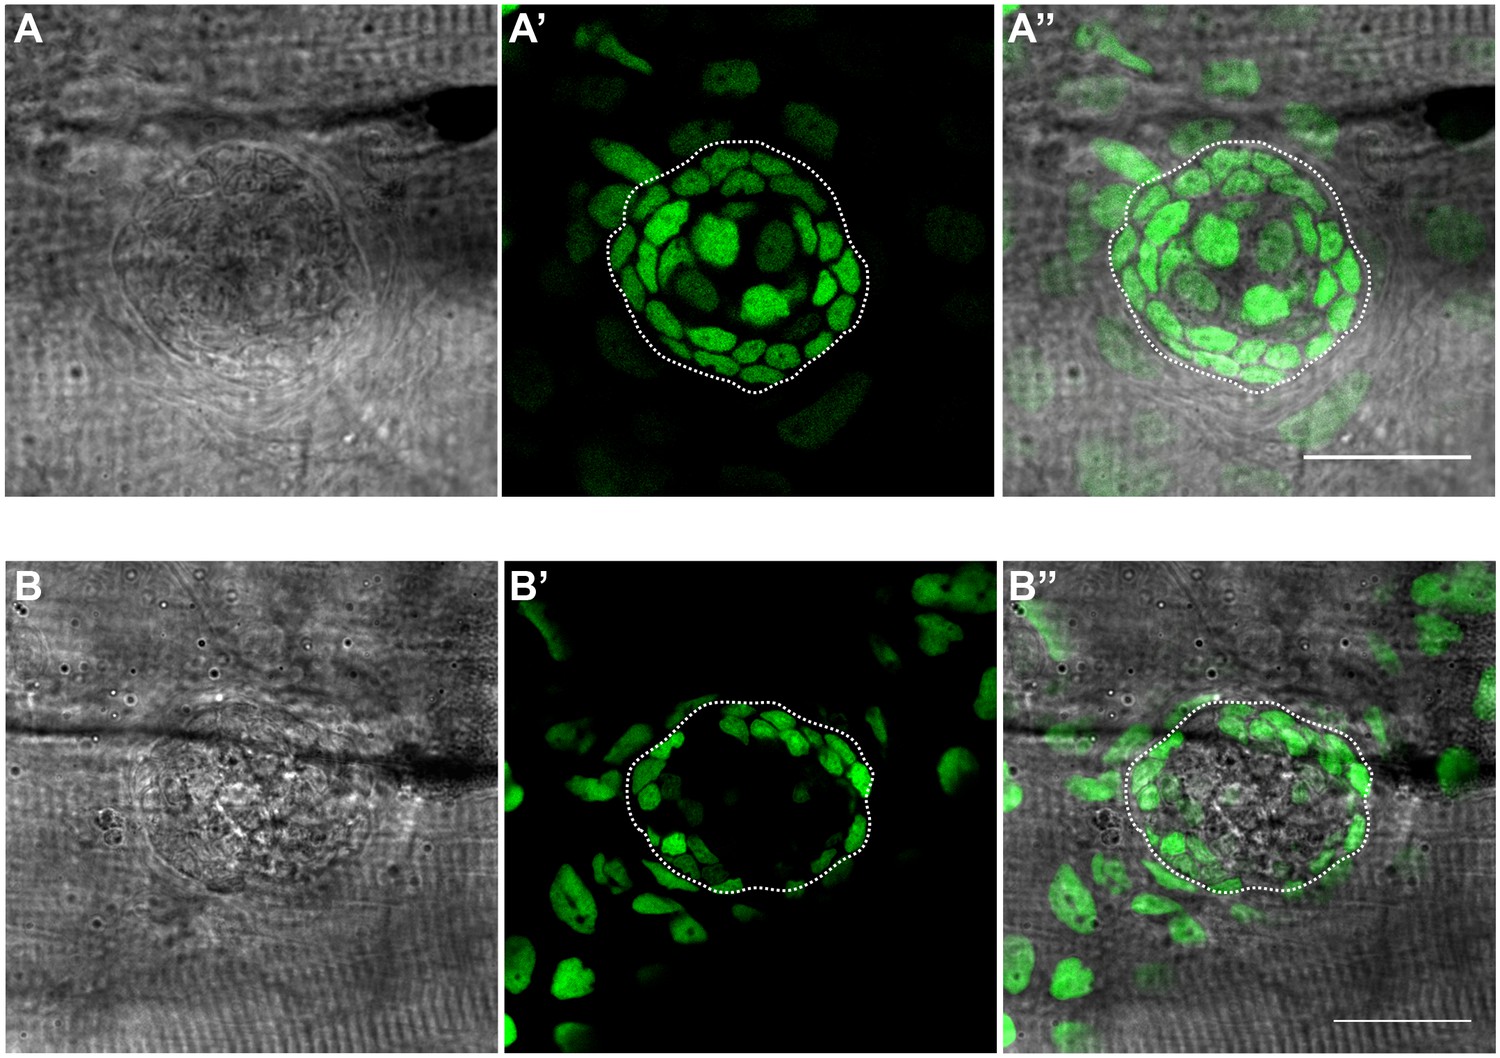
Bright-field imaging allows defining the boundary between nBCs and neural lineage.
(A–A’’) Bright-field and fluoresence imaging of mature neuromasts from a stage 39 GaudiLoxpOUT fish displaying H2B-EGFP ubiquitously. The outlines of the nBC - neural lineage boundary can be defined accurately from the bright-field imaging (dotted outline) (N = 5 neuromasts in three fish). (B–B’’) Bright-field and flouresence imaging of a mature neuromast from a stage 39 Tg(K15::H2B-eGFP) fish displaying eGFP in mantle cells and the suprabasal skin epithelium. The outlines of the nBC - neural lineage boundary can be defined accurately from the bright-field imaging (dotted outline). (N = 5 neuromasts in three fish). Scalebar = 10 µm.
Figure 3—figure supplement 2
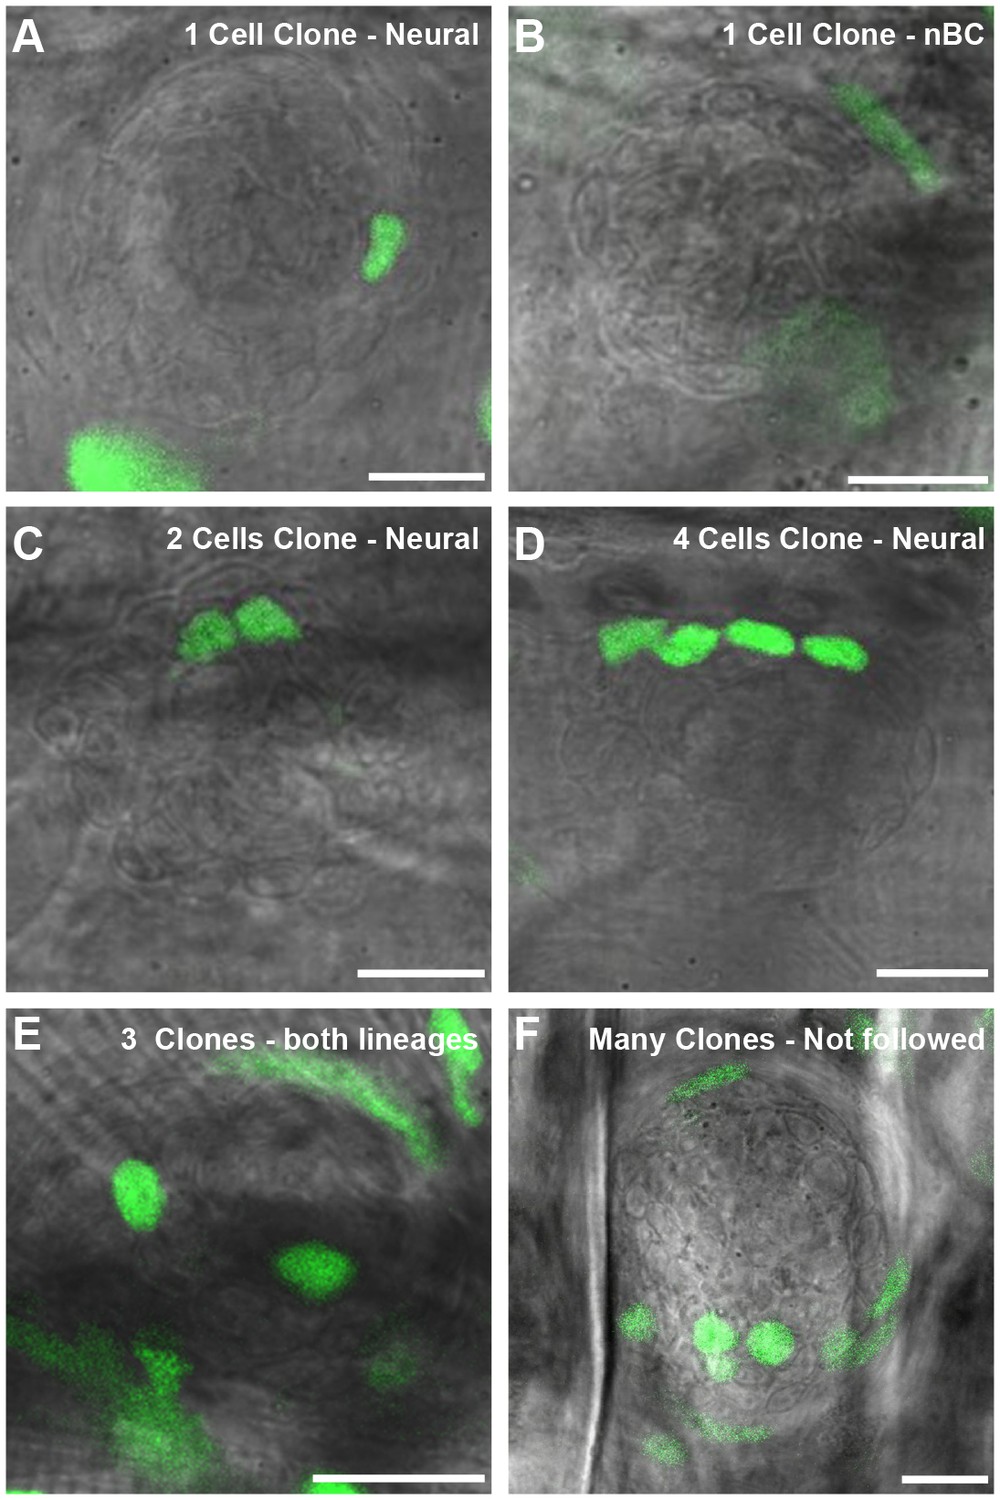
Examples of different neuromast clones induced by the GaudiRSG lineage tracing tool.
After tamoxifen induced recombination of GaudiRSG, GaudiUbiq.iCRE embryos we selected for neuromasts displaying unambiguous clones. Selected neuromasts include clones in which one cell (A, B), two cells (C) and four cells (D) are labelled and cases with up to three clones in the same neuromasts (E). We did not consider neuromasts with excess labelling and thus unclear clones for this particular analysis (F). Scalebar = 10 µm.
Figure 4
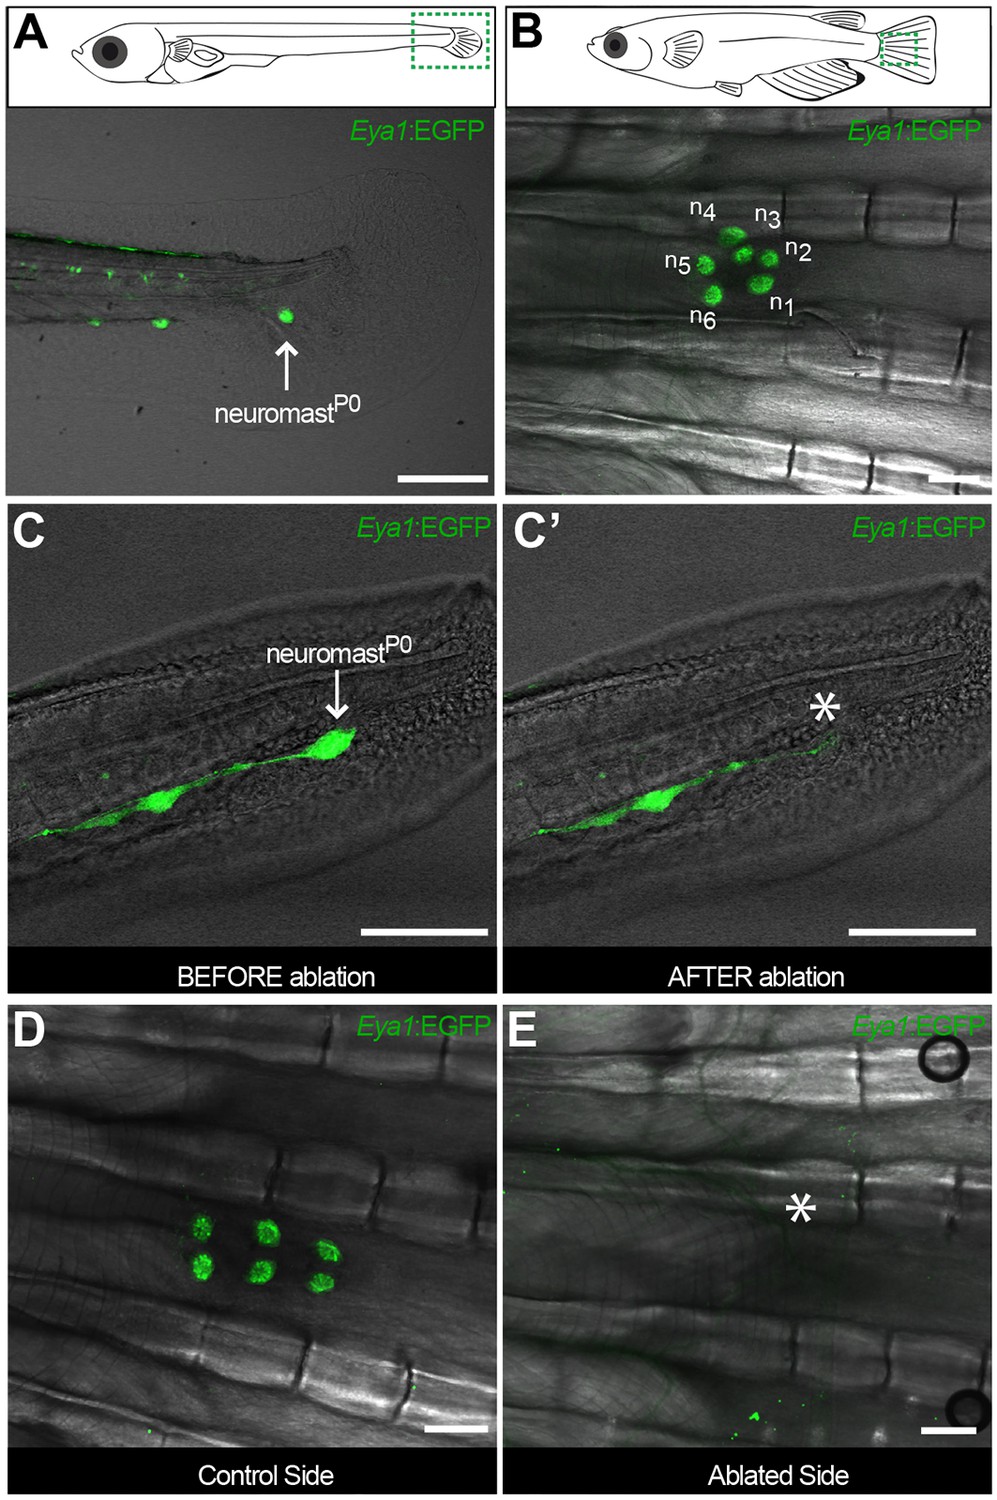
The CNC allows studying stem cells during organ growth, homeostasis and post-embryonic organ formation.
Early juvenile medaka display a single neuromast on the caudal fin (neuromastP0, arrow in A), which gives rise to a cluster of neuromasts (n1 to n6, (B) during post-embryonic life. Two-photon laser microscopy can be used to effectively ablate neuromastP0 (C and asterisk in C’). The caudal neuromast cluster (D) cannot form in the absence of neuromastP0 (asterisk in E) (n = 7 CNCs in seven fish). Scalebars are 10 µm in embryos and 100 µm in adults.
Figure 5 with 2 supplements
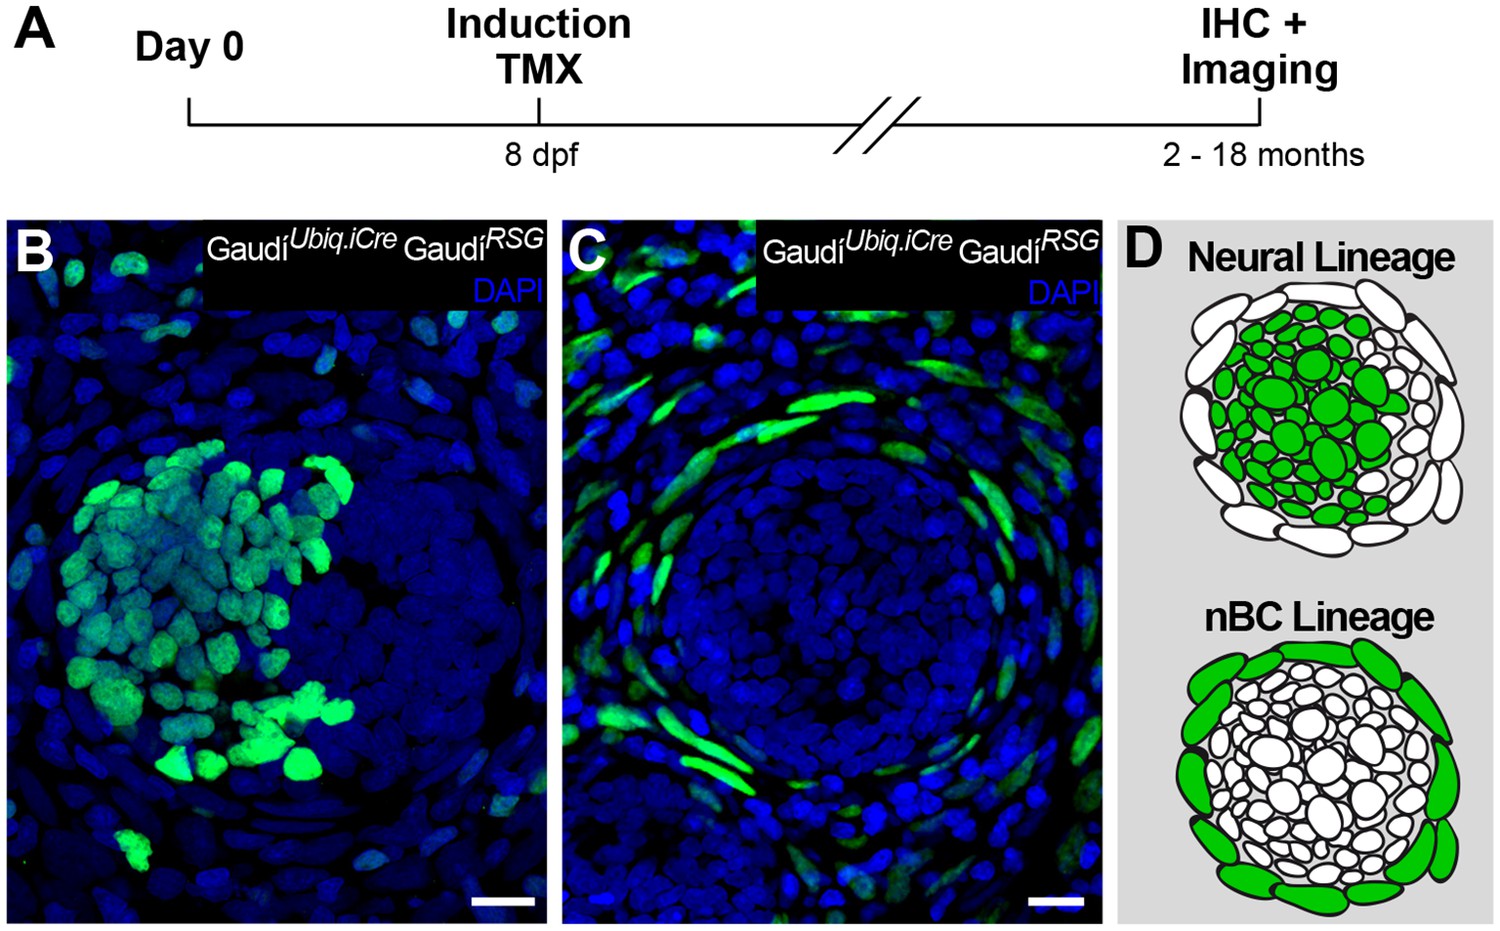
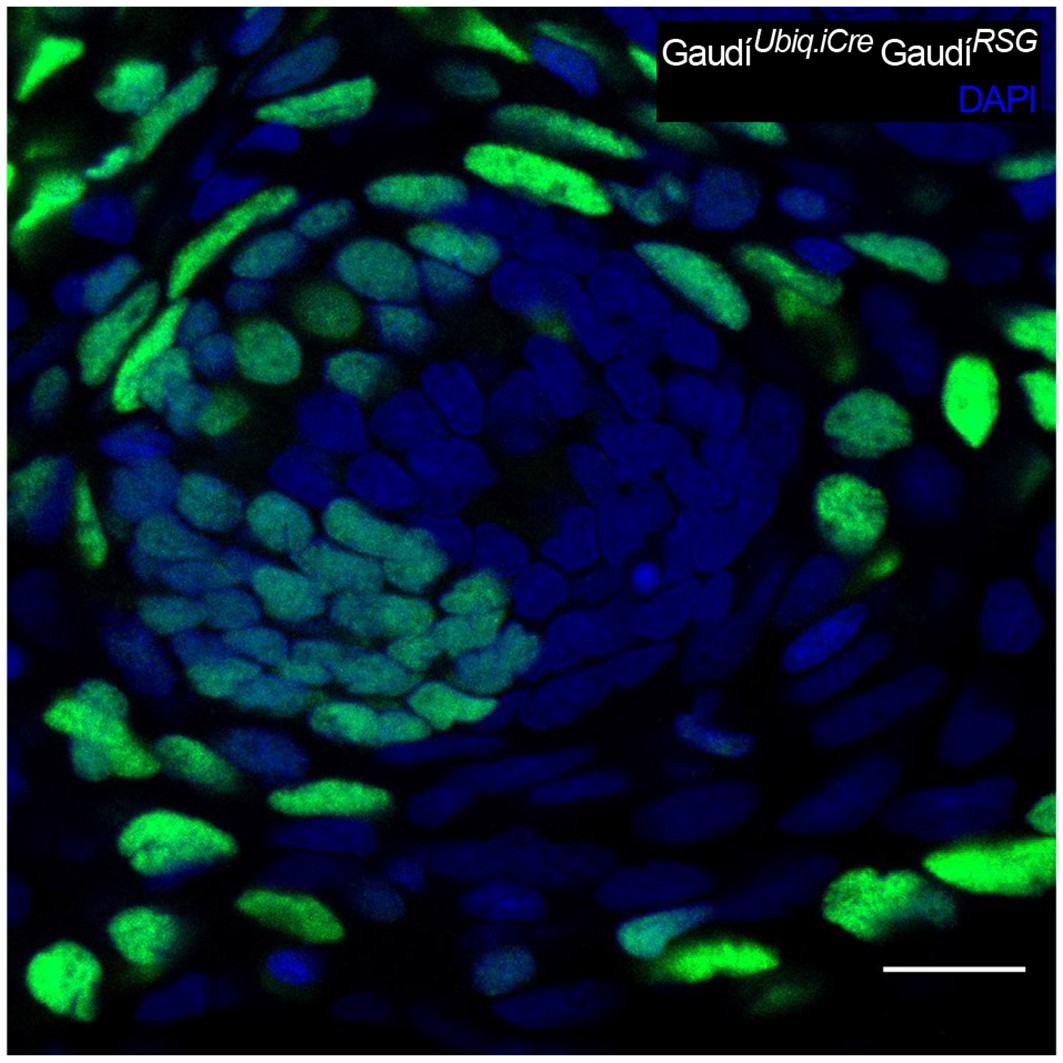
Independent stem cell populations maintain neural and nBC lineages in mature neuromasts.
(A) Experimental outline of long-term lineage tracing using GaudíRSG GaudíUbiq.iCre. Neuromasts in the CNC of induced fish are labelled either in the neural lineage (B, upper scheme in D)(n = 39 neuromasts in 47 CNCs) or in the nBC lineage (C, bottom scheme in D) (n = 64 neuromasts in 47 CNCs). Neuromasts labelled in the neural lineage contain mantle, support and hair cells (B), while clones in the nBC lineage do not contribute to the neural lineage (C). Scalebars are 10 µm.
Figure 5—figure supplement 1
High labelling efficiencies result in neuromast labelled in both neural and nBC lineages.
An adult neuromast in the CNC displays labelled nBCs and also mantle, suport and hair cells due to a high recombination induction of the double transgenic GaudíRSG GaudíUbiq.iCre. We observed 9/112 neuromasts co-labelled in both lineages when analysing CNCs with up to 75% labelled neuromasts, and 0/17 when the labelling efficiency was 25% or less. Scalebar is 10 µm.
Figure 5—figure supplement 2
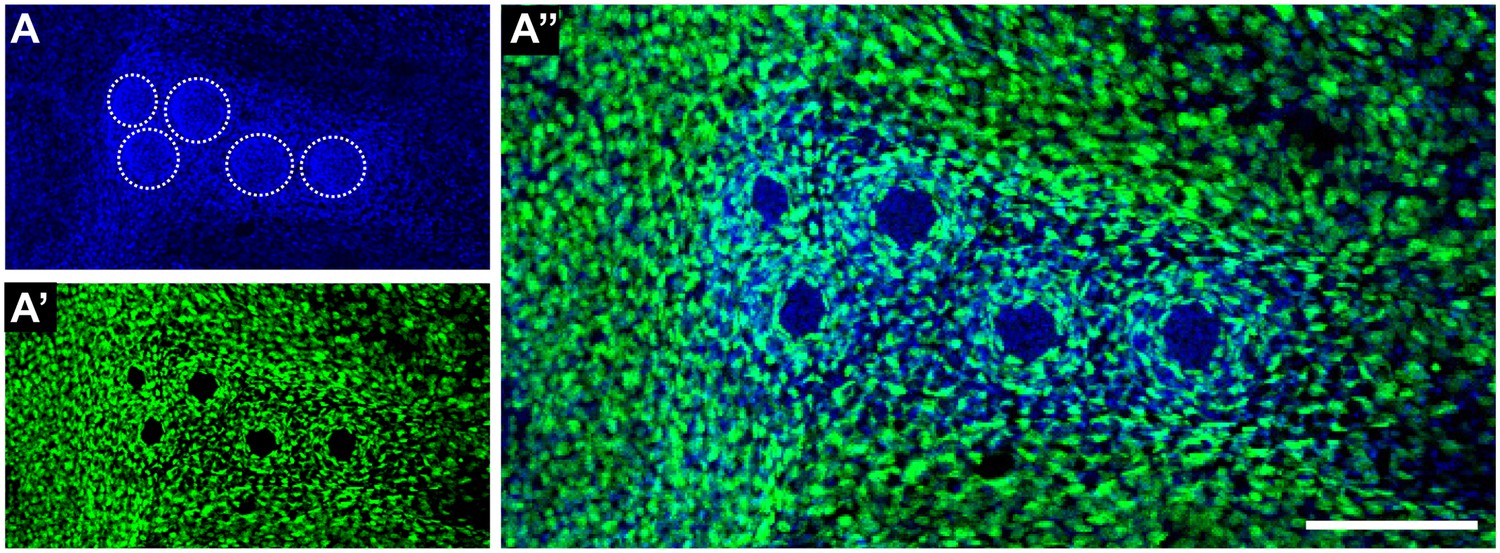
Independent lineages occur even in highly recombined CNCs.
A CNC containing five neuromasts (A) shows massive recombination (A’) due to a strong induction of the double transgenic GaudíRSG GaudíUbiq.iCre. Recombined cells are distributed all over the caudal fin and label nBCs in every neuromast but no cells from the neural lineage, indicating their independent origin. Scalebar is 100 µm.
Figure 6
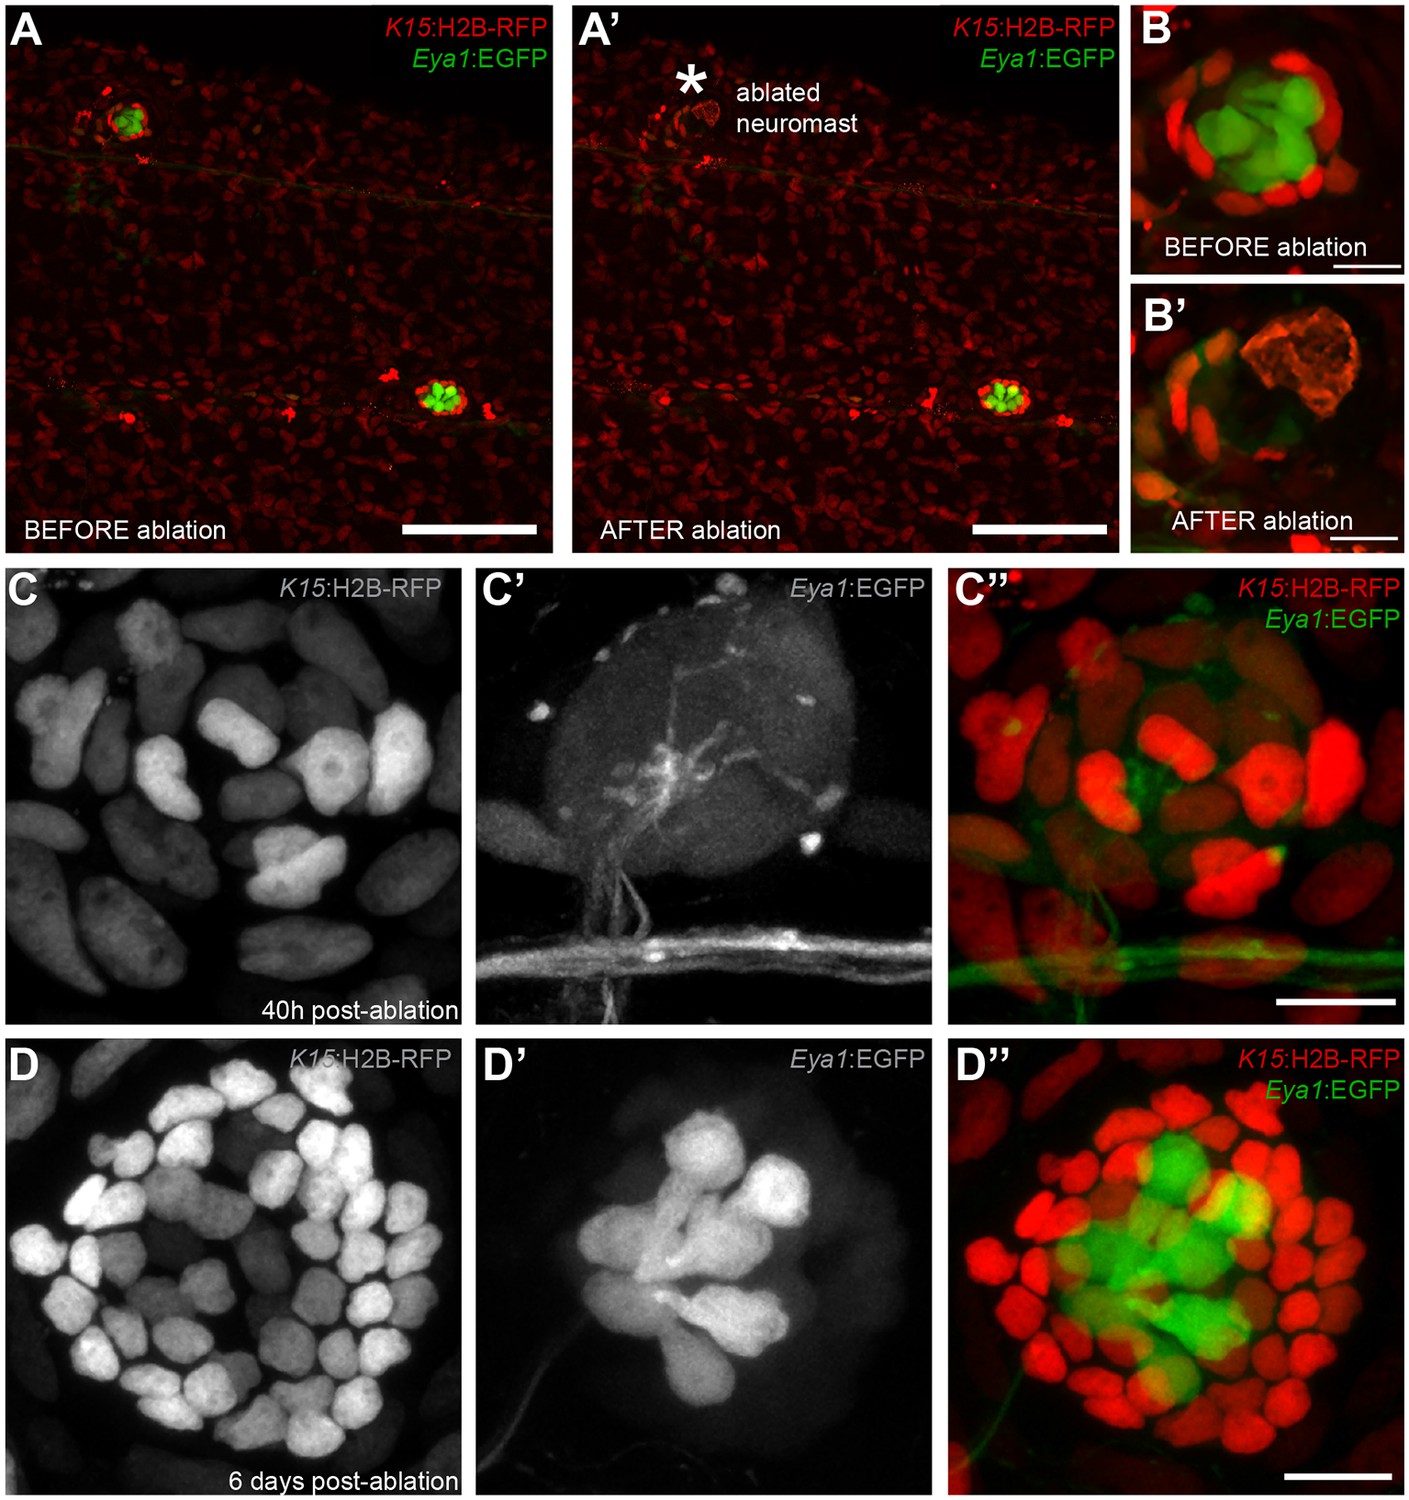
Mantle cells regenerate all cell types within the neural lineage upon severe injury.
Two photon ablation on neuromasts of the double transgenic Tg(K15:H2B-RFP), Tg(Eya1:EGFP) at 12 dpf. (A–B’). Ablations were done to remove most cells in the neuromasts, sparing a few K15+ cells (B’). The same neuromast shown 40 hr post-ablation reveals a small cluster of RFP +cells that have coalesced around the site of injury without any apparent differentiation (C–C’’). Six days post-injury all cell types within the neural lineage have been reconstituted (D–D’’). Mantle and support cells can be observed in K15:H2B-RFP (D, D’’), while hair cells and internal support cells are evident in the Eya1:EGFP (D’, D’’). (N = 18 neuromasts in four larvae for Tg(K15:H2B-RFP), Tg(Eya1:EGFP)), N = 8 neuromasts in four larvae for Tg(K15:H2B-RFP)(neuromK8:H2B-EGFP)) Scalebars are 100 µm for trunks (A, A’) and 10 µm for neuromasts (B–D’’).
Figure 7 with 1 supplement
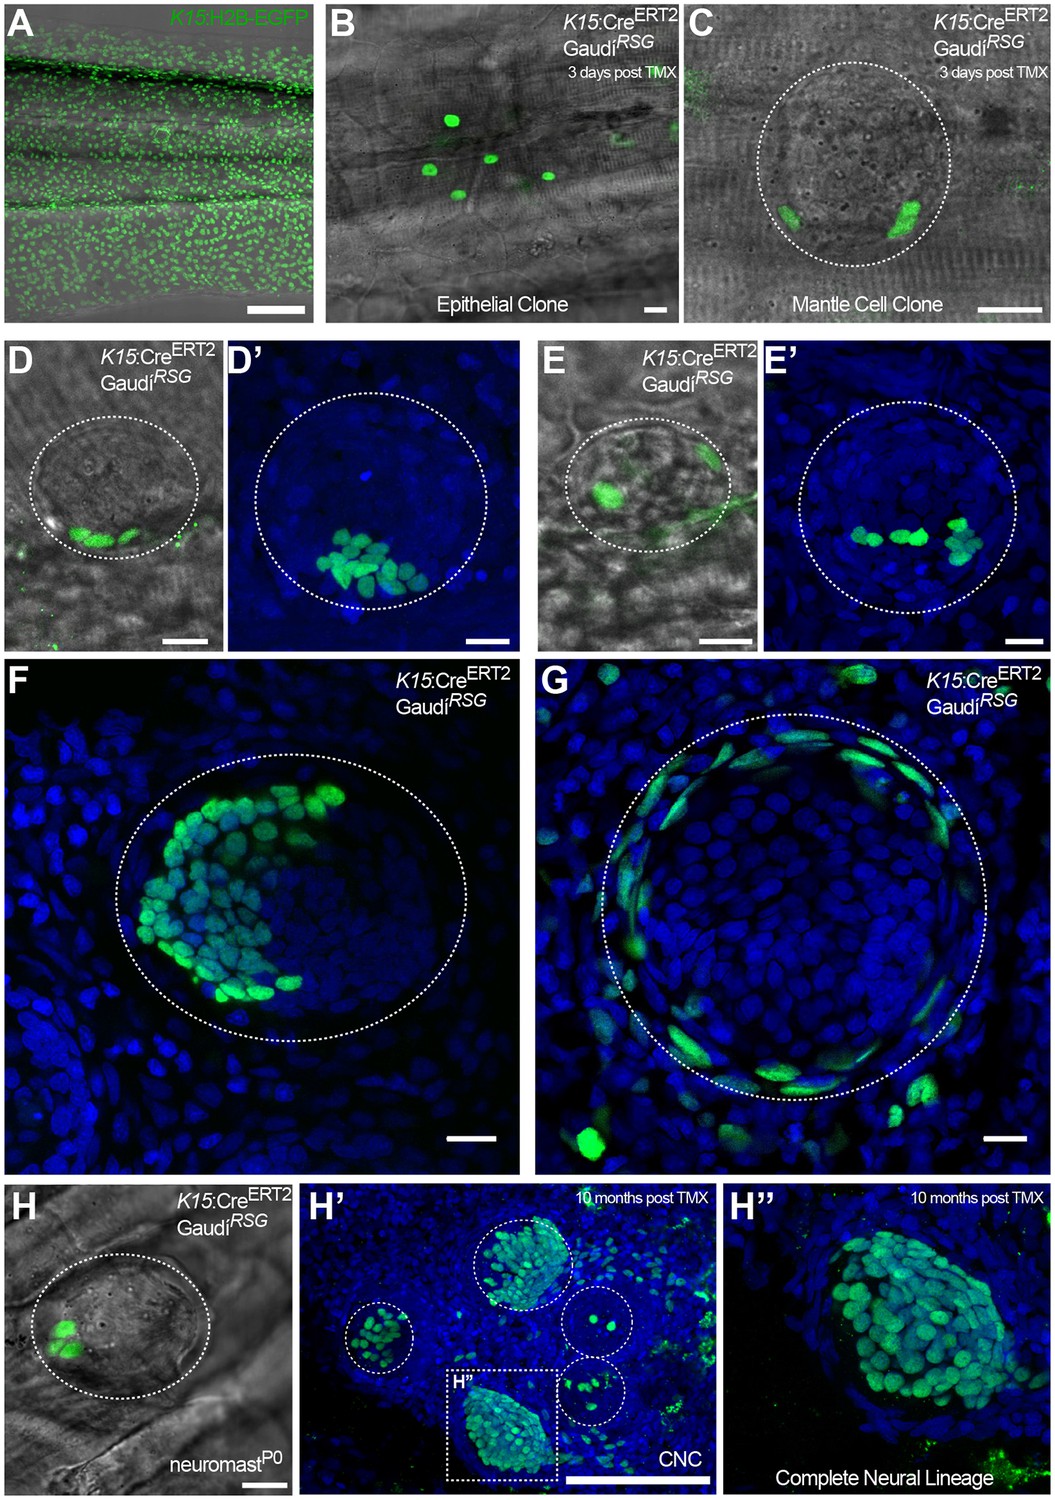
K15+ mantle cells are neuromast neural stem cells.
Tamoxifen induction of K15:CreERT2, GaudíRSG labels a subset of the EGFP+ cells of Tg(K15:H2B-EGFP) in the skin epithelium and the neuromast (Compare A to B, C). A clone of three mantle cells in induced K15:CreERT2, GaudíRSG (D) generates more mantle and also support cells (D’). A second clone of labelled mantle cells (E) expanded into support and differentiated hair cells (E’). Adult neuromast showing K15 derived clones in the neural (F) and in the nBC (G) lineages. A clone of three mantle cells in neuromastP0 (H) contributes to 3 different neuromasts in the adult caudal neuromast cluster (H’) and generate all cell types of the neural lineage (H’’) (N = three neuromast in one fish). Wide scalebars are 100 µm for trunks (A, F’) and thinner scalebars are 10 µm.
Figure 7—figure supplement 1
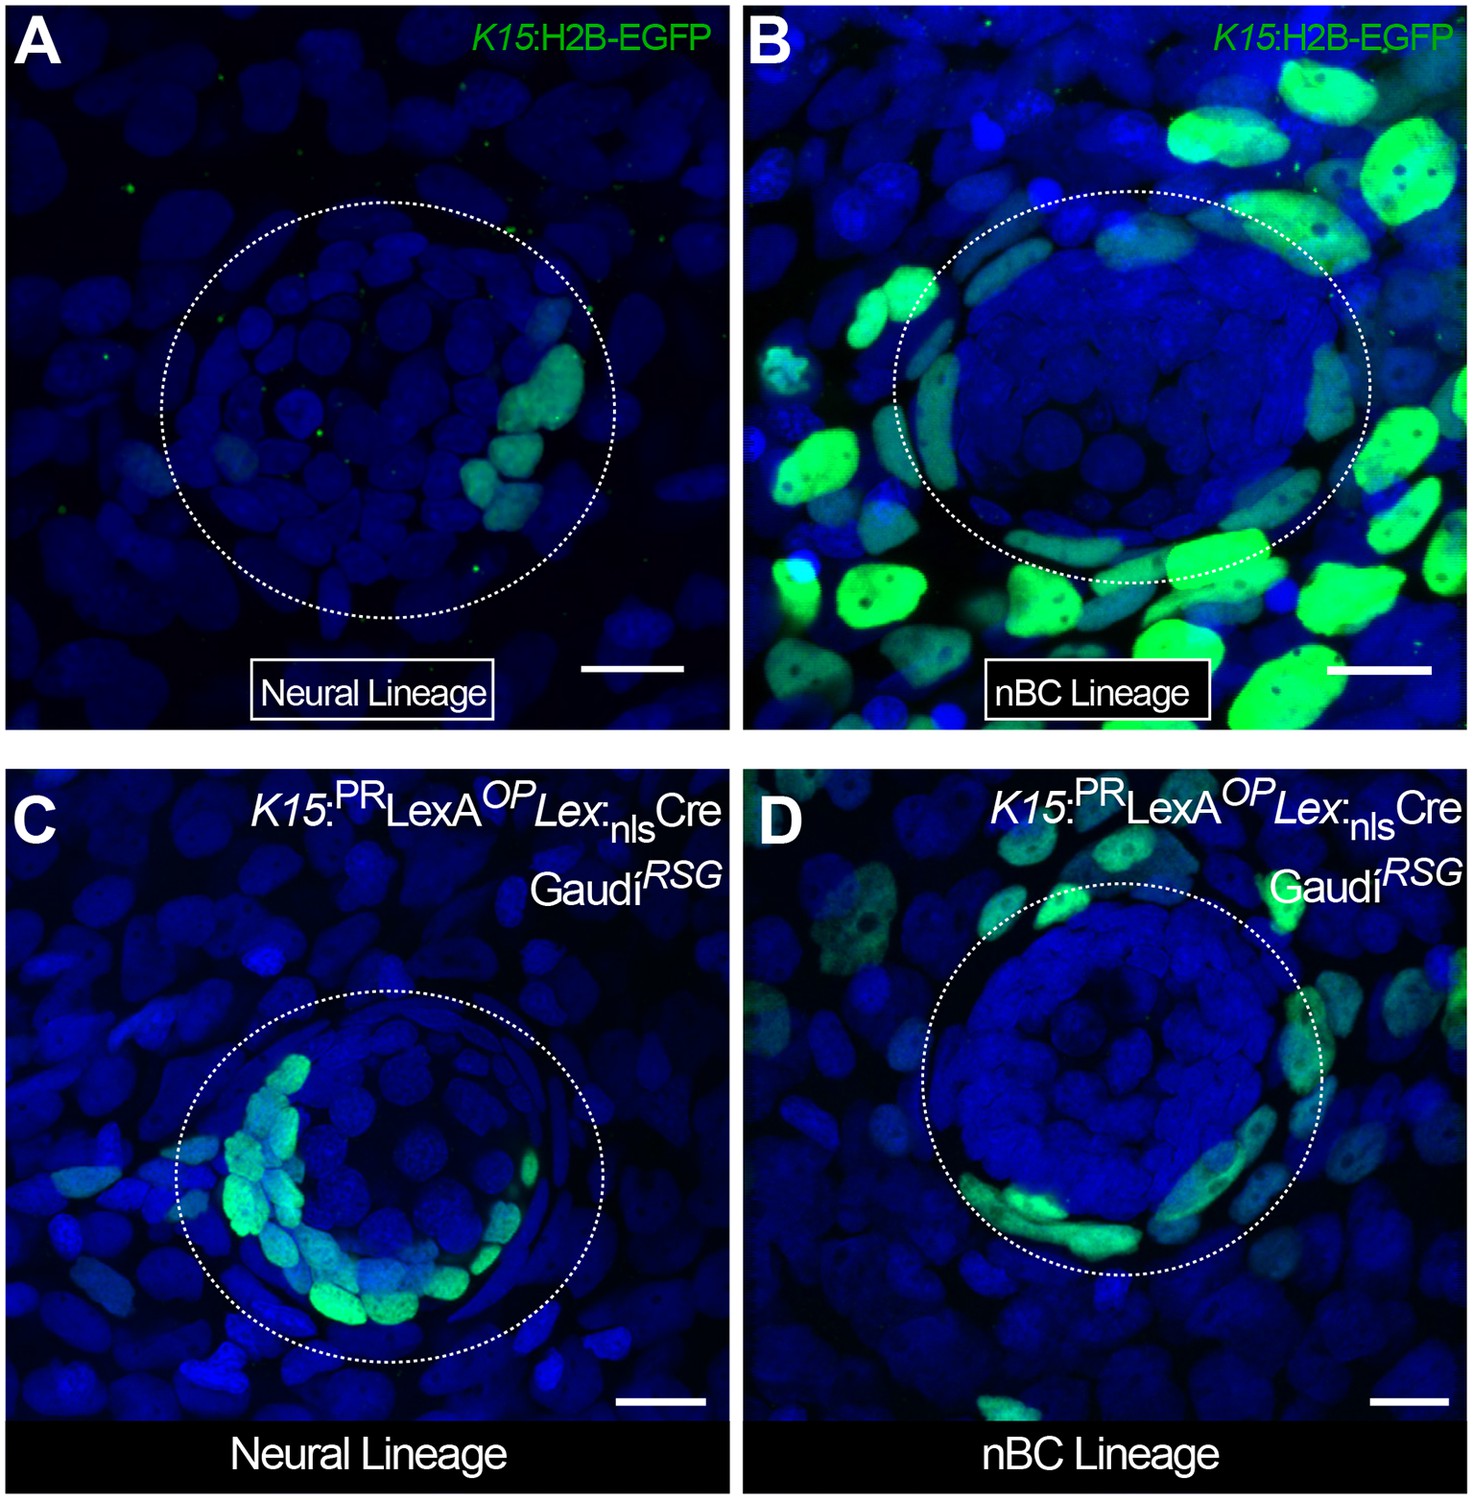
Independent origin of neural and nBC lineages in medaka neuromasts.
Mosaic clones were generated by DNA injection at the 1–2 cell stage, using either K15:H2B-EGFP into wild types (A, B) or K15:LexPR OP:CREnls into GaudiRSG (C, D). Resulting clones labelled either the neural (A, C) (3 clones in 13 neruomasts) or the nBC (B, D) (9 clones in 13 neruomasts) lineage. Clones in the nBC lineage were always continuous with the epithelium (B, D. Scalebar is 10 µm.
Figure 8 with 3 supplements
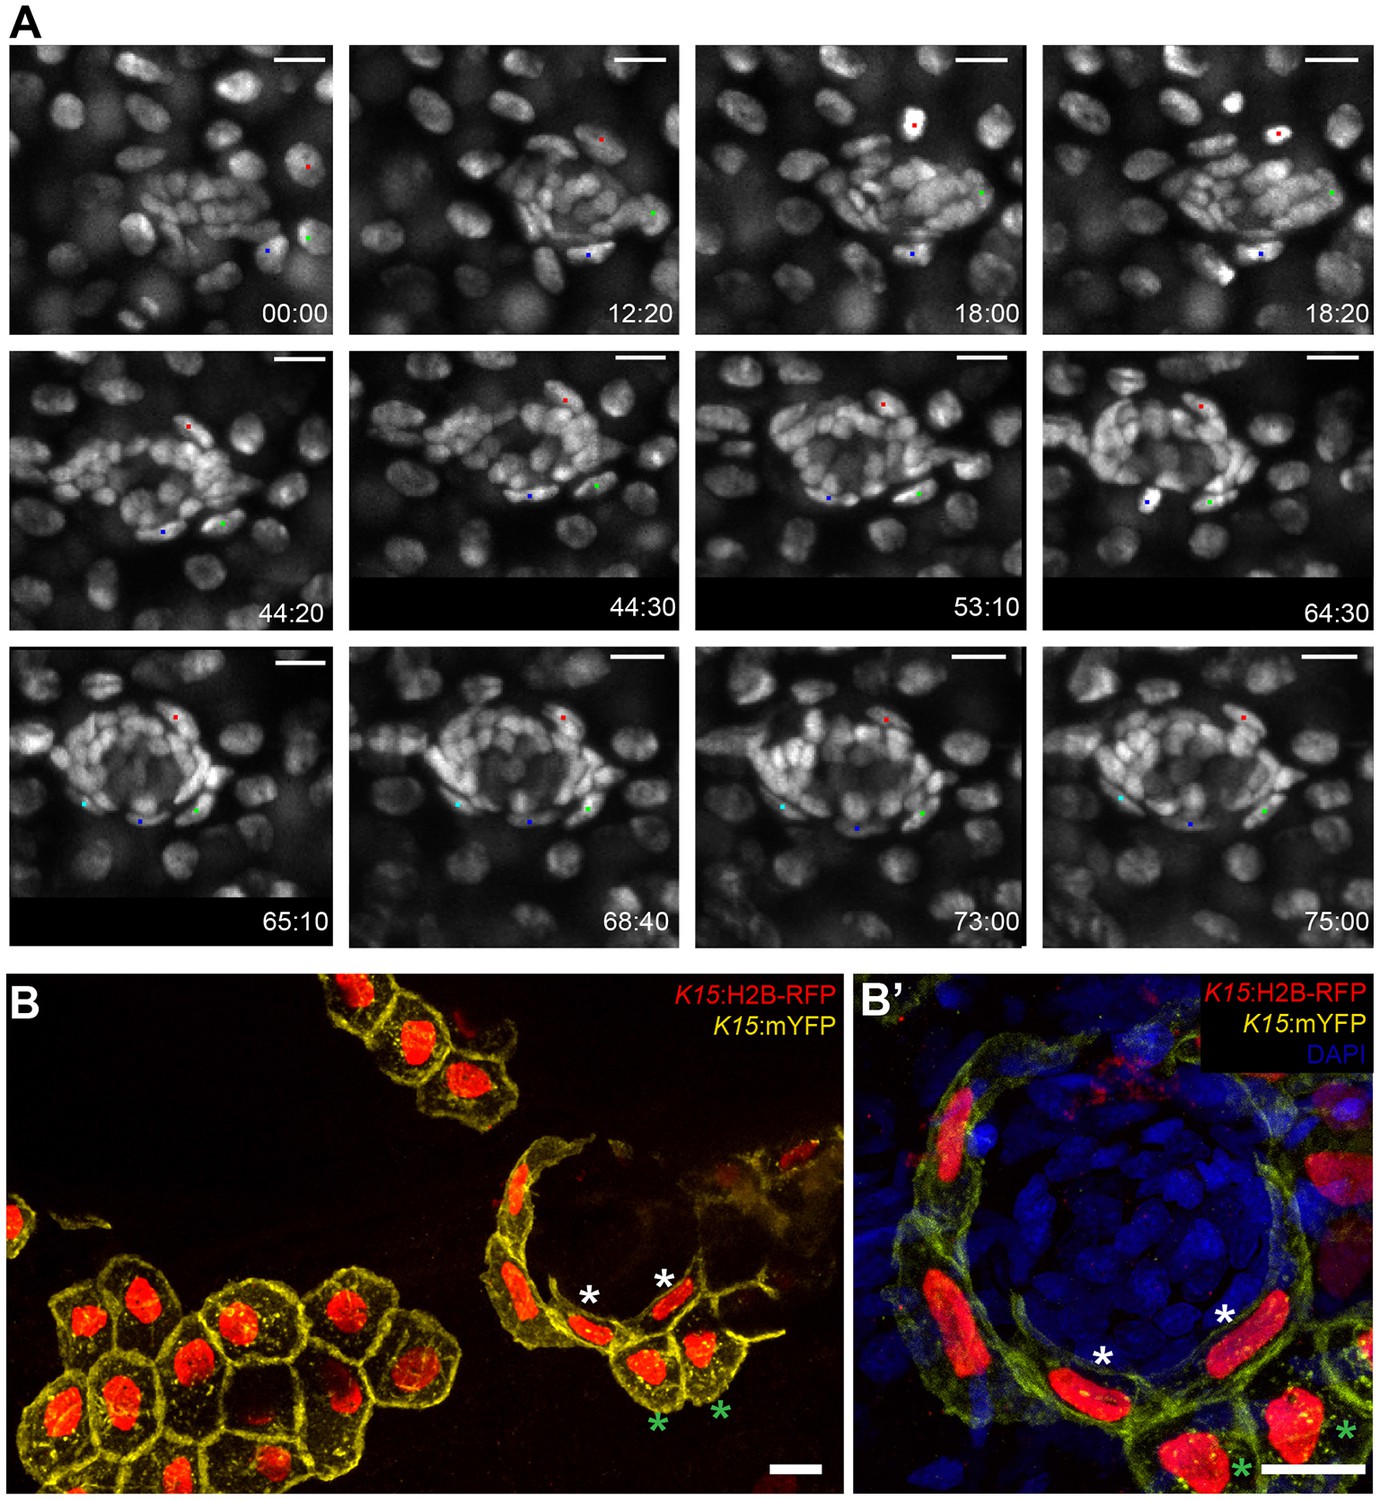
Induction of skin epithelial cells into nBCs during neuromast formation.
(A) Time-lapse imaging of a stage 35 Tg(K15:H2B-EGFP) embryo during secondary organ formation, where three epithelial cells (blue, green and red dots) dynamically associate with the arriving neural stem cells precursors. The red cell divides (18:00 hr to 18:20 hr) to generate one skin epithelial daughter and another daughter that will become a nBC (64:00 hr to 75:00 hr). The green cell transitions into a nBC without dividing, and the blue cell first becomes a nBC (18:20 hr to 43:00 hr) and then divides to generate two nBCs (64:30 hr to 65:10 hr) that stay in the neuromast. The images in (A) are selected time-points from three consecutive movies (see Videos 2–4) of the same developing neuromast (five ventral neuromasts and four midline neuromasts in the pLL and two neuromasts in the aLL, N = 5 embryos). (B–B’) Immunostaining of a double injected (mosaic) K15:mYFP, K15:H2B-RFP embryo shows that nBC induction involves a drastic remodelling of both nuclear and cellular morphologies (B) (N=12 neuromasts in six larvae). Compare skin epithelial cells (green asterisks in B, B’) with their sibling nBCs (white asterisks in B,B’) included in the neuromast. Scalebars are 10 µm.
Figure 8—figure supplement 1
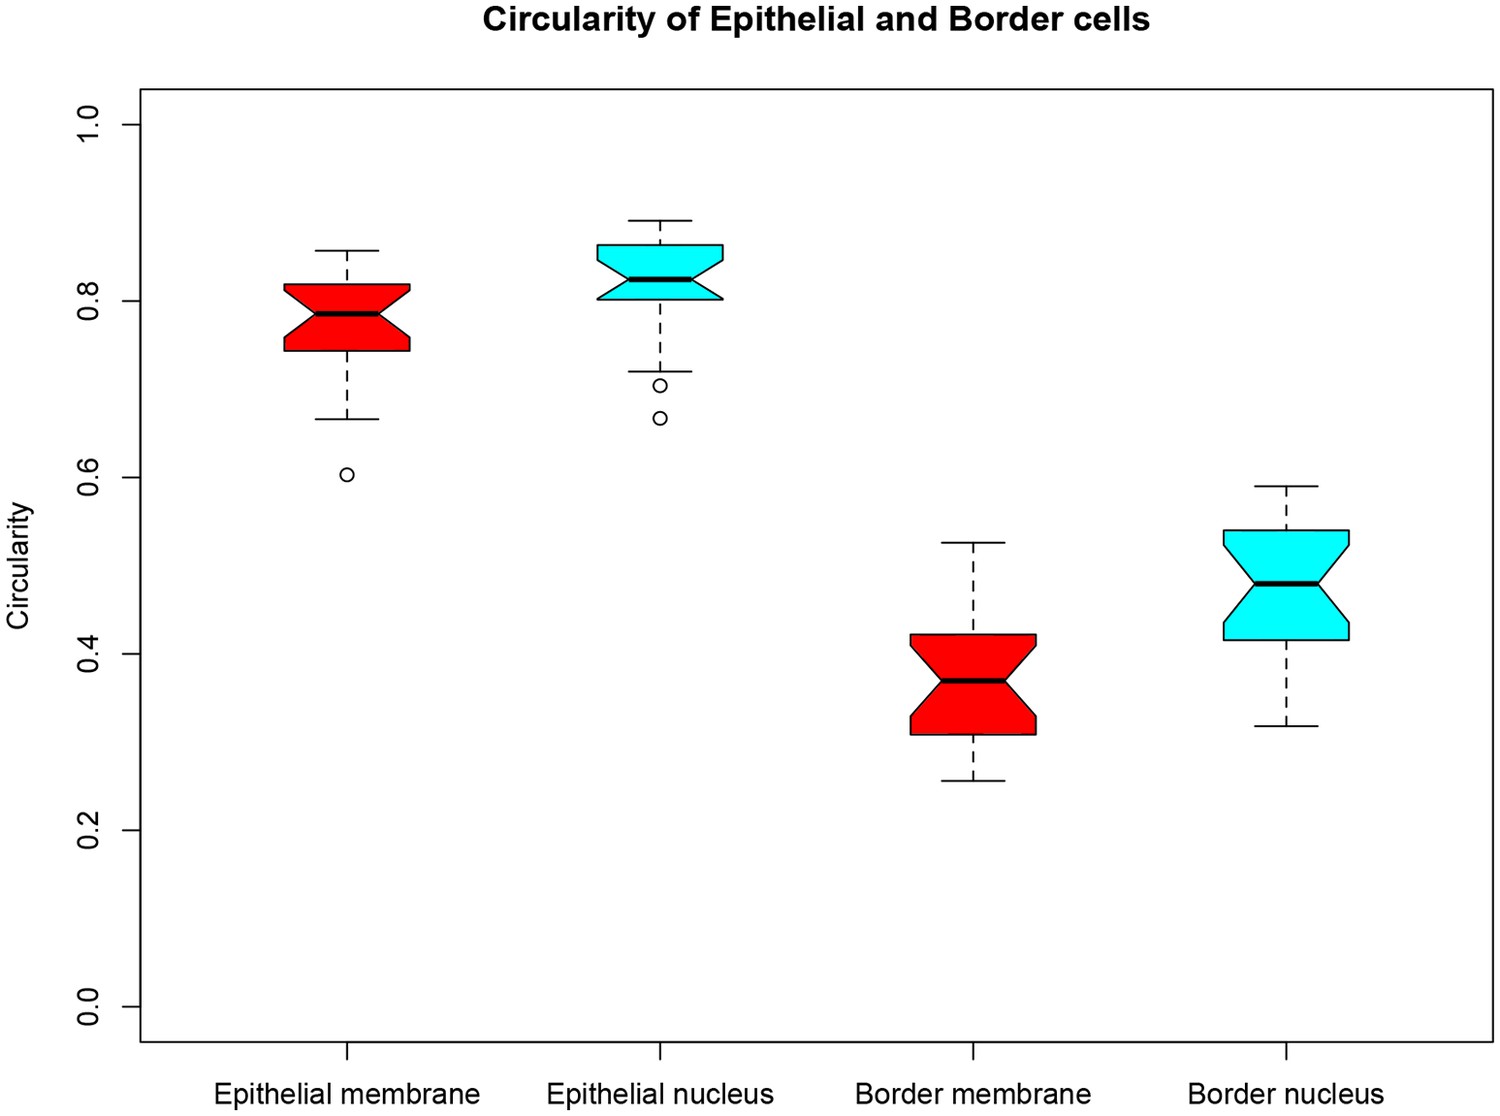
Changes in shape of cell nuclei correlate with changes in cell morphology.
A circularity index was used to quantify changes in cell morpholgy and compared to that of nuclei. Cells in the skin epithelium display a more rounded morphology with more rounded nuclei than transformed nBCs. Circularity index for 20 epithelial cell membranes and nuclei were compared to 20 nBC membranes and nuclei.
Figure 8—figure supplement 2
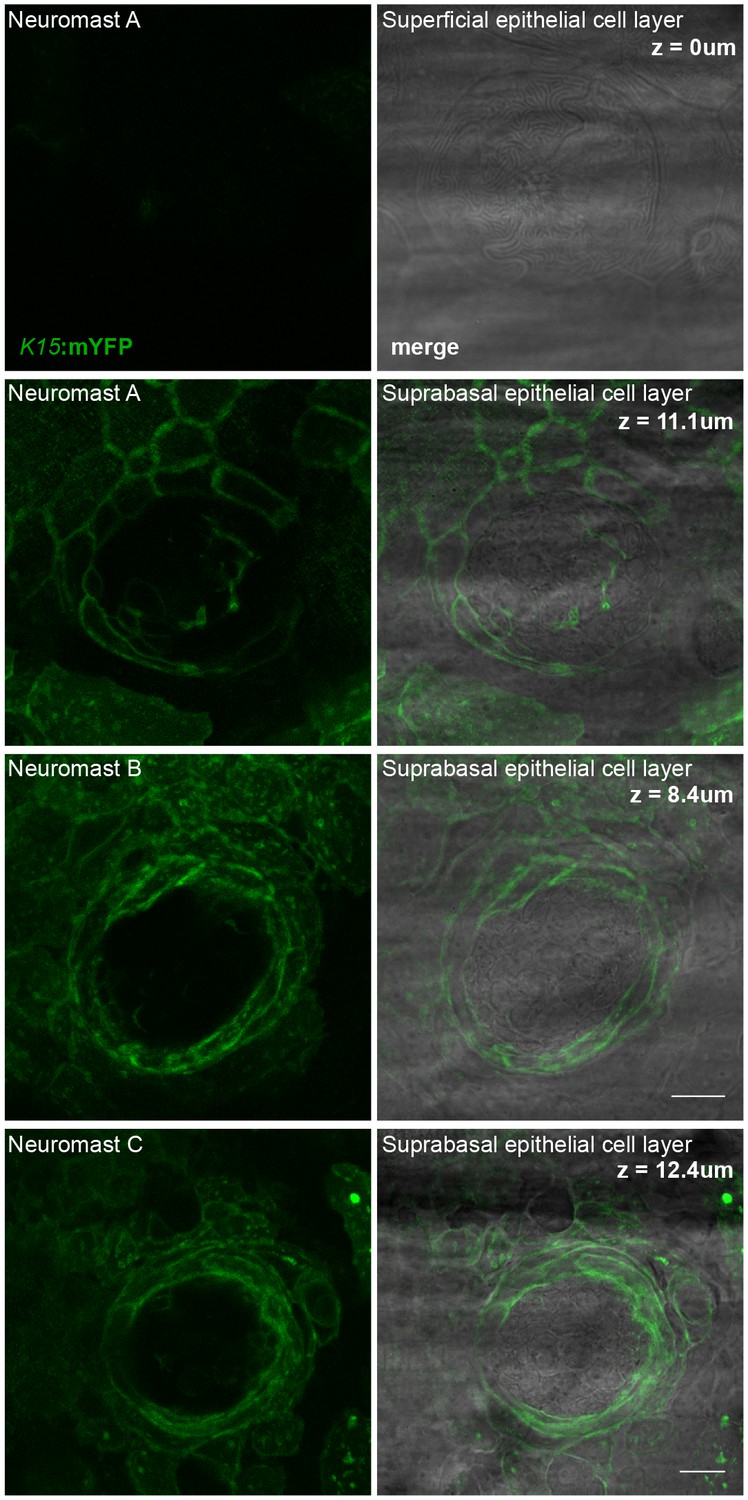
nBCs are continious with the suprabasal skin epithelium.
(A) Bright-field and flouresence microscopy of a mature neuromast of a stage 39 (K15::mYFP) mosaic fish reveals that nBCs are continous with the suprabasal epithelial layer and not with the outer-most surface epithelial layer. Left panels show K15::mYFP expression and right panels show merge with brightfield at different depths (z-position). At z = 0 µm there is no flouresence in the outer-most skin layer, as the depth increases we begin to see nBCs continious with the second layer of the epithelium. Neuromasts B and C show the same continuation between nBCs and the suprabasal skin epithelium. (N = 6 clones in five larvae.) Scalebars = 10 µm.
Figure 8—figure supplement 3
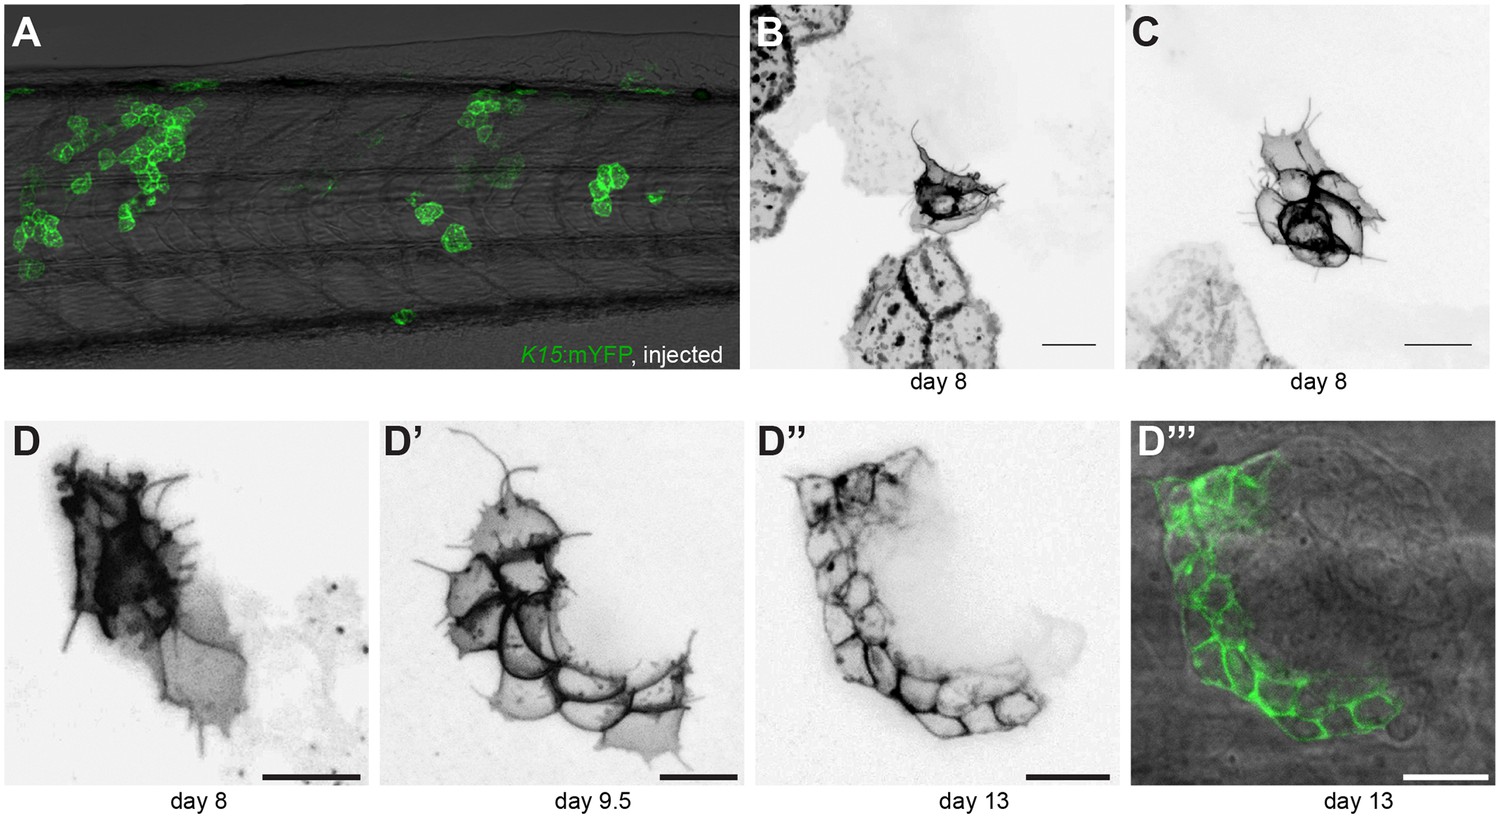
Cytoplasmic protrusions from neural stem cell precursors during organ formation
(A) Injection of K15::mYFP at the 2 cell stage results in disparate clones in the suprabasal skin epithelium and lateral line, as shown for a stage 39 mosaic fish. (B–C) Close-ups on mosaic clones of K15:mYFP showing labelling in both suprabasal epithelial cells and precursors of neural stem cells. Cytoplasmic protrusions can be clearly seen emanating from the precursors of neural stem cells during organ formation. (D–D’’’) Temporal progression of the same neural stem cell clone labelled with K15:mYFP during organ formation shows that these cytoplasmic protrusions are dynamic and continue throughout organogenesis but are lost in mature organs (D’’–D’’’). (N = 8 clones in five larvae). Scalebars = 10 µm.
Figure 9
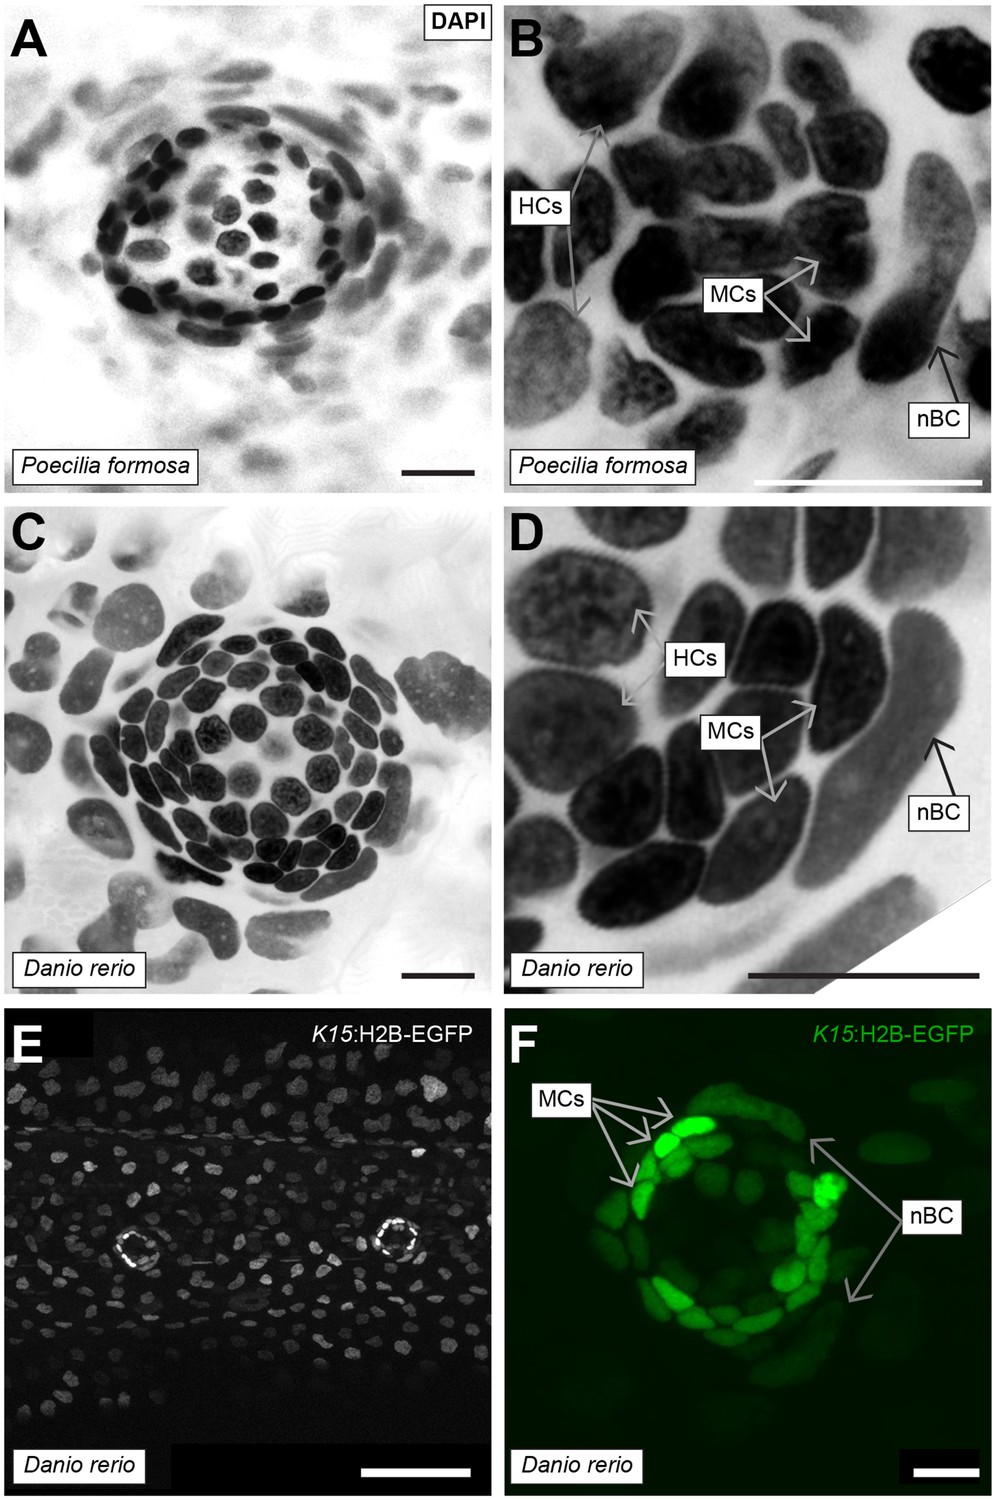
Conservation of nBCs in neuromasts of other teleost fish.
(A) DAPI-stained neuromast Peocilia formosa, a close relative of medaka, reveals the presence of nBCs as assessed by their distinct morphology and relative location (N = 10 neuromasts in a single 1 month old fish). (B) Close-up on a Peocilia formosa neuromast reveals that nBCs are immediately adjacent to mantle cells (N = 10 border cells in four neuromasts). (C) DAPI-stained neuromast of Danio rerio, a distant relative of medaka, reveals the presence of nBCs as assessed by their distinct morphology and location (N=>5 neuromasts in three larvae). (D) Close-up of a zebrafish neuromast reveals that nBCs intimately associate with mantle cells (N=>5 neuromasts in three larvae). (E) Tg(ol.K15::H2B-eGFP) shows labelling of the skin epithelium and mantle cells in a 5 dph zebrafish larvae. (F) Close-up of a Tg(ol.K15::H2B-eGFP) zebrafish neuromast shows labelling of cells within the neural lineage and nBCs (N= 5 neuromasts in three larvae). Scalebars = 10 µm, except in panel E, Scalebar = 100 µm.
Figure 10
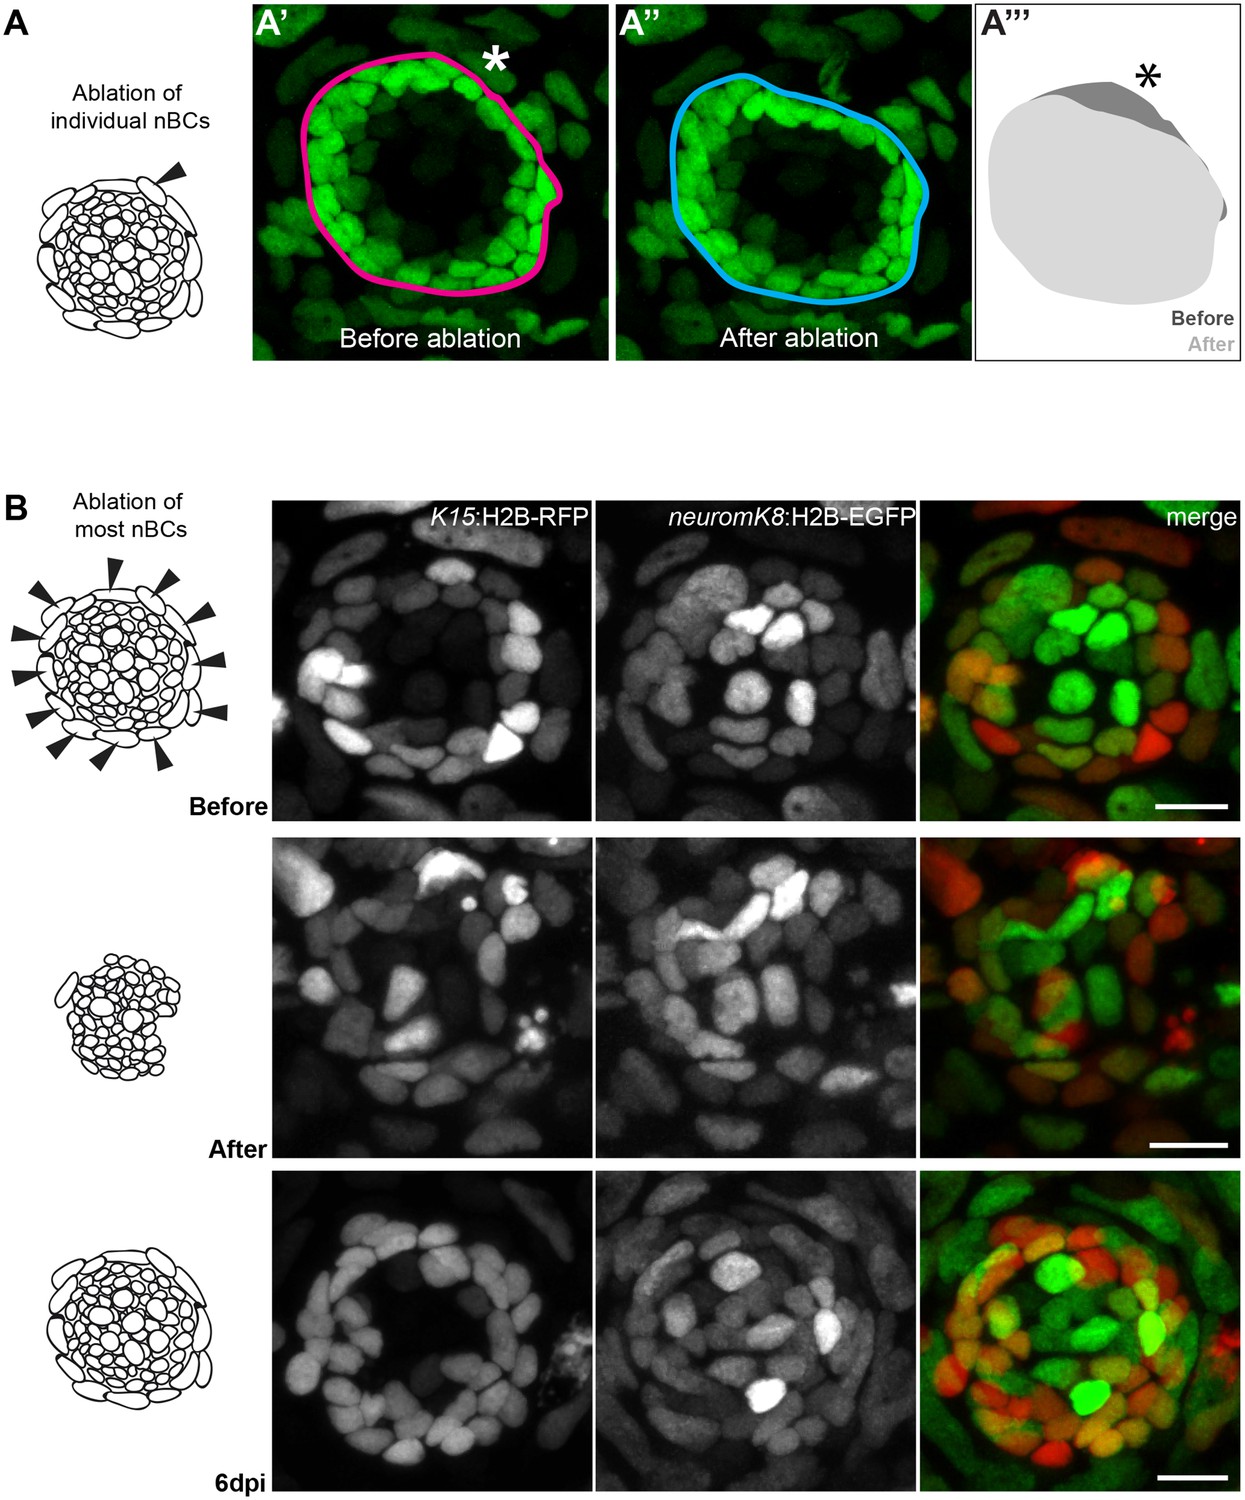
Ablation of nBCs disrupts organ architecture.
(A–A’’’) Ablation of single nBCs in mature neuromasts (stage 39) of Tg(K15:H2B-EGFP) results in a local disruption of the organ architecture near the injury site. Mantle cells retract inwards towards the center of the neuromas resulting in a shape change of the organ (A’’’) (N = 10 neuromasts in seven larvae.) (B) Ablation of most nBCs in an immature neuromast of a stage 36 double Tg(K15::H2B-RFP) (neuromK8:H2B-EGFP) results in a severe disruption of organ architecture. Iterative imaging reveals that new nBCs appear by 6 days post injury and organ architecture is re-established (N = 8 neuromasts in four fish). Scalebars = 10 µm.
Figure 11 with 1 supplement
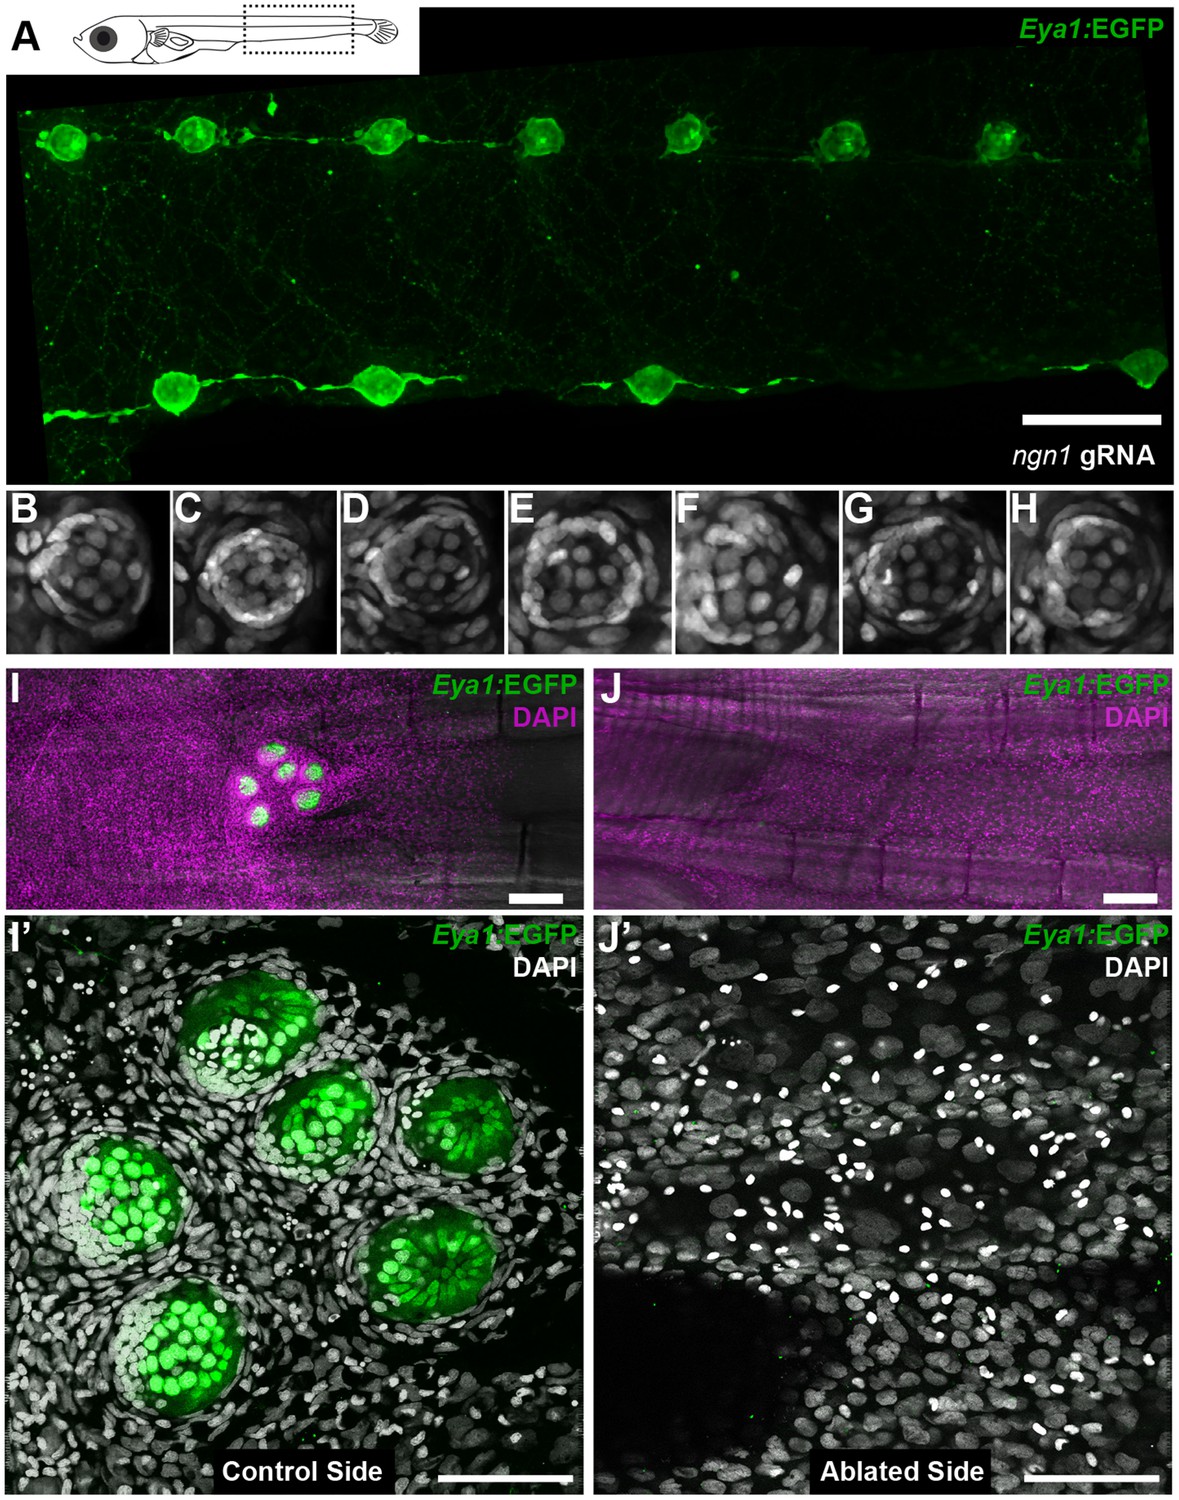
Arrival of neural neuromast cells is necessary and sufficient to convert epithelial cells into nBCs.
(A) Anti-GFP staining of a Tg(Eya1:EGFP) embryo at stage 42 that was injected with CAS9 mRNA and ngn1 gRNAs reveals the formation of ectopic pLL midline neuromasts (N = 58 pLL neuromasts in two larvae). (B–H) DAPI images of seven consecutive midline neuromasts show that all of them contain nBCs. (I–J’) Absence of neural lineage prevents the induction of the skin epithelium. While each neuromast of a control CNC (I) contains nBCs (I’), early ablation of neural lineage in neuromastP0 results in no CNC (J) and no skin epithelium induction (J’) (n = 4 CNCs of 4 fish). Wide scalebars are 100 µm (A, I) and thinner scalebars are 50 µm (I’, J’).
Figure 11—figure supplement 1
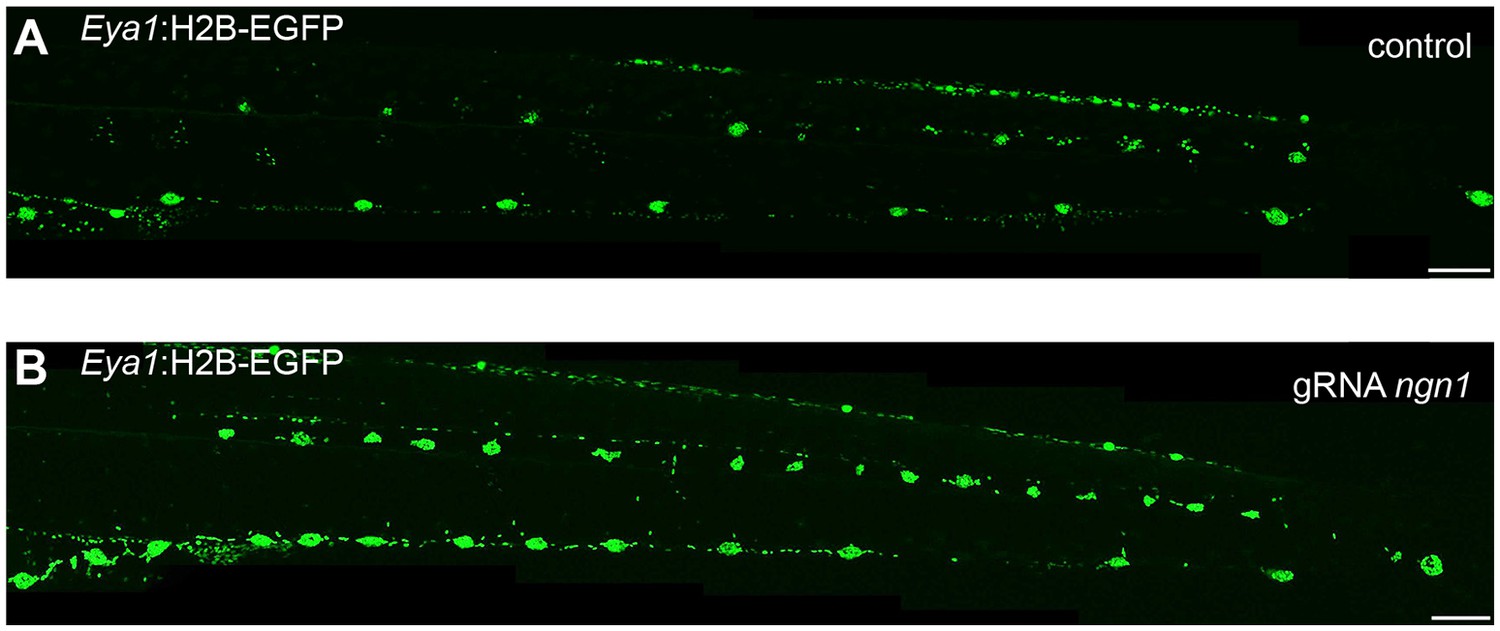
Increased number of neuromasts in ngn1 gRNA injected medaka.
(A) A control stage 39 Tg(Eya1:H2B-eGFP) shows normal disribution of pLL neuromasts. (B) A stage 39 Tg(Eya1:H2B-EGFP) injected with Cas9 mRNA and two gRNAs against ngn1 shows a massive increase in pLL neuromast numbers as compared to the control. Scalebars = 100 µm.
Videos
Video 1
3D reconstruction of cell types of mature neuromasts.
Location and orientation of cells within the neural lineage of a mature neuromast organ in the triple transgenic line Tg(K15:mYFP) (K15:H2BRFP)(Eya1:GFP) in a stage 42 medaka embryo. Six neuromast hair cells (green bundles) labelled with Eya1:GFP are projecting outwards into the environment, they are surrounded by an outer ring of mantle cells (red) labelled with K15:H2B-RFP. Mantle cells bodies encapsulate the hair cell bundles in a cupula-like structure (green membranes) labelled with K15:mYFP (N = 6 neuromasts in two larvae).
Video 2
Induction of epithelial cells into nBCs (1).
Time-lapse SpiM imaging of a stage 33–35 Tg(K15:H2B-EGFP) embryo during secondary organ formation reveals the developmental origin of nBCs. Coalesced neural stem cell precursors (rosettes) from the posterior lateral line primordium are migrating to their final position. As they do they come into contact with the overlying skin epithelial cells (red, blue and green dots) and a tight association between both cell types signals the beginning of the induction of epithelial cells into nBCs. The length of the movie is 44 hr and 20 min. Stacks were taken every 20 min. Scale bar = 10 µm. Imaging was performed at room temperature.
Video 3
Induction of epithelial cells into nBCs (2).
The same developing secondary neuromast from Video 2 is followed after a 10 min pause to exchange the medium. Epithelial cells (red, blue and green dots) in contact with the neural stem cell precursors start undergoing a significant change in their nuclear morphology and adopt a more elongated nuclear shape. These epithelial cells are transitioning into nBCs. Epithelial cells that divide during this process (blue dot) produce two cells with an elongated nuclear shape. The length of the movie is 24 hr. Stacks were taken every 20 min. Scale bar = 10 µm.
Video 4
Induction of epithelial cells into nBCs (3).
The same developing secondary neuromast from Video 3 is followed after a 10 min pause to exchange the medium. nBCs form the outer lineage of the neuromast organ (red, light and dark blue and green dots) surround the differentiating neural lineage cells. The characteristic elongated nuclear shape of nBCs is a stable feature and the transformation event seems to be complete. The length of the movie is 6 hr and 40 min. Stacks were taken every 20 min. Scale bar = 10 µm.
Video 5
3D reconstruction of a membrane labelled nBC clone.
A 3D projection of a mosaic larvae injected with (K15:mYFP). A clone of nBC is continuous with the suprabasal epithelial cell layer (N = 8 clones in five larvae).
Video 6
Induction of epithelial cells into nBCs in zebrafish.
A double Tg(ol.K15::H2B-eGFP)(cxcr4b::Cxcr4b-GFP) 24hpf embryo shows label in the skin epithelium (nuclear GFP) and the migrating primordium (membrane GFP). As the primordium deposits cells from its trailing end they dynamically associate with the overlying skin epithelium. A transformation of nuclear shape then occurs to produce a nBC cell (blue dot). Soon after deposition presumptive mantle cells start expressing K15 and the neuromast progressively loses its cxcr4b fluorescent signal (N = 4 neuromasts in two embryos). Time in hours. Scale bar = 10 µm.
Video 7
Local architectural changes upon ablation of a single nBC.
Before and after the ablation of an individual nBC in a Tg(K15:H2B-EGFP) neuromast. Mantle cells directly adjacent to the ablated nBC retract inwards. The organ architecture is locally disrupted producing an organ with a notch-shape (N = 10 neuromasts in seven larvae.) Scale bar = 10 µm.
Download links
A two-part list of links to download the article, or parts of the article, in various formats.
Downloads (link to download the article as PDF)
Open citations (links to open the citations from this article in various online reference manager services)
Cite this article (links to download the citations from this article in formats compatible with various reference manager tools)
Neural stem cells induce the formation of their physical niche during organogenesis
eLife 6:e29173.
https://doi.org/10.7554/eLife.29173


