Quantifying the contribution of Plasmodium falciparum malaria to febrile illness amongst African children
- University of Oxford, United Kingdom
- Imperial College London, United Kingdom
Figures
Figure 1 with 1 supplement
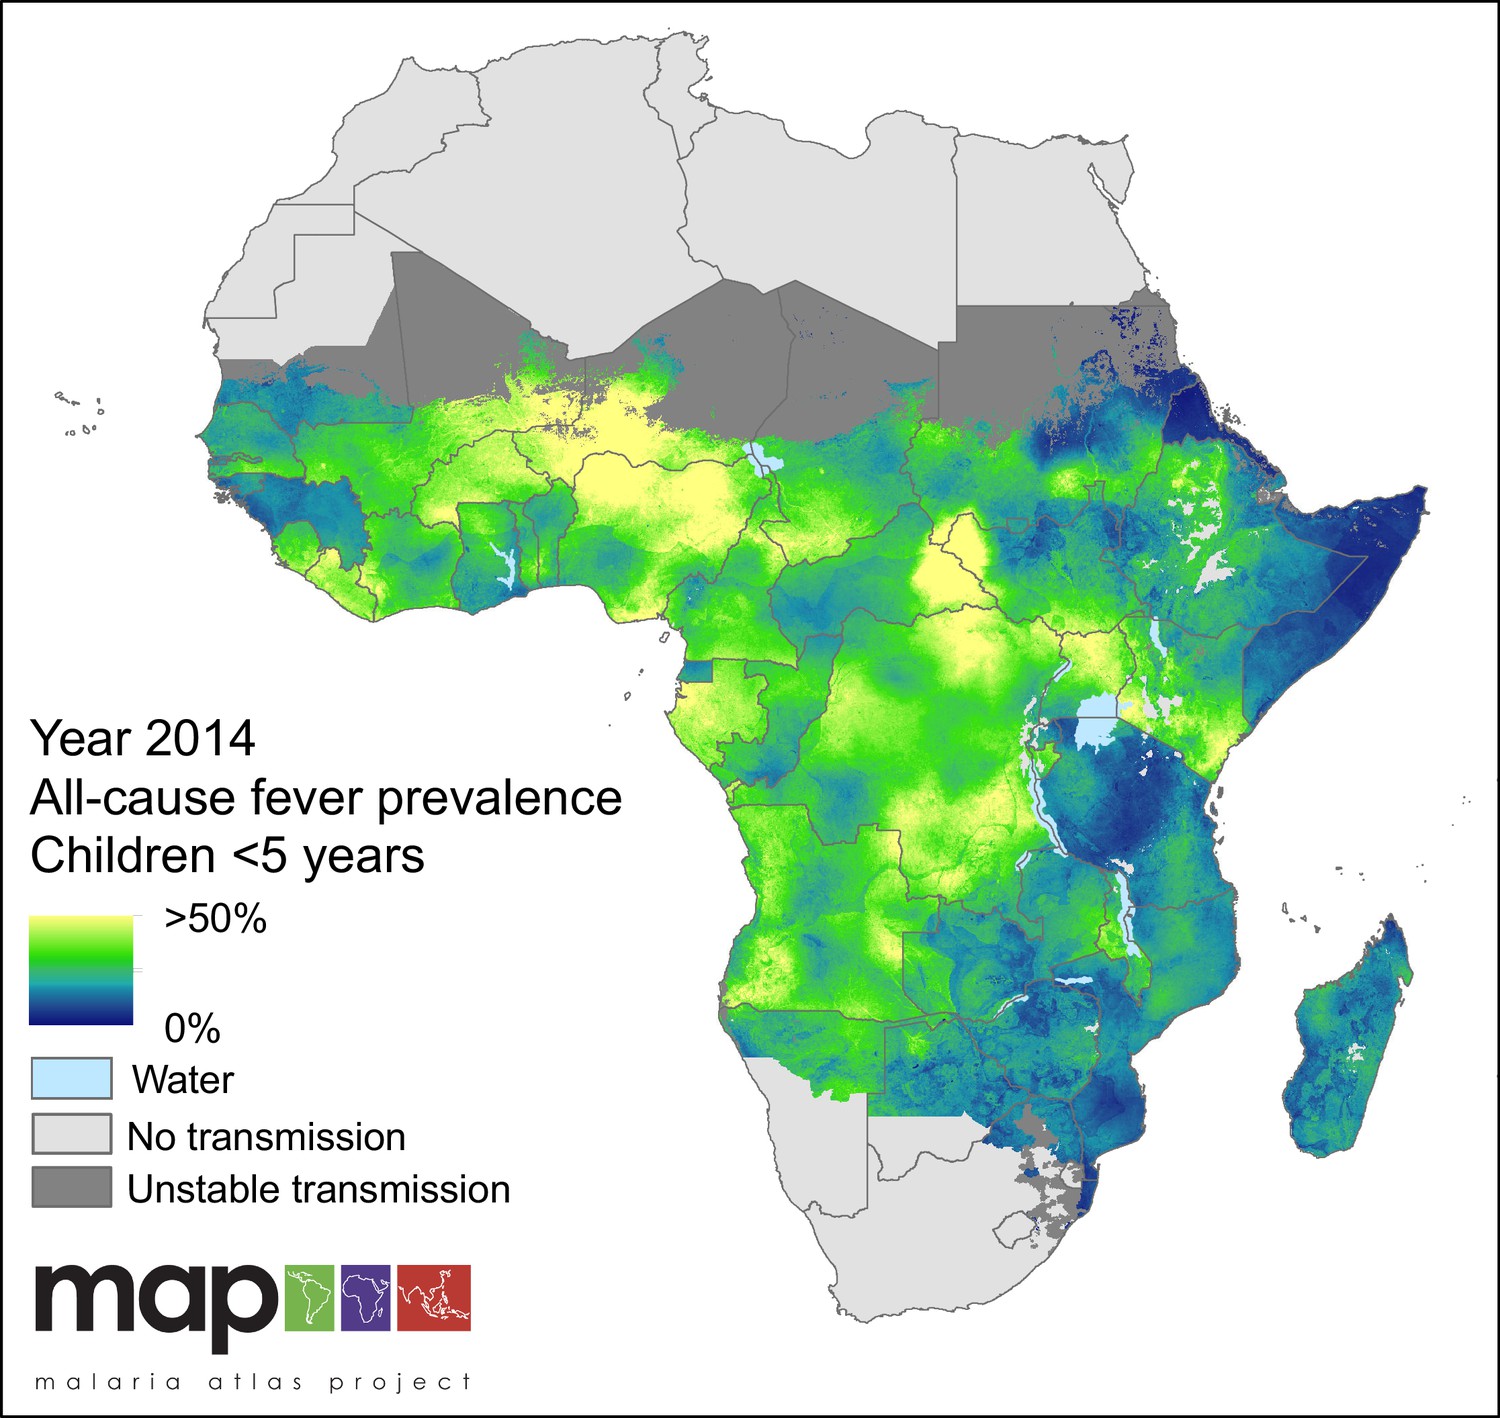
Predicted all-cause fever prevalence within limits of stable P. falciparum transmission in children under 5 years of age in 2014.
https://doi.org/10.7554/eLife.29198.002
Figure 1—figure supplement 1
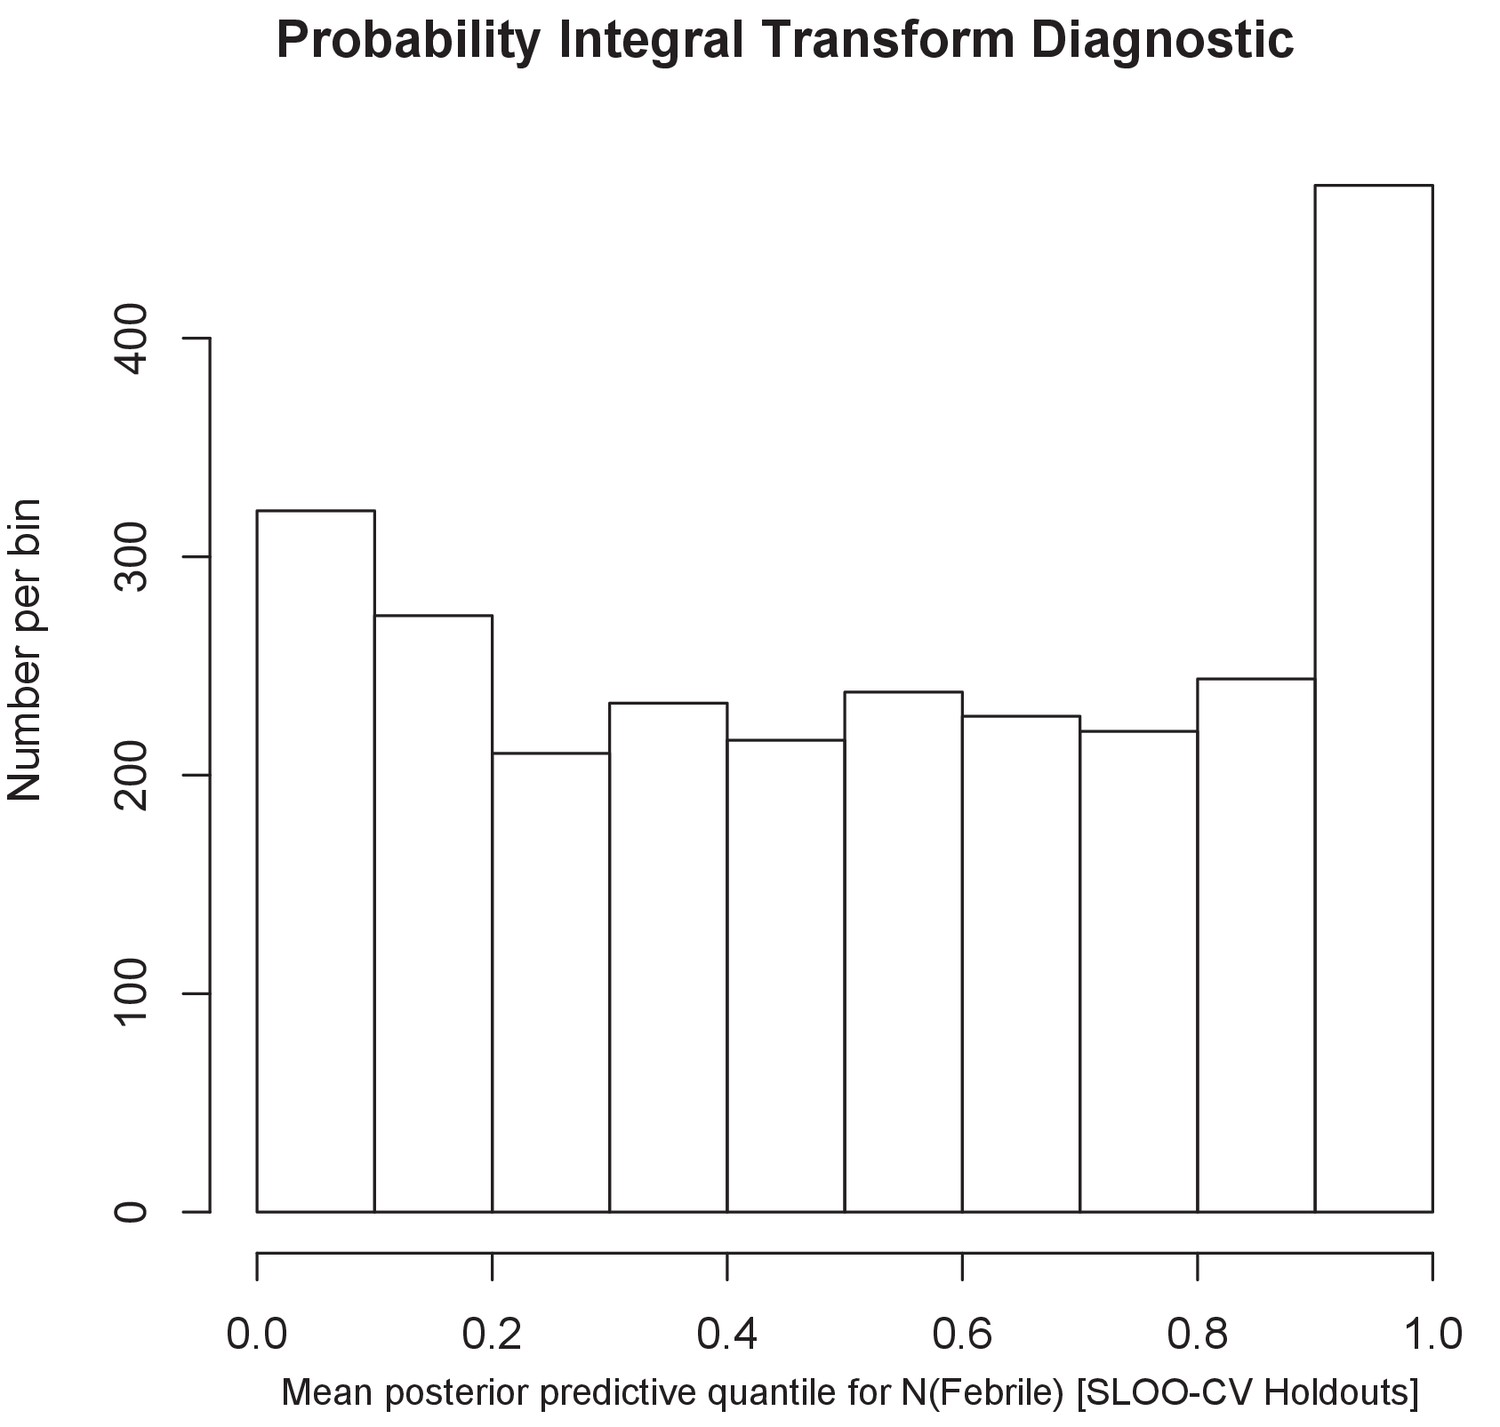
The histogram of the probability integral transform diagnostic.
The uniform shape of the histogram shows that predictions at sites held out from the initial model drawn from the predicted posterior distribution for the prevalence of febrile illness matched well.
Figure 2
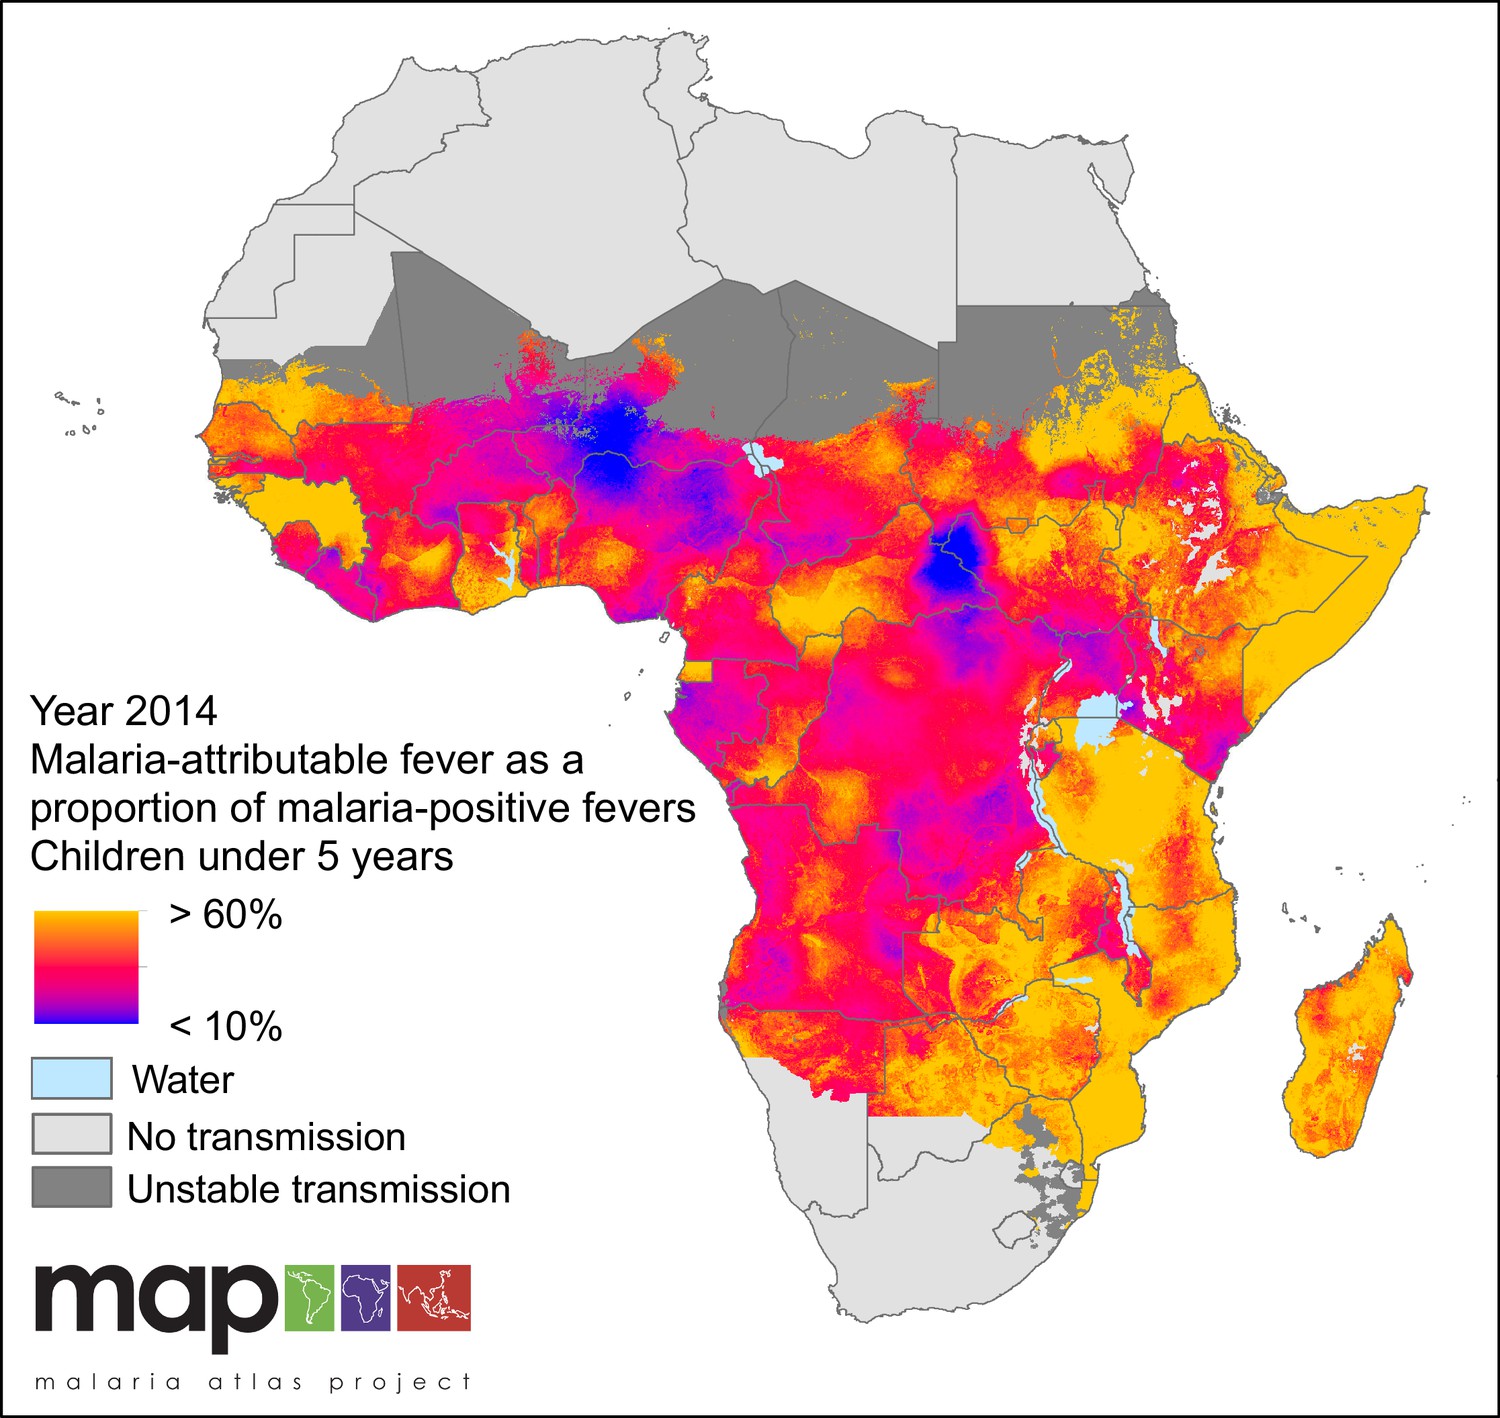
Predicted malaria-attributable fevers as a proportion of malaria-positive fevers (children under 5 years of age, 2014).
Predictions are shown within the limits of stable P. falciparum transmission.
Figure 3
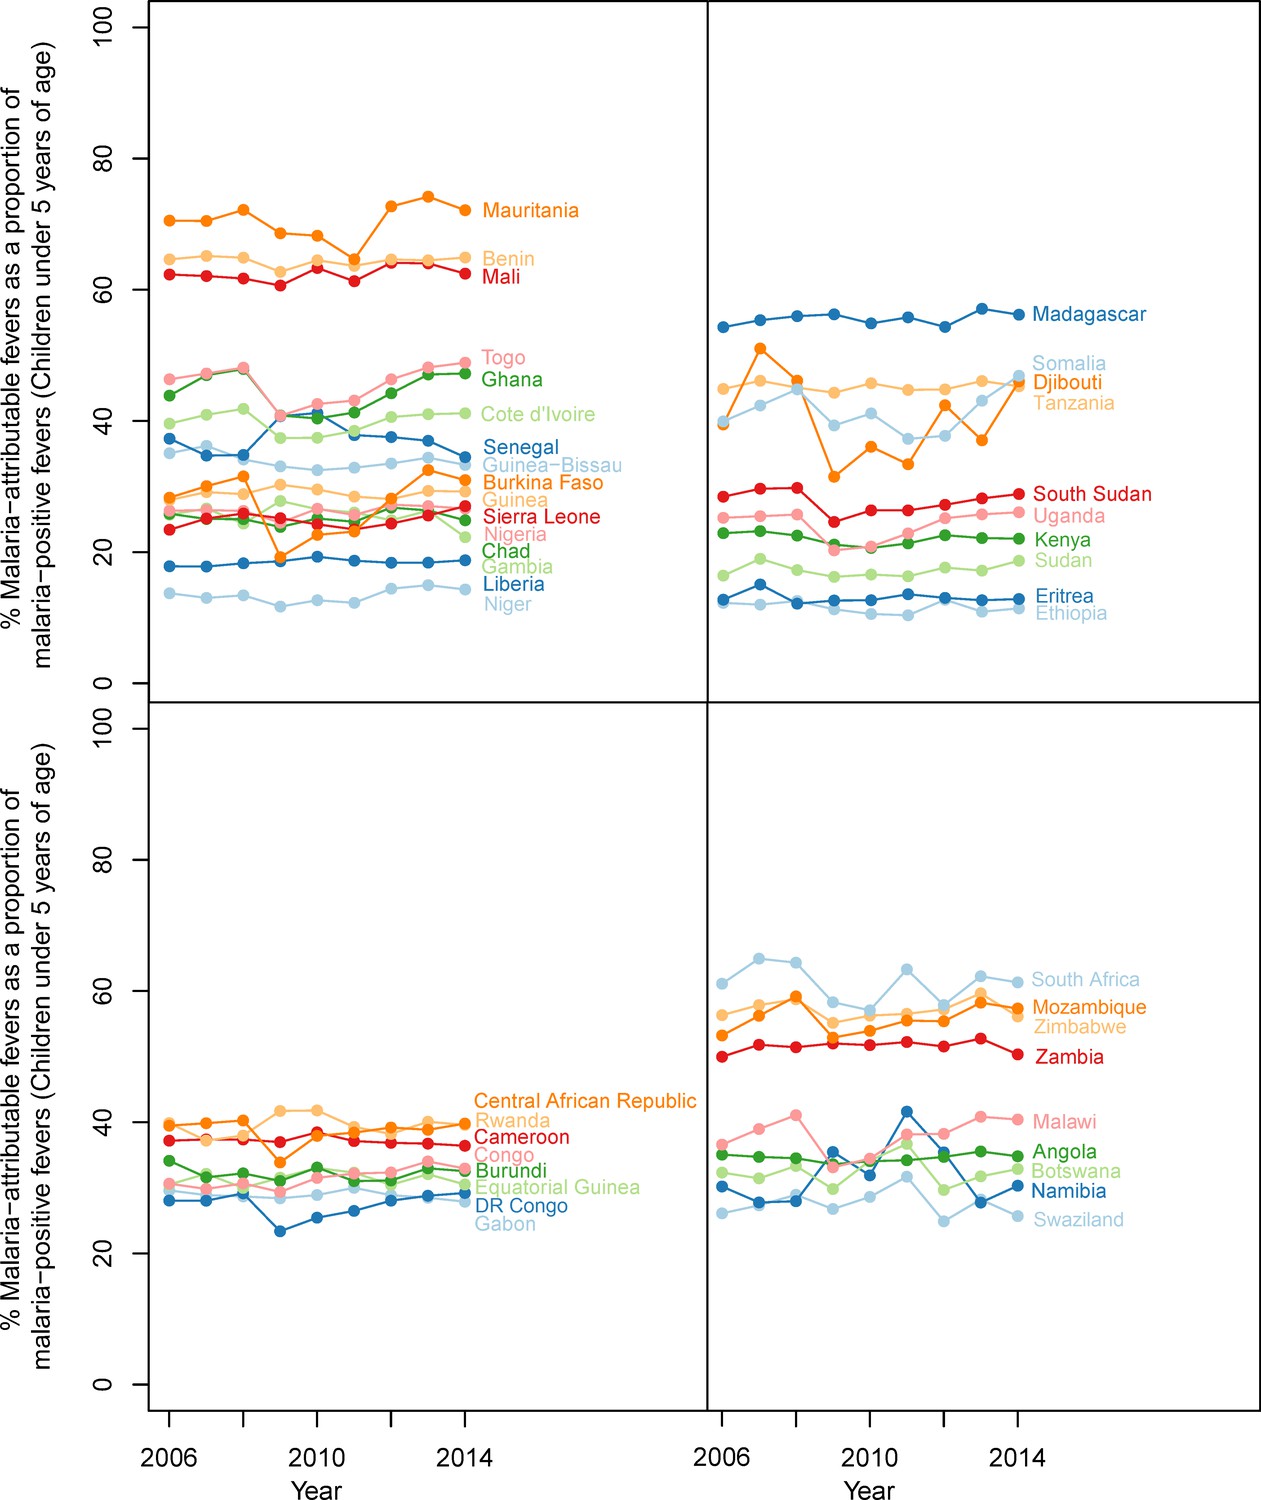
Malaria-attributable fevers as a proportion of malaria-positive fevers (children < 5 years of age, 2014).
Plotted values are the population-weighted mean for 43 sub-Saharan African countries over the study period, 2006–2014. Countries have been grouped by region to improve clarity.
Figure 4
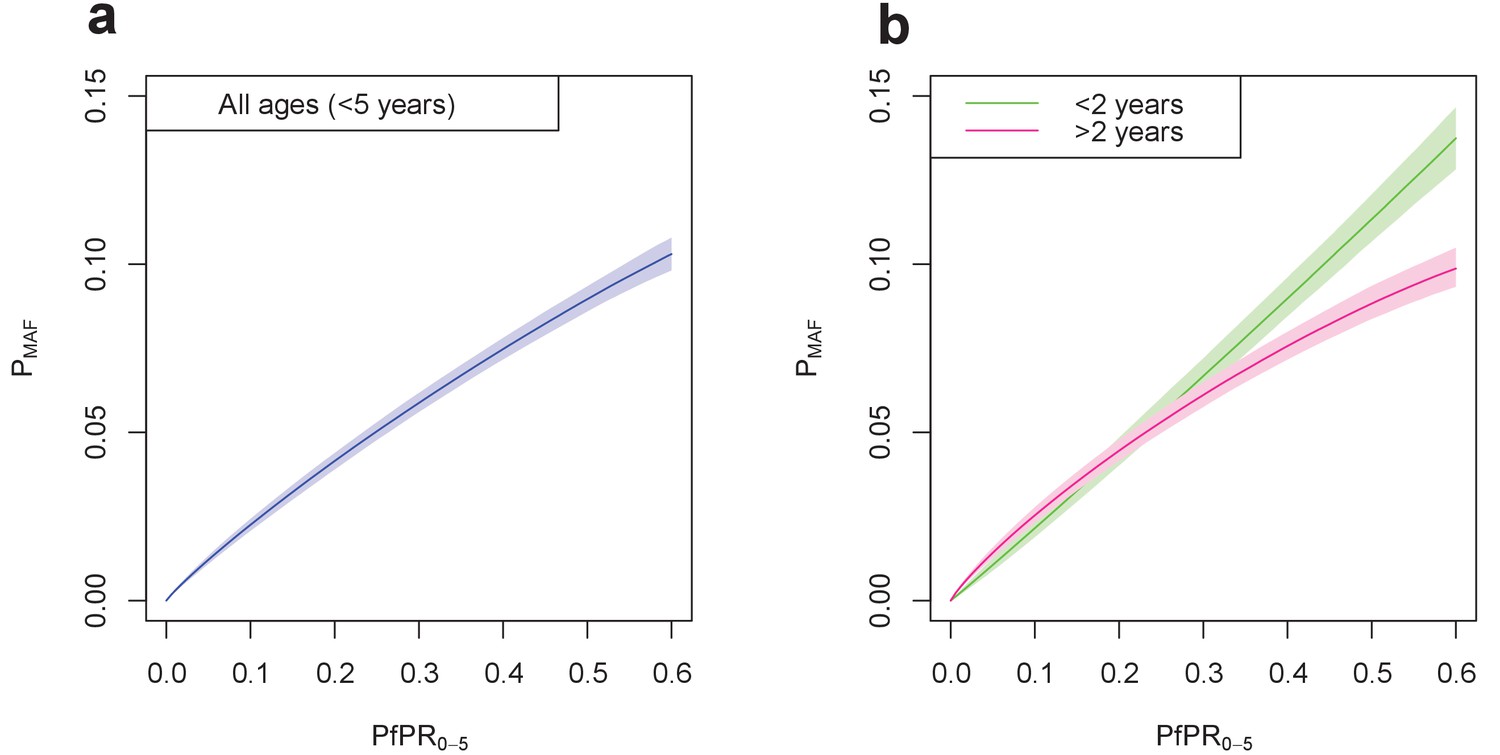
Final fitted relationship between PfPR0-5 and probability of a malaria-attributable fever (MAF) in the past two weeks.
(a) shows this relationship in children under five years of age, and (b) disaggregated into children under 2 years of age, and children aged 2–4 years. The probability of MAF in the past two weeks is greater for children under 2 years of age than for children above 2 years of age in areas with a PfPR0-5 higher than approximately 0.3. Median values of the posterior distribution are shown, with shaded 95% credible intervals.
Figure 5 with 1 supplement
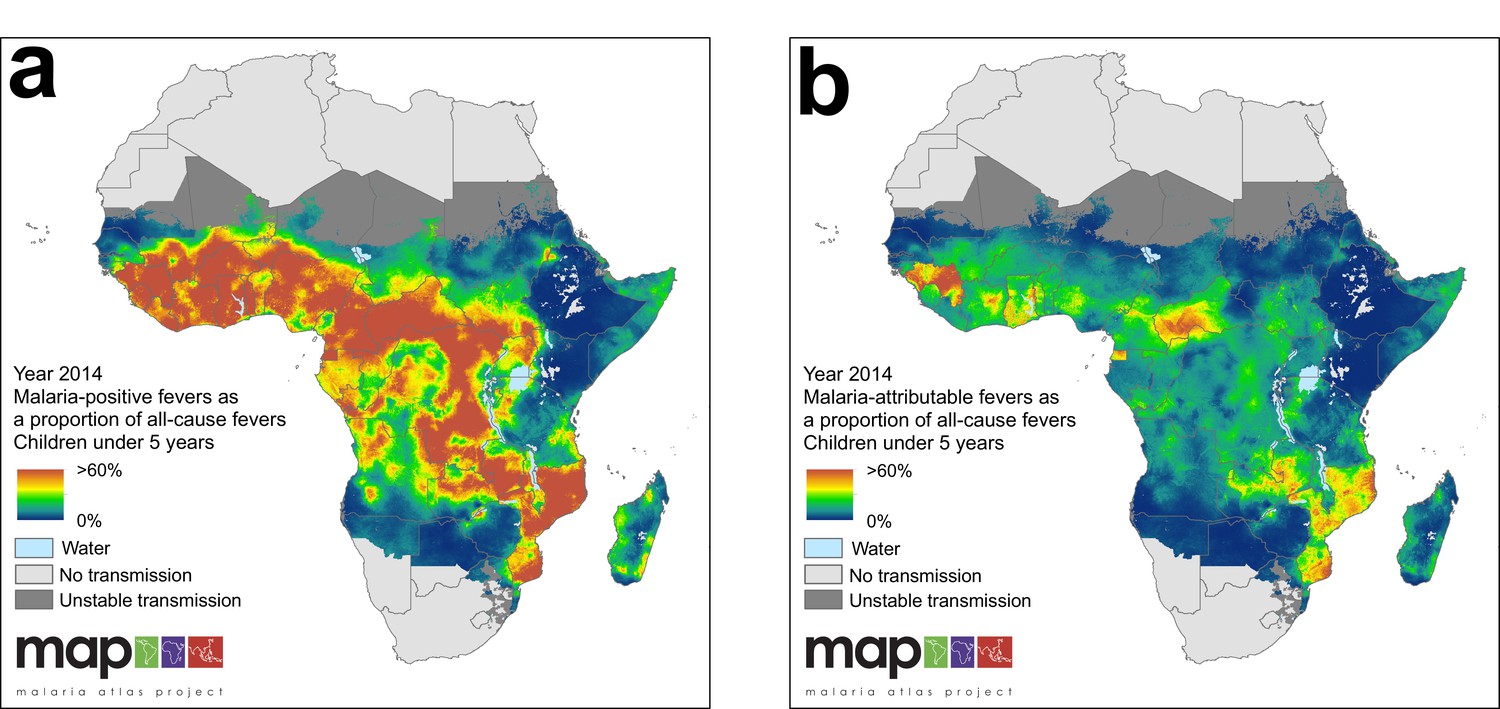
(a) Predicted malaria-positive fevers as a proportion of all fevers; (b) predicted malaria attributable fevers (MAF) as a proportion of all fevers. Both maps are shown for the year 2014, for children under 5 years of age and bounded by the limits of stable P. falciparum transmission.
https://doi.org/10.7554/eLife.29198.007
Figure 5—figure supplement 1
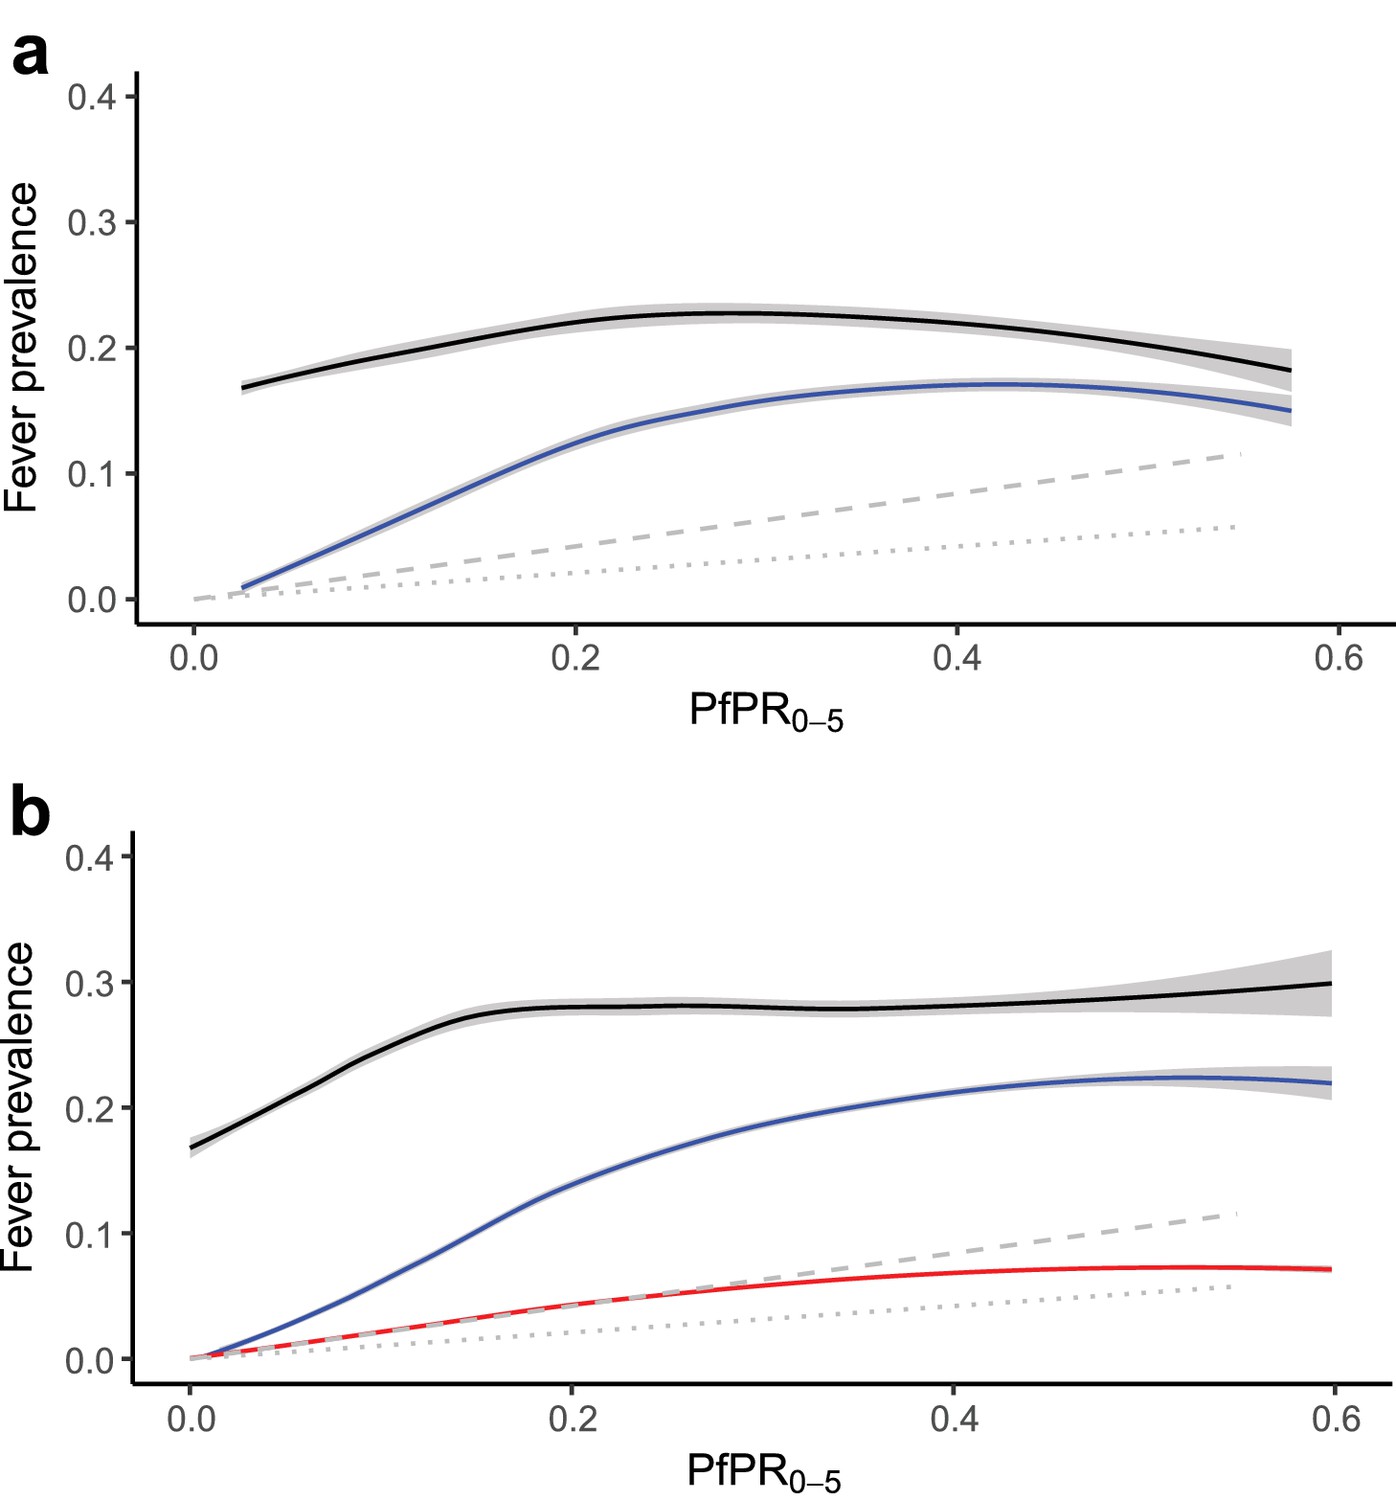
(a) Response data relationship between all-cause fever (black line) and malaria-positive fevers (blue line), and predicted incidence (symptomatic illness) for the duration of the past two to four weeks (grey dashed line) and past zero to two weeks (grey dotted line)* with PfPR0-5 from household survey datasets; and (b) the modelled relationship between all-cause fever (black line), malaria-positive fevers (blue line), and malaria attributable fevers (red line), and predicted incidence in the past two to four weeks (grey dashed line) and past zero to two weeks (grey dotted line)* with PfPR0-5 sampled from 10,000 pixels in predicted raster layers. Mean lines were fitted using locally-weighted regression, and shaded with 95% confidence intervals. *In both plots, the predicted incidence lines are generated from an ensemble of transmission models estimating the relationship between P. falciparum prevalence and incidence, standardised to ages 0 to 4 years old (Cameron et al., 2015). The grey dashed line depicts the estimated proportion of children in the past two to four weeks who had a clinical episode of malaria, and the grey dotted line depicts the estimated proportion of children in the past zero to two weeks who had a clinical episode of malaria, each with increasing P. falciparum malaria prevalence. A good fit between predicted MAF and transmission model estimations of clinical incidence indicates our model has strong predictive performance.
Figure 6
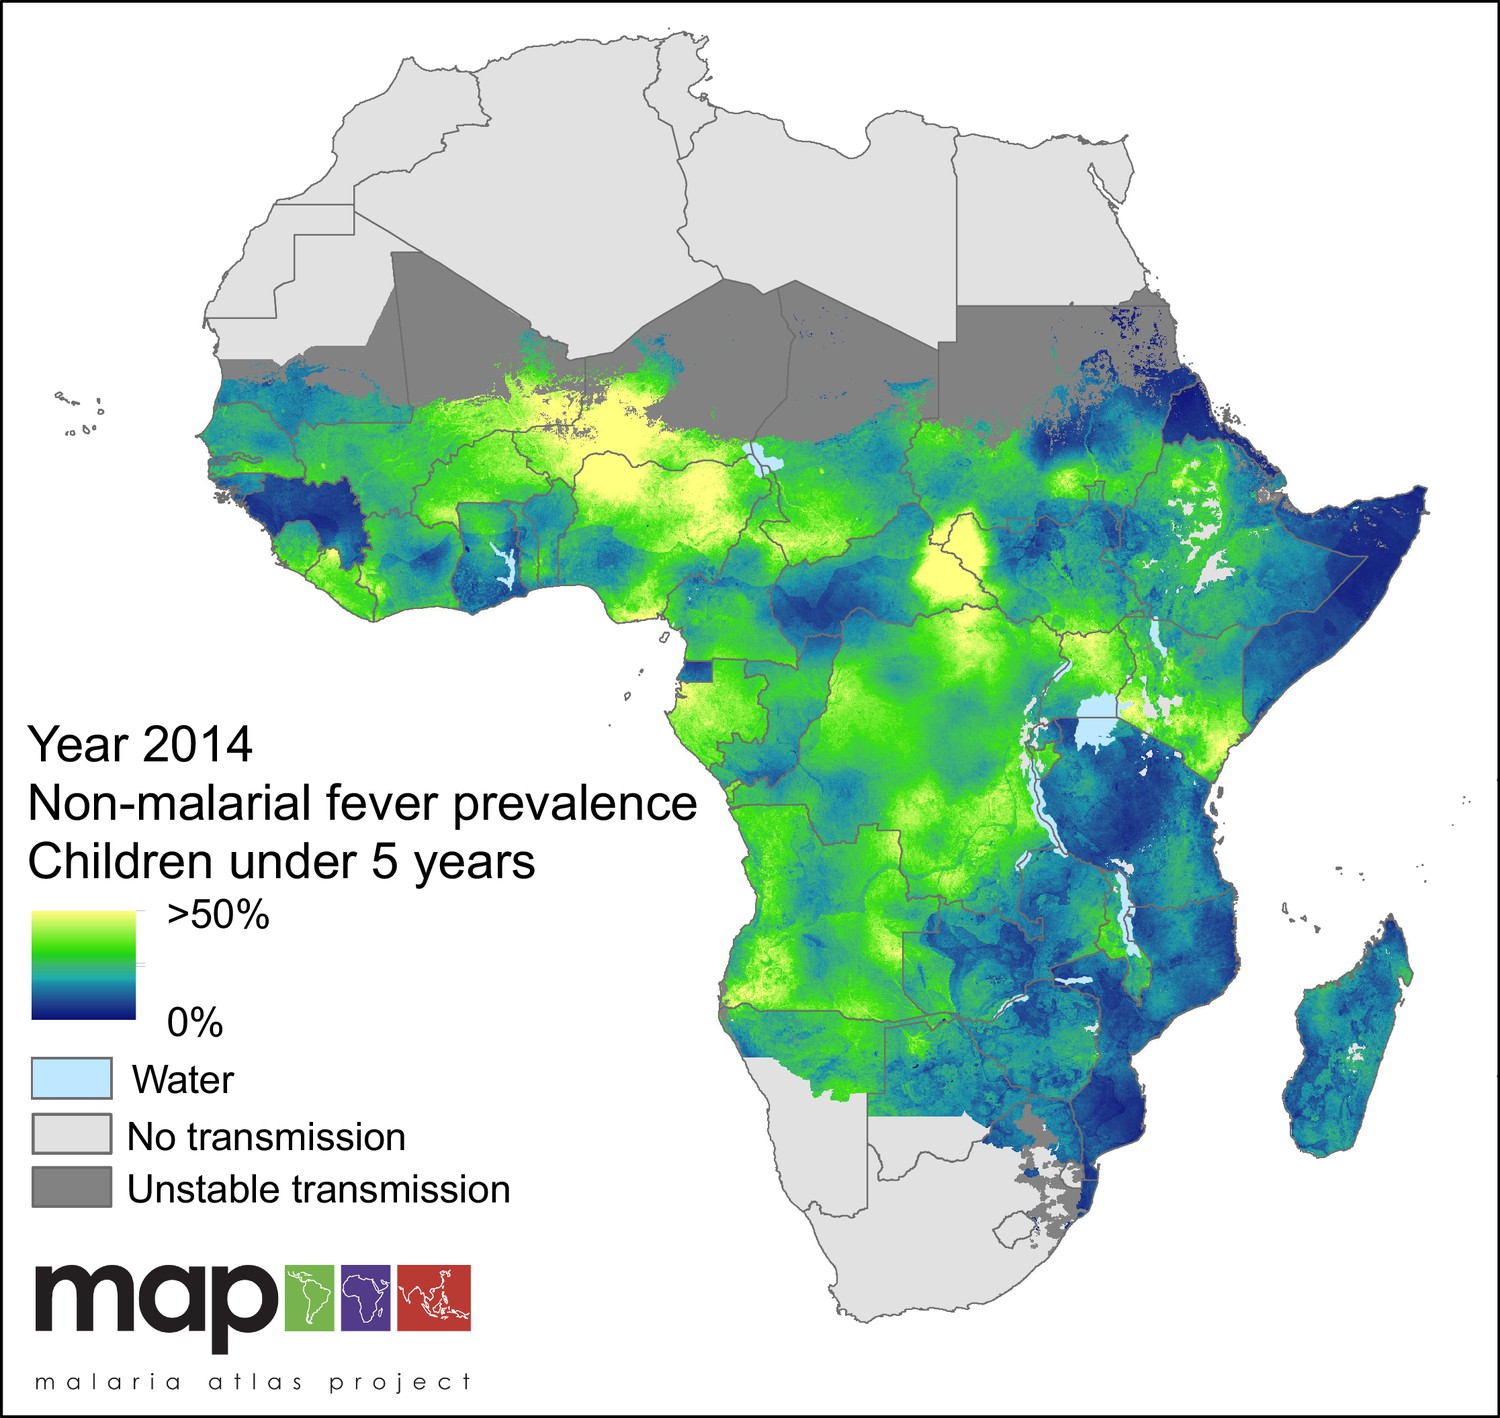
Predicted non-malarial febrile illness (NMFI) prevalence in children under 5 years of age.
NMFI prevalence is defined as the sum of the prevalence of febrile illness without a P. falciparum malaria infection and the prevalence of febrile illness coincident with, but not caused by, a P. falciparum malaria infection (MCF), for children under 5 years of age and bounded within the spatial limits of stable P. falciparum transmission in 2014.
Tables
Table 1
Four-way infection outcome table and formulae for deriving targets of inference.
https://doi.org/10.7554/eLife.29198.010| Pf pos. | Pf neg. | |
|---|---|---|
| Febrile | ||
| Afebrile |
Additional files
-
Supplementary file 1
Yearly population-weighted percentages for all-cause fever prevalence, and malaria-attributable fever, malaria-positive fever, and non-malarial febrile illness within all-cause fever amongst population at risk in children under 5 years of age in malaria-endemic Africa, 2006–2014.
- https://doi.org/10.7554/eLife.29198.011
-
Supplementary file 2
Household survey data used in analysis.
- https://doi.org/10.7554/eLife.29198.012
-
Supplementary file 3
Covariates used in BRT, listed by contribution to the final model.
- https://doi.org/10.7554/eLife.29198.013
-
Supplementary file 4
Model parameters and credible intervals of the final multinomial model; final model coefficients.
- https://doi.org/10.7554/eLife.29198.014
-
Supplementary file 5
National breakdown of contribution of NMFI, MAF and MCF (malaria-coincident fever) to all-cause fever in 2014.
NMFI is represented here as a fever without a patent malaria infection, MCF as a fever with a patent malaria infection where the fever is caused by a co-infection with an NMFI, and MAF where the malaria infection is the sole cause of the individual's fever. This file is supplementary to Figure 5.
- https://doi.org/10.7554/eLife.29198.015
-
Transparent reporting form
- https://doi.org/10.7554/eLife.29198.016
Download links
A two-part list of links to download the article, or parts of the article, in various formats.
Downloads (link to download the article as PDF)
Open citations (links to open the citations from this article in various online reference manager services)
Cite this article (links to download the citations from this article in formats compatible with various reference manager tools)
Quantifying the contribution of Plasmodium falciparum malaria to febrile illness amongst African children
eLife 6:e29198.
https://doi.org/10.7554/eLife.29198


