Non-synaptic signaling from cerebellar climbing fibers modulates Golgi cell activity
- University of Alabama at Birmingham, United States
Figures
Figure 1 with 2 supplements
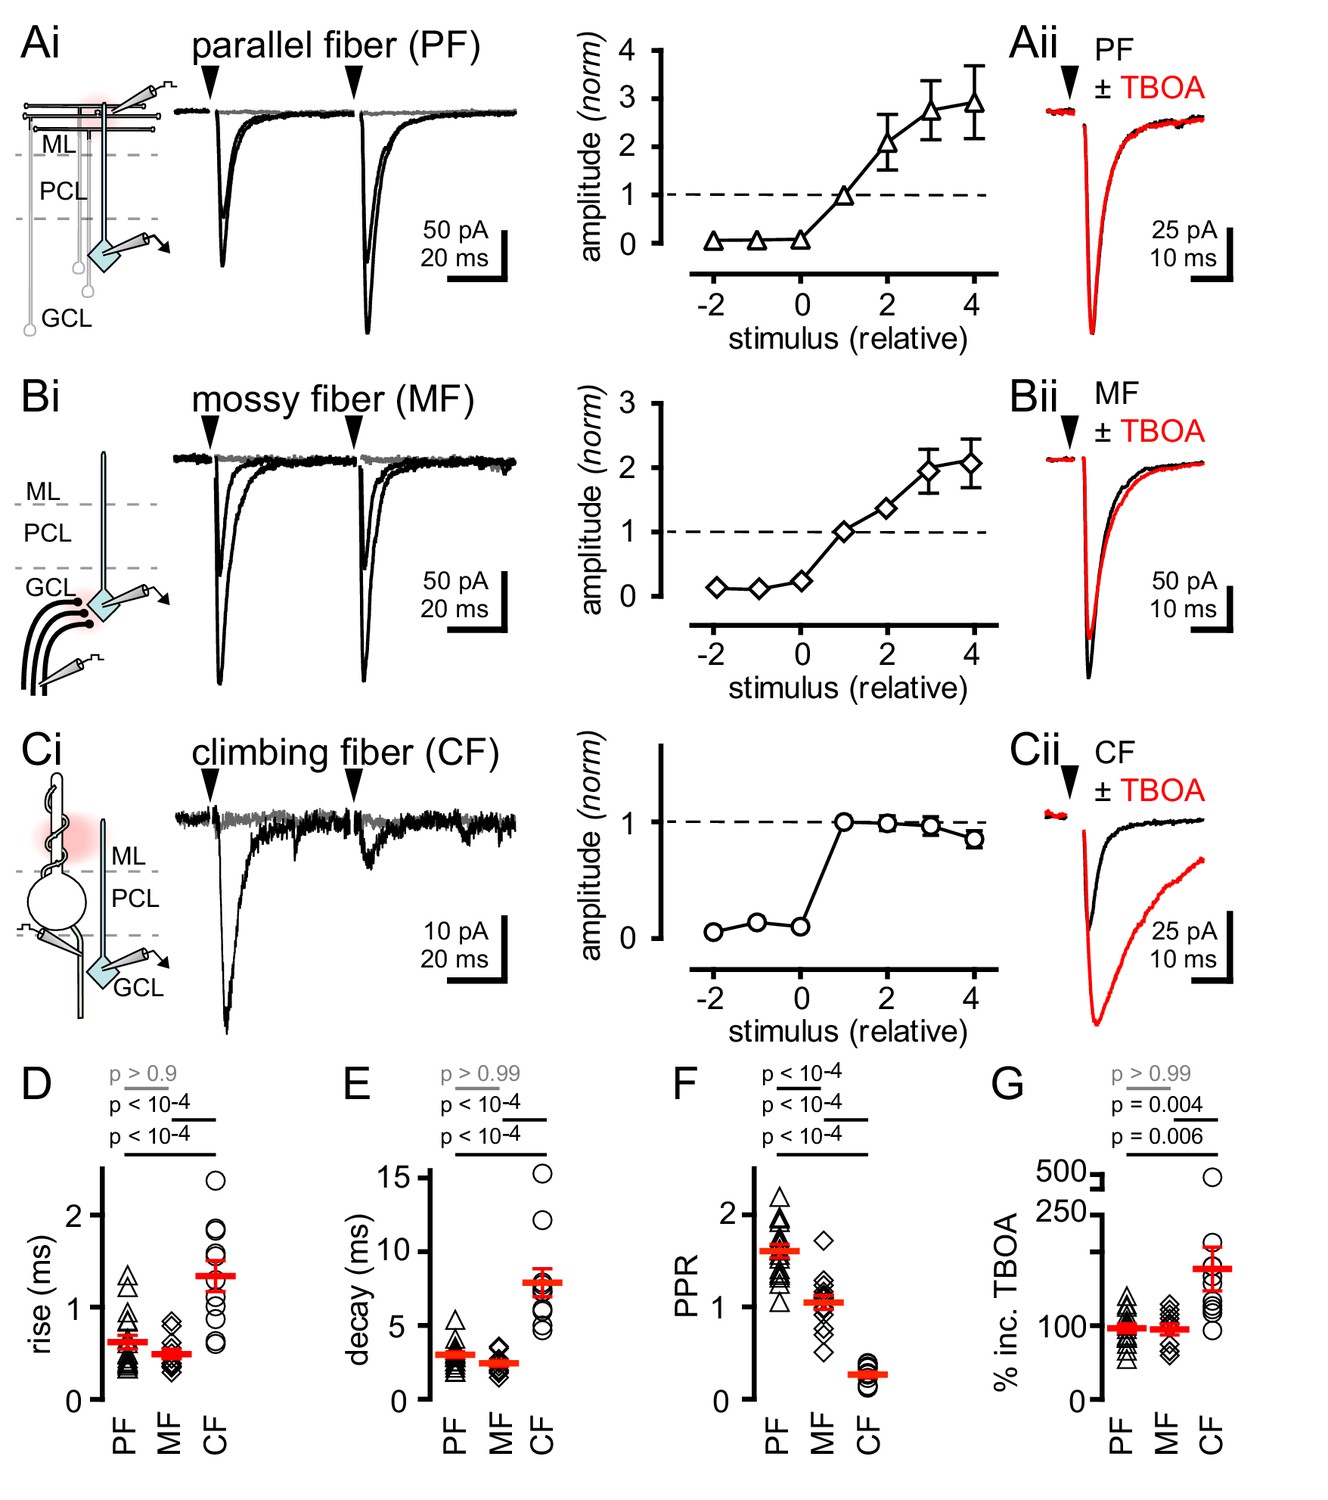
Synaptic- and spillover-mediated EPSCs onto cerebellar GoCs. .
(Ai, left and middle) Parallel fibers (PFs) were stimulated with an electrode placed in the molecular layer (ML). Superimposed PF-GoC EPSCs in response to increasing stimulus intensity and paired-pulse (50 ms) stimulation. Gray trace is the average subthreshold response. Arrows denote stimulation. (Ai, right) Normalized PF-GoC EPSCs (n = 9, triangles) with increasing stimulus intensity relative to the first supra-threshold response (dotted line). (Aii) Inhibition of glutamate uptake (TBOA; red) does not affect the amplitude or time-course of PF-GoC EPSCs. Holding potential = −60 mV. (Bi, left and middle) Mossy fibers (MFs) were stimulated with an electrode placed in the white matter, below the granule cell layer (GCL). Superimposed MF-GoC EPSCs in response to increasing stimulus intensity and paired-pulse (50 ms) stimulation. (Bi, right) Normalized MF-GoC EPSCs (n = 7, diamonds) with increasing stimulus intensity relative to the first supra-threshold response (dotted line). (Bii) Inhibition of glutamate uptake (TBOA; red) does not affect the amplitude or time-course of MF-GoC EPSCs. (Ci, left and middle) Climbing fiber (CF) was stimulated with an electrode placed below the Purkinje cell layer (PCL). Superimposed CF-GoC EPSCs in response to increasing stimulus intensity and paired-pulse (50 ms) stimulation. (Ci, right) Normalized CF-GoC EPSCs (n = 13, circles) with increasing stimulus intensity relative to the first supra-threshold response. (Cii) Inhibition of glutamate uptake (TBOA; red) increases the peak amplitude and slows the kinetics of CF-GoC EPSCs. (D) rise-times, (E) decay-times, and (F) paired-pulse ratios following PF- (triangles), MF- (diamonds), and CF- (circles) stimulation. Red horizontal bars represent the mean ± SEM. PF: rise = 0.62 ± 0.08 ms, decay = 3.0 ± 0.2 ms, PPR = 1.6 ± 0.07; n = 17 each. MF: rise = 0.49 ± 0.05 ms, decay = 2.4 ± 0.2 ms, PPR = 1.05 ± 0.08; n = 14, 12, and 11. CF: rise time = 1.3 ± 0.2 ms, decay = 7.9 ± 0.9 ms, PPR = 0.27 ± 0.03; n = 11, 11, and 10). (G) Summary of % TBOA (50 µM) peak amplitude increase following PF- (triangles), MF- (diamonds), and CF- (circles) stimulation. PF: 97 ± 6%; MF: 95 ± 7%, CF: 177 ± 30%; n = 15, 11, and 11.
Figure 1—figure supplement 1
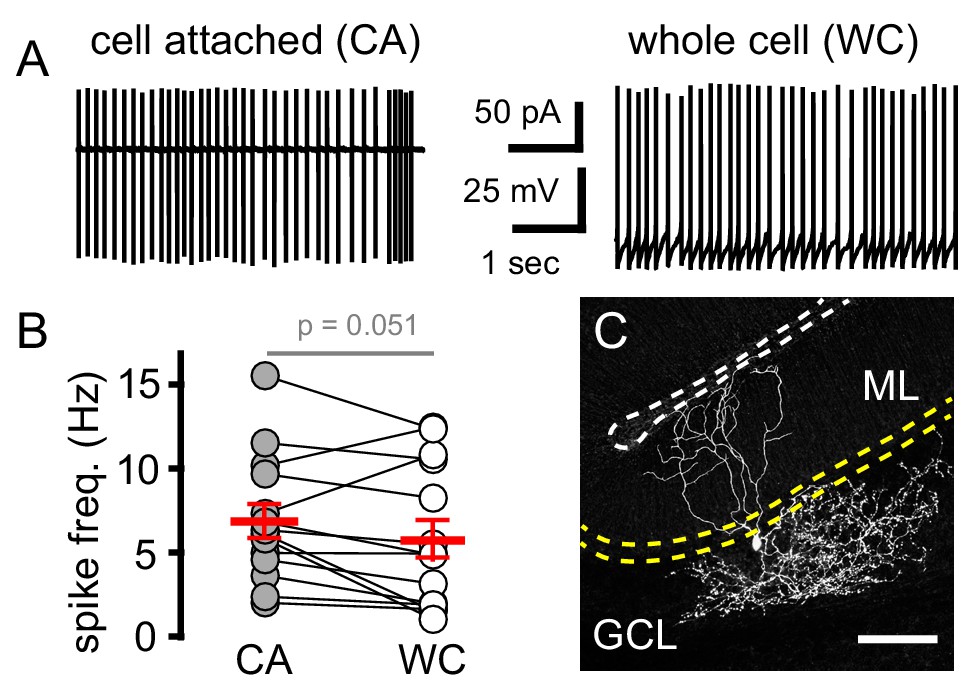
Electrophysiological and visual identification of cerebellar Golgi cells (GoC).
(A) Representative example of GoC spontaneous spiking in cell attached and whole cell recording configuration. (B) Paired GoC spontaneous spiking frequency (Hz) in cell attached (CA, grey circles) and whole cell (WC, open circles) configurations are similar. CA: 6.9 ± 1.0 and WC: 5.5 ± 1.1 Hz; n = 14. Horizontal red bars are the mean ±SEM values. (C) Collapsed confocal z-stack of a GoC filled with biocytin and imaged with Alexa-647 conjugated streptavidin (scale bar = 100 µm). Yellow and white dotted lines indicate boundaries of the Purkinje cell layer and pial surface, respectively.
Figure 1—figure supplement 2
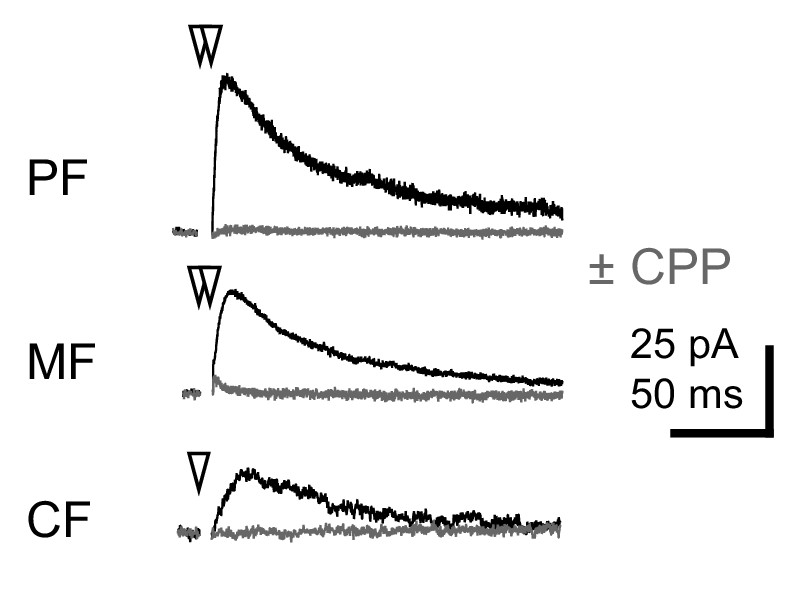
NMDA-receptor-EPSCs.
Average NMDAR currents at +40 mV evoked by a pair of stimuli (100 Hz; PF or MF) or a single CF stimulus in TBOA (10 µM). Control recordings (black) are in the presence of picrotoxin (100 µM), CGP55845 (2 µM), strychnine (1 µM) and NBQX (5 µM). Addition of CPP (gray; 10 µM) results in block of outward current (n = 3–5 cells each).
Figure 2 with 2 supplements
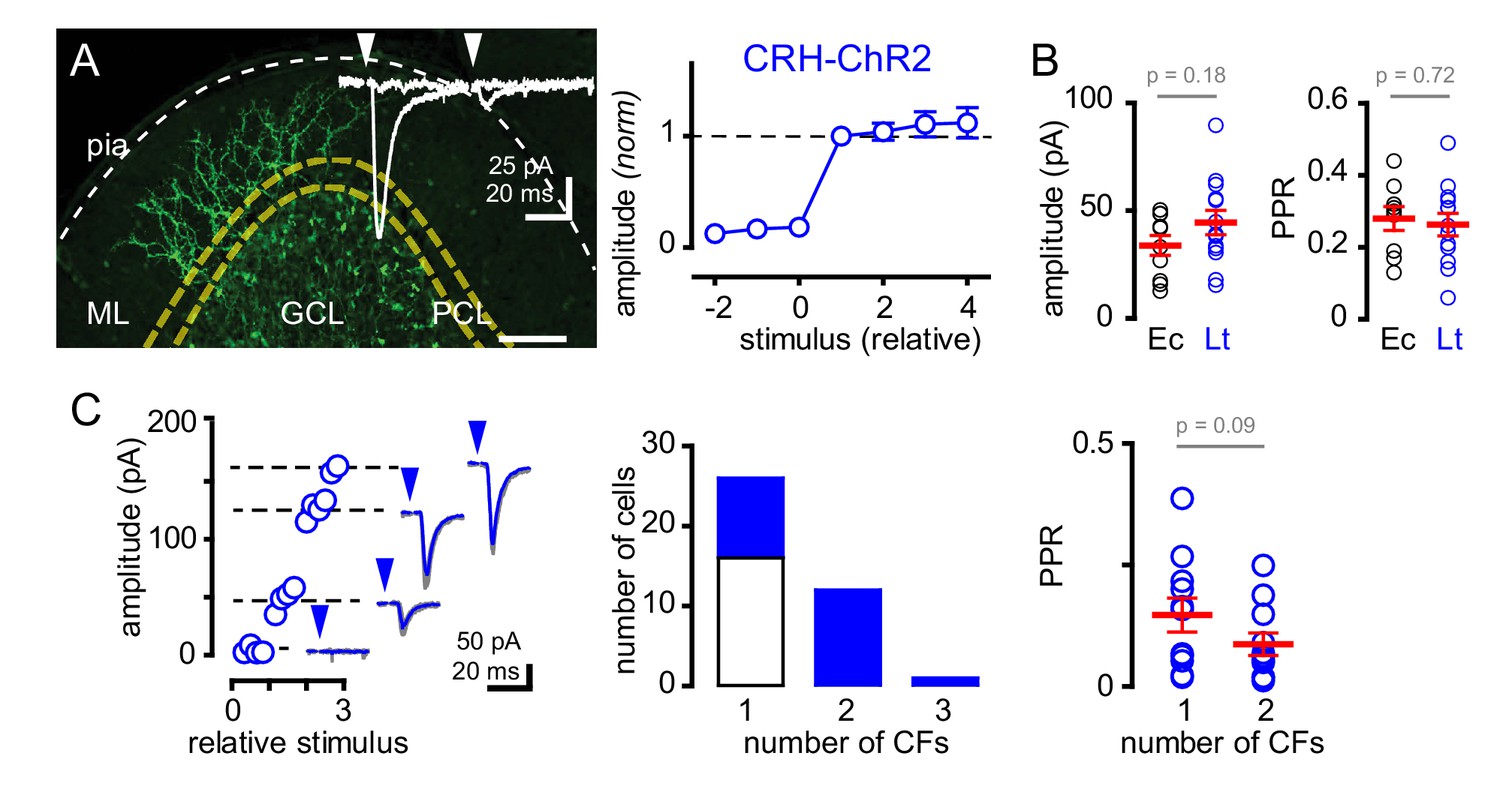
Recruitment of multiple climbing fibers with CRH-ChR2 stimulation.
(A) Confocal Z-projection showing CFs expressing EYFP-tagged ChR2 in the ML from a parasagittal section of lobule III. Yellow and white dotted lines indicate boundaries of the PCL and pial surface, respectively. Inset shows representative CRH ChR2-EPSCs with strong depression following paired (50 ms inter stimulus) light stimulation. (A, right) Light-evoked (blue circles) EPSCs (n = 8) showed all-or-none behavior with increasing light intensity similar to PCL electrical stimulation (see Figure 1Ci for comparison). (B) The peak amplitude and PPR are similar with either electrical- (Ec; black circles) or light- (Lt; blue circles) stimulation. Light-evoked amplitude: 44 ± 6 pA and PPR: 0.26 ± 0.03; n = 13. (C, left) Example plot showing the recruitment of three CFs with increasing light intensity. Each discrete current measure (dotted line with EPSC) represents a putative CF. (C, middle) Summary graph showing frequency distribution of GoC receiving a discrete number of CFs. Light-evoked responses are shown in blue. On average light-stimulation can recruit 1.7 CFs. (C, right) Activation of multiple CFs onto GoCs does not change the PPR (1CF: 0.15 ± 0.03, 2CF: 0.09 ± 0.02, n = 11).
Figure 2—figure supplement 1

CF-PC light stimulation.
Representative sub- (gray) and supra-threshold (black) EPSC recorded from a Purkinje cell (−60 mV with 100 nM NBQX, n = 5) showing strong depression following paired (100 ms inter-stimulus interval) light stimulation (blue arrows and shown in the schematic).
Figure 2—figure supplement 2
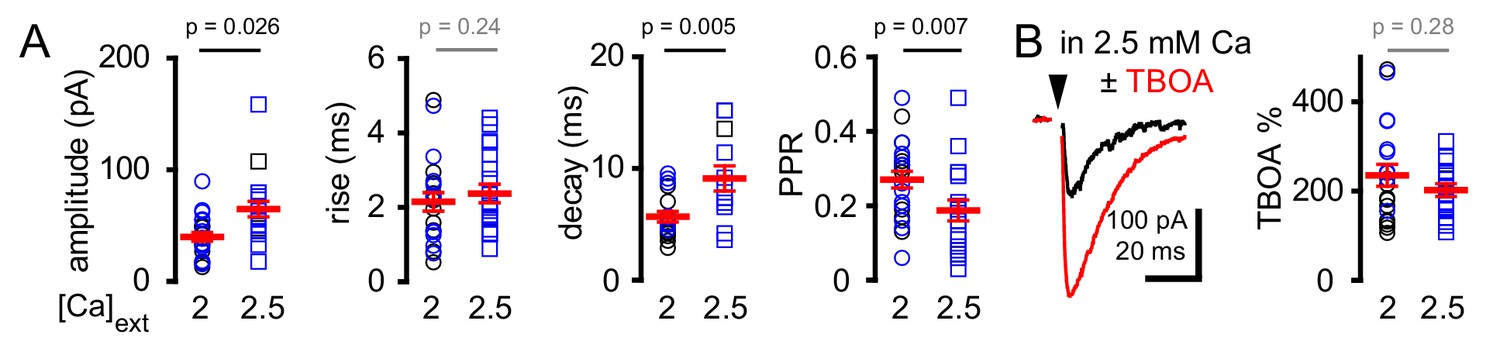
CF-GoC spillover EPSCs are sensitive to release probability.
(A) Summary plots of peak amplitude (44 ± 6 pA and 74 ± 7 pA; n = 26 and 19), rise-time (2.1 ± 0.2 ms and 2.4 ± 0.3 ms; n = 22 and 19), decay-time (5.7 ± 0.5 ms and 9.1 ± 1.1 ms; n = 18 and 12), and PPR (0.27 ± 0.02 and 0.18 ± 0.03; n = 22 and 18) of CF-EPSCs in either 2 or 2.5 mM extracellular [Ca2+], respectively. (B) CF-EPSCs before and following glutamate uptake inhibition (TBOA, red). TBOA increased the peak amplitude and slowed the kinetics of EPSCs to a similar extent as in either 2 or 2.5 mM extracellular [Ca2+]. Summary of % TBOA (50 µM) peak amplitude increase in 2 or 2.5 mM (209 ± 23% and 178 ± 13%) extracellular [Ca2+] (n = 23 and 18). Black and blue symbols denote electrical and light stimulation, respectively. Circles represent individual experiments in 2 mM [Ca2+] and squares are measures in 2.5 mM [Ca2+].
Figure 3
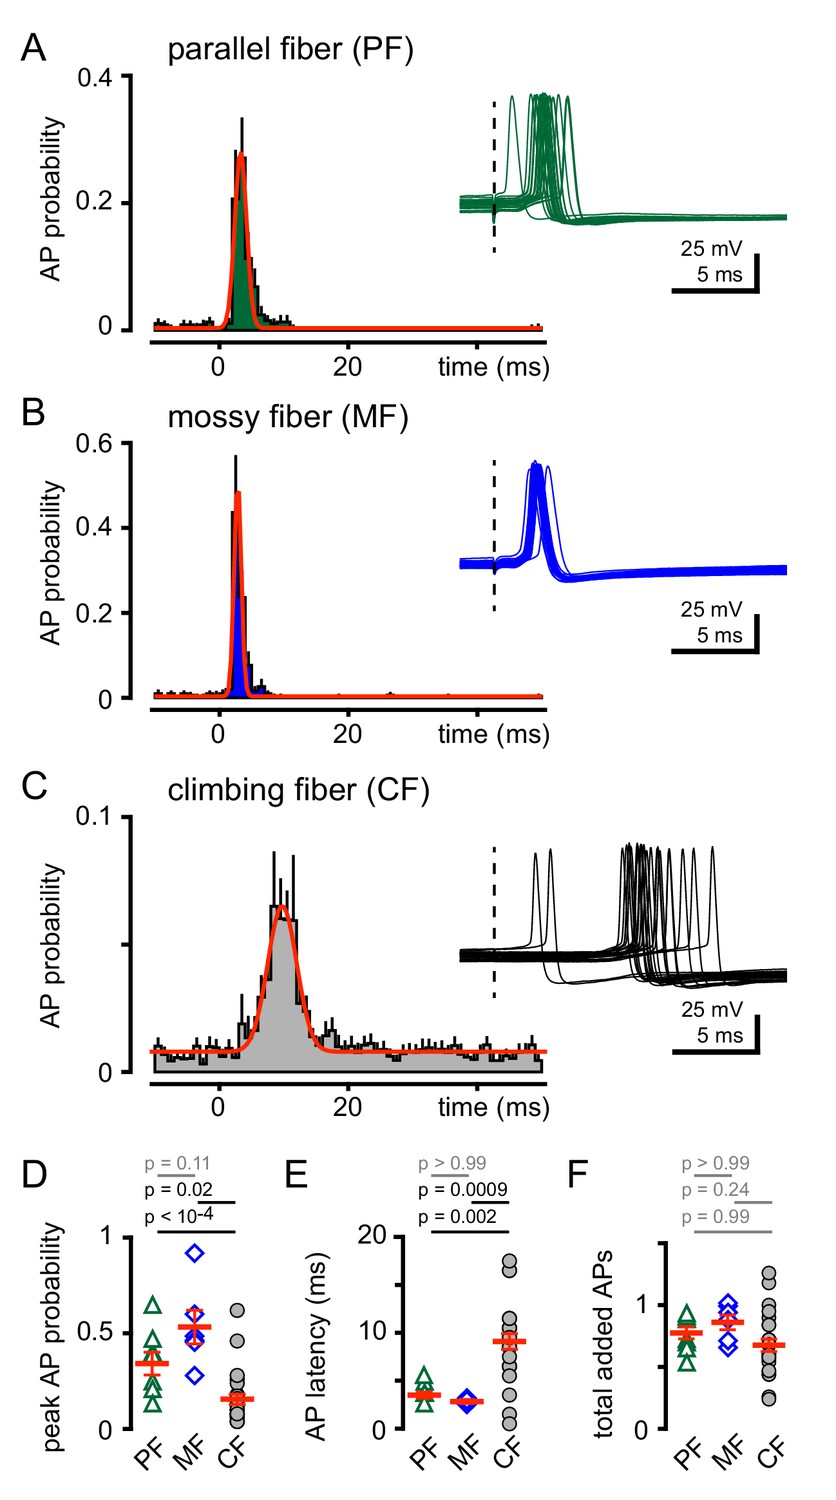
CF stimulation increases GoC spiking.
(A) Average PF-GoC PSH (green) shows a rapid and large increase in the peak AP probability (0.36 ± 0.07; n = 7). The fit to a Gaussian distribution is overlaid in red (half-width: 0.53 ± 0.06 ms; n = 7). Inset illustrates the relatively low jitter in spike latency (3.6 ± 0.4 ms; n = 7) measured following PF stimulation (dotted line). (B) Average MF-GoC PSH (blue) shows a rapid and large increase in the peak AP probability (0.53 ± 0.09; n = 6). The fit to a Gaussian distribution is overlaid in red (half-width: 0.48 ± 0.07 ms; n = 6). Inset illustrates the relatively low jitter in spike latency (2.8 ± 0.2 ms) measured following MF stimulation. (C) Average CF-GoC PSH (grey) shows a slower and smaller increase in the peak AP probability (0.16 ± 0.03; n = 25). The fit to a Gaussian distribution is overlaid in red (half-width: 2.1 ± 0.7 ms; n = 10). Inset illustrates the high jitter in spike latency (9.1 ± 0.8 ms; n = 25) measured following CF stimulation. (D) AP probability and (E) pike latency following PF- (green triangles), MF- (blue diamonds), and CF- (grey circles) stimulation. Red horizontal bars represent the mean ±SEM. (F) Average number of added spikes following PF- (green triangles, 0.75 ± 0.06), MF- (blue diamonds, 0.86 ± 0.06), and CF- (grey circles, 0.68 ± 0.05) stimulation. Red horizontal bars represent the mean ± SEM.
Figure 4
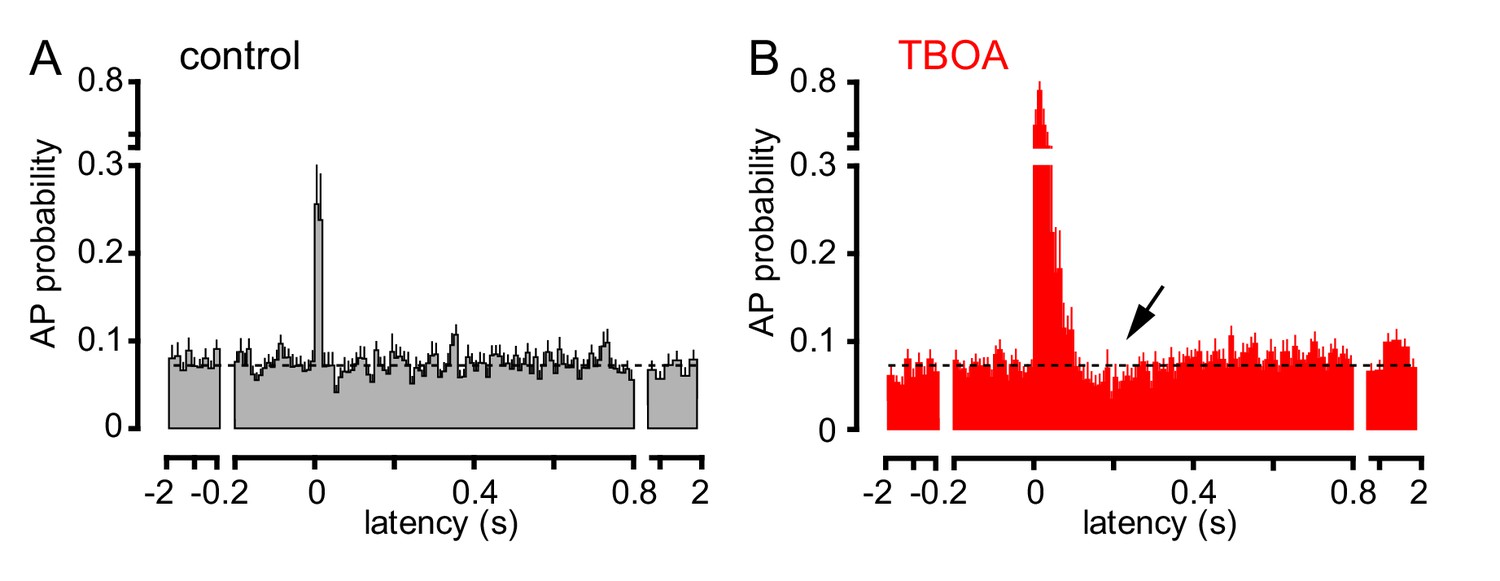
TBOA application reveals a biphasic effect of CF stimulation on GoC firing.
(A) Average GoC spiking probability (20 ms bin) PSH following CF stimulation (t = 0 s) in control conditions (grey) or (B) in the presence of 50 µM TBOA (red). Dotted line indicates baseline AP probability. TBOA increased the peak spiking probability to 271 ± 22% and reduced spiking to 70.7 ± 7.2%,~200 ms after CF stimulation; n = 18, p<0.0001 and p=0.0007, respectively, paired t-test).
Figure 5
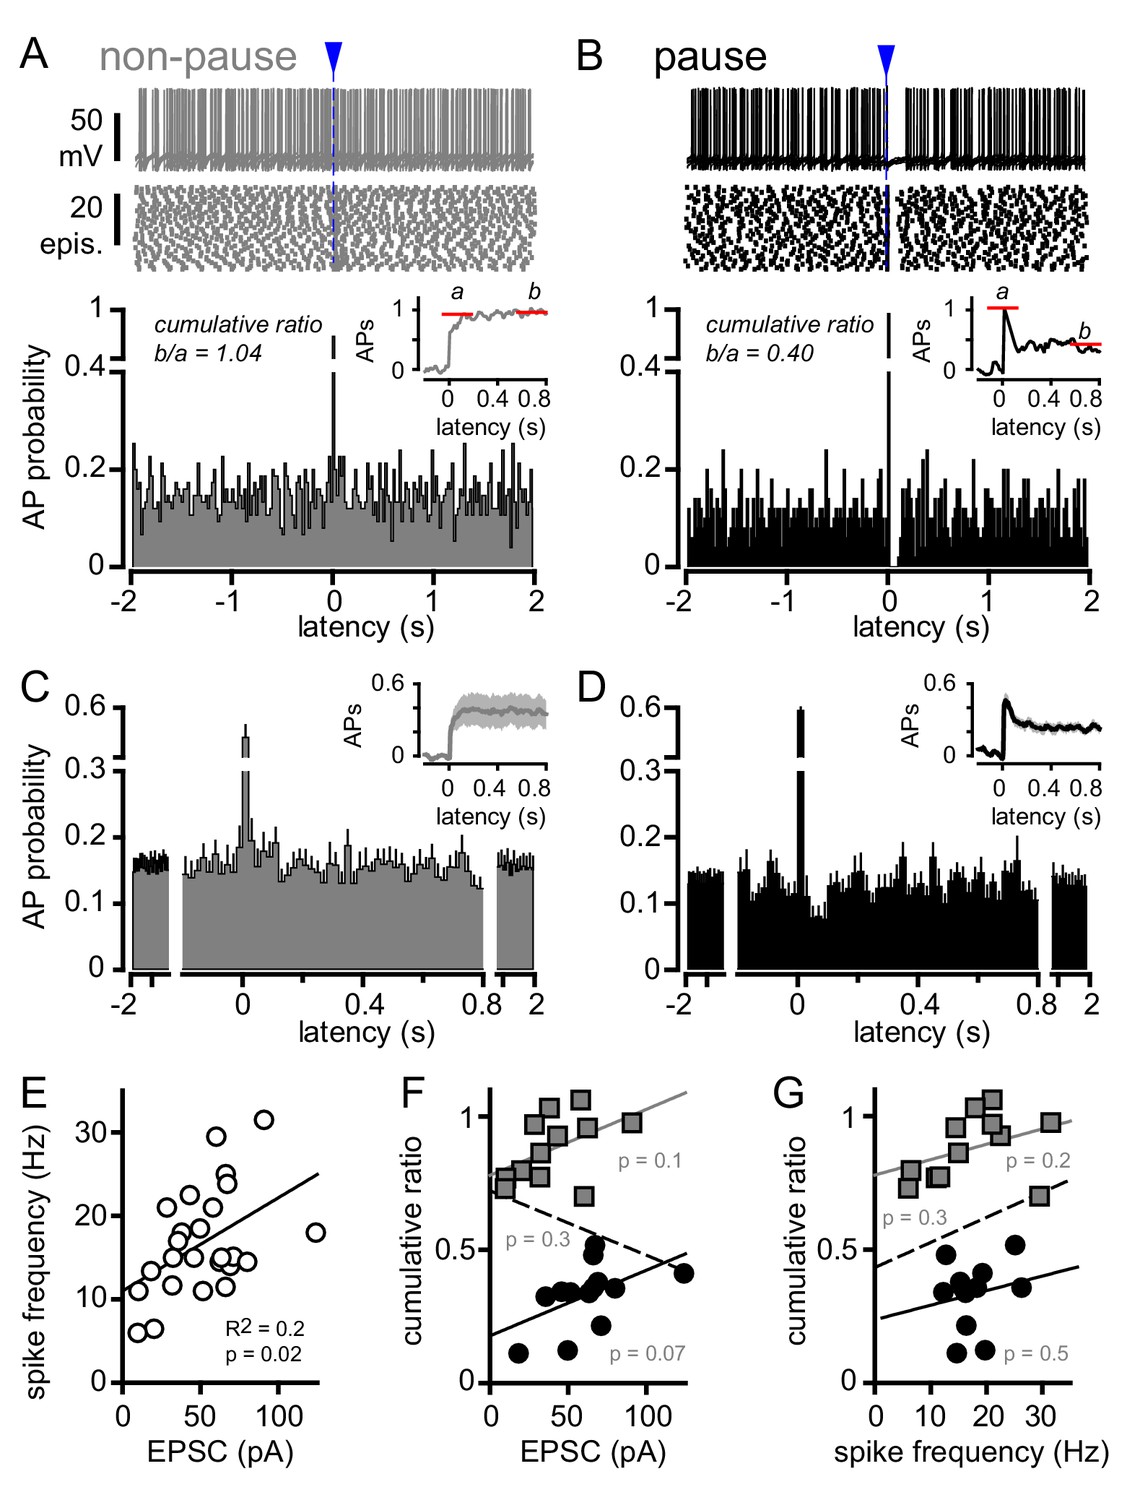
CF stimulation can suppress GoC firing.
(A, top) Example traces (10 traces overlaid) and (middle) raster plot from a GoC that increases spiking in response to CF stimulation (blue arrow and dotted line) and immediately returns to baseline firing rate. (A, bottom) PSH of GoC spike probability (20 ms bin) with CF stimulation at time = 0 s. Inset shows the PSH integral to yield the cumulative spike probability (see text). Red lines illustrate the ratio of the steady state (b) to peak number of spikes (a) added with each stimulus to define a cumulative ratio (b/a). (B, top) Example traces (10 traces overlaid) and (middle) raster plot from a GoC that displays a suppression of GoC spiking following CF stimulation (arrow). (B, bottom) PSH of GoC spike probability (20 ms bin) with CF stimulation at time = 0 s. Inset shows the PSH integral to yield the cumulative spike probability with red lines illustrating the low cumulative ratio indicative of spike suppression. (C and D) Average PSHs for non-pausing (grey; cumulative ratio >0.65; n = 12 of 25) and pausing (black; cumulative ratio <0.65; n = 13 of 25) GoCs. Insets are the average cumulative spike probability for the non-pausing and pausing GoCs. (E) Summary plot showing that the average spike frequency is correlated with the EPSC amplitude (linear regression, n = 25 cells). (F) No correlation between the cumulative ratio and EPSC amplitude using all (dotted line), only non-pausing (grey squares and line), or pausing cells (filled circles and solid line). (G) No correlation between the cumulative ratio and average spike frequency using all (dotted line), only non-pause (grey squares and line), or pause cells tested (filled circles and solid line).
Figure 6 with 2 supplements
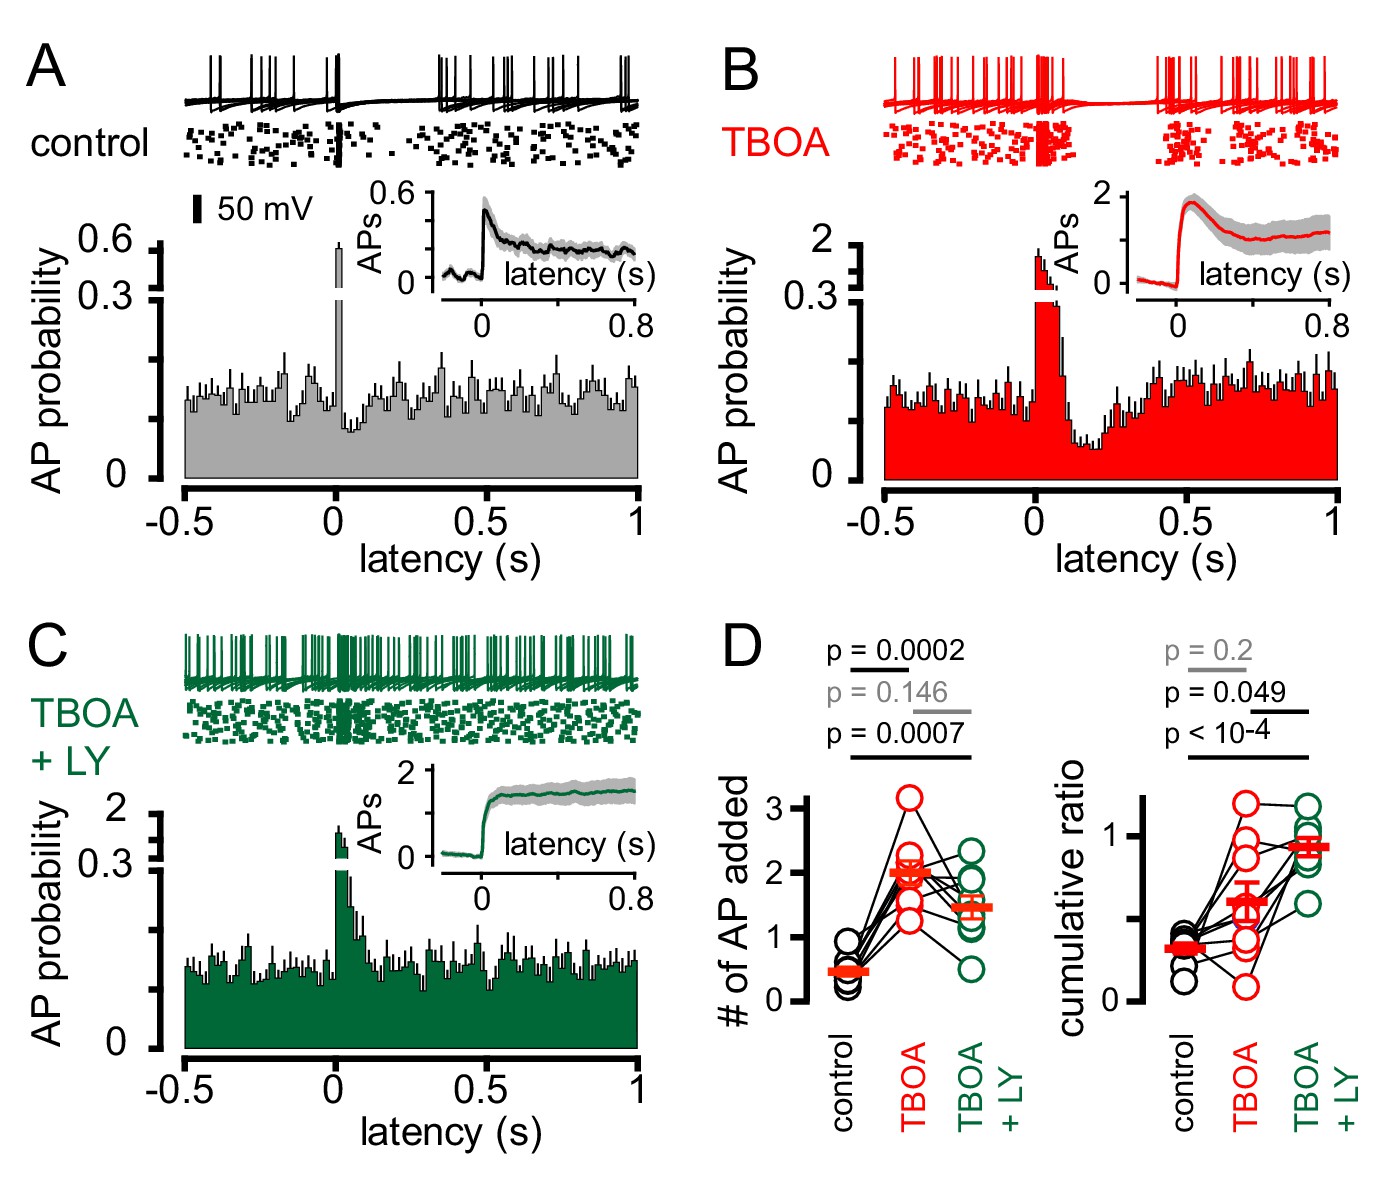
CF-mediated GoC pausing is dependent upon activation of postsynaptic mGluR2.
(A, top) Example traces (10 traces overlaid) and raster plot (middle) from a GoC that displays a suppression of GoC spiking following CF stimulation (arrow) in control solutions. (A, bottom) PSH showing GoC spike probability constructed (20 ms bin) with CF stimulation at time = 0 s. Inset, shows the PSH integral to yield the cumulative spike probability (see text). (B and C) Same experimental paradigm as in (A) but in the presence of 50 µM TBOA (red), and in 50 µM TBOA +0.5 μM LY3414195 (green), respectively. (D, left) The number of added APs in response to CF stimulation increased from 0.46 ± 0.07 (black) to 2.0 ± 0.18 in the presence of TBOA (red) or TBOA +LY (1.47 ± 0.18 (green). (D, right) The average cumulative ratio in response to CF stimulation in control (black, 0.32 ± 0.03) was sustained in the presence of TBOA (red, 0.6 ± 0.1) and abolished by the application of TBOA +LY341495 (green, 0.93 ± 0.05).
Figure 6—figure supplement 1
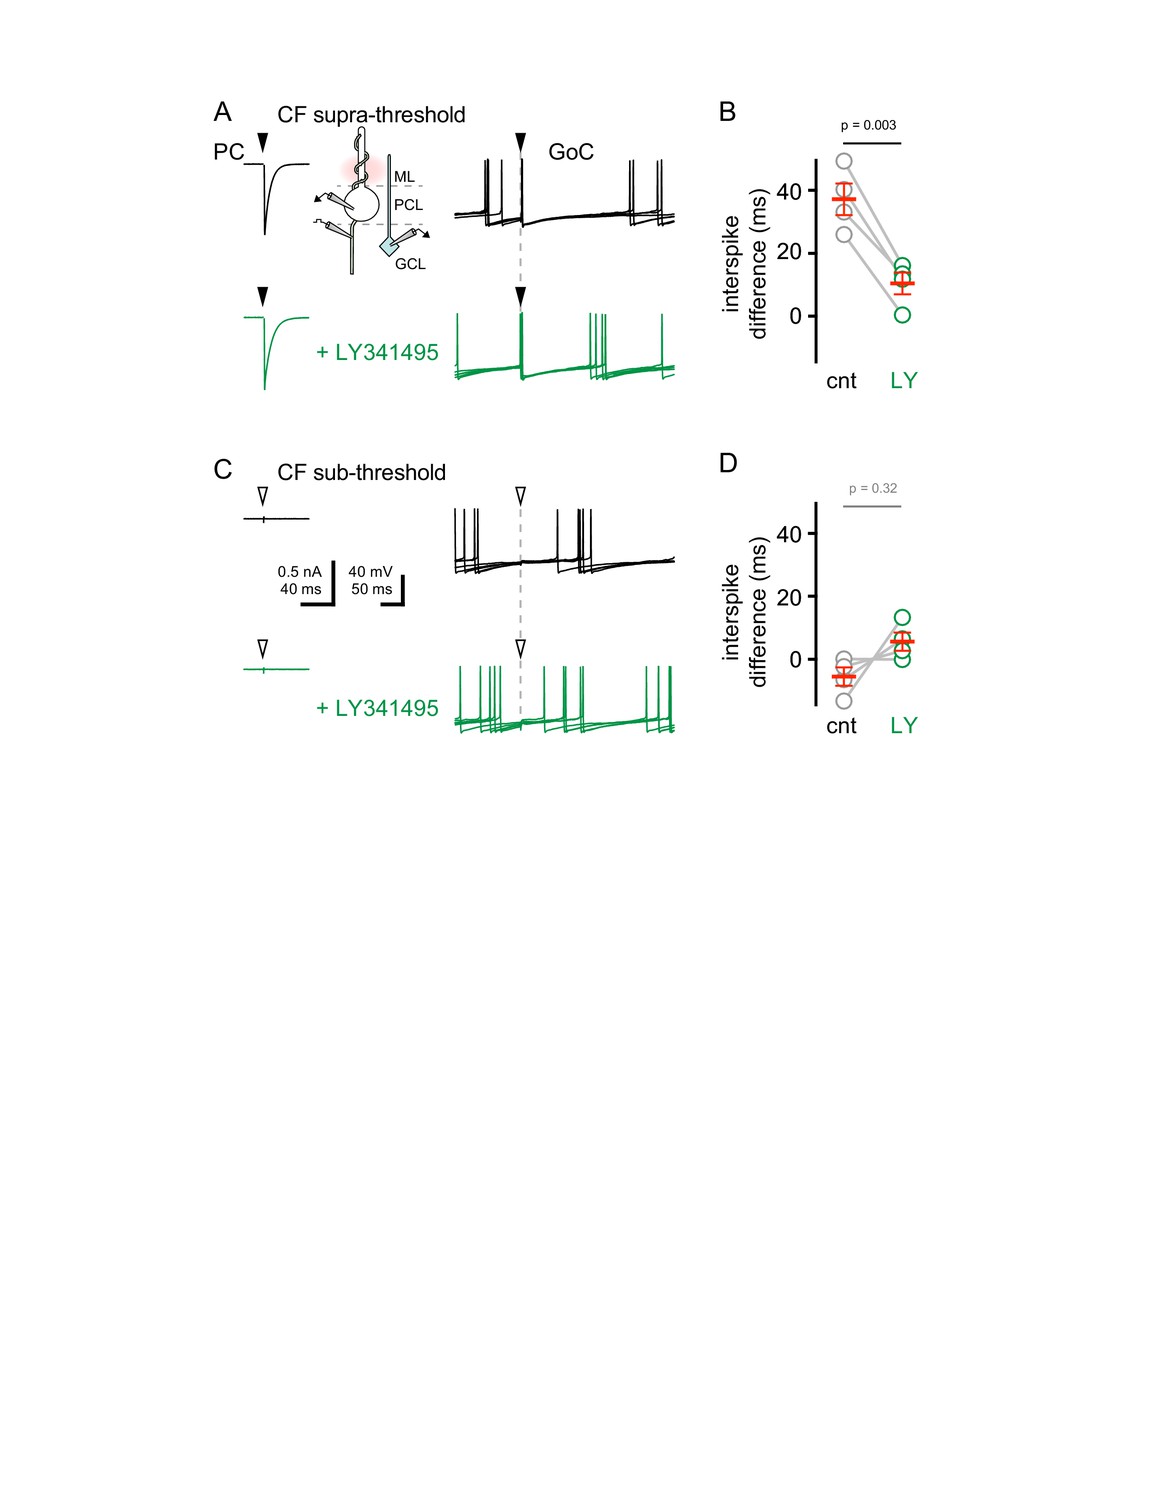
CF-mediated GoC spike suppression is mGluR2 dependent.
(A, Top) Simultaneous recordings of PC EPSC (left) and GoC APs (right, five traces overlaid) with supra-threshold CF stimulation (filled arrows). (A, bottom) Same recording configuration as above with LY341495 (green) application. Schematic of paired recording configuration is shown between PC and GoC traces. Scale as in (C). (B) Summary plot (circles are individual cells and mean ±sem are in red) of first interspike difference (after CF stimulation) before (grey, 37.2 ± 5 ms) and following LY3414395 application (green, 10.4 ± 3.5 ms, n = 4; ANOVA comparison with post test between cnt v LY). The baseline interspike interval was subtracted from each cell (average: 167.7 ± 13.6 ms, n = 4). The interspike interval before subtraction was 204.8 ± 18.3 ms (control) and 178.1 ± 16.4 ms in (LY3414395). In a separate set of experiments, the baseline interspike interval (before stimulation) was 172.5 ± 10.0 ms (n = 38). (C, top and bottom) Same experimental paradigm as in (A) with sub-threshold CF stimulation (empty arrows) in control (black) or in the presence of LY341495 (green). (D) Summary plot (circles are individual cells and mean ±SEM are in red) of first spike interspike difference before (grey, −5.5 ± 2.9 ms) and following LY3414395 application (green, 5.6 ± 2.9 ms, n = 4). The baseline interspike interval was subtracted from each cell. The interspike interval before subtraction was 162.2 ± 10.8 ms (control) and 173.3 ± 16.4 ms (in LY3414395).
Figure 6—figure supplement 2

Current injections reset GoC intrinsic activity.
(A) Example traces (top; 10 traces overlaid), representative raster plot and peristimulus histogram (PSH, middle) of a tonically firing GoC subjected to a 50 pA current injection (time = 0). Bottom: Average PSH of GoC spiking constructed from 20 ms bins following a 50 pA current injection (n = 5–8 cells). (B) Same paradigm as in (A) but with a 500 pA current injection. (C) Correlation of pause duration and normalized (to baseline spiking frequency) spiking (over 40 ms) following current injections (25–500 pA; n = 20) in control conditions. Slope of linear regression = 13.6 ± 6. (D, E, and F) Same experimental design as above with the addition of 0.5 µM LY3414395 (n = 5–8 cells and 20 experiments). Slope of linear regression = 19.1 ± 8 is not different than in control conditions (p=0.6, unpaired t-test).
Figure 7 with 1 supplement
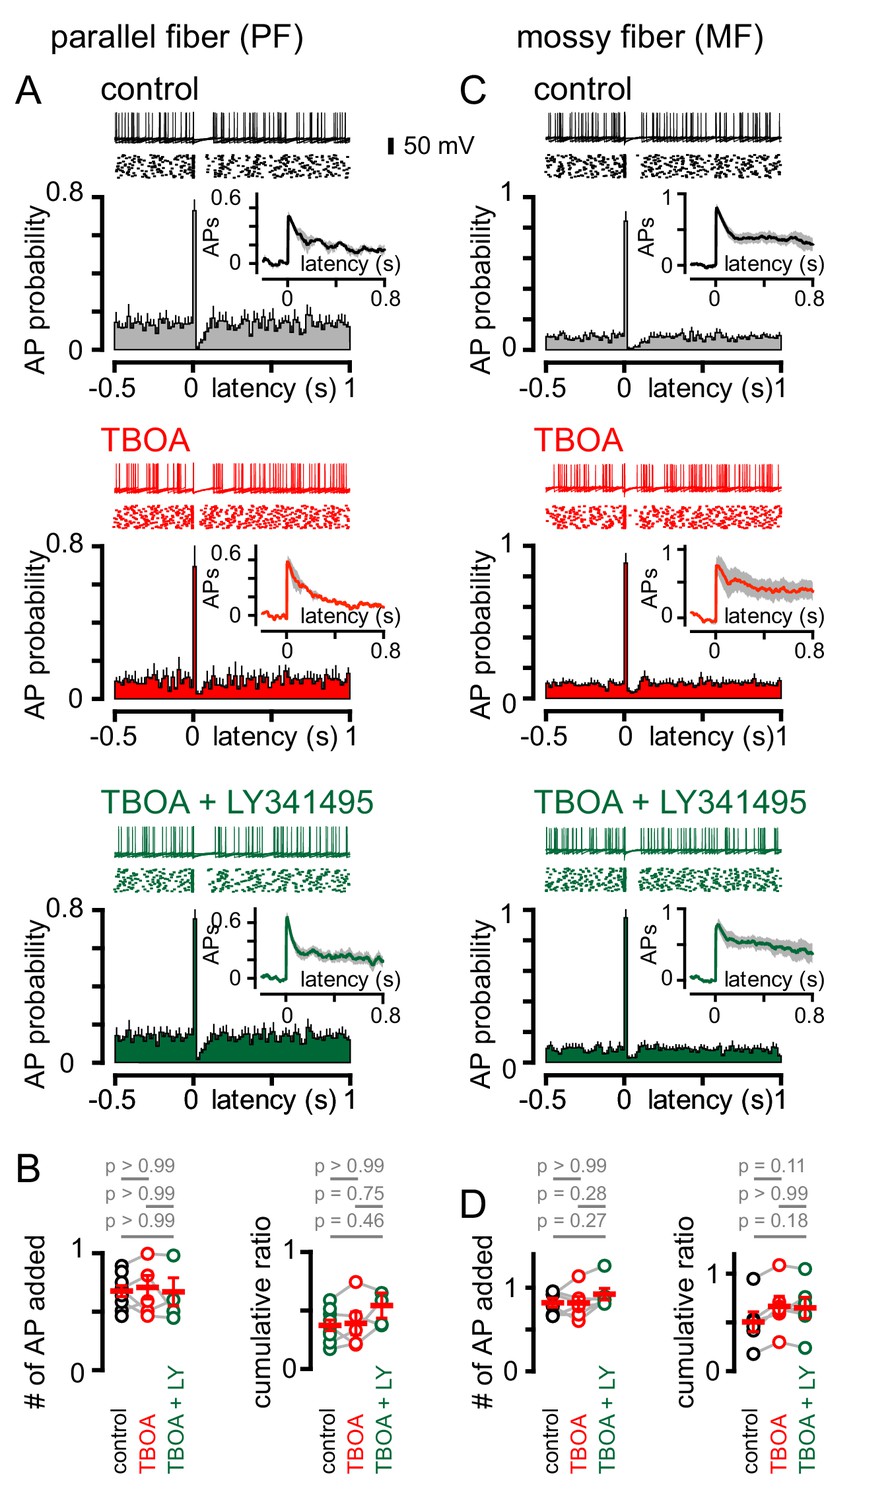
PF and MF stimulation produce an intrinsic pause in GoC firing.
(A, top) Example traces (10 traces overlaid) and raster plot (middle) from a GoC that shows an increase followed by a short suppression in firing following PF stimulation. (A, bottom) Average PSH of GoC spiking probability (20 ms bins) with PF stimulation (time = 0 s). Inset, shows the integration of the PSH to yield cumulative spike probability plot. Data in control (lack), TBOA (50 μM, red) and TBOA +LY (50 µM + 0.5 μM, green). (B, left) Average number of added action potentials (APs) as a result of PF stimulation was measured at the peak of the cumulative probability plot in each condition. The average number of added APs was not different from control (black, 0.64 ± 0.05), in the presence of TBOA (red, 0.67 ± 0.1) or TBOA +LY (green, 0.62 ± 0.09; n = 5–7). (B, right) The average cumulative ratio after a single PF stimulus (black, 0.37 ± 0.05) was unaffected by the application of TBOA (red, 0.39 ± 0.1) and TBOA +LY (green, 0.54 ± 0.2; n = 5–7). (C, top) Example traces (10 traces overlaid) and raster plot (middle) from a GoC before and after MF stimulation. (C, bottom) Average PSH of GoC spike probability before and after MF stimulation (time = 0 s). Inset shows cumulative spike probability plot. (D, left) Average number of added APs as a result of MF stimulation was not different between control (black, 0.82 ± 0.05), TBOA (red, 0.82 ± 0.08) and TBOA +LY (green, 0.92 ± 0.07; n = 6). (D, right) The average cumulative ratio after a single MF stimulus (black, 0.54 ± 0.08) was unaffected by the application of TBOA (red, 0.66 ± 0.1) and TBOA +LY (0.65 ± 0.1; n = 6).
Figure 7—figure supplement 1
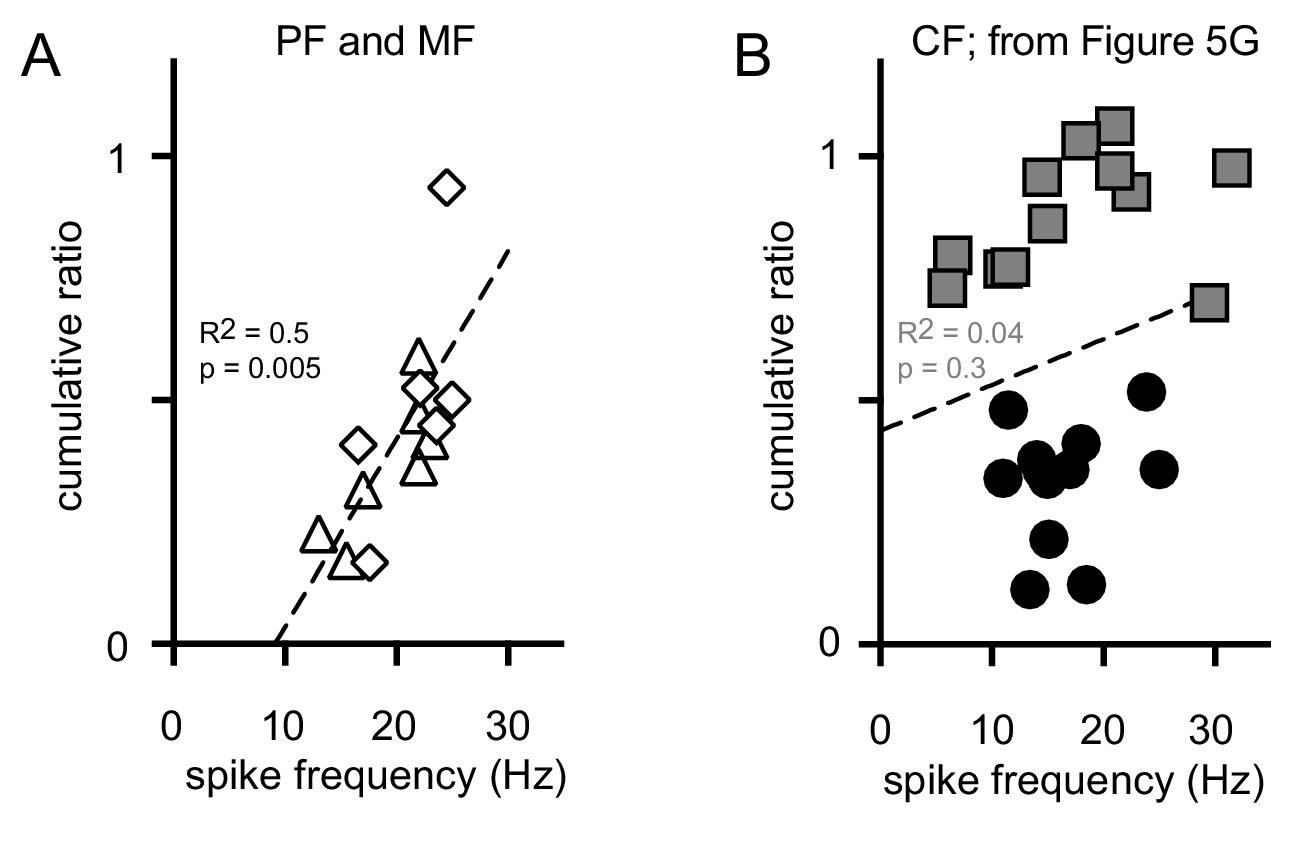
PF and MF cumulative ratio correlates with spike frequency.
(A) The cumulative ratio correlates with the average spike frequency following PF (triangles) and MF (diamonds) stimulation. The dotted line is the linear regression for PFs and MFs (n = 7 and 6, respectively). (B) Lack of correlation (as shown in Figure 5G) between the cumulative ratio and average spike frequency for all CF-stimulated GoCs (pause = solid circles and non-pause = squares, n = 25).
Figure 8
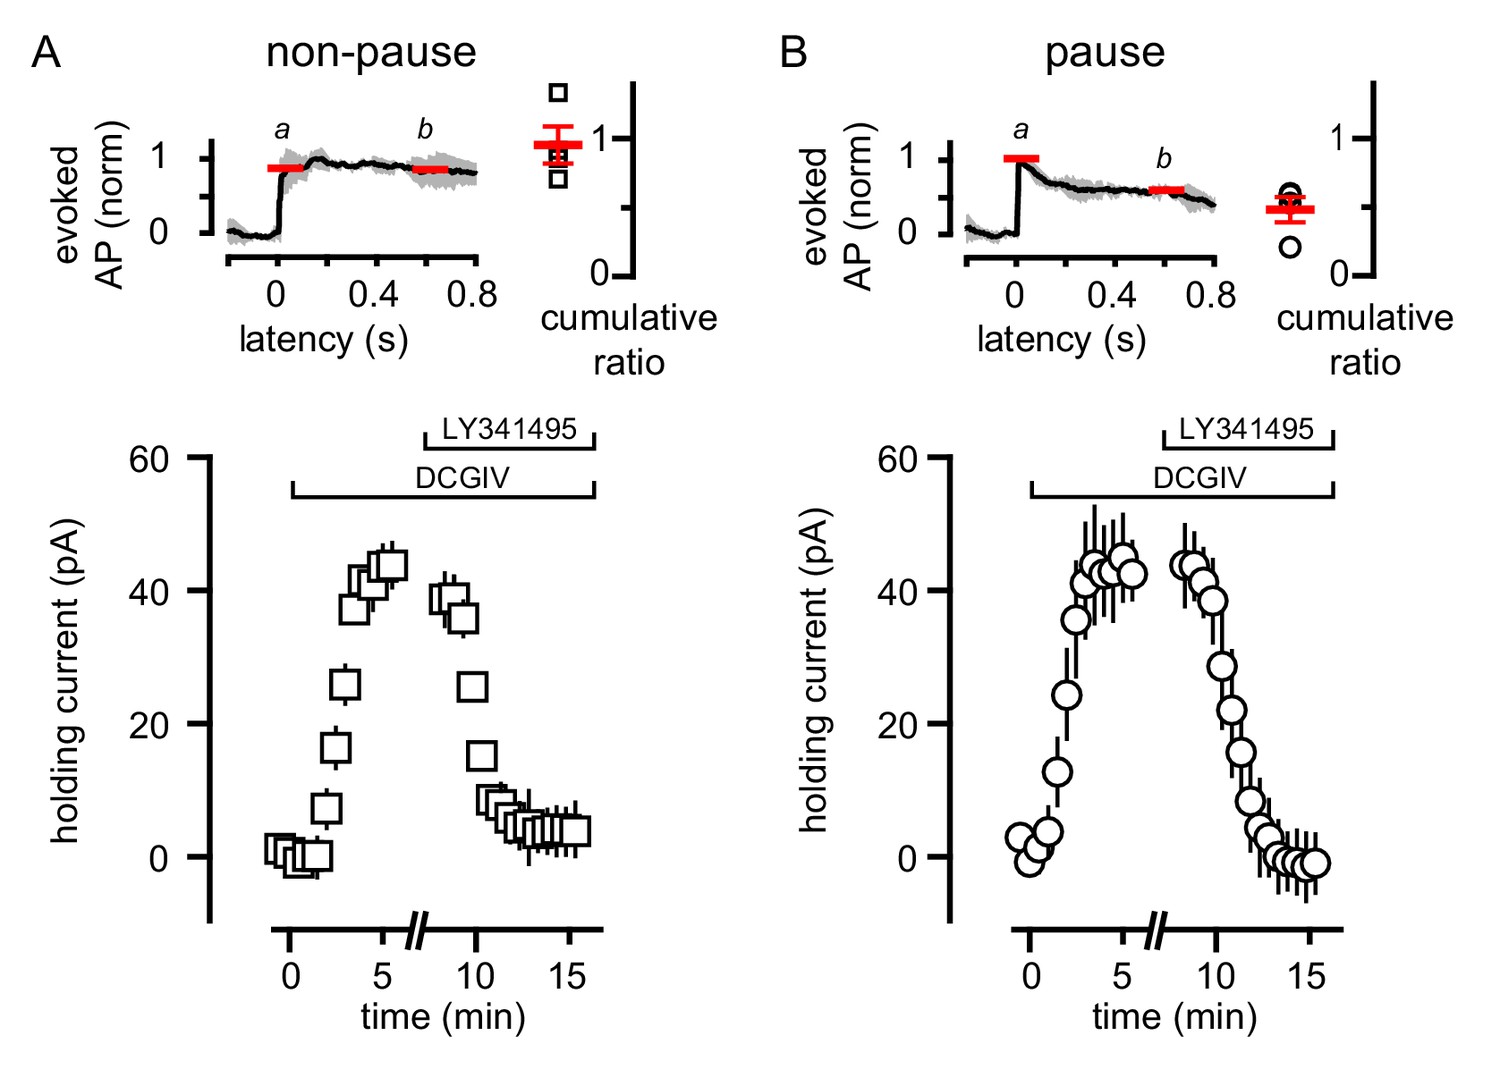
Variability of CF-mediated GoC pausing is not due to heterogeneous mGluR2 expression.
(A, top) Normalized average number of added APs in TBOA (±SEM in grey) and cumulative ratio in response to CF stimulation in non-pausing GoCs (0.96 ± 0.13, n = 4). (A, bottom) The average holding current (40 ± 4 pA, n = 4; baseline normalized to 0 pA) before and after bath application of DCG-IV (1 μM) and LY341495 (0.5 μM) in non-pausing cells. (B, top) Normalized average number of added APs in TBOA (±SEM in grey) and cumulative ratio in response to CF stimulation in pausing (0.48 ± 0.09, n = 4) GoCs. (B, bottom) The average holding current (41 ± 9 pA, n = 4; baseline normalized to 0 pA) before and after bath application of DCG-IV (1 μM) and LY341495 (0.5 μM). The average holding current was not significantly different in the two groups (p=0.8, unpaired t-test).
Figure 9
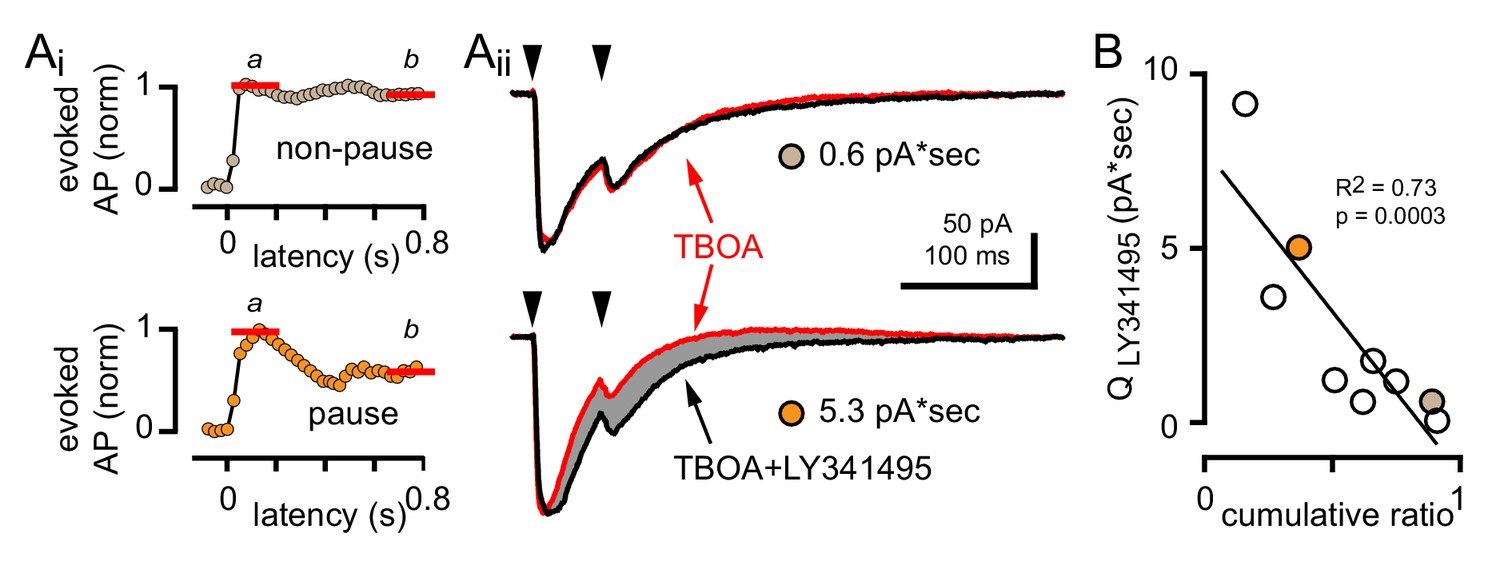
GoC pausing is correlated with a CF-evoked mGluR current.
(Ai, top and bottom) Representative cumulative spike probability plot (normalized) for a non-pausing and pausing GoC in the presence of TBOA. (Aii, top and bottom) Example traces of CF-EPSCs (red, 50 µM TBOA) and TBOA +LY341495 (50 µM + 0.5 μM, black) for a non-pausing GoC and pausing GoC. Gray shaded region illustrates the amount of charge reduction observed with LY341495 application (0.6 pA*sec and 5.3 pA*sec, respectively for the non-pausing and pausing GoC shown). (B) Negative relationship between the charge blocked by LY341495 versus the cumulative ratio for each GoC. The quantity of CF-EPSC charge blocked by the application of LY341495 was measured by calculating the difference between the EPSC traces in TBOA +LY341495 and TBOA alone (n = 9). Colored circles indicate example cells from (Aii).
Additional files
-
Transparent reporting form
- https://doi.org/10.7554/eLife.29215.018
Download links
A two-part list of links to download the article, or parts of the article, in various formats.
Downloads (link to download the article as PDF)
Open citations (links to open the citations from this article in various online reference manager services)
Cite this article (links to download the citations from this article in formats compatible with various reference manager tools)
Non-synaptic signaling from cerebellar climbing fibers modulates Golgi cell activity
eLife 6:e29215.
https://doi.org/10.7554/eLife.29215


