Regulated Ire1-dependent mRNA decay requires no-go mRNA degradation to maintain endoplasmic reticulum homeostasis in S. pombe
- Howard Hughes Medical Institute, Johns Hopkins School of Medicine, United States
- National Institute of Diabetes and Digestive and Kidney Diseases, National Institutes of Health, United States
- Howard Hughes Medical Institute, University of California, San Francisco, United States
- ETH Zurich, Switzerland
Figures
Figure 1 with 1 supplement

Genetic screen for factors involved in the unfolded protein response.
(A) A chemical genetic screen of a non-essential deletion library. Each strain is plotted against the log ratio of colony size with and without addition of the ER stress inducer tunicamycin (Tm). Significant sensitive or resistant genes were identified by a standard-score (z-score) >2 (blue line) or <−2 (red line), corresponding to colony sizes measuring more than two standard deviations from the mean. Strains of interest missing no-go or nonstop decay factors (red) and the unfolded protein response factor ire1 (green) are indicated. All tested strains are listed in Supplementary file 1. (B) Gene-ontology (GO) analysis of enriched sensitive or resistant genes. (C, D) Viability assay by serial dilution of either S. pombe or S. cerevisiae wild type, ire1Δ, dom34Δ, hbs1Δ, ski2Δ and ski7Δ cells spotted on solid media with or without Tm (S. pombe: 0.03 µg/ml; S. cerevisiae: 0.3 µg/ml). Plates were photographed after 3 days of growth at 30°C. Note that although ski2Δ cells did not form colonies upon plating on Tm-containing media, they survived long enough after DTT addition in liquid media to allow for the footprinting analyses performed in this work.
Figure 1—figure supplement 1
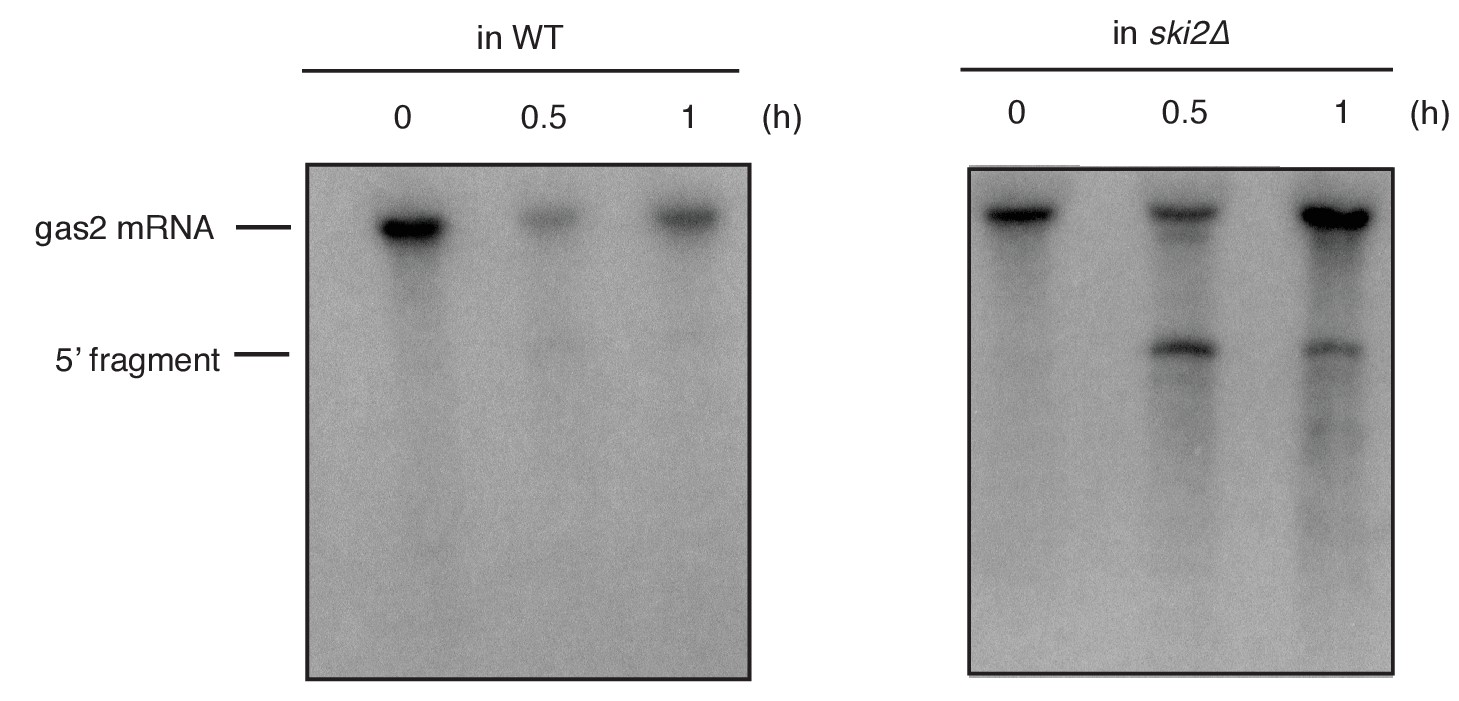
Northern blot analysis of total RNA extracted from wild type (WT) and ski2Δ mutant cells.
A time course after UPR induction by addition of the ER stress inducer DTT (2 mM) is shown. Cells contained an integrated reporter construct that contained the coding sequence of the RIDD substrate gas2 under the control of the nda2 (encoding tubulin) promoter and the 3’ untranslated region (UTR) of nda2. A probe complementary to the 5’ UTR of the gas2 reporter was used to detect cleavage products.
Figure 2 with 1 supplement
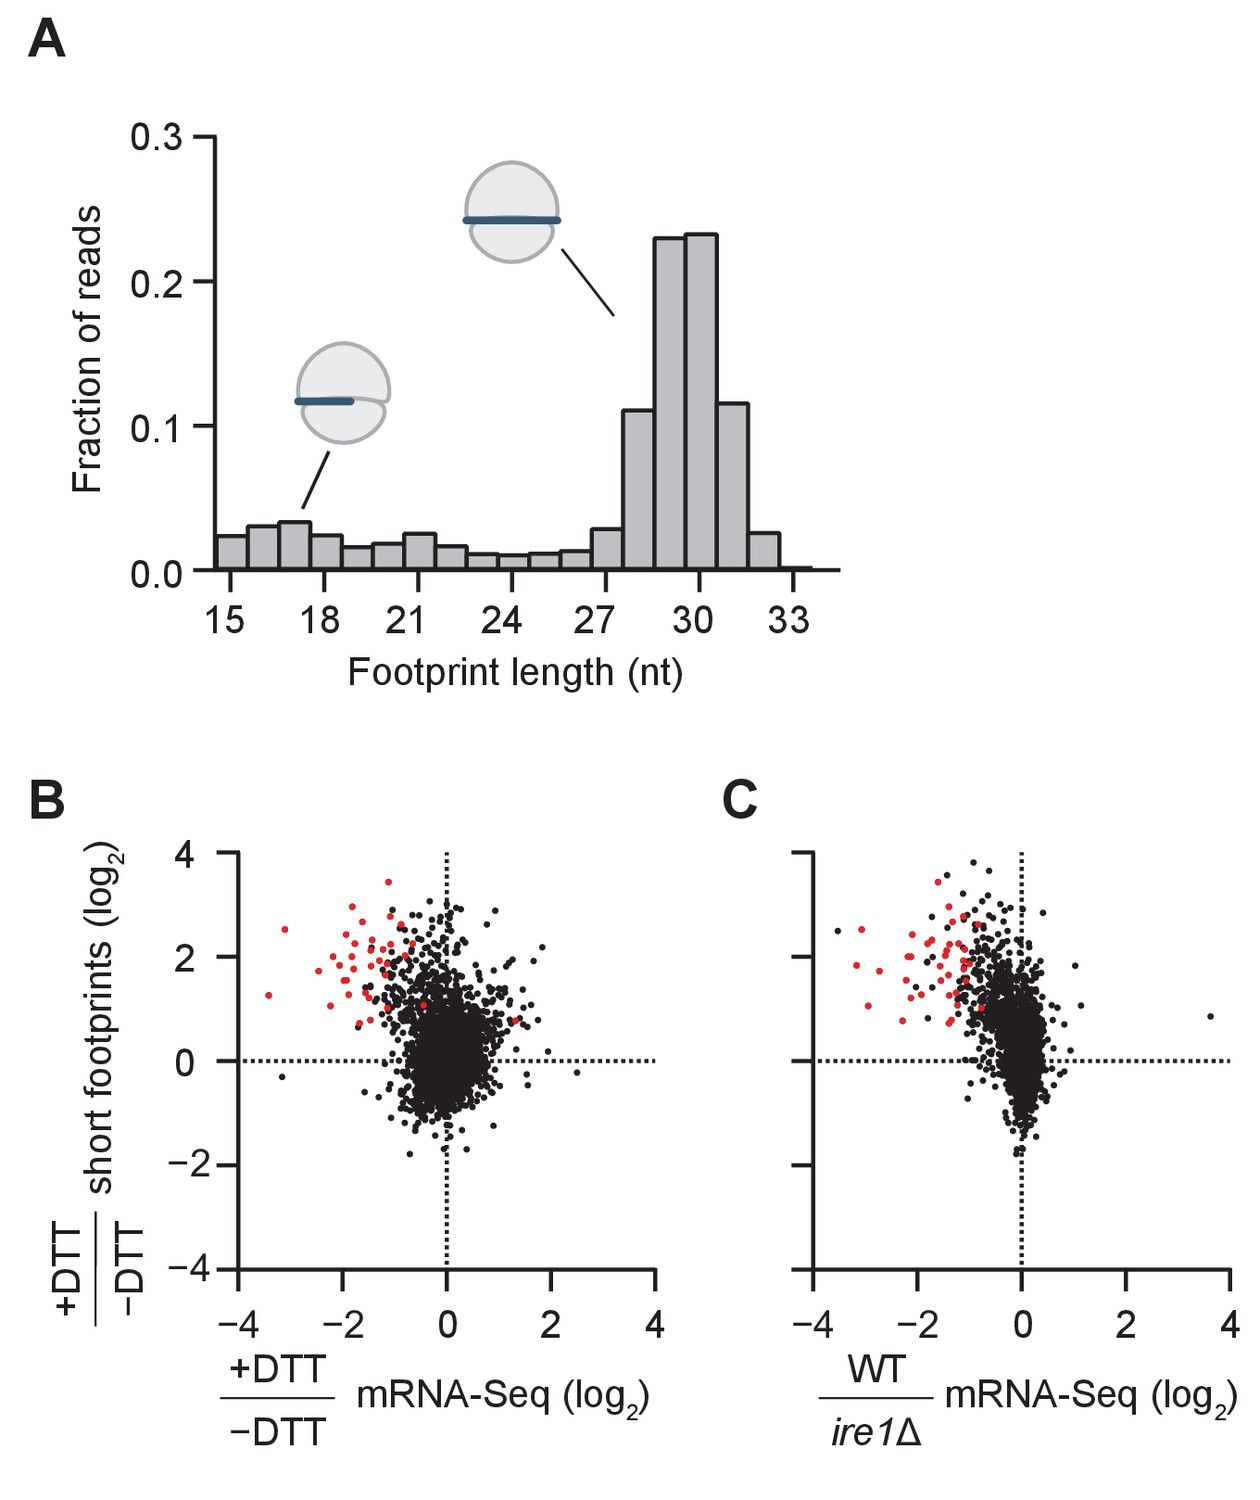
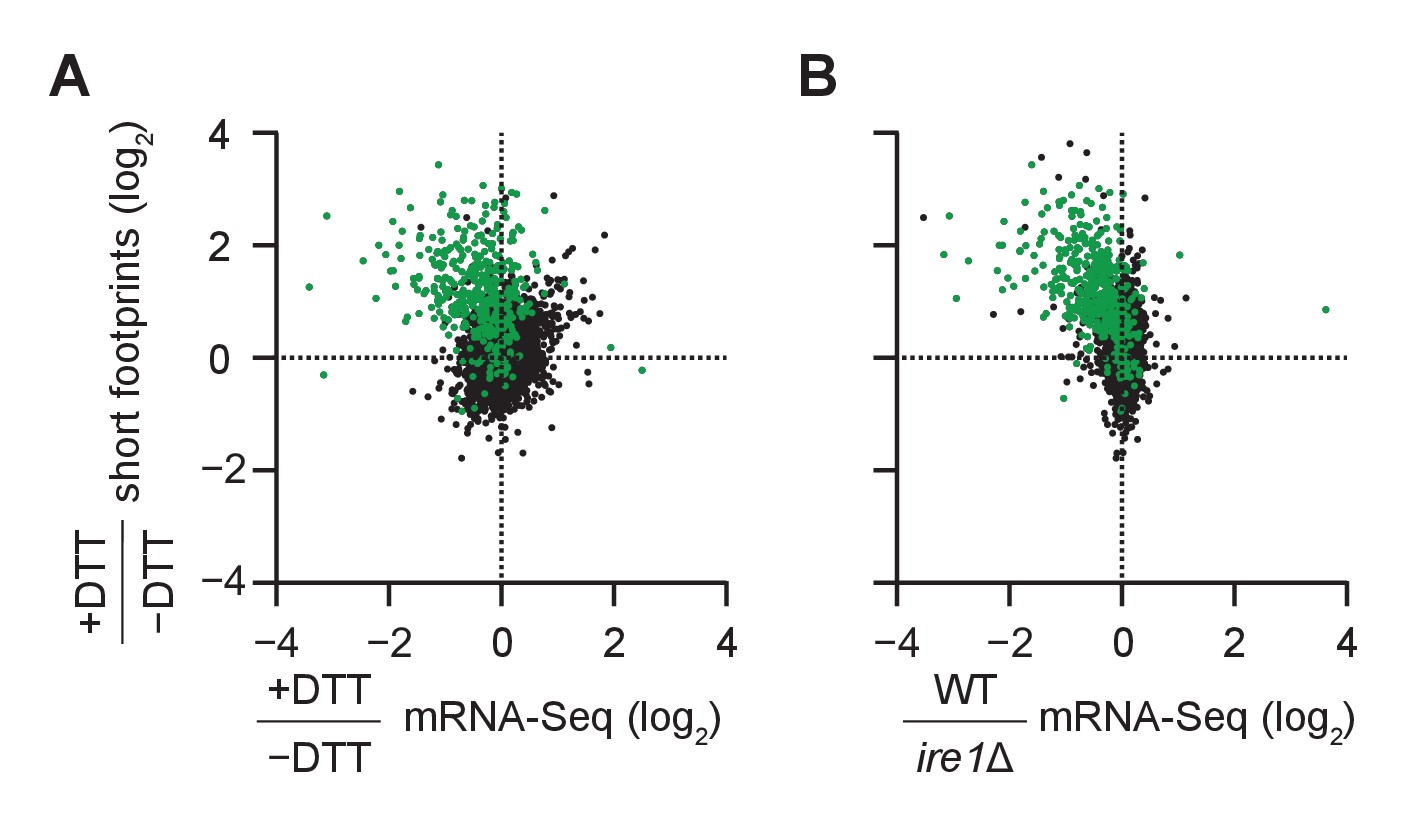
Short ribosome footprints are enriched on RIDD targets.
(A) Size distribution of ribosome footprints mapped without mismatches to the transcriptome for dom34Δ/ski2Δ in the presence of DTT. Short footprints on truncated mRNAs correspond to 15–18 nt reads (Guydosh and Green, 2014) and ribosomes with a fully-occupied mRNA channel correspond to 28–31 nt (Ingolia et al., 2009). The small peak at 21 nt corresponds to ribosomes in an alternate conformation (Lareau et al., 2014). (B) Comparison of gene enrichment ratio (+DTT/−DTT) for 15–18 nt footprint data in the dom34Δ/ski2Δ background (y-axis) and mRNA-Seq data (x-axis) under the same growth conditions in the WT background. (C) Comparison of the same short footprint data ratio (y-axis) against mRNA-Seq data (x-axis) for WT/ire1Δ under UPR induction. Annotation of 39 previously-identified RIDD mRNA targets (red dots in B and C) and WT/ire1Δ mRNA-Seq ratios (C) are from (Kimmig et al., 2012). Anti-correlated trends in B and C show that mRNAs degraded by RIDD (low mRNA-Seq ratios when DTT added or ire1 deleted) are enriched in stalled ribosomes (footprints), consistent with the prediction that cleavage sites created by Ire1 stall ribosomes on short (15–18 nt) footprints.
Figure 2—figure supplement 1
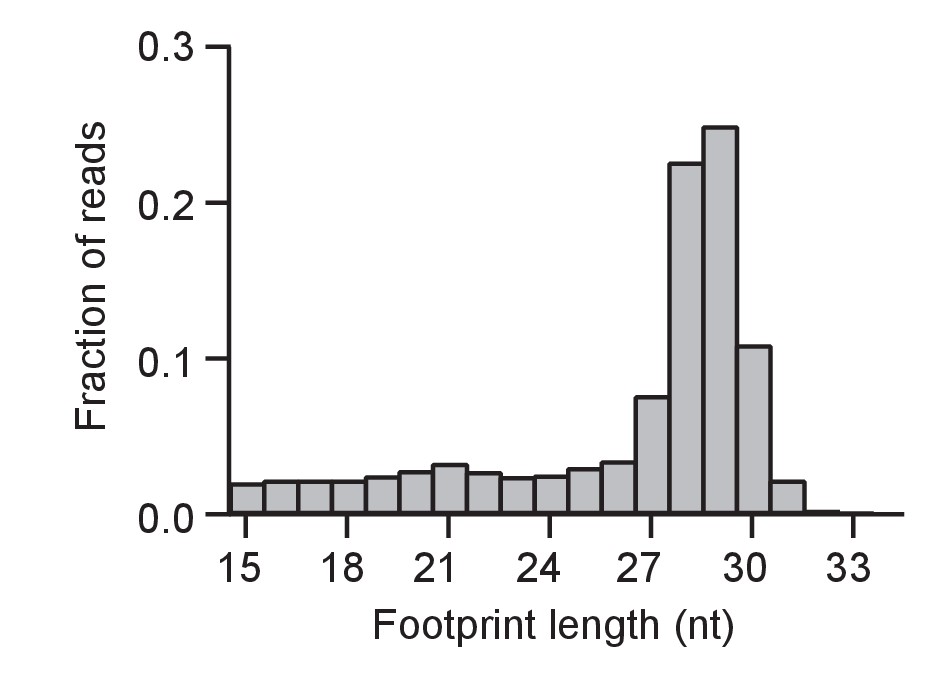
Size distribution of ribosome footprints as in Fig.
Figure 2A for a baseline control (WT cells without DTT).
Figure 3 with 3 supplements
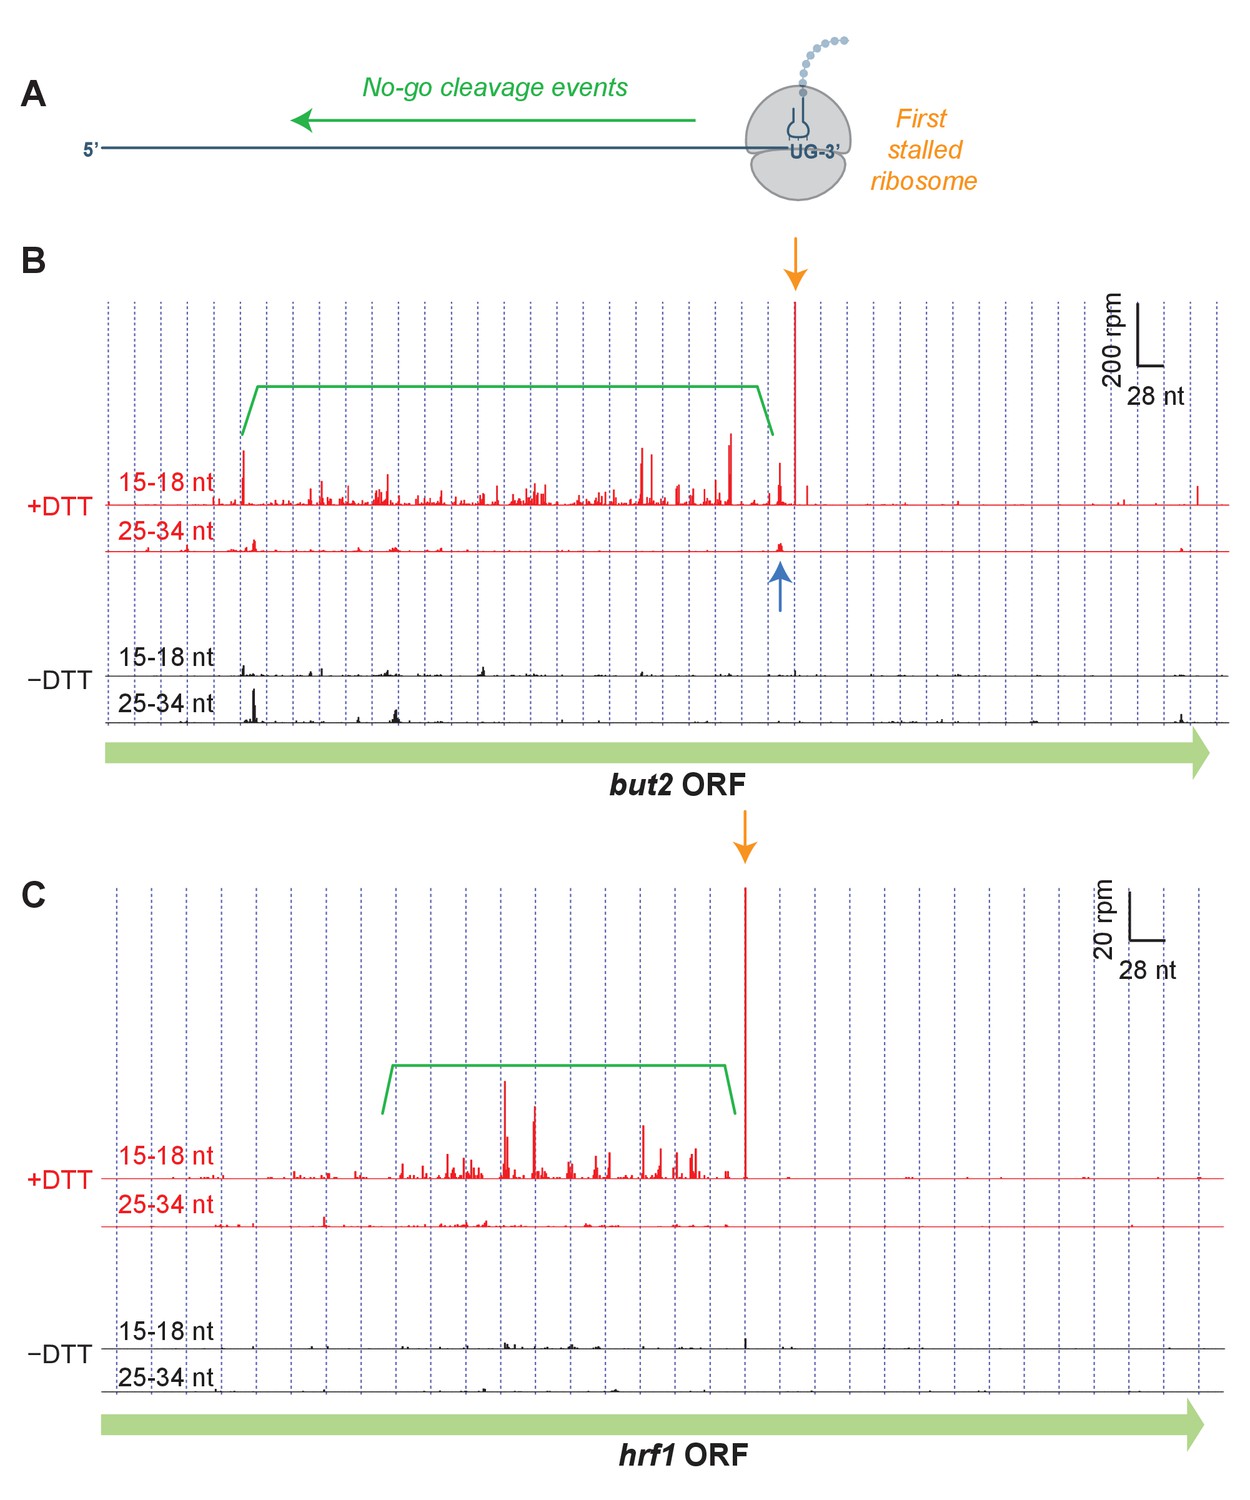
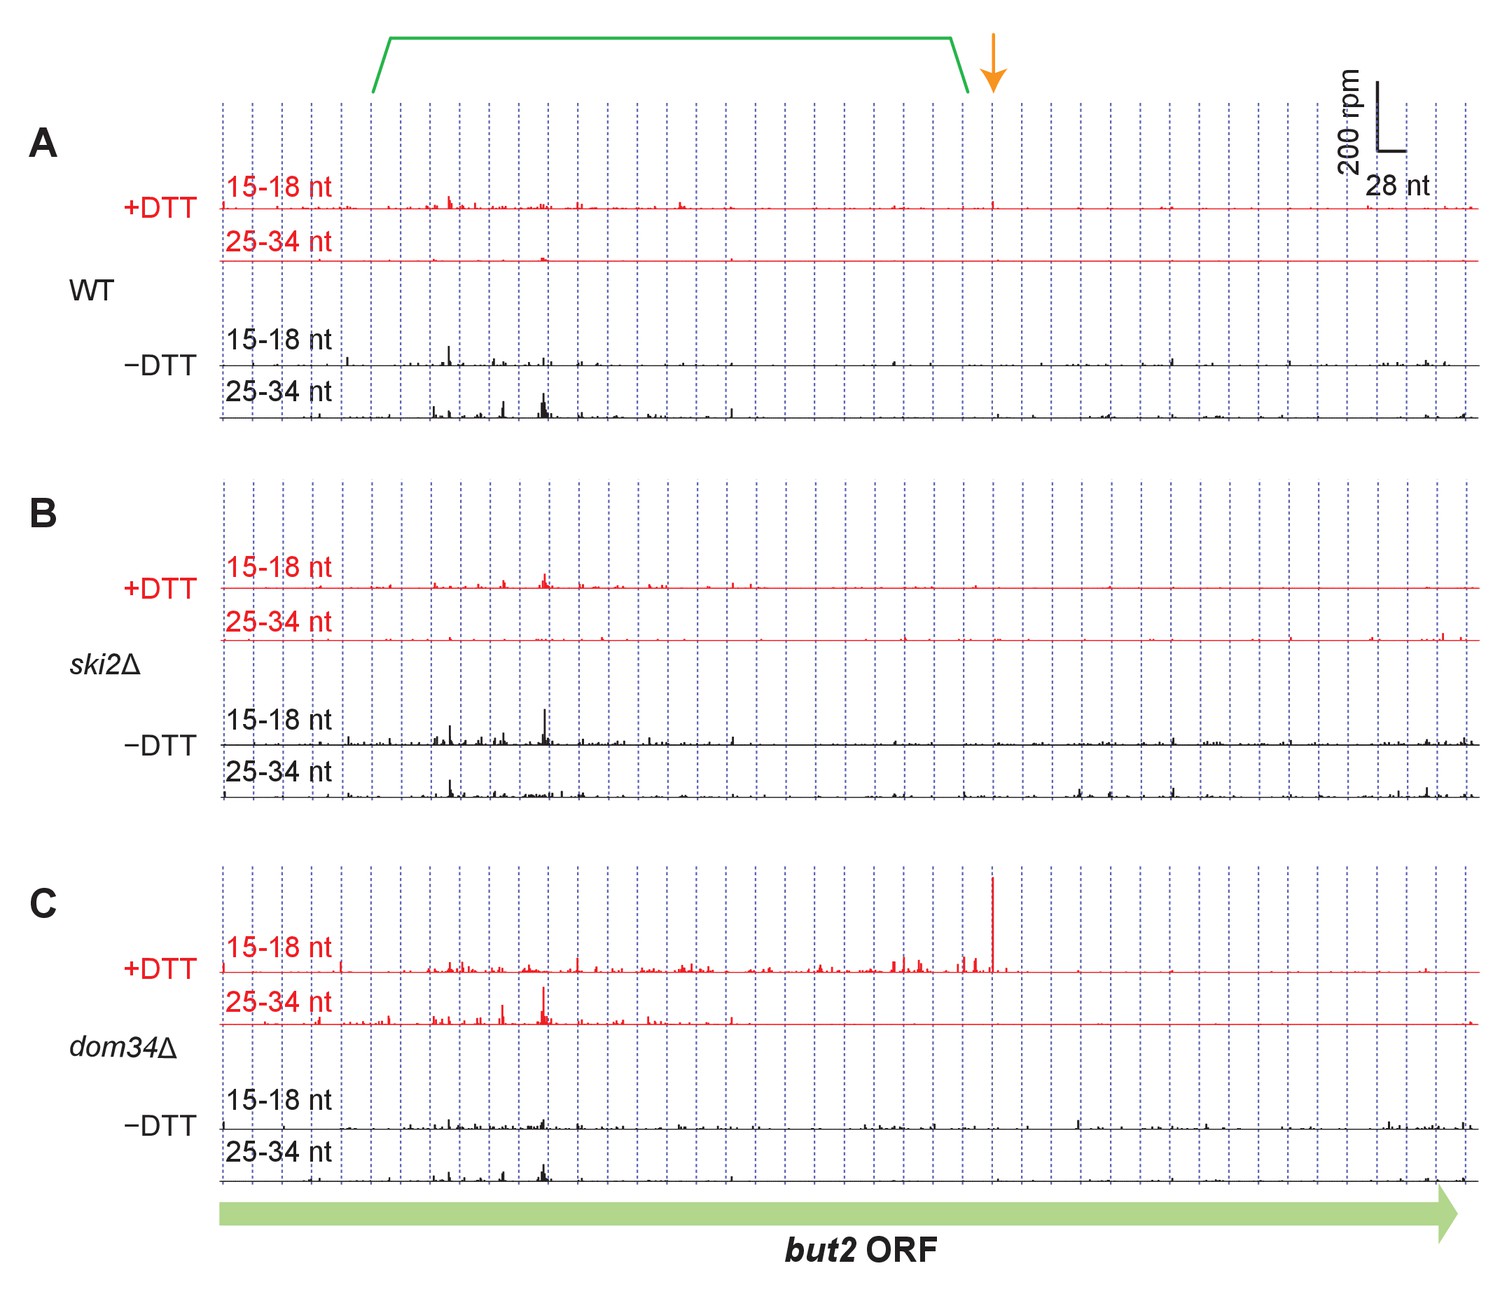
Short read alignments to individual example genes reveal no-go decay.
(A) Model for how Ire1 cleavage leads to ribosome stalling when the 3’ UG is positioned in the A site. This stalled ribosome triggers upstream cleavage of the mRNA (no-go decay, green arrow). These upstream cleavages are expected to, in turn, stall additional ribosomes. (B) Example of (3’ end assignment) ribosome profiling data from the dom34Δ/ski2Δ strain on the gene but2. The data show an initial Ire1-mediated cleavage at a UG/C site (orange arrow). Upstream cleavage events (no-go decay) are evident as peaks in the short-footprint data (ribosomes stalled on truncated mRNA ends) in the presence of DTT (green bracket). The peak in the long-read data (blue arrow) suggests a ‘disome’ structure forms when an upstream ribosome runs into the ribosome stalled on the 3’ terminal UG. (C) Same as (B) but for the gene hrf1.
Figure 3—figure supplement 1
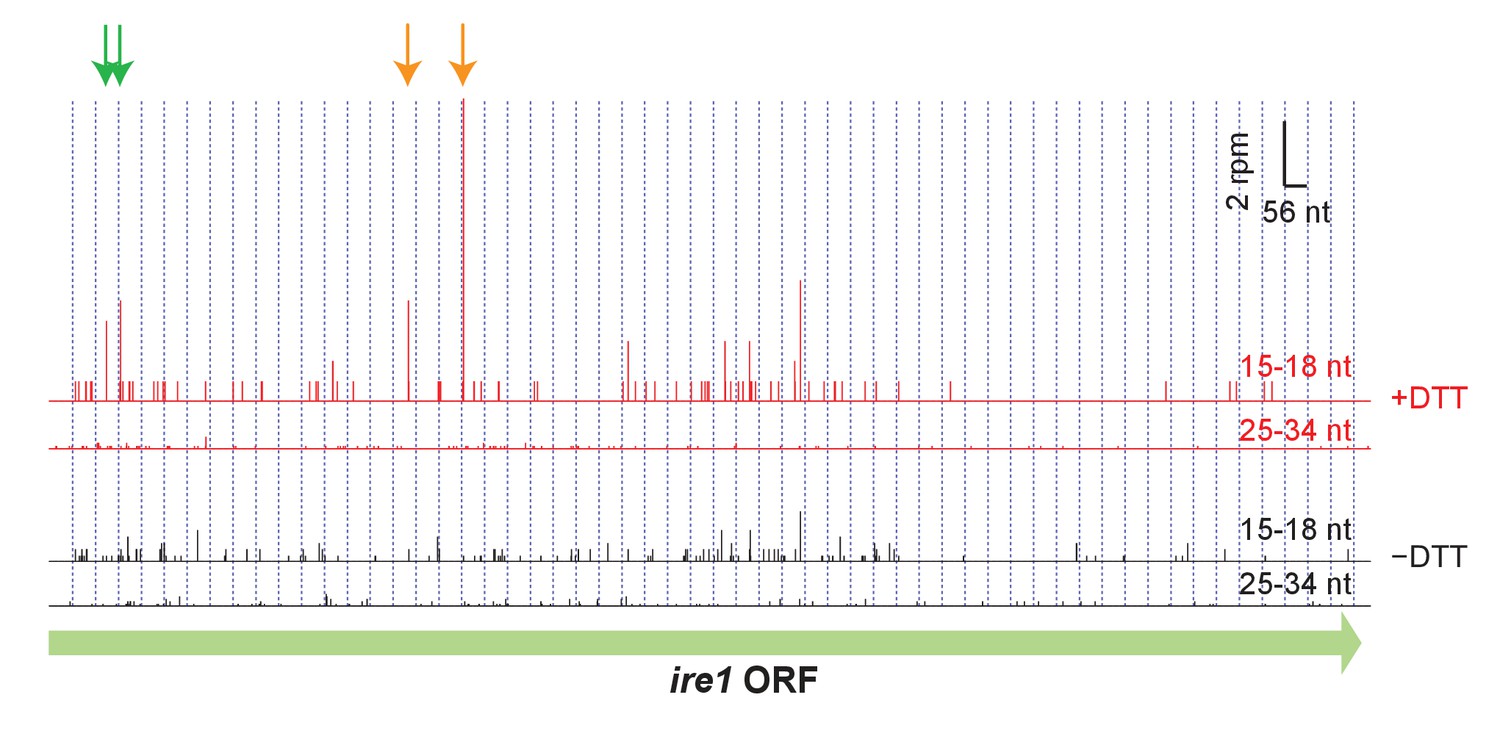
Footprint data (3’ end assignment) from the dom34Δ/ski2Δ strain on the gene ire1.
Detected cleavage sites (arrows) are indicated at UG/C motifs (orange) and non-UG/C motifs (green). The presence of cleavage sites is consistent with Ire1 degrading its own transcript.
Figure 3—figure supplement 2
Read alignment to an example gene in different strain backgrounds.
(A–C) Same as Fig. Figure 3B but showing additional datasets for but2. For reference, annotation of the original stall site and upstream NGD cleavage in Figure 3B have been retained.
Figure 3—figure supplement 3
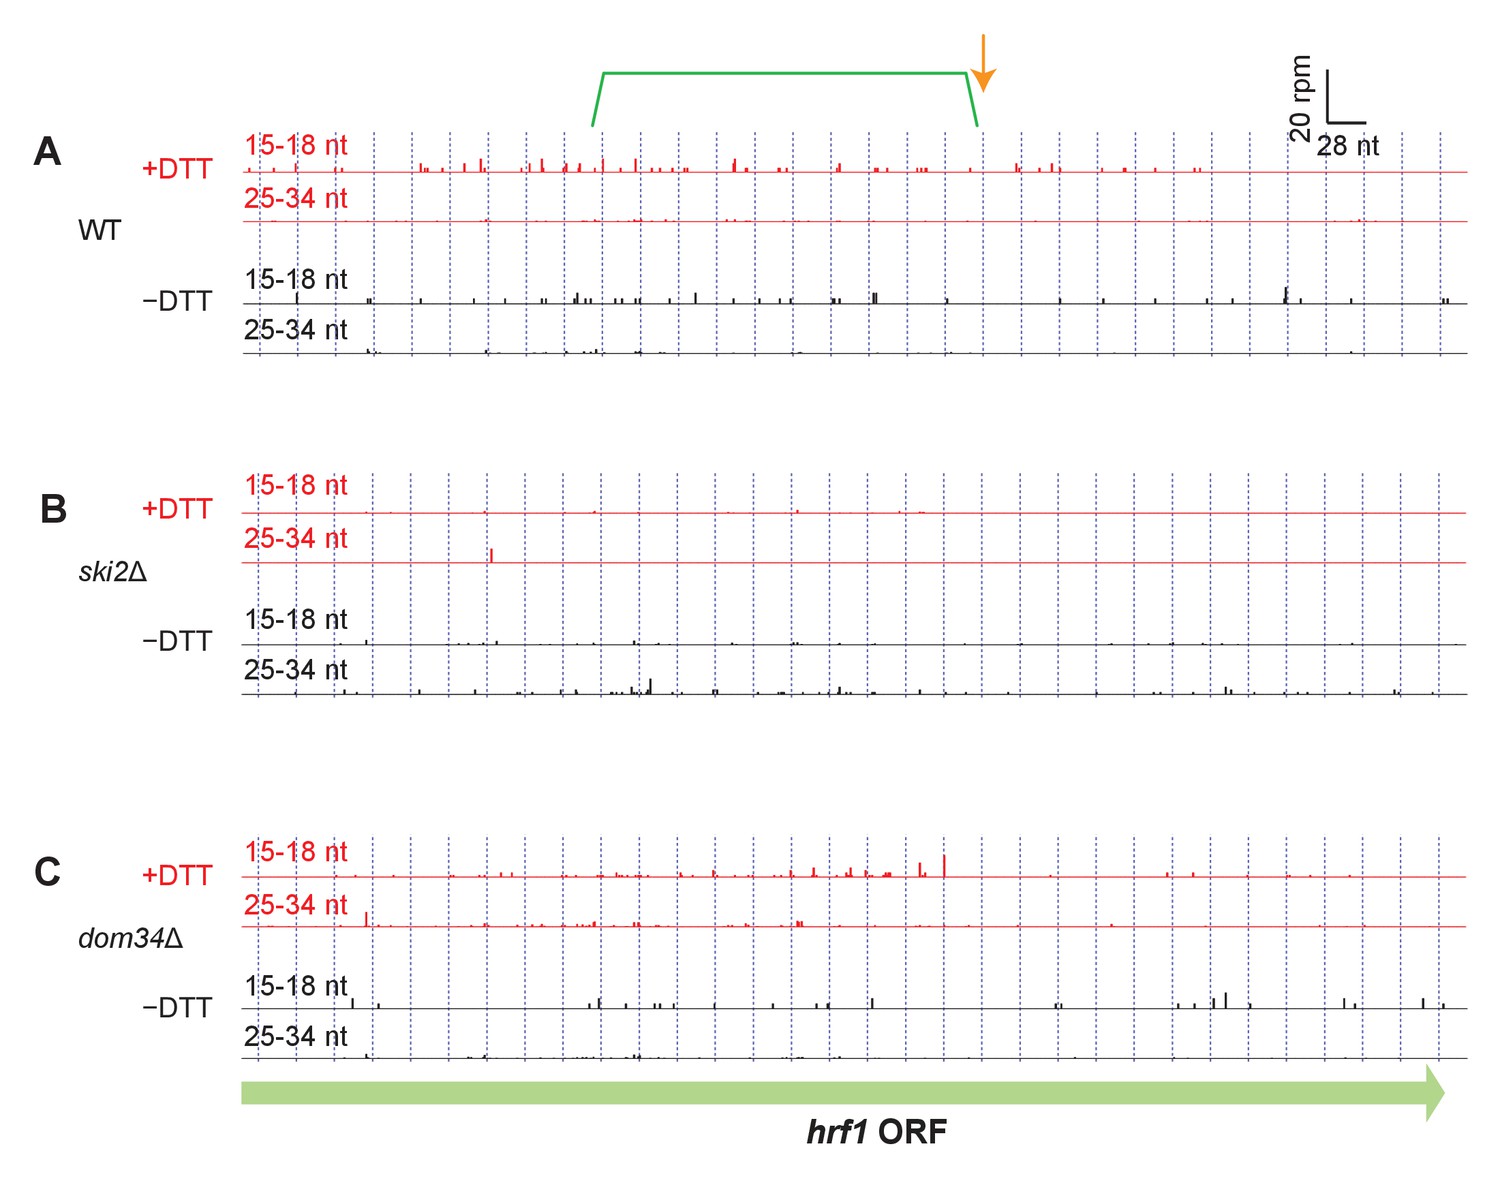
Read alignment to an example gene in different strain backgrounds.
(A–C) Same as Figure 3C but showing additional datasets for hrf1. For reference, annotation of the original stall site and upstream NGD cleavage in Figure 3B have been retained.
Figure 4 with 1 supplement

Identification of novel mRNA cleavage sites generated by the UPR.
(A) Histograms of short-read footprint density at individual nucleotide positions across the transcriptome in conditions of +DTT and −DTT in the dom34Δ/ski2Δ strain. Counts above dotted line represent loci where reads enrich >10 fold when DTT was added, the threshold used, in part, to identify Ire1 cleavage sites in all downstream analysis. Data for UG/C and non-UG/C sites are separated (left and center panels, respectively), revealing that stalled ribosomes tend to enrich at UG/C sites more than non-UG/C sites (more counts above green line). In addition, UG/C sites from 38 cleavage sites (corresponding to 23 mRNAs) previously identified (Kimmig et al., 2012) to be Ire1 targets by 2’, 3’-cyclic phosphate sequencing are shown (provided they meet a 1.5 rpm minimal threshold) for reference (right panel) and serve as a positive control for our method. (B) Breakdown of all identified cleavage sites by nucleotide motif (pie chart) and analysis of the 471 transcripts to which the UG/C sites map (right). Most (91%) mRNAs with a UG/C cleavage site are associated with the endoplasmic reticulum, as expected for Ire1 targets (purple bar). In addition, 85% of the most downstream cleavage sites on these transcripts corresponded to a UG/C site, consistent with the proposed no-go decay mechanism (orange bar).
Figure 4—figure supplement 1
Transcriptome mapping of genes with cleavage sites.
(A) Same as Figure 2B but showing the new 471 mRNA targets of Ire1 in green. (B) Same as Figure 2C but showing the new 471 mRNA targets of Ire1 in green. For both B and C, clustering of new targets was similar to previously identified (red) targets in Figure 2B–C.
Figure 5
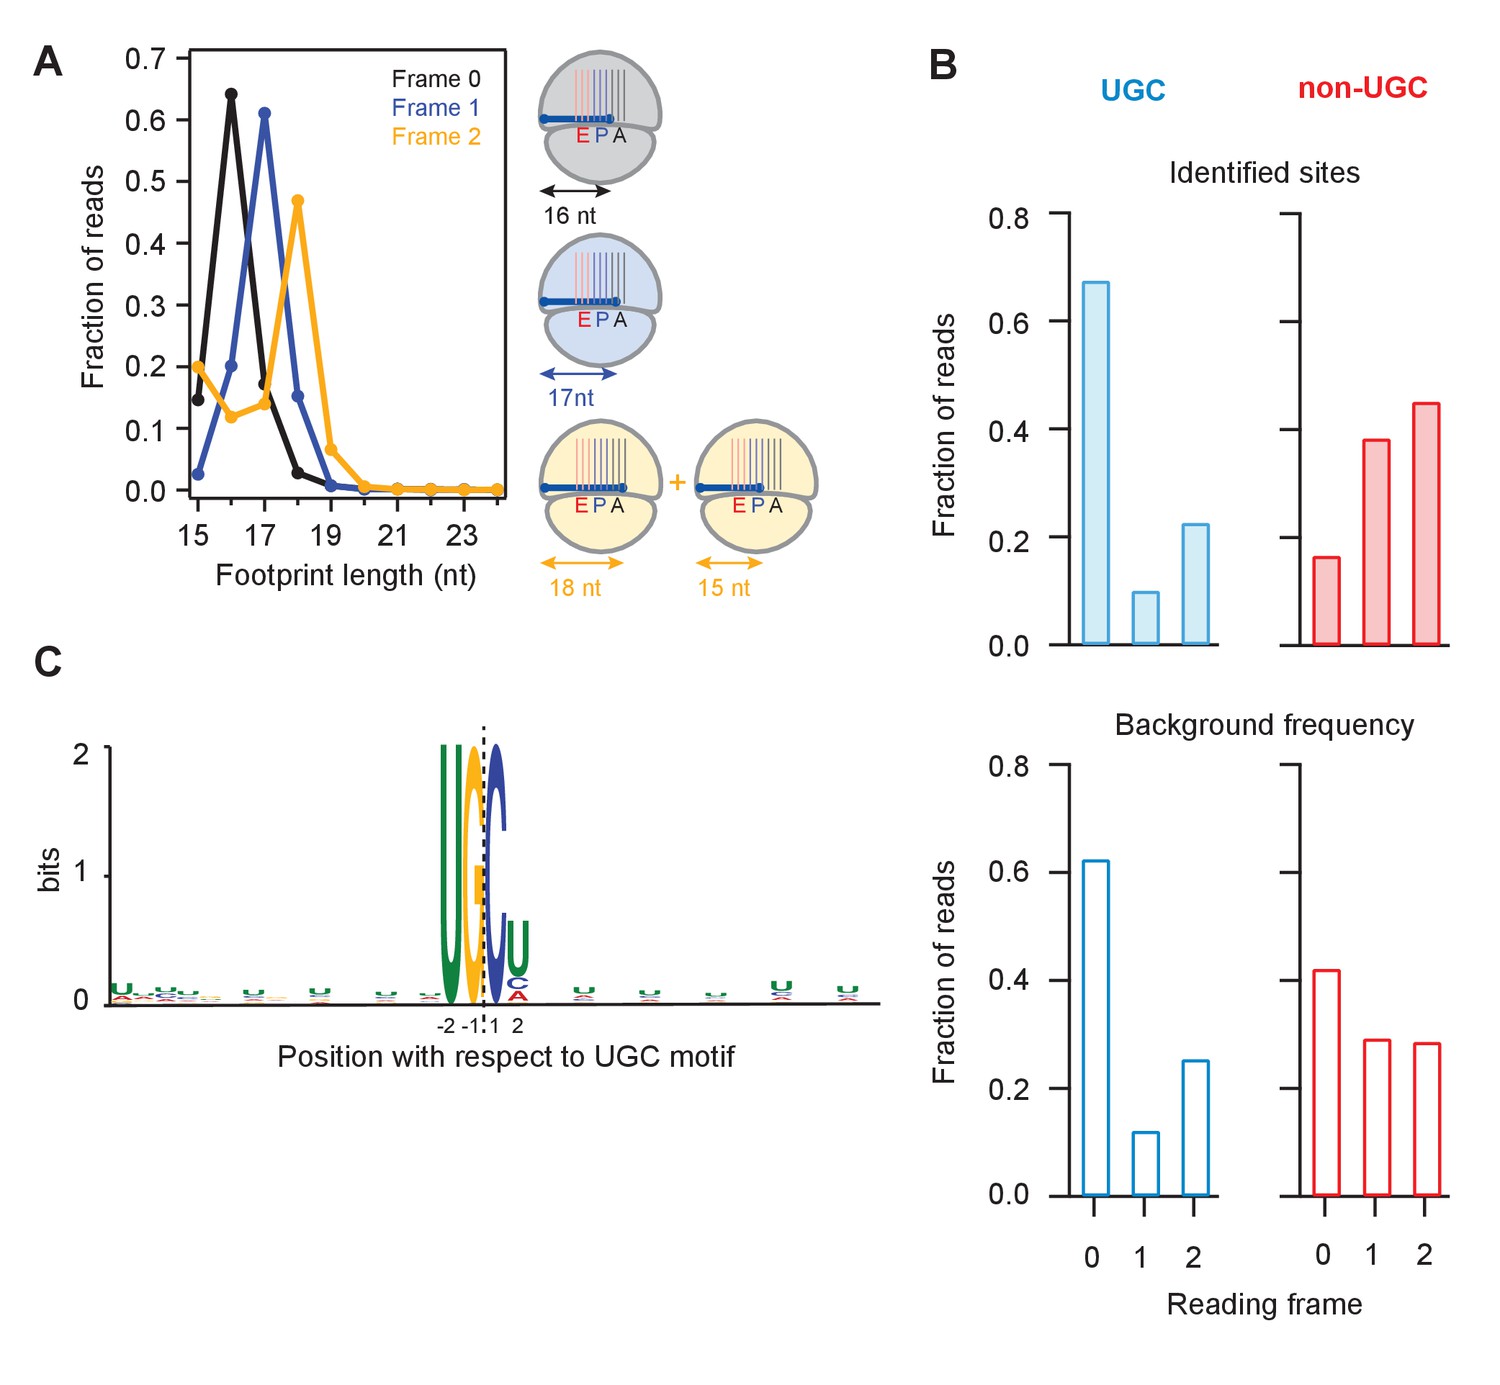
Analysis of frame and sequence context of cleavage sites.
(A) Analysis of footprint sizes from reads that map to the library of 24-nt sequences immediately upstream of strong UG/C cleavage sites (pause score >100 in the presence of DTT) found in frames 0, 1, or 2. The peak position changes according to frame because the ribosome, which protects the footprints, moves in 3-nt increments. When UG/C is in frame 2 (all 3 nucleotides in the A site and footprint size measures 18 nt), about 1/3 of ribosomes manage to move forward, positioning UG/C in the P site and shortening the footprint to 15 nt. From previous work, we know that the A site of the ribosome lies 16–18 nt from the 5’ end of the footprint (Ingolia et al., 2009). (B) Reading frame of the terminal base for strong UG/C cleavage sites (blue, due to Ire1) and non-UG/C sites (red, due to mostly to no-go decay) identified with pause score >100 with DTT present (top). Background reading frame frequency of these motifs in the transcriptome is shown for reference (bottom). (C) Motif analysis using MEME (Bailey et al., 2009), of all identified UG/C cleavage sites in frame 0 shows little outside sequence context.
Figure 6 with 1 supplement
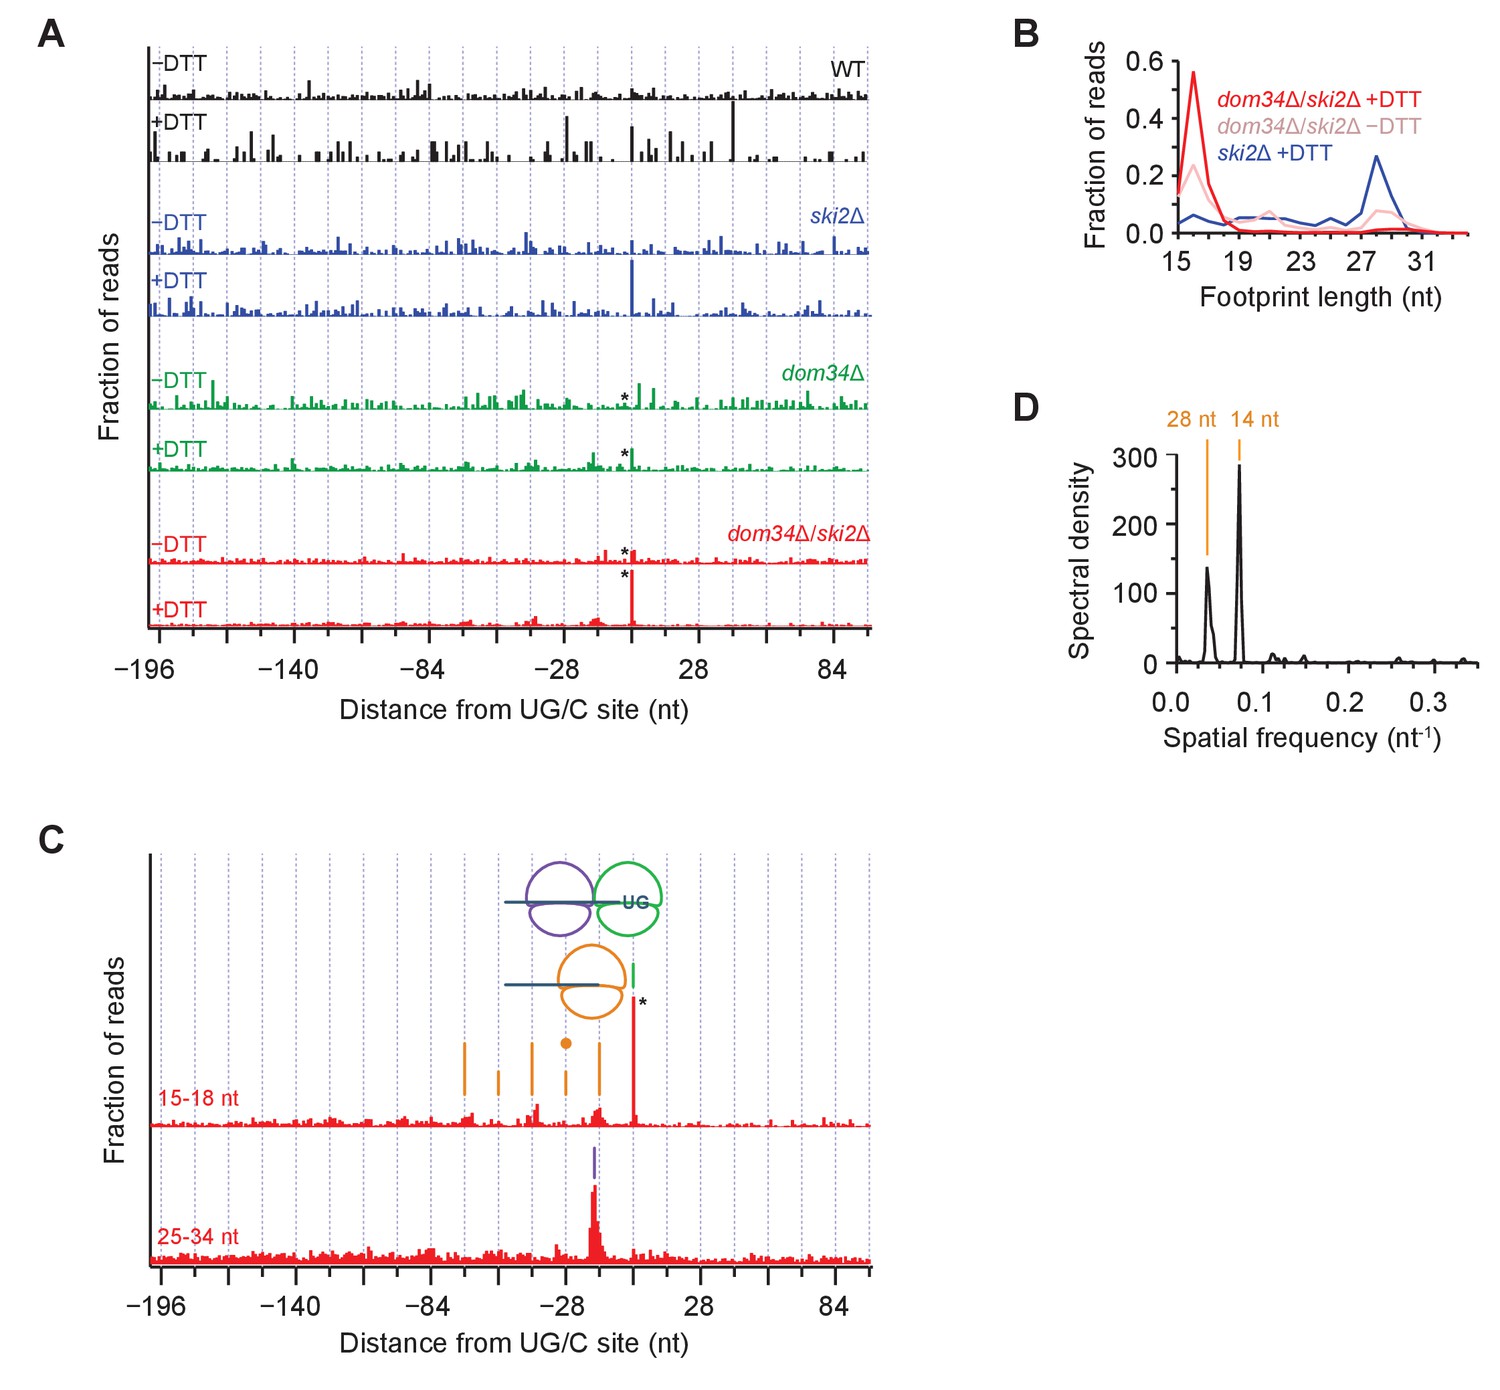
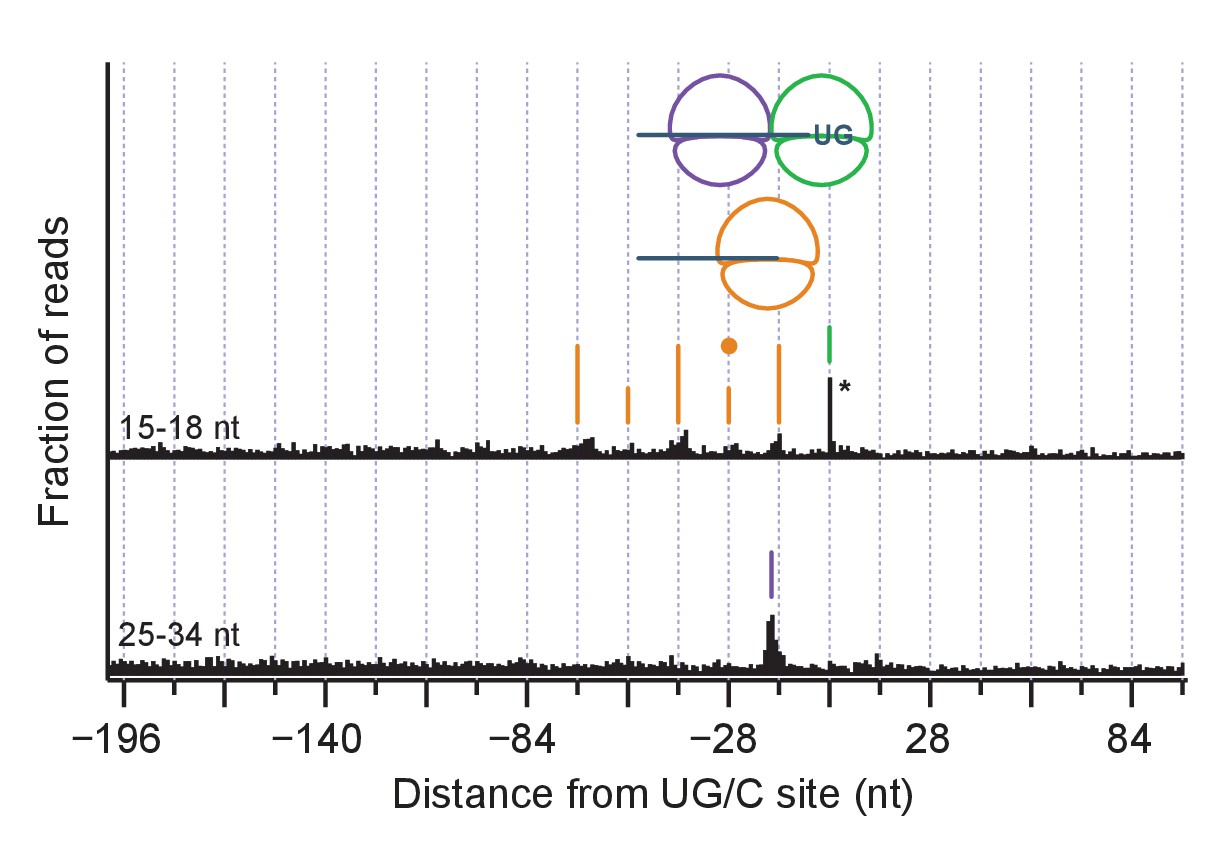
Average ribosome positioning during no-go decay across strain backgrounds.
(A) Average short ribosome footprint density (3’ end assignment) at identified UG/C sites in frame 0 for multiple strains. Only cleavage sites with pause scores > 200 in presence of DTT and at least 10 rpm of read density in presence of DTT are included to improve resolution. Analysis of data in frame 1 or frame 2 separately appeared similar but was not included here because the variation in footprint size by frame (Figure 5A) tends to blur the peaks. Note that * indicates peak height reduced 10x for space constraints. Knockout of dom34 and ski2, as well as addition of DTT, all enhance observation of ribosome stalling at UG/C sites (position 0). (B) Size analysis of short footprints that map to the 34-nt region immediately upstream of strong UG/C sites (pause score >100) in frame 0 shows that the 15–18 nt reads are preferred over background reads more strongly in the presence of DTT and absence of dom34. (C) Same as (A) for dom34Δ/ski2Δ in the presence of DTT for 15–18 nt and 25–34 nt footprints. Stalled ribosome peak at initial Ire1 cleavage site is indicated (green line). Upstream peaks at 14-nt intervals show evidence of ribosome stalling at no-go decay cleavage events (orange lines). Density at alternating 14-nt intervals is reduced (short orange lines) due to formation of a disome that protects the mRNA. In particular, the first short orange line upstream of the UG/C site (marked with orange dot) is protected by the disome shown in the cartoon. Direct evidence of disome formation is visible as a peak in the 25–34 nt footprint data located ~16 nt upstream of the UG/C cleavage site (purple line). Note that * indicates peak height was reduced 10x for space constraints. (D) Power spectrum of the autocorrelation of data in the region 200 nt upstream of the short footprint data in (C). Peaks at 14 nt and 28 nt are consistent with the alternating 14-nt intensity shown in (C). The stronger amplitude of the 14-nt peak reveals that majority of cleavage pattern is due to monosome formation. The smaller peak at 28 nt shows the contribution of disomes.
Figure 6—figure supplement 1
Same as Figure 6C but for all identified cleavage sites.
The reduction in the amplitude of 14-nt peak alternation is consistent with less disome formation due to the inclusion of weaker stall sites.
Figure 7
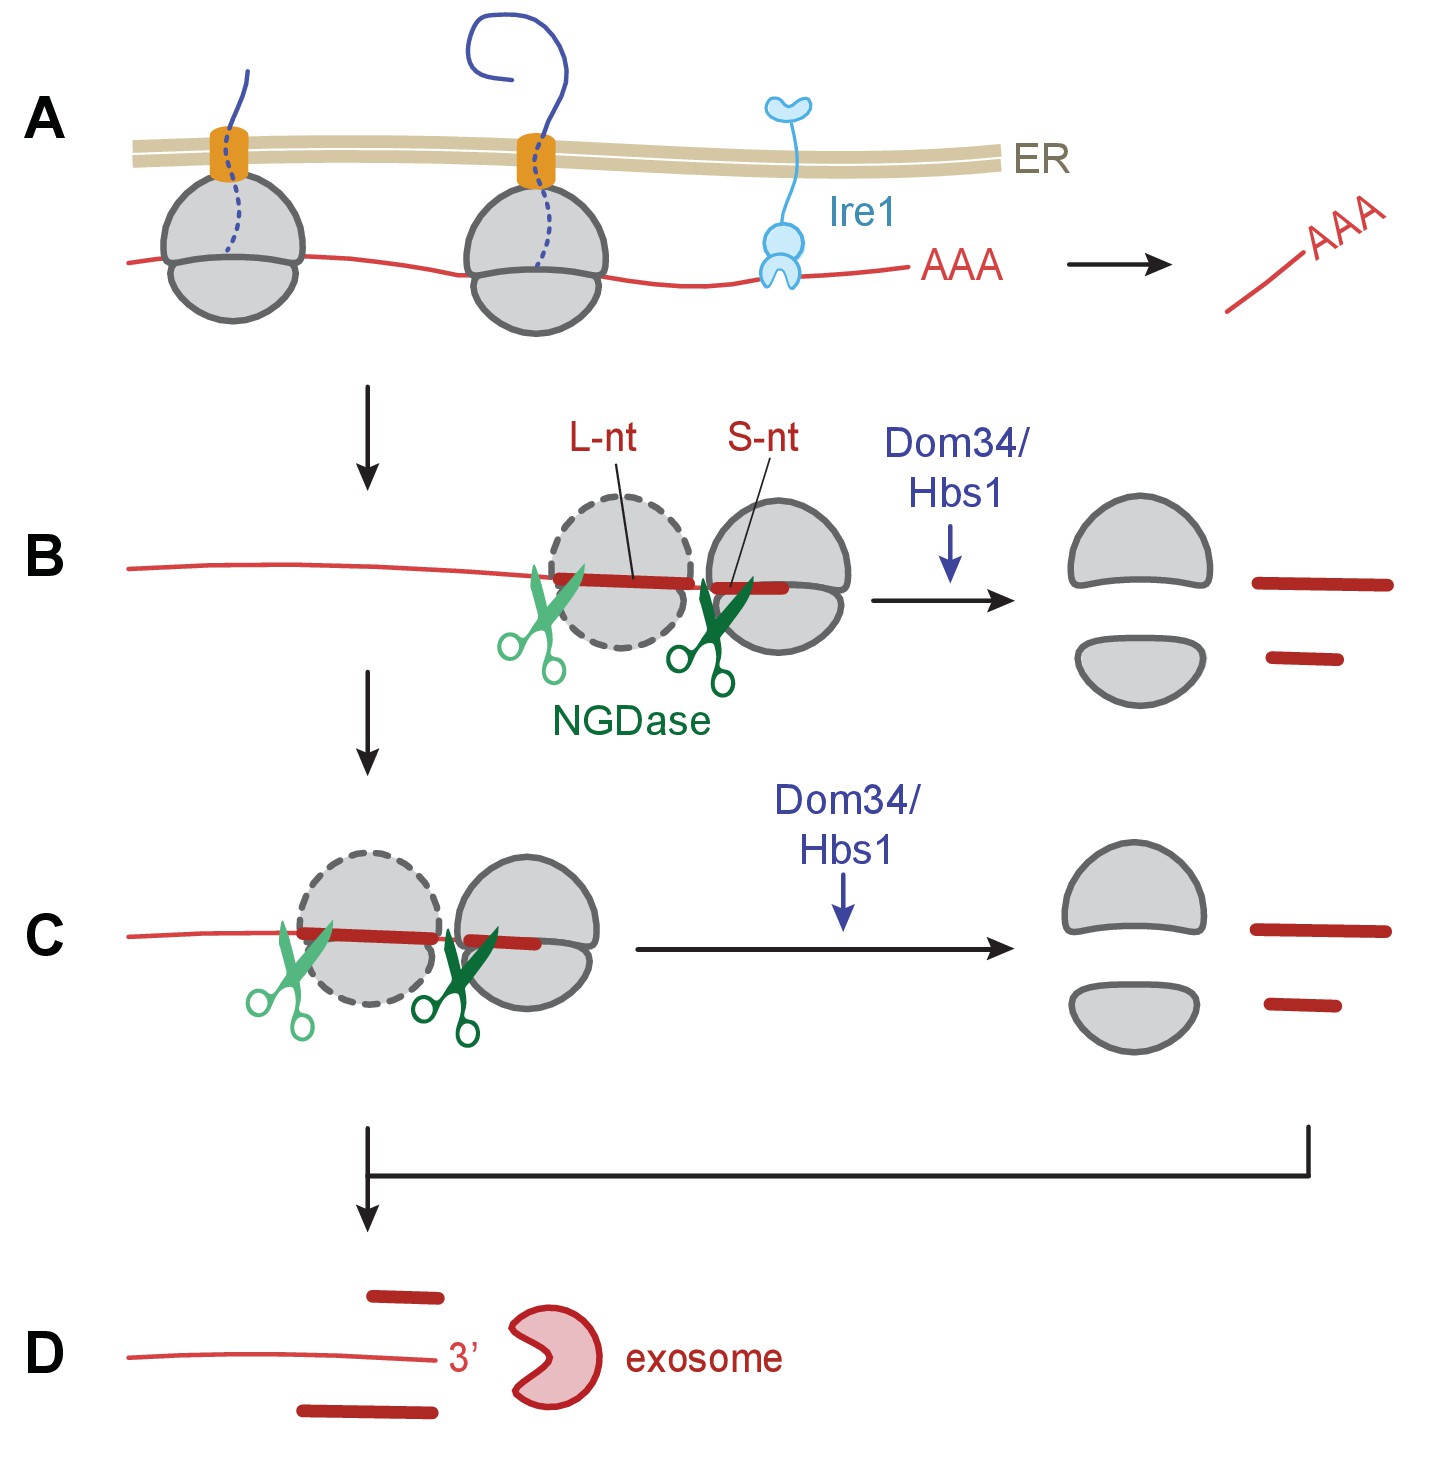
Model of Ire1 mRNA cleavage of leading to no-go decay.
(A) Initial Ire1 cleavage of a target mRNA at UG/C sites within the open reading produces a truncated mRNA lacking its poly(A) tail. (B) Ribosomes continue to elongate until they reach the end of mRNA fragment and stall with an empty A-site. The stalled ribosome recruits NGDase, which cleaves the mRNA immediately upstream of the ribosome as part of the no-go decay process. Dom34/Hbs1 then recycle the ribosome. In their absence, ribosomes protect a short nucleotide (‘S-nt’), which we identify experimentally. If NGDase cleavage is slow enough to allow another ribosome to stack onto the leading one, a disome is formed. The trailing ribosome protects a long nucleotide (‘L-nt’). The tendency to form disomes (or perhaps even larger stacks) in vivo will depend on the relative kinetics governing elongation, NGDase cleavage, and ribosome recycling. (C) The process can repeat as more ribosomes arrive at newly generated 3’ ends. (D) Finally, the exosome degrades the mRNA fragments and any intact piece of 5’ mRNA that do not have a stalled ribosome protecting their 3’ end. For clarity, the ER membrane and nascent peptides are not shown in panels B–D.
Additional files
-
Supplementary file 1
Growth of mutants in chemical genomic screen.
- https://doi.org/10.7554/eLife.29216.017
-
Supplementary file 2
List of identified Ire1 cleavage sites, including positional read count, pause score, and mRNA-Seq data for the gene.
- https://doi.org/10.7554/eLife.29216.018
-
Supplementary file 3
Yeast strains and plasmids used in this study.
- https://doi.org/10.7554/eLife.29216.019
-
Supplementary file 4
Source code for custom scripts used in this study.
- https://doi.org/10.7554/eLife.29216.020
-
Transparent reporting form
- https://doi.org/10.7554/eLife.29216.021
Download links
A two-part list of links to download the article, or parts of the article, in various formats.
Downloads (link to download the article as PDF)
Open citations (links to open the citations from this article in various online reference manager services)
Cite this article (links to download the citations from this article in formats compatible with various reference manager tools)
Regulated Ire1-dependent mRNA decay requires no-go mRNA degradation to maintain endoplasmic reticulum homeostasis in S. pombe
eLife 6:e29216.
https://doi.org/10.7554/eLife.29216


