Gyrification of the cerebral cortex requires FGF signaling in the mammalian brain
- Kanazawa University, Japan
Figures
Figure 1 with 4 supplements
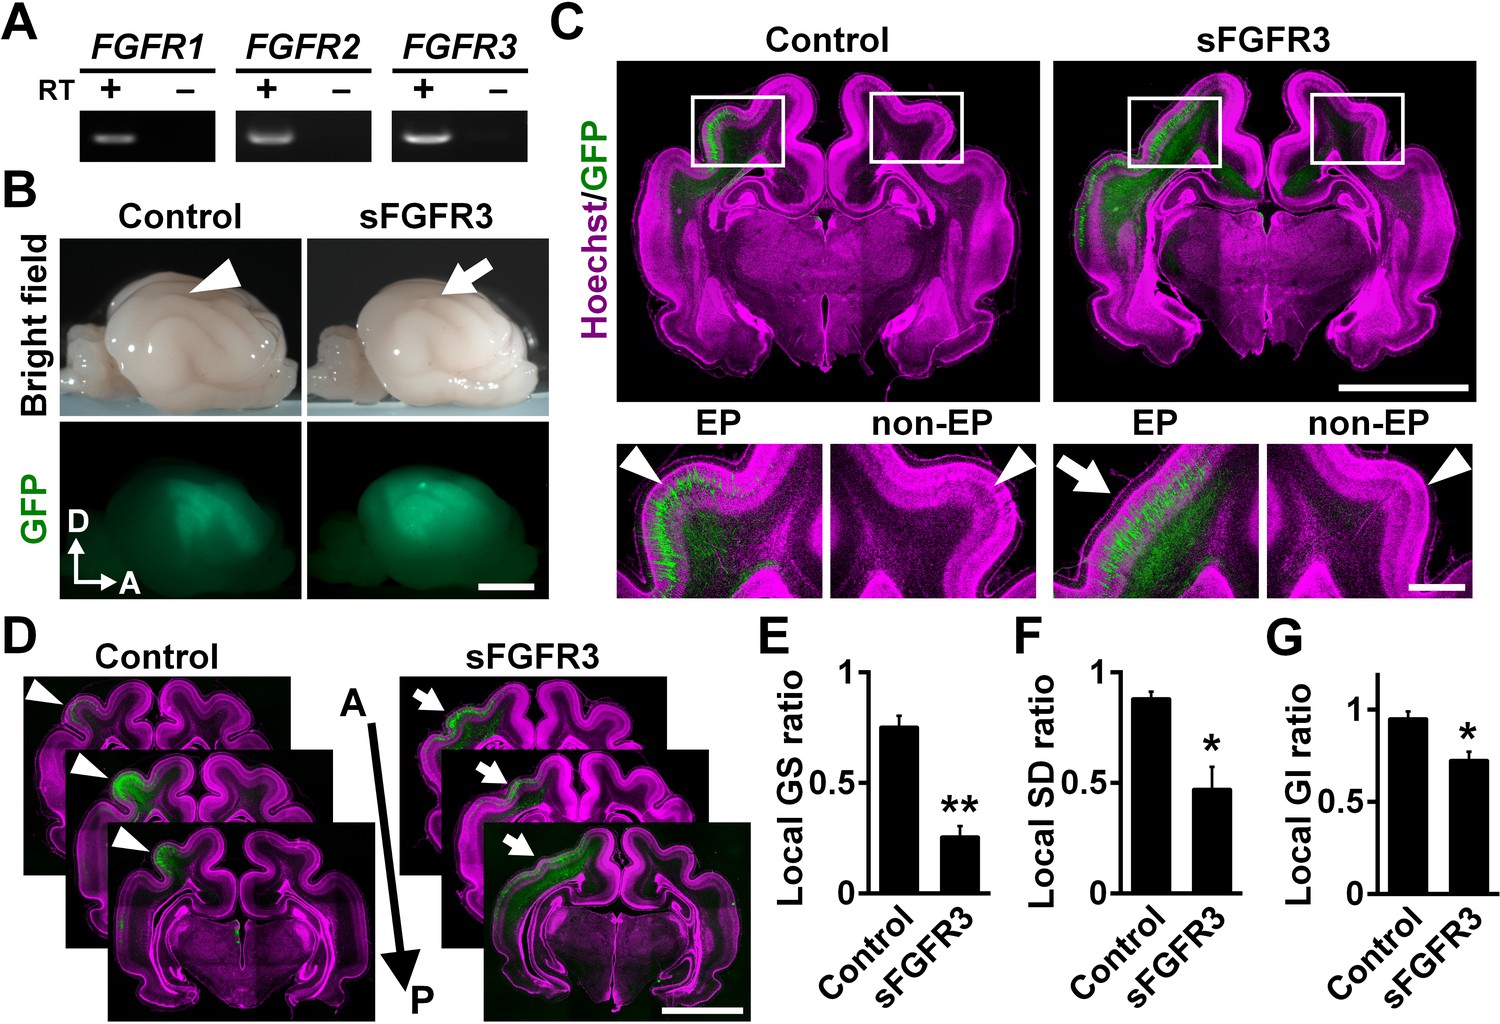
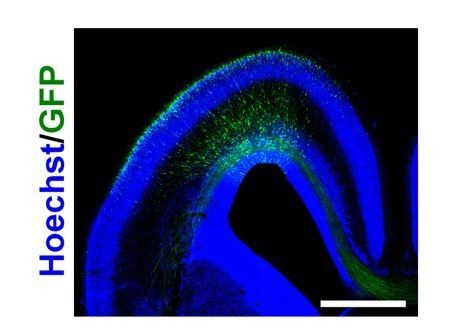
FGF signaling is required for cortical folding.
(A) Expression of FGFRs in the developing ferret cortex. RT-PCR was performed using the cerebral cortex of the ferret at P0. RT+ and RT- indicate samples with and without reverse transcriptase, respectively. (B) Lateral views of the transfected brains. pCAG-EGFP plus either pCAG-sFGFR3 or pCAG control vector was electroporated at E33, and the brains were dissected at P16. Note that sFGFR3 suppressed the formation of the gyrus (arrow), which was present in the control brain (arrowhead). A, anterior; D, dorsal. Scale bar = 5 mm. (C) Coronal sections of the brain stained with anti-GFP antibody and Hoechst 33342 (magenta). The formation of cortical folds was suppressed in the GFP-positive area when sFGFR3 was electroporated (sFGFR3, EP, arrow). Arrowheads indicate cortical folds in the control cortex and in the non-electroporated side of the cortex (non-EP). Scale bars = 5 mm (upper panel) and 1 mm (lower panel). (D) Serial coronal sections of the brain stained with anti-GFP antibody and Hoechst 33342 (magenta). The formation of cortical folds was widely suppressed in the GFP-positive areas when sFGFR3 was transfected (arrows). Arrowheads indicate cortical folds in the control cortex. A, anterior; P, posterior. Scale bar = 5 mm. (E–G) Quantification of the local GS ratio (E), the local SD ratio (F) and the local GI ratio (G). The local GS ratio, the local SD ratio and the local GI ratio were significantly smaller in sFGFR3-transfected samples. n = 3 animals for each condition. Bars present mean ± SEM. *p<0.05, **p<0.01, Student's t-test.
Figure 1—figure supplement 1
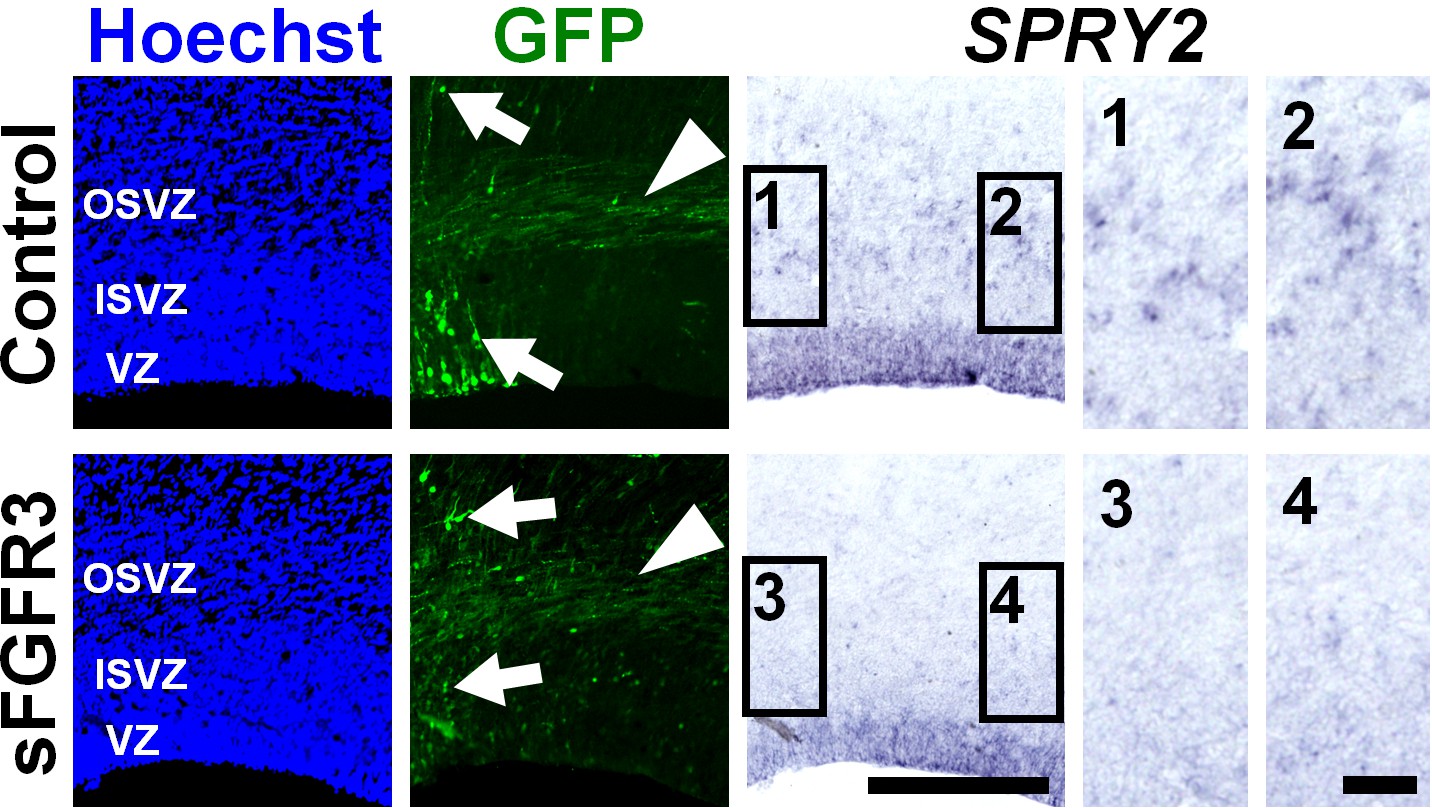
sFGFR3 suppressed FGF signaling in the OSVZ in a non-cell-autonomous manner.
pCAG-EGFP plus either pCAG-sFGFR3 or pCAG control vector was electroporated at E33, and the brains were dissected at E40. Coronal sections of the brain were subjected to in situ hybridization for Sprouty2 (SPRY2), immunohistochemistry with anti-GFP antibody, and Hoechst 33342 staining. Arrows and arrowheads indicate GFP-positive cells and axons, respectively. Images within the boxes (1-4) were magnified and are shown in the right panels. Note that Sprouty2 signals in non-transfected cells (i.e. cells without GFP signals in the cell body) were markedly suppressed by sFGFR3 electroporation in the OSVZ (4). Scale bars = 300 μm (left) and 50 μm (right).
Figure 1—figure supplement 2
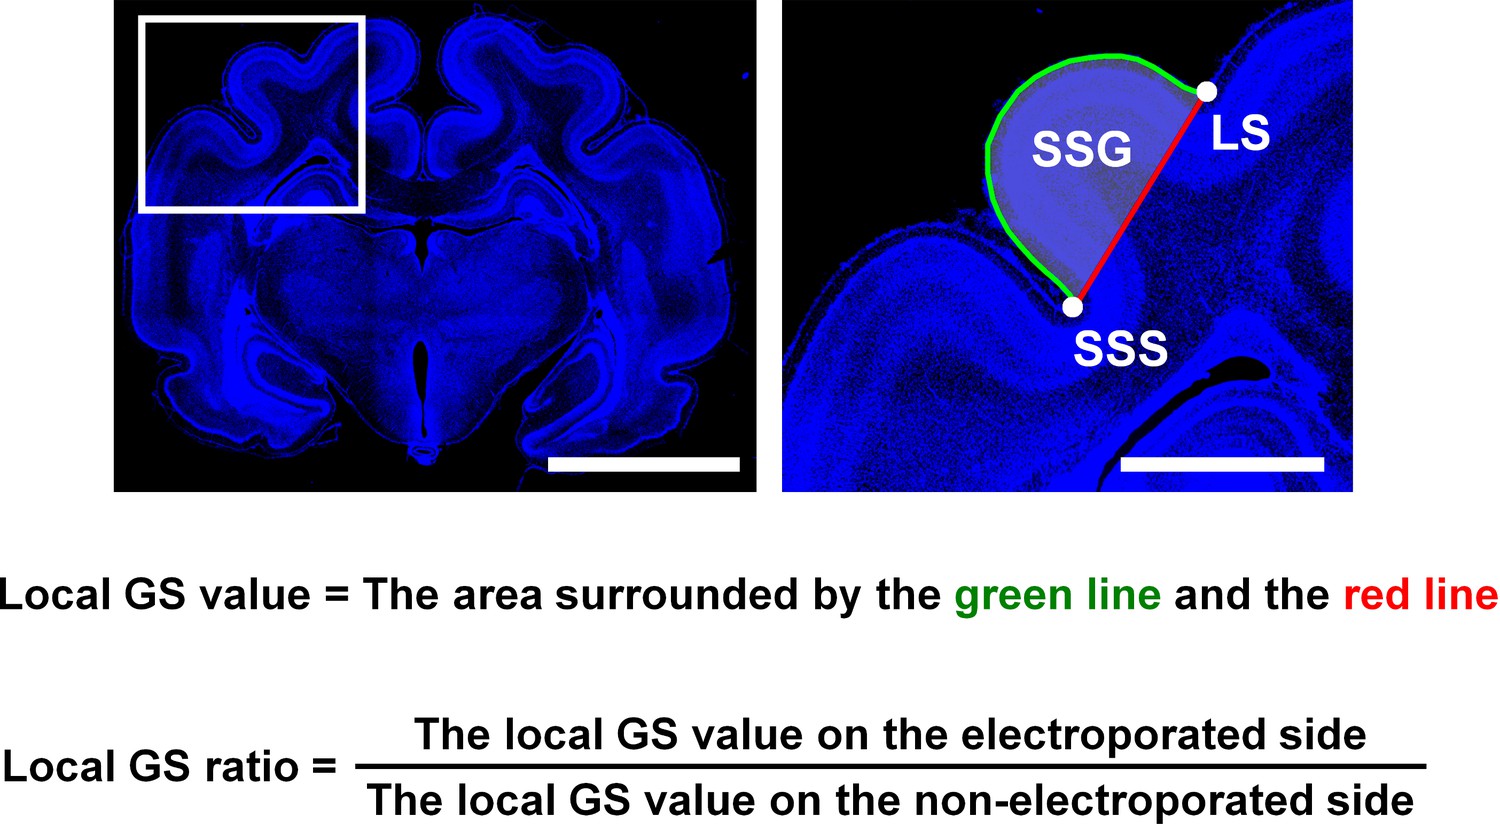
The definition of the local gyrus size (GS) ratio.
After IUE was performed, coronal sections containing the suprasylvian gyrus (SSG) were stained with Hoechst 33342 (blue). (Left) A lower magnification image. (Right) The area within the box of the lower magnification image was magnified and is shown on the right. The area surrounded by the brain surface (green) and the red line connecting the bottom of the suprasylvian sulcus (SSS) and the bottom of the lateral sulcus (LS) was measured (local GS value). To minimize the variation of the local GS values depending on the positions of coronal sections in the brain, the local GS value on the electroporated side and that on the contralateral non-electroporated side of the cerebral cortex in the same brain sections were measured, and the former was divided by the latter (local GS ratio). The local GS ratio would be 1 if the size of SSG was the same between the electroporated side and the other side (i.e. non-electroporated side), and would be smaller than 1 if cortical folding was suppressed by genetic manipulation. Scale bars = 5 mm (left) and 1 mm (right).
Figure 1—figure supplement 3
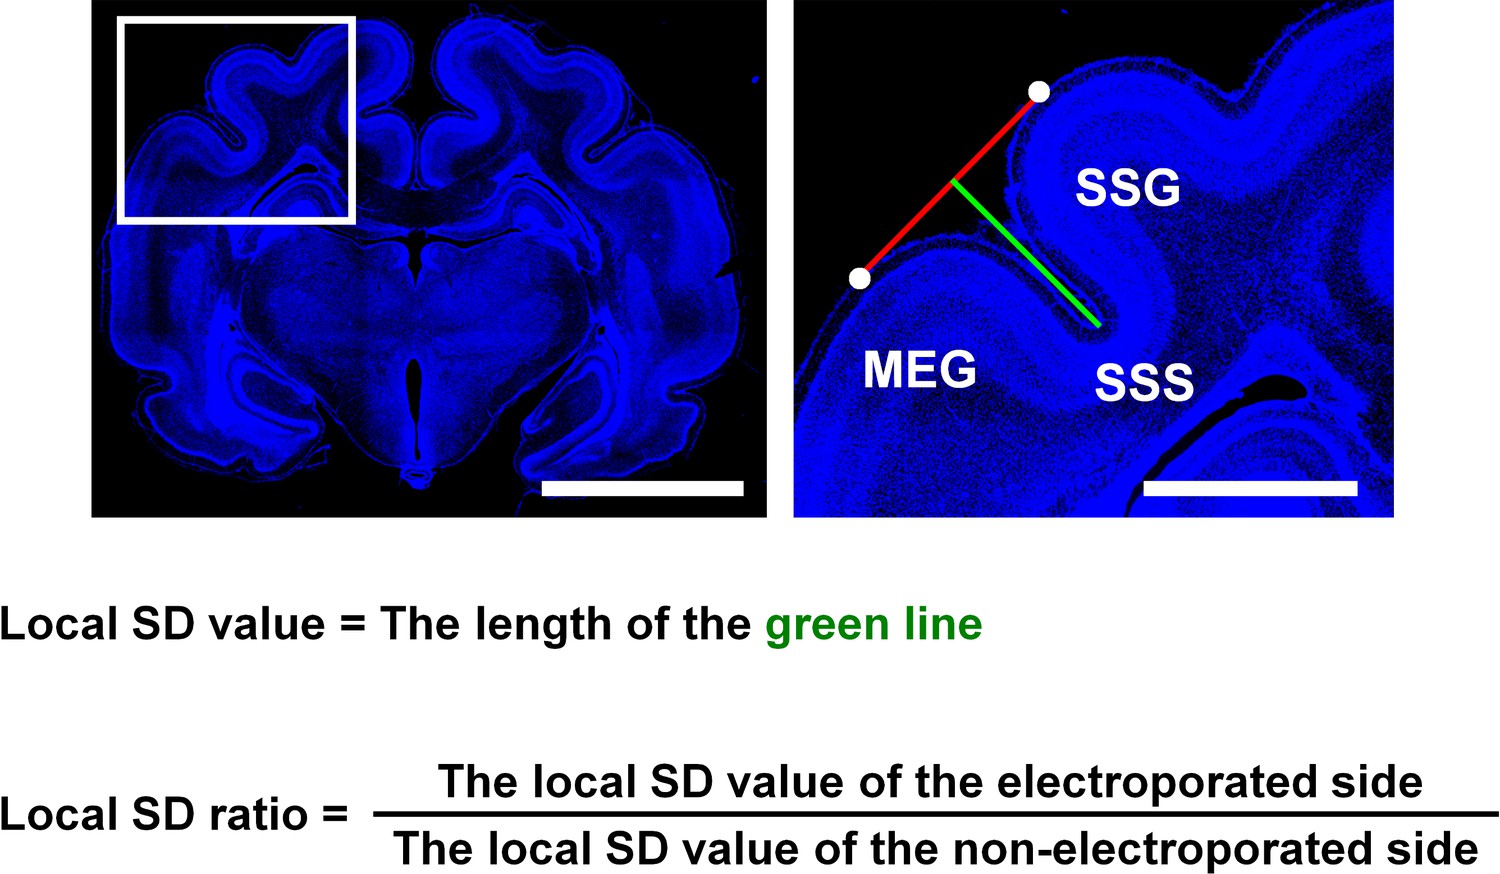
The definition of the local sulcus depth (SD) ratio.
After IUE was performed, coronal sections containing the suprasylvian gyrus (SSG) were stained with Hoechst 33342 (blue). (Left) A lower magnification image. (Right) The area within the box of the lower magnification image was magnified and is shown on the right. A line connecting the top of the SSG and that of the middle ectosylvian gyrus (MEG) was drawn (red line). Then a green line which connected the bottom of the suprasylvian sulcus (SSS) and a red line was drawn, so that the green line was perpendicular to the red line. The length of the green line was used as the local SD value. To minimize the variation of the local SD values depending on the positions of coronal sections in the brain, the local SD value on the electroporated side and that on the contralateral non-electroporated side of the cerebral cortex in the same brain sections were measured, and the former was divided by the latter (local SD ratio). The local SD ratio would be 1 if the depth of the SSS was the same between the electroporated side and the other side (i.e. non-electroporated side), and would be smaller than 1 if the depth of the SSS was reduced by genetic manipulation. Scale bars = 5 mm (left) and 1 mm (right).
Figure 1—figure supplement 4
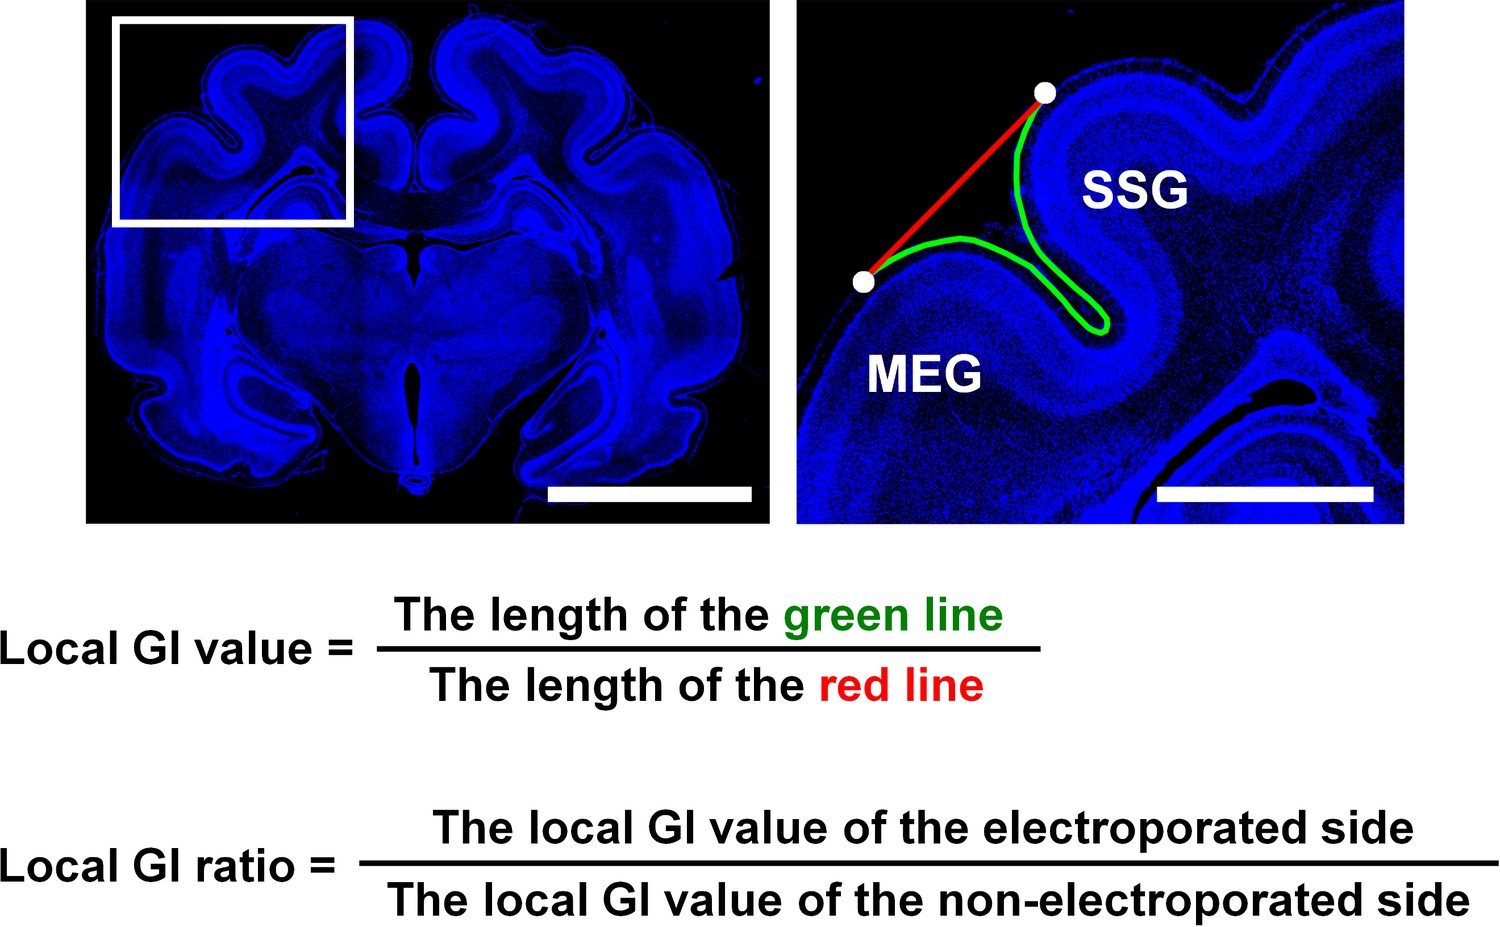
The definition of the local gyrification index (GI) ratio.
After IUE was performed, coronal sections containing the suprasylvian gyrus (SSG) and the middle ectosylvian gyrus (MEG) were stained with Hoechst 33342 (blue). (Left) A lower magnification image. (Right) The area within the box in the lower magnification image was magnified and is shown on the right. A line connecting the top of the SSG and that of the MEG was drawn (red line). The length of the complete contour between the top of the SSG and that of the MEG (green line) was then divided by that of the red line (local GI value). To minimize the variation of the local GI values depending on the positions of coronal sections in the brain, the local GI value on the electroporated side and that on the contralateral non-electroporated side of the cerebral cortex in the same brain sections were measured, and the former was divided by the latter (local GI ratio). The local GI ratio would be 1 if cortical folding was the same between the electroporated side and the other side (i.e. non-electroporated side), and would be smaller than 1 if the cortical folding was suppressed by genetic manipulation. Scale bars = 5 mm (left) and 1 mm (right).
Figure 2 with 4 supplements
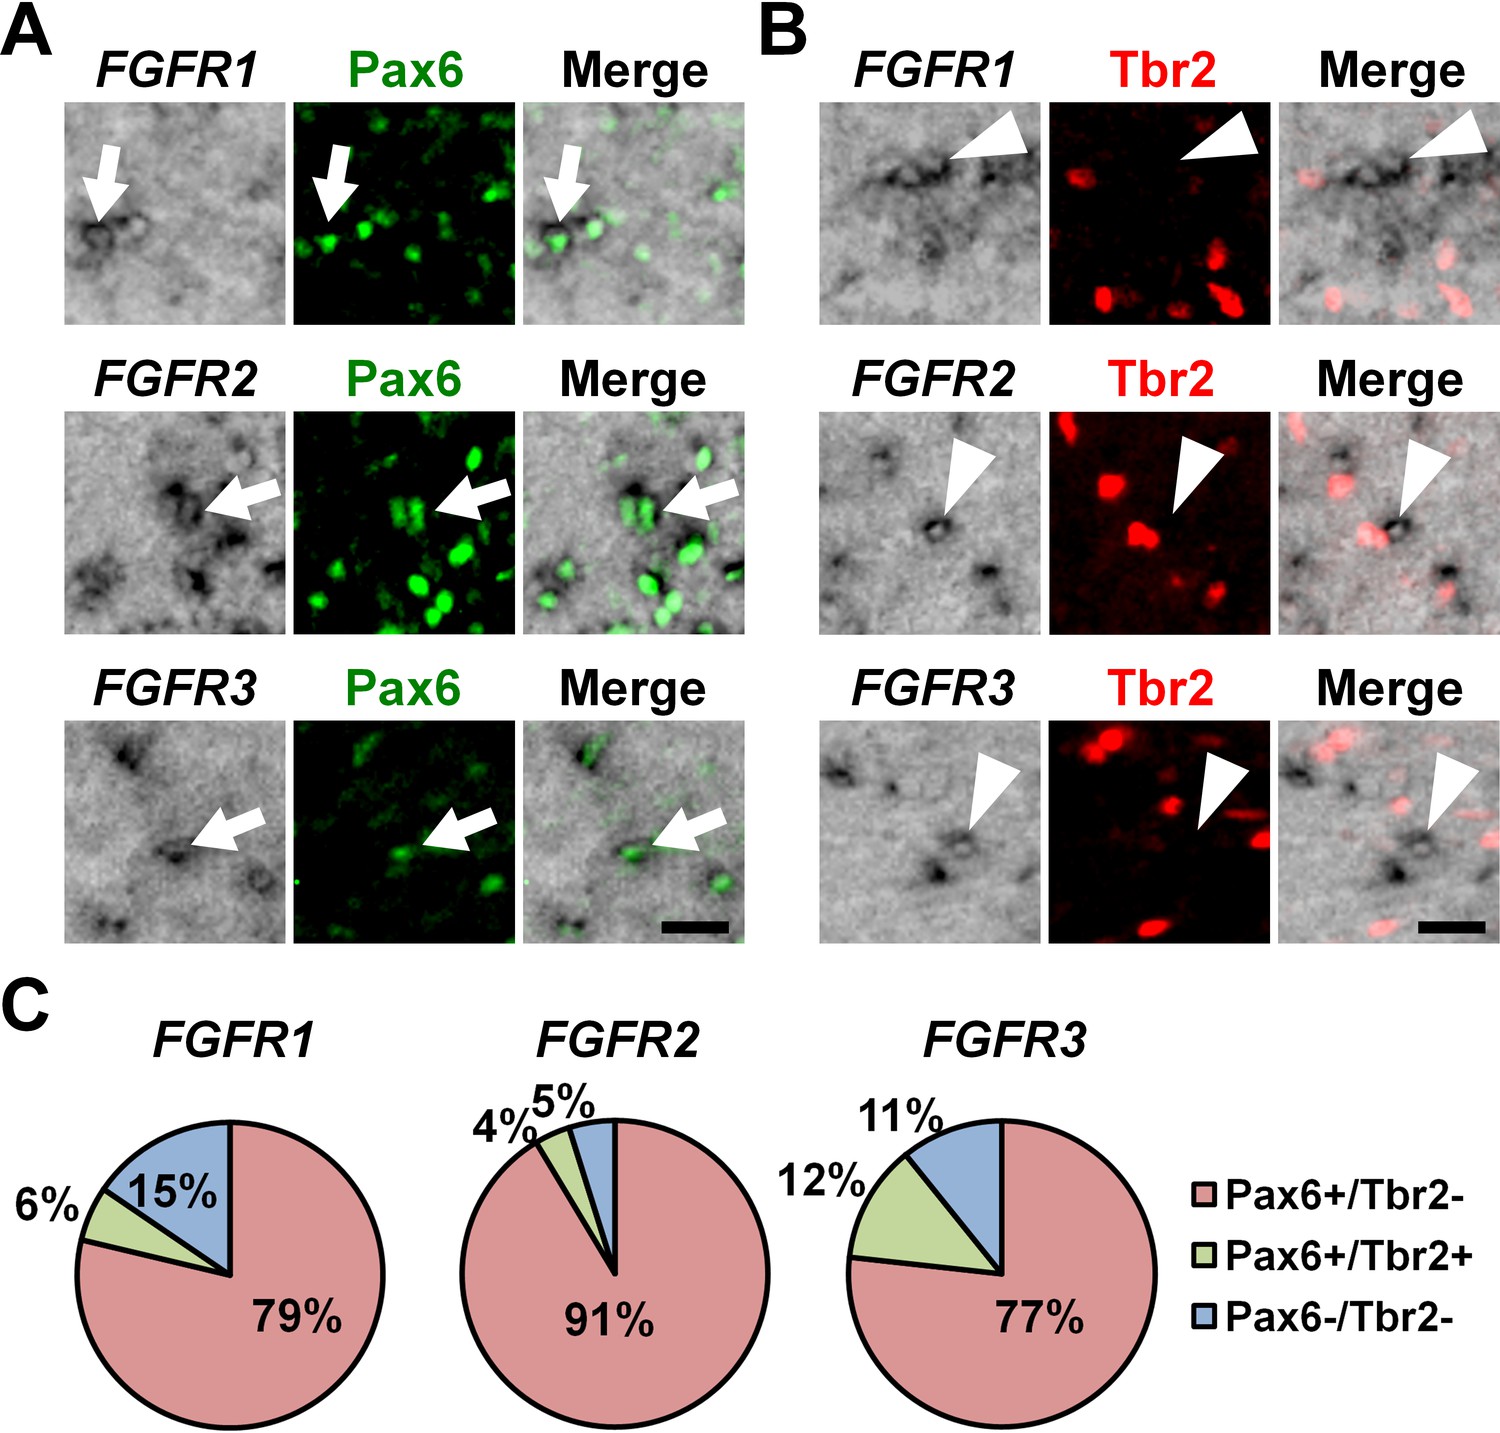
The expression of Pax6 and Tbr2 in FGFR-positive cells in the OSVZ.
Sections of the developing ferret cortex at P6 were subjected to immunohistochemistry for Pax6 or Tbr2 and in situ hybridization for FGFR1, FGFR2 or FGFR3. (A and B) Higher magnification images of the OSVZ are shown. Note that FGFR-positive cells were mostly positive for Pax6 (arrows), but negative for Tbr2 (arrowheads). Scale bars = 50 μm. (C) Quantification of the percentages of FGFR-positive cells which were also positive for Pax6 and Tbr2. n = 3 animals for each condition. For details, see Supplementary file 1.
Figure 2—figure supplement 1
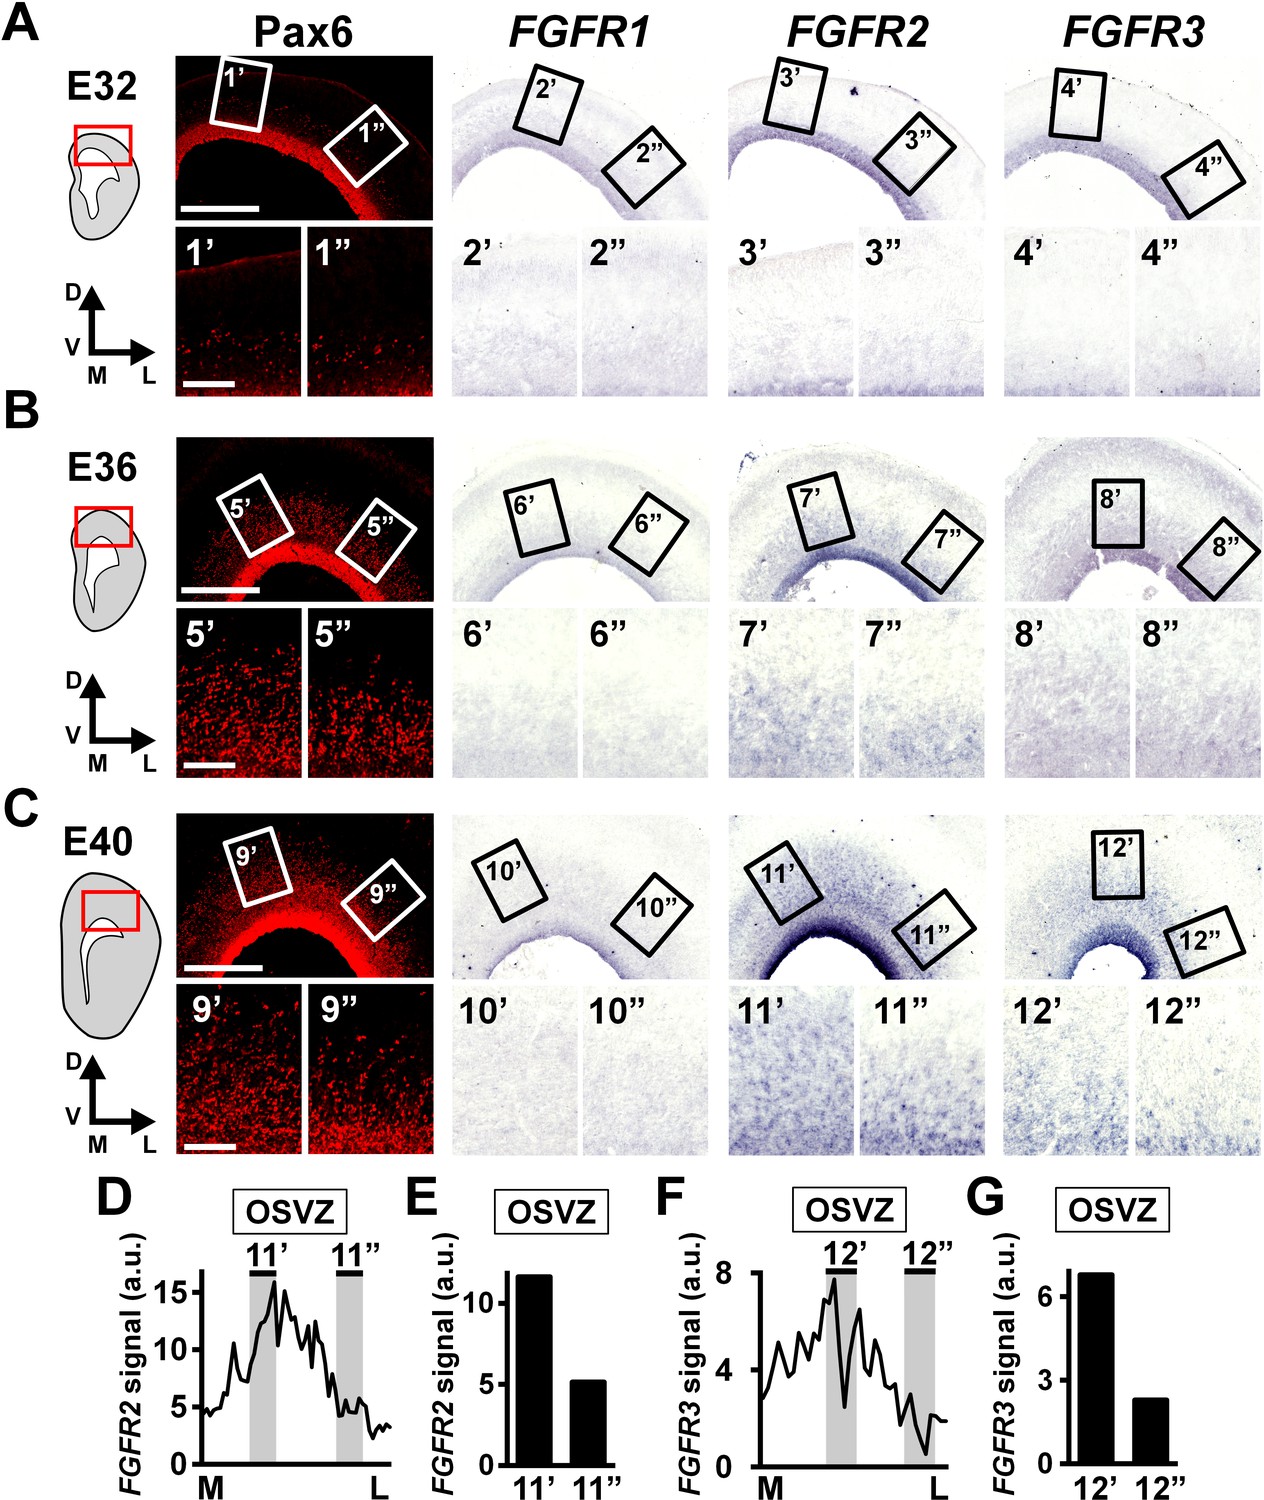
Regional differences in the abundance of FGFR expression in the developing cerebral cortex of ferrets.
(A–C) Coronal sections prepared at E32 (A), E36 (B) and E40 (C) were subjected to immunohistochemistry with anti-Pax6 antibody or in situ hybridization for FGFR1, FGFR2 and FGFR3. The schematic drawings representing coronal sections are shown on the left. The areas within the red boxes in the schematic drawings were magnified and are shown in the upper panels. The boxes in the upper panels were magnified and are shown in the lower panels (1'−12' and 1''−12''). FGFR expression was more abundant in certain cortical areas (11', 12') than others (11'', 12''). D, dorsal; V, ventral; L, lateral; M, medial. Scale bars = 200 μm (upper panels) and 50 μm (lower panels). (D) FGFR2 signal intensities in the OSVZ at E40 were measured along the tangential axis. M, medial; L, lateral. 11' and 11'' correspond to the regions in (C). (E) The average signal intensities of FGFR2 in two regions, 11' and 11''. (F) FGFR3 signal intensities in the OSVZ at E40 were measured along the tangential axis. M, medial; L, lateral. 12' and 12'' correspond to the regions in (C). (G) The average signal intensities of FGFR3 in two regions, 12' and 12''. Note that FGFR2 signals in 11' and FGFR3 signals in 12' were larger than those in 11'' and 12'', respectively. a.u., arbitrary units. (D–G) Representative data from one animal. The same experiments were performed using at least three different animals and gave consistent results.
Figure 2—figure supplement 2
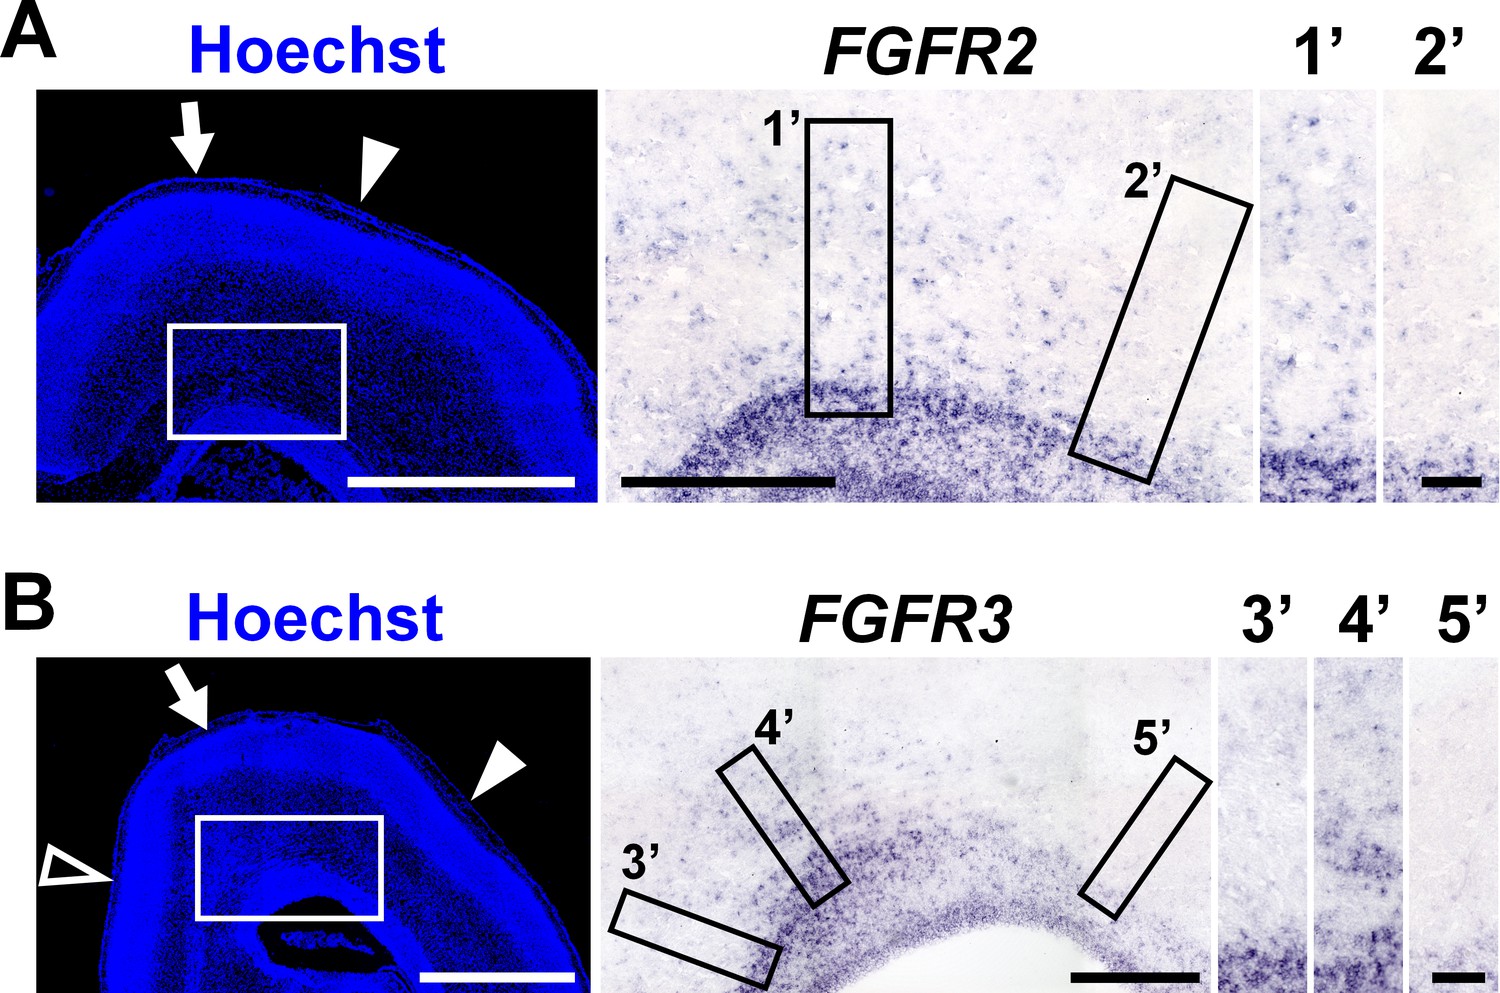
Regional differences in the abundance of FGFR expression in the postnatal ferret cerebral cortex.
Coronal sections of the ferret brains were prepared at P6, when cortical folds begin to be formed, and were subjected to in situ hybridization for FGFR2 (A) and FGFR3 (B), and Hoechst 33342 staining. FGFR images within the white boxes are shown in the middle panels. Arrows, arrowheads and open arrowhead indicate prospective areas of the lateral gyrus, the lateral sulcus and the splenial sulcus, respectively. The areas within the black boxes in the middle panels were magnified and are shown in the right panels (1'−5'). Note that FGFRs are abundantly expressed in the prospective areas of the lateral gyrus (1' and 4') rather than those of the lateral sulcus (2' and 5') and the splenial sulcus (3'). Scale bars = 2 mm (left), 500 µm (middle) and 100 µm (right).
Figure 2—figure supplement 3
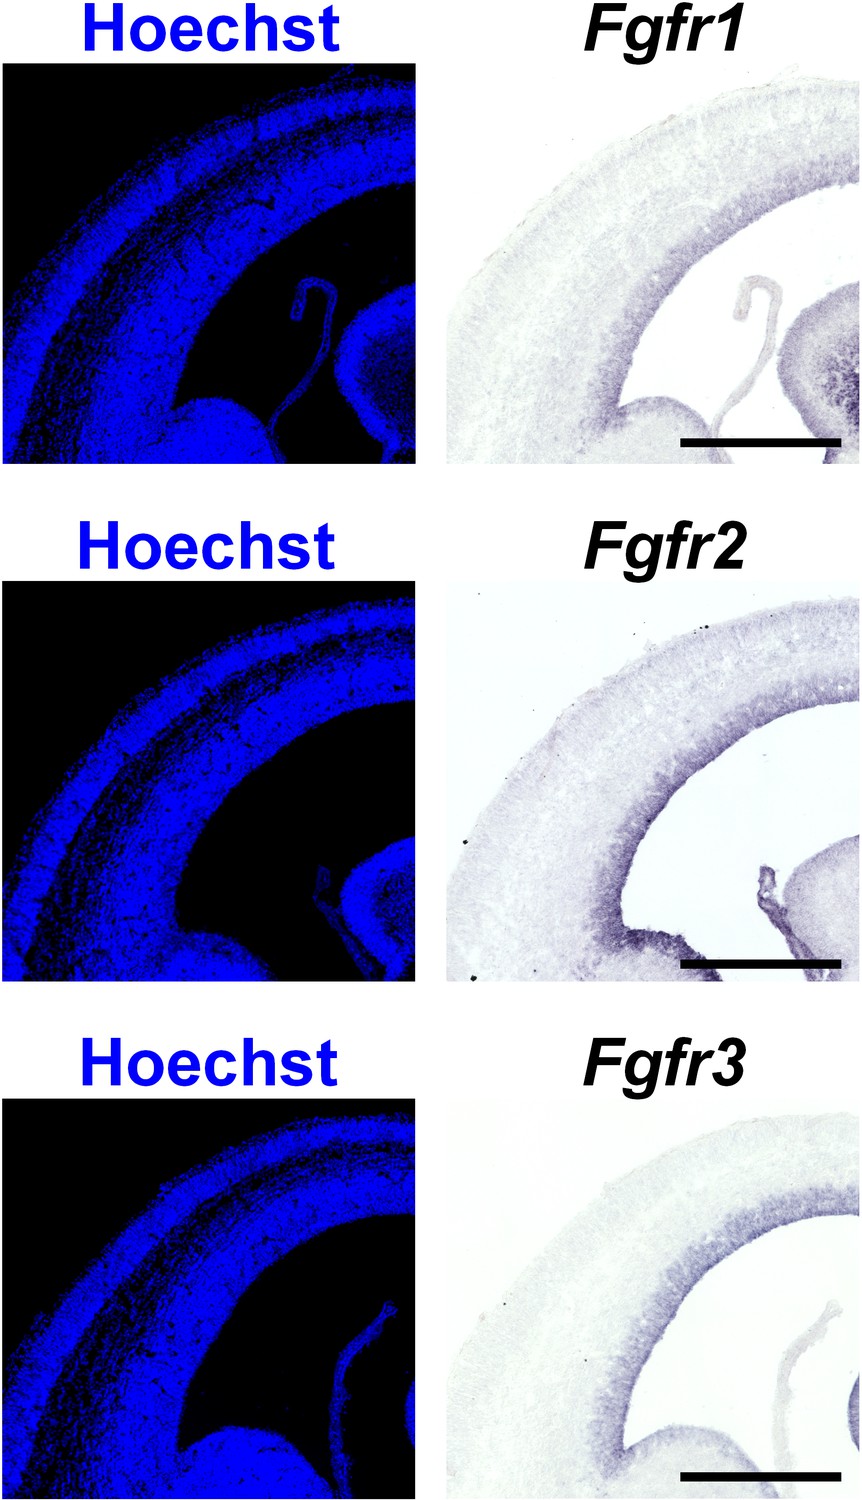
The expression of Fgfr1, Fgfr2 and Fgfr3 in the developing mouse cerebral cortex.
Coronal sections of the mouse brain at E15 were subjected to Hoechst 33342 staining and in situ hybridization for Fgft1, Fgfr2 and Fgfr3. Fgfr1, Ffgr2 and Fgfr3 were expressed in the VZ in the cerebral cortex. Note that the expression patterns of Fgfrs in the mouse cerebral cortex did not show the regional differences which were observed in the ferret cerebral cortex. Scale bars = 500 μm.
Figure 2—figure supplement 4
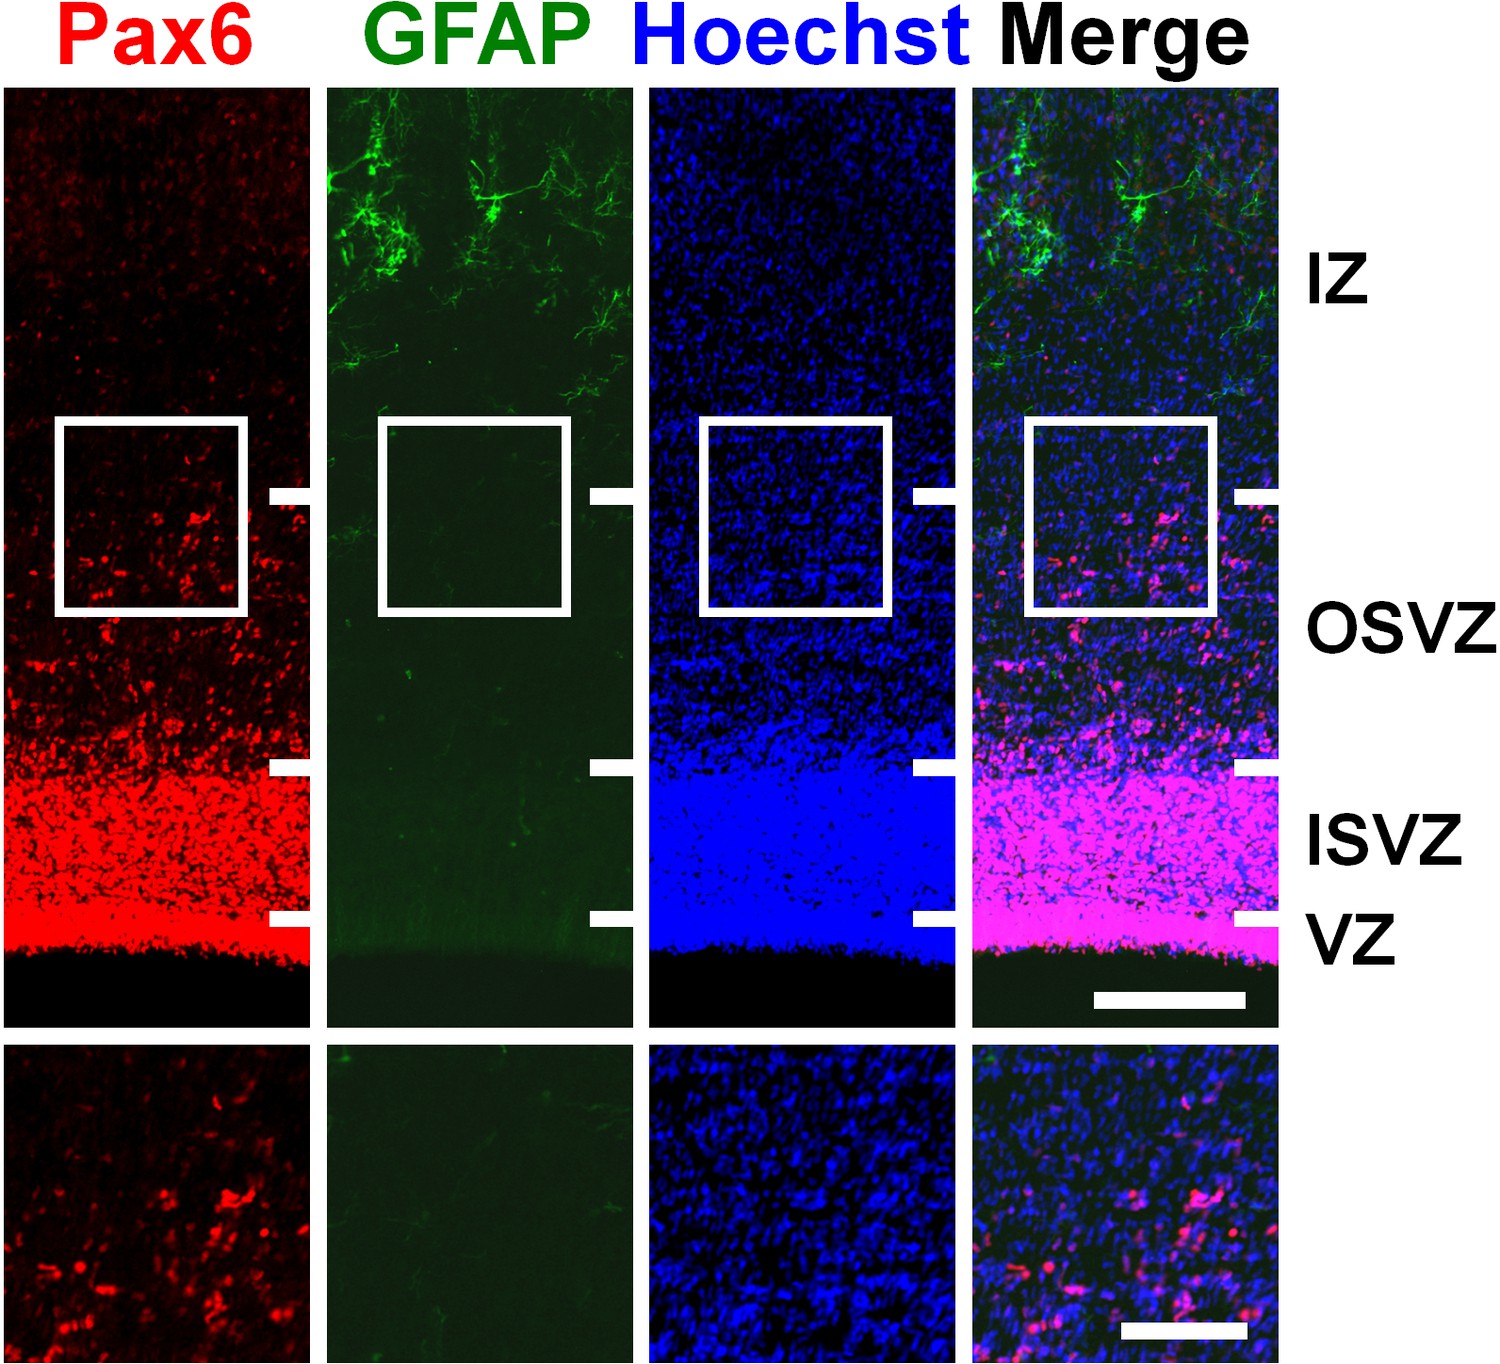
Pax6-positive cells in the OSVZ did not express GFAP in the developing cerebral cortex of ferret neonates.
Coronal sections of the ferret cerebral cortex at P6 were subjected to immunohistochemistry for Pax6 and GFAP and Hoechst 33342 staining. The images within the boxes in the upper panels were magnified and are shown in the lower panels. IZ, intermediate zone. Scale bars = 200 µm (upper) and 100 µm (lower).
Figure 3 with 2 supplements

The roles of FGF signaling in neural progenitors of the developing ferret cortex.
pCAG-EGFP plus either pCAG-sFGFR3 or pCAG control vector was electroporated at E33, and the brains were dissected at P6. (A) Dorsal views of the transfected brains. A, anterior; P, posterior. (B) Coronal sections stained with anti-Pax6 antibody and Hoechst 33342. Transfected regions were identified with GFP fluorescence. (C) Magnified images within the boxes of (B). Note that Pax6-positive cells were markedly decreased in the OSVZ underneath the sFGFR3-transfected region (square bracket). (D) Pax6-positive cells in the VZ, the ISVZ and the OSVZ of the transfected brain. (E) Quantification of the numbers of Pax6-positive cells per 10-μm-wide strips of the VZ, ISVZ and OSVZ. Pax6-positive cells were significantly reduced by sFGFR3 in the OSVZ selectively. n = 3 animals for each condition. Bars represent mean ± SD. (F) Tbr2-positive cells in the VZ, the ISVZ and the OSVZ of the transfected brain. (G) Quantification of Tbr2-positive cells. Tbr2-positive cells were significantly reduced by sFGFR3 in the OSVZ selectively. n = 3 animals for each condition. Bars present mean ± SD. *p<0.05, **p<0.01, Student's t-test. Scale bars = 5 mm (A), 2 mm (B), 500 μm (C) and 100 μm (D and F).
Figure 3—figure supplement 1
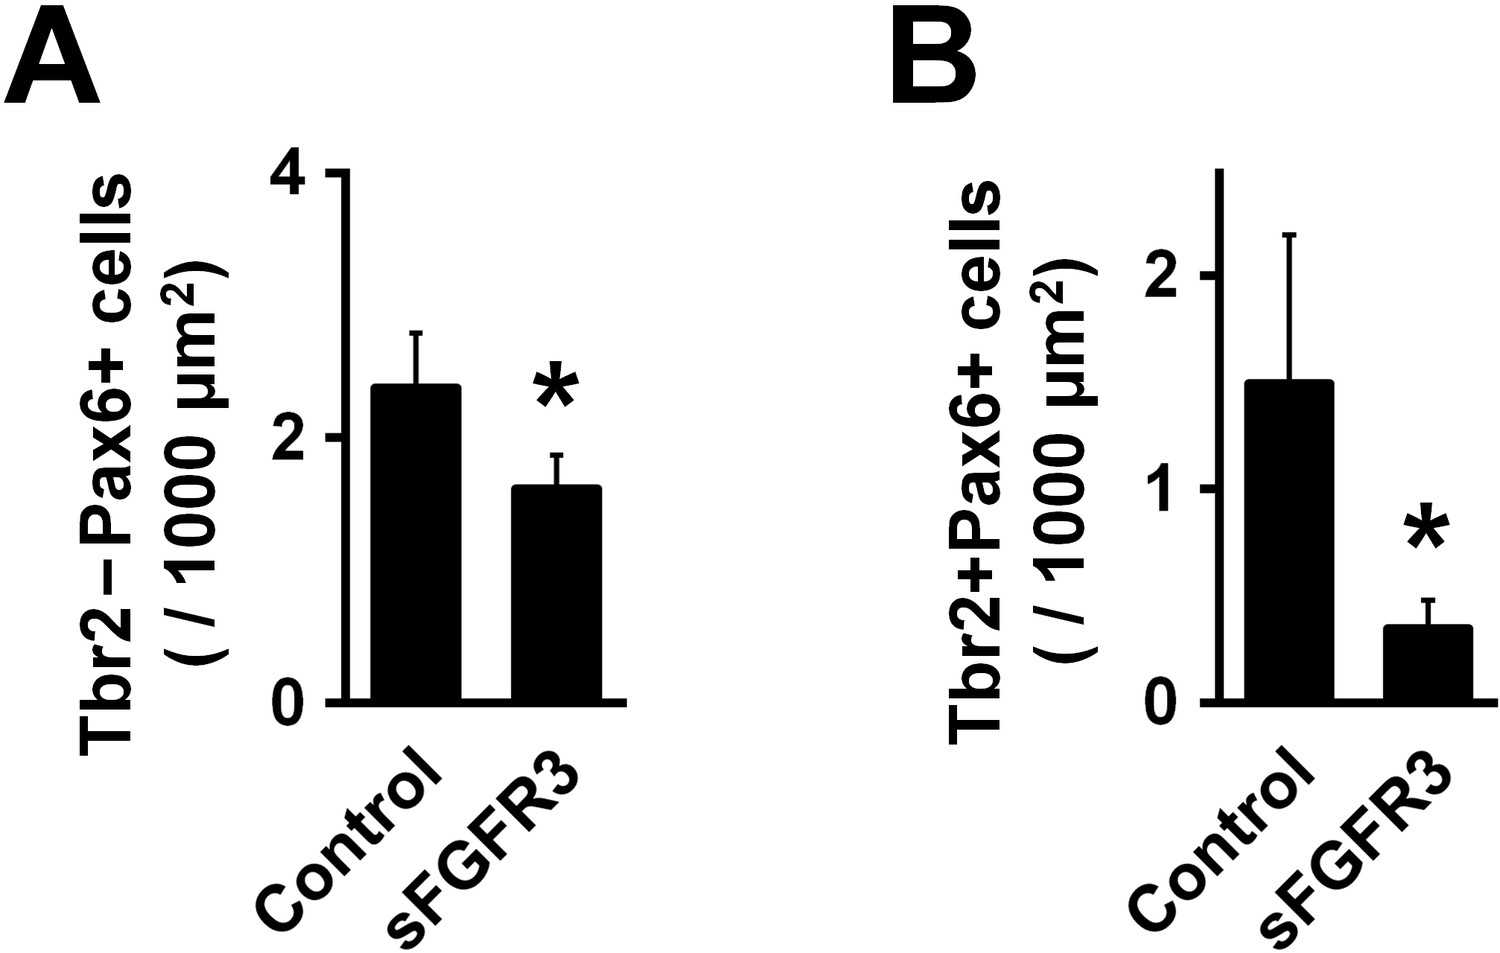
sFGFR reduced Pax6-positive/Tbr2-negative oRG cells and Pax6-positive/Tbr2-positive IP cells in the OSVZ.
pCAG-EGFP plus either pCAG-sFGFR3 or pCAG control vector was electroporated at E33, and the brains were dissected at P6. Coronal sections were stained with anti-Pax6 antibody, anit-Tbr2 antibody and Hoechst 33342. (A) Quantification of Pax6-positive/Tbr2-negative cells in the OSVZ. (B) Quantification of Pax6-positive/Tbr2-positive cells in the OSVZ. Note that both Pax6-positive/Tbr2-negative cells and Pax6-positive/Tbr2-positive cells in the OSVZ were significantly reduced by sFGFR3. n = 3 animals for each condition. Bars present mean ± SD. *p<0.05, Student's t-test.
Figure 3—figure supplement 2
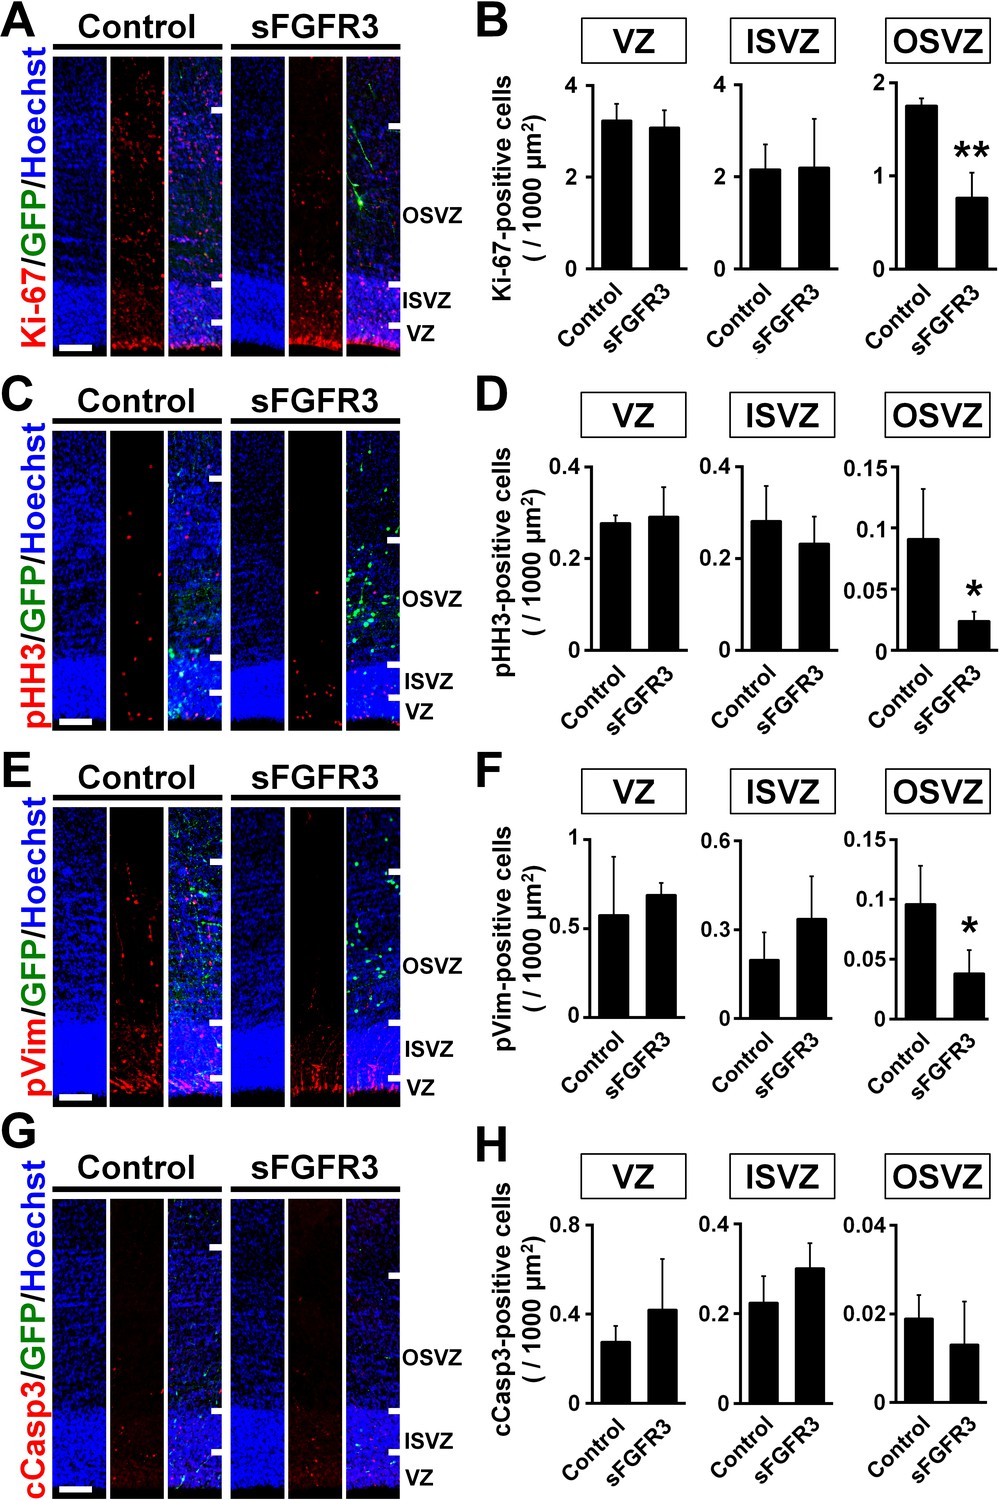
FGF signaling is required for cell proliferation in the OSVZ of the developing ferret cortex.
pCAG-EGFP plus either pCAG-sFGFR3 or pCAG control vector was electroporated at E33, and the brains were dissected at P6. Sections were stained with anti-Ki-67 (A and B), anti-phospho-histone H3 (pHH3) (C and D), anti-phosphorylated vimentin (pVim) (E and F) and anti-cleaved caspase 3 (cCasp3) (G and H) antibodies. Scale bars = 100 μm. (A, C, E and G) Immunohistochemical images around the VZ, the ISVZ and the OSVZ. (B, D, F and H) Quantification of positive cells in the VZ, the ISVZ and the OSVZ. Note that Ki-67-, pHH3- and pVim-positive cells were significantly reduced by sFGFR3 in the OSVZ selectively. n = 3 animals for each condition. Bars present mean ± SD. *p<0.05, **p<0.01, Student's t-test.
Figure 4
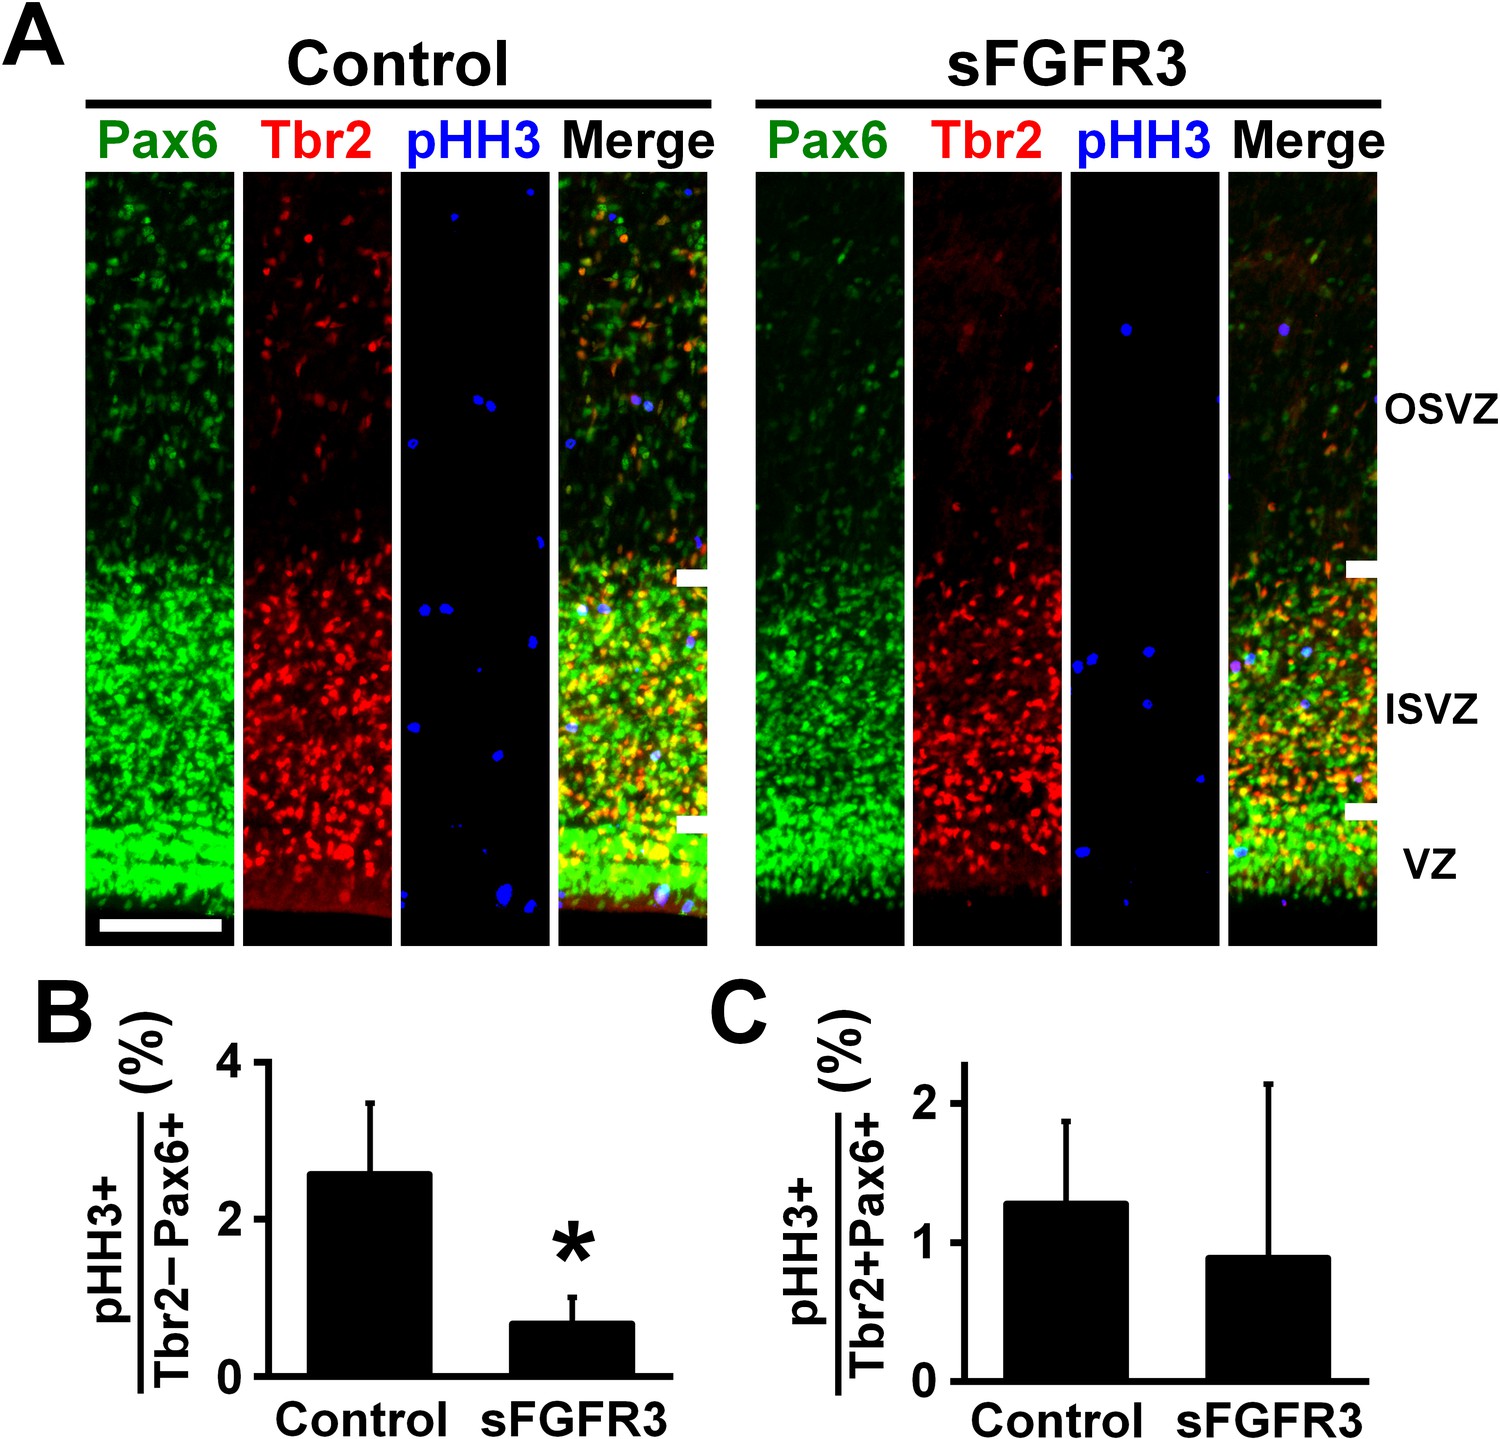
FGF signaling is required for cell proliferation of Pax6-positive, Tbr2-negative oRG cells.
pCAG-EGFP plus either pCAG-sFGFR3 or pCAG control vector were electroporated at E33, and the brains were dissected at P6. (A) Coronal sections were triple-stained with anti-Pax6, anti-Tbr2 and anti-phospho-histone H3 (pHH3) antibodies. The VZ, the ISVZ and the OSVZ are shown. Scale bars = 100 μm. (B) The percentage of Tbr2-negative/Pax6-positive cells co-expressing pHH3. (C) The percentage of Tbr2-positive/Pax6-positive cells co-expressing pHH3. n = 3 animals for each condition. Bars present mean ± SD. *p<0.05, Student's t-test.
Figure 5 with 2 supplements
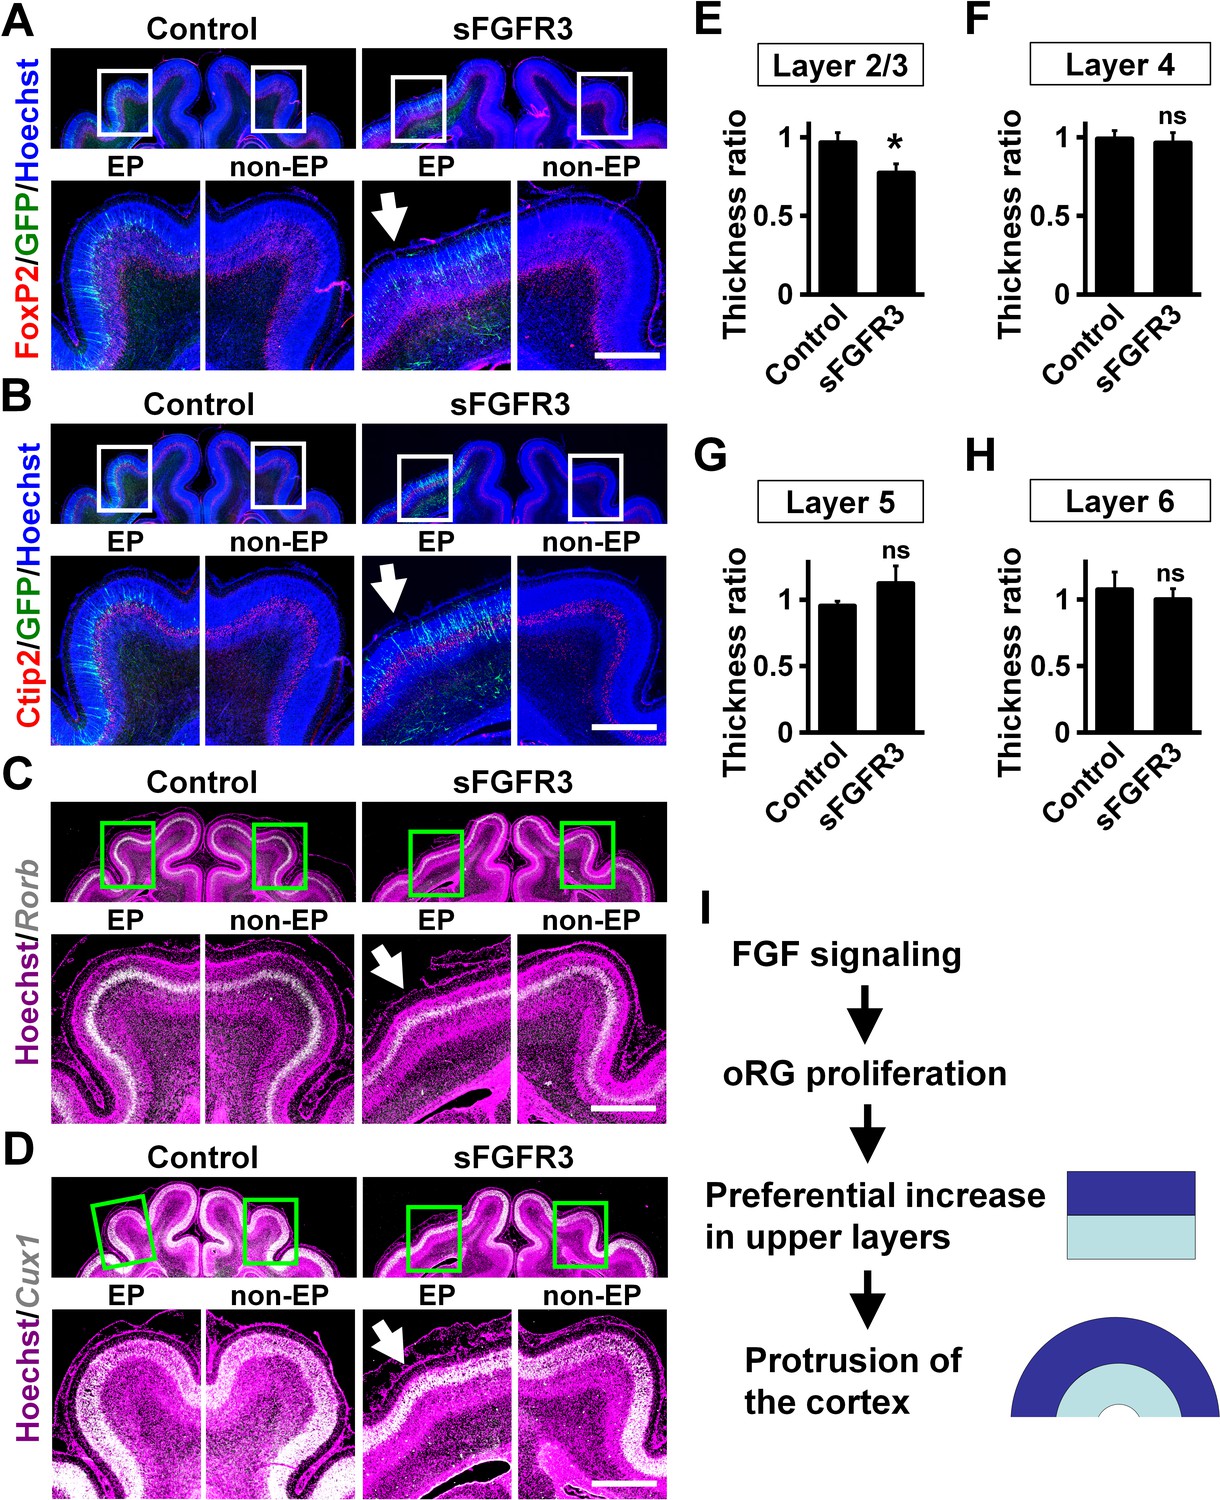
Upper layers are predominantly affected by inhibiting FGF signaling.
pCAG-EGFP plus either pCAG-sFGFR3 or pCAG control vector was electroporated at E33, and the brains were dissected at P16. Coronal sections were subjected to Hoechst 33342 staining plus either immunohistochemistry or in situ hybridization. (A) FoxP2 immunohistochemistry. (B) Ctip2 immunohistochemistry. (C) Rorb in situ hybridization (white). (D) Cux1 in situ hybridization (white). The images within the boxes in the upper panels were magnified and are shown in the lower panels. Note that sFGFR3 did not affect the layer structure of the cerebral cortex while cortical folding was inhibited (sFGFR3, EP, arrows). Scale bars = 1 mm. (E–H) Quantification of the thicknesses of layer 2/3 (E), layer 4 (F), layer 5 (G) and layer 6 (H). The ratios of the thickness of the electroporated side relative to that of the non-electroporated side are shown. Note that the thickness ratio of layer 2/3 was significantly reduced by sFGFR3, while those of layer 4, layer 5 and layer 6 were not. n = 3 animals for each condition. Bars present mean ± SD. *p<0.05; ns, not significant; Student's t-test. (I) A model of the mechanisms underlying the formation of cortical folds in the gyrencephalic brain.
Figure 5—figure supplement 1
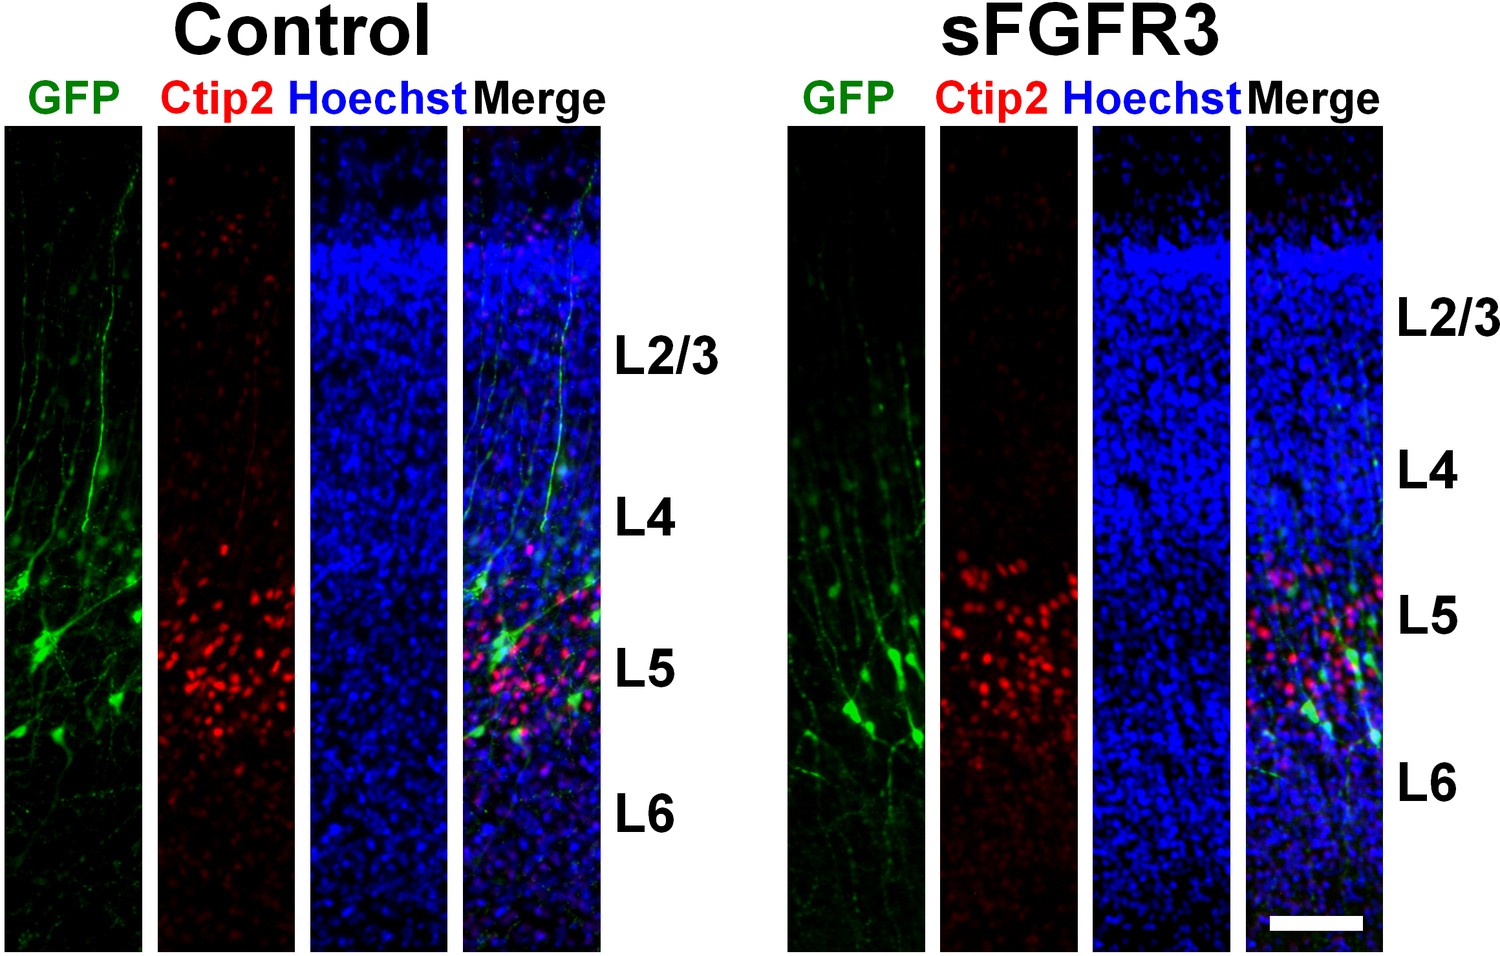
Distribution of GFP-positive cells in the sFGFR3-transfected cerebral cortex.
pCAG-EGFP plus either pCAG-sFGFR3 or pCAG control vector was electroporated at E33, and the brains were dissected at P16. Coronal sections were stained with Hoechst 33342, anti-GFP antibody and anti-Ctip2 antibody. GFP-positive cells were distributed in layers 4 and 5 in both the sFGFR3-transfected cerebral cortex and its control. Scale bars = 100 μm.
Figure 5—figure supplement 2
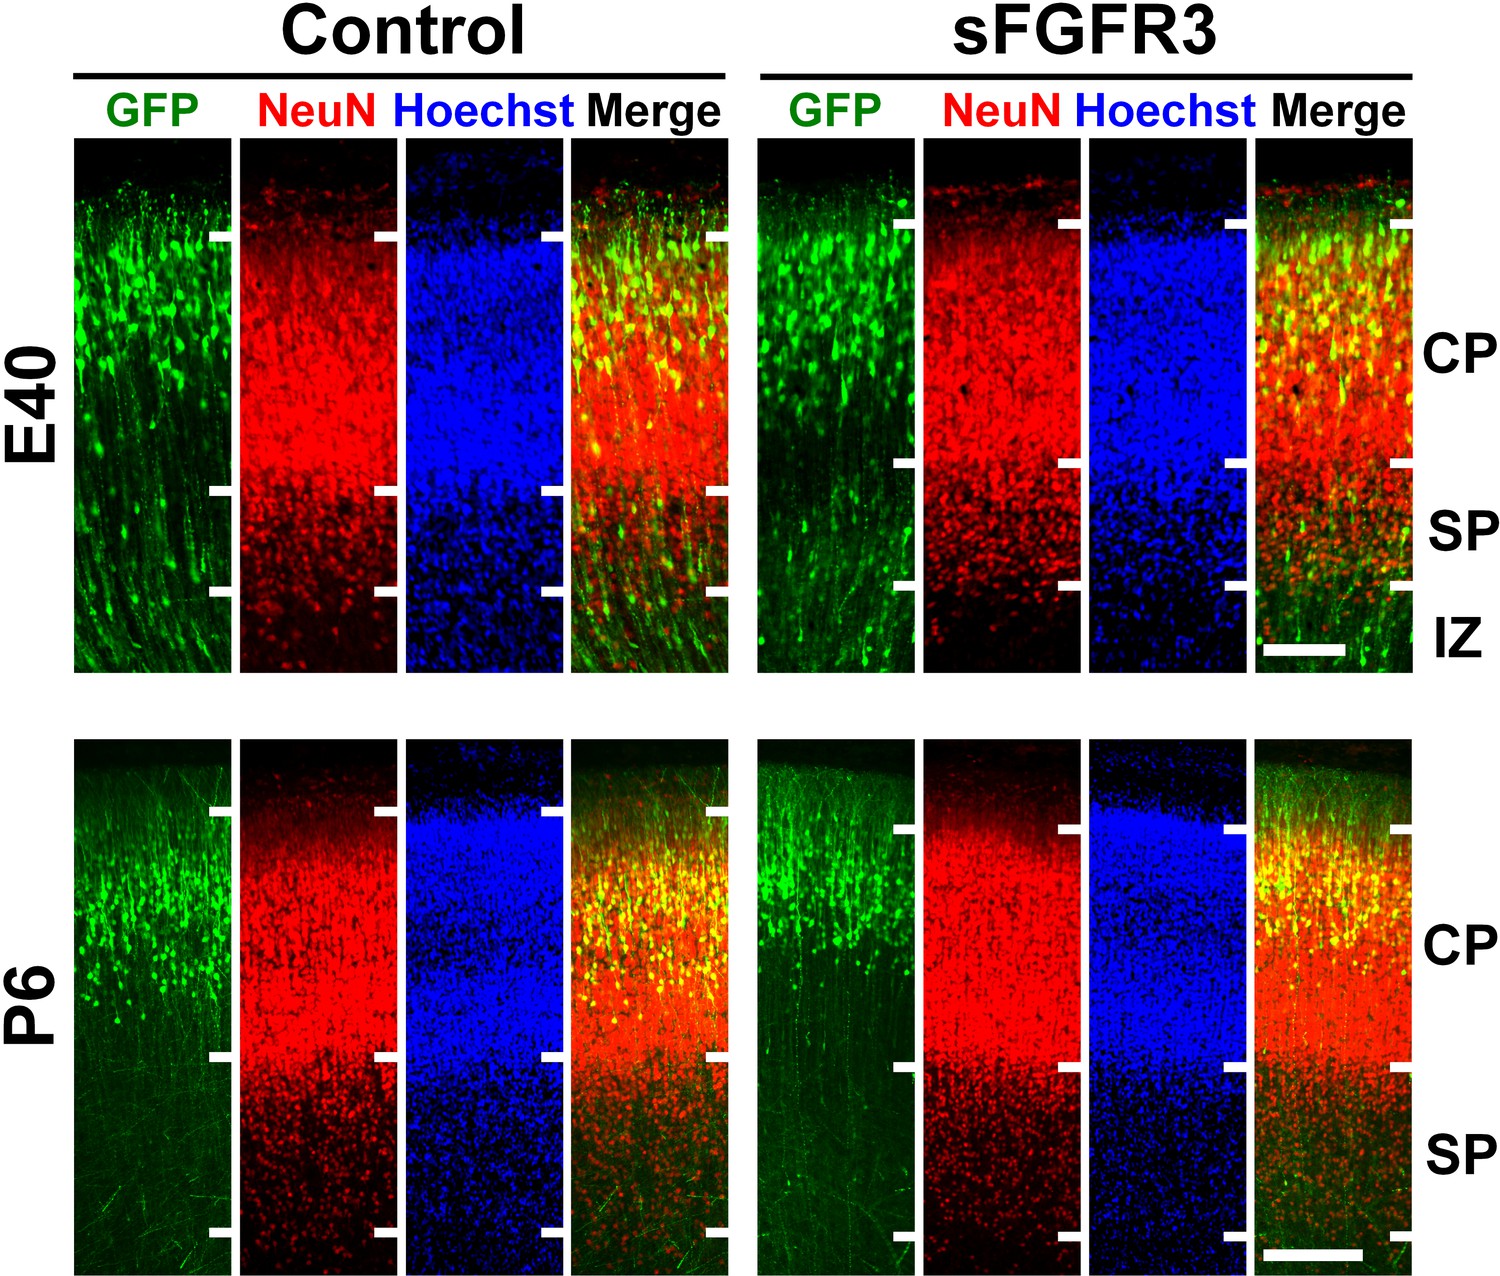
Layer structures of the cerebral cortex and laminar positions of GFP-positive cells in the sFGFR3-transfected brains during development.
pCAG-EGFP plus either pCAG-sFGFR3 or pCAG control vector was electroporated at E33, and the brains were dissected at E40 (upper panels) and P6 (lower panels). Coronal sections stained with anti-GFP antibody, anti-NeuN antibody and Hoechst 33342. Laminar locations of GFP-positive cells and layer structures in the sFGFR3-electroporated cerebral cortex were comparable with those in the control cortex. CP, cortical plate; SP, subplate; IZ, intermediate zone. Scale bars = 100 μm (upper), 200 μm (lower).
Author response image 1
Distribution of GFP-positive cells in the sFGFR3-transfected ferret brain at E40.
pCAG-EGFP and pCAG-sFGFR3 were electroporated at E33. The coronal sections were prepared at E40 and stained with Hoechst 33342 (blue). GFP-positive cells were widely distributed in the ferret cerebral cortex. Scale bar = 2 mm.
Tables
Key resources table
| Reagent type (species) or resource | Designation | Source or reference | Identifiers | Additional information |
|---|---|---|---|---|
| antibody | anti-Tbr2 (rabbit polyclonal) | Abcam | Cat# ab23345; RRID: AB_778267 | N/A |
| antibody | anti-Pax6 (mouse monoclonal) | Abcam | Cat# ab78545; RRID: AB_1566562 | N/A |
| antibody | anti-Pax6 (rabbit polyclonal) | Covance | Cat# PRB-278P; RRID: AB_291612 | N/A |
| antibody | anti-Ki-67 (rabbit polyclonal) | Leica | Cat# NCL-Ki67p; RRID: AB_442102 | N/A |
| antibody | anti-phospho-histone H3 (mouse monoclonal) | Millipore | Cat# 05–806; RRID: AB_310016 | N/A |
| antibody | anti-phosphorylated vimentin (mouse monoclonal) | Medical and Biological Laboratories, Japan | Cat# D076-3; RRID: AB_592963 | N/A |
| antibody | anti-cleaved caspase 3 (rabbit monoclonal) | BD Pharmingen | Cat# 559565; RRID: AB_397274 | N/A |
| antibody | anti-Ctip2 (rat monoclonal) | Abcam | Cat# ab18465; RRID: AB_2064130 | N/A |
| antibody | anti-FOXP2 (rabbit polyclonal) | Atlas antibodies | Cat# HPA000382; RRID: AB_1078908 | N/A |
| antibody | anti-GFAP (mouse monoclonal) | Sigma-Aldrich | Cat# G3893; RRID: AB_477010 | N/A |
| antibody | anti-GFP (rat monoclonal) | Nacalai tesque, Japan | Cat# 440426; RRID: AB_2313652 | N/A |
| antibody | anti-GFP (rabbit polyclonal) | Medical and Biological Laboratories, Japan | Cat# 598; RRID: AB_591819 | N/A |
| antibody | biotin-conjugated anti-phospho-histone H3 | Millipore | Cat# 16–189; RRID: AB_310794 | N/A |
| antibody | alkaline phosphatase-conjugated anti-digoxigenin | Roche, Indianapolis, IN | Cat# 11093274910; RRID: AB_514497 | N/A |
| sequence-based reagent (Mustela putorius furo) | Ferret FGFR1 forward1 (primer) | this paper | N/A | GGAGCTGGAAGTGCCTCCTCTTCTG |
| sequence-based reagent (Mustela putorius furo) | Ferret FGFR1 reverse1 (primer) | this paper | N/A | TGATGCGGGTACGGTTGCTT |
| sequence-based reagent (Mustela putorius furo) | Ferret FGFR1 forward2 (primer) | this paper | N/A | CAGGGGAGGAGGTGGAGGTG |
| sequence-based reagent (Mustela putorius furo) | Ferret FGFR1 reverse2 (primer) | this paper | N/A | CGGCACCGCATGCAATTTCTTTTCCATC |
| sequence-based reagent (Mustela putorius furo) | Ferret Sprouty2 forward (primer) | this paper | N/A | ATCGCAGGAAGACGAGAATCCAAGG |
| sequence-based reagent (Mustela putorius furo) | Ferret Sprouty2 reverse (primer) | this paper | N/A | CTGGGTGGGACAGTGGGAACTTTGC |
| sequence-based reagent (Mus musculus) | Mouse Fgfr1 forward (primer) | this paper | N/A | CTGCATGGTTGACCGTTCTGGAAGC |
| sequence-based reagent (Mus musculus) | Mouse Fgfr1 reverse (primer) | this paper | N/A | TGTAGATCCGGTCAAACAACGCCTC |
| sequence-based reagent (Mus musculus) | Mouse Fgfr2 forward (primer) | this paper | N/A | GGAAGGAGTTTAAGCAGGAGCATCG |
| sequence-based reagent (Mus musculus) | Mouse Fgfr2 reverse (primer) | this paper | N/A | CGATTCCCACTGCTTCAGCCATGAC |
| sequence-based reagent (Mus musculus) | Mouse Fgfr3 forward (primer) | this paper | N/A | GAAAGTGTGGTACCCTCCGATCGTG |
| sequence-based reagent (Mus musculus) | Mouse Fgfr3 reverse (primer) | this paper | N/A | GTCCAAAGCAGCCTTCTCCAAGAGG |
| sequence-based reagent (Mustela putorius furo) | Ferret FGFR2 forward (primer) | this paper | N/A | AGAGATAAGCTGACGCTGGGCAAACC |
| sequence-based reagent (Mustela putorius furo) | Ferret FGFR2 reverse (primer) | this paper | N/A | GAGGAAGGCAGGGTTCGTAAGGC |
| sequence-based reagent (Mustela putorius furo) | Ferret FGFR3 forward (primer) | this paper | N/A | GAGGCTAAATTACGGGTACCTGA |
| sequence-based reagent (Mustela putorius furo) | Ferret FGFR3 reverse (primer) | this paper | N/A | GAGAACAAAGACCACCCTGAAC |
| recombinant DNA reagent | pCAG-sFGFR3 (plasmid) | PMID: 11567107 | N/A | N/A |
| recombinant DNA reagent | pCAG-EGFP (plasmid) | PMID: 20181605 | N/A | N/A |
| recombinant DNA reagent | pCAG control (plasmid) | PMID: 26482531 | N/A | N/A |
| recombinant DNA reagent (Mustela putorius furo) | pCRII-ferret FGFR1_1 (plasmid) | this paper | N/A | vector: pCRII; cDNA fragment: ferret FGFR1. |
| recombinant DNA reagent (Mustela putorius furo) | pCRII-ferret FGFR1_2 (plasmid) | this paper | N/A | vector: pCRII; cDNA fragment: ferret FGFR1. |
| recombinant DNA reagent (Mustela putorius furo) | pCRII-ferret FGFR2 (plasmid) | PMID: 26482531 | N/A | vector: pCRII; cDNA fragment: ferret FGFR2. |
| recombinant DNA reagent (Mustela putorius furo) | pCRII-ferret FGFR3 (plasmid) | PMID: 26482531 | N/A | vector: pCRII; cDNA fragment: ferret FGFR3. |
| recombinant DNA reagent (Mustela putorius furo) | pCRII-ferret Sprouty2 (plasmid) | this paper | N/A | vector: pCRII; cDNA fragment: ferret Sprouty2. |
| recombinant DNA reagent (Mus musculus) | pCRII-mouse Fgfr1 (plasmid) | this paper | N/A | vector: pCRII; cDNA fragment: mouse Fgfr1. |
| recombinant DNA reagent (Mus musculus) | pCRII-mouse Fgfr2 (plasmid) | this paper | N/A | vector: pCRII; cDNA fragment: mouse Fgfr2. |
| recombinant DNA reagent (Mus musculus) | pCRII-mouse Fgfr3 (plasmid) | this paper | N/A | vector: pCRII;cDNA fragment: mouse Fgfr3. |
| recombinant DNA reagent (Mustela putorius furo) | pCRII-Ferret Cux1 (plasmid) | PMID: 20575059 | N/A | N/A |
| recombinant DNA reagent (Mustela putorius furo) | pCRII-Ferret Rorb (plasmid) | PMID: 20575059 | N/A | N/A |
| software, algorithm | FIJI | http://fiji.sc | RRID:SCR_002285 | N/A |
Additional files
-
Supplementary file 1
Raw data for the quantification.
- https://doi.org/10.7554/eLife.29285.019
-
Transparent reporting form
- https://doi.org/10.7554/eLife.29285.020
Download links
A two-part list of links to download the article, or parts of the article, in various formats.
Downloads (link to download the article as PDF)
Open citations (links to open the citations from this article in various online reference manager services)
Cite this article (links to download the citations from this article in formats compatible with various reference manager tools)
Gyrification of the cerebral cortex requires FGF signaling in the mammalian brain
eLife 6:e29285.
https://doi.org/10.7554/eLife.29285


