NuMA recruits dynein activity to microtubule minus-ends at mitosis
- University of California, San Francisco, United States
- University of California, Berkeley, United States
Figures
Figure 1 with 1 supplement
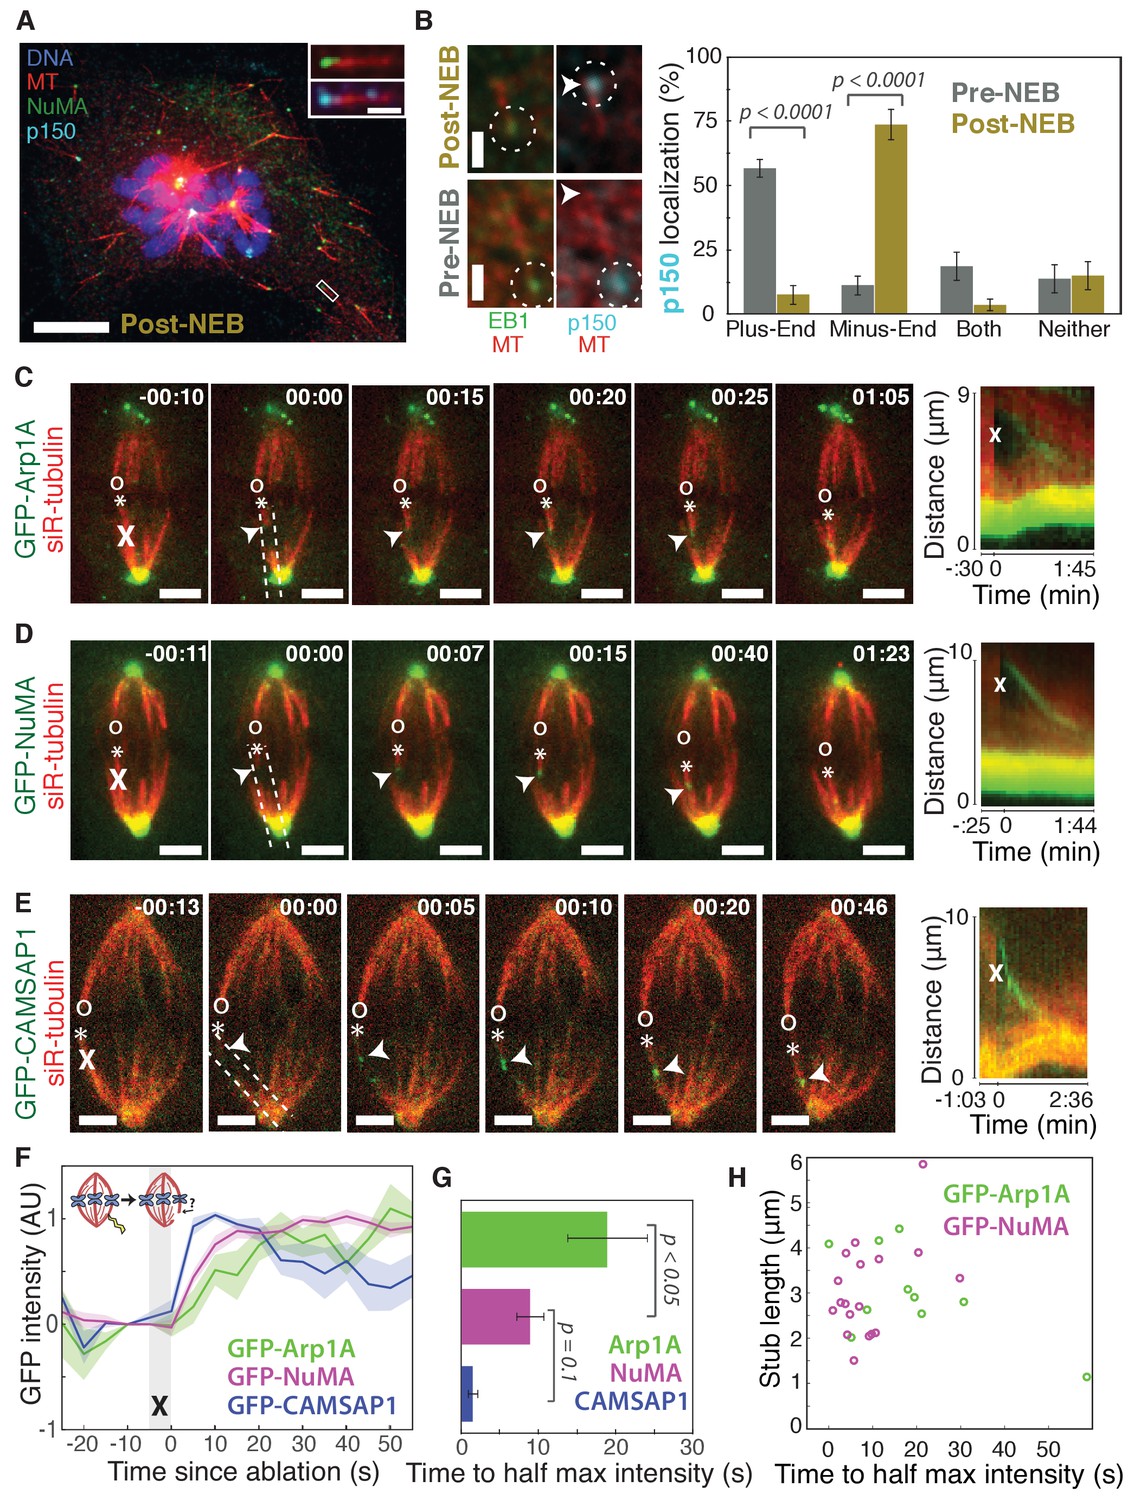
Dynactin and NuMA display specific, steady-state binding at mitotic minus-ends.
See also Figure 1—figure supplement 1 and Videos 1–3. (A) Representative immunofluorescence image showing co-localization of NuMA (green) and p150 (dynactin subunit; cyan) at microtubule minus-ends in mitotic PtK2 cells (post-NEB) fixed after washout of 5 μM nocodazole. Scale bar, 10 μm. Inset: zoom of white box, with 1 μm scale bar. (B) Representative immunofluorescence images of mitotic RPE1 cells, processed as in (A). After nuclear envelope breakdown (post-NEB), EB1 (green) and p150 (cyan) localize to opposite microtubule ends. In prophase cells (pre-NEB), p150 instead co-localizes with EB1 at plus-ends. Dashed white circles highlight ends. Scale bar, 1 μm. Graph displays mean percentage ±SEM of p150 at each location within one cell for n = 72 microtubules, 8 cells (pre-NEB); n = 57 microtubules, 16 cells (post-NEB). (C–E) Representative time-lapse live images and kymographs of PtK2 cells expressing (C) GFP-Arp1A, (D) GFP-NuMA, or (E) GFP-CAMSAP1. Arp1A, NuMA, and CAMSAP1 are all recruited to k-fiber minus-ends (arrowheads) created by ablation (‘X’s) and move with them as dynein pulls them poleward (Elting et al., 2014). Time is in min:s, with the frame captured immediately following ablation set to 00:00. ‘*’ marks plus-end of ablated k-fiber, and ‘o’ marks its sister. Scale bar, 5 μm. Kymographs (right) are along poleward paths (dashed lines). (F) Plot of mean normalized GFP intensity and SEM (shading) over time at ablation-created minus-ends for GFP-Arp1A, GFP-NuMA, and GFP-CAMSAP1. Time = 0 s at the first frame following ablation. n = 10 ablations, 7 cells (Arp1A); n = 18 ablations, 7 cells (NuMA); n = 13 ablations, 7 cells (CAMSAP1). (G) Time from ablation to half maximum GFP intensity, calculated for each individual ablation (see Materials and methods) and then averaged for data in (F). Error bars show SEM. p-Values calculated by Tukey post hoc test after one-way ANOVA (F(2,38) = 9.26, p=0.0005). (H) Time to half-maximum GFP-Arp1A or GFP-NuMA intensity at ablation-created minus-ends as a function of length of ablation-created k-fiber stubs. Correlation coefficient = −0.62, p=0.06, n = 10 (Arp1A); correlation coefficient = 0.44, p=0.07, n = 18 (NuMA).
Figure 1—figure supplement 1
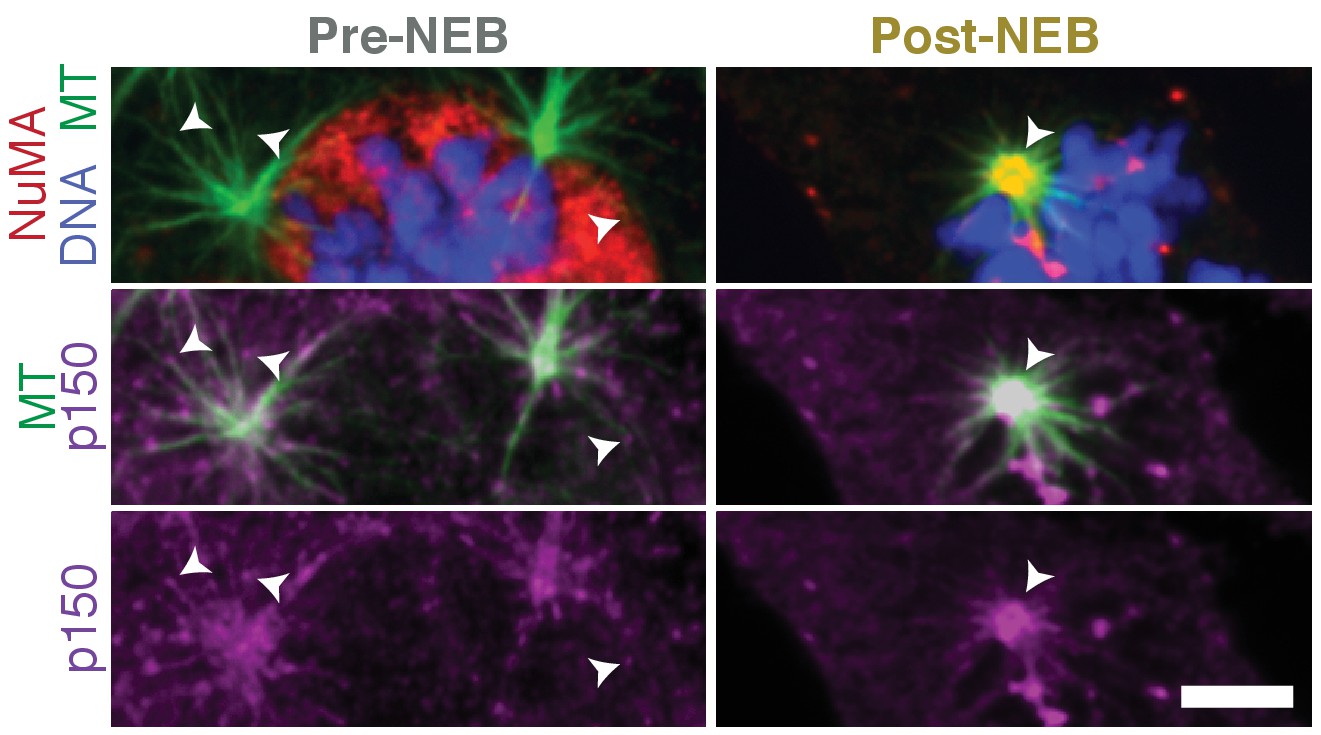
Dynactin localization shifts from plus-ends to minus-ends upon nuclear envelope breakdown.
Immunofluorescence showing localization of p150 (dynactin subunit; magenta) and NuMA (red) within asters formed after washout of 5 μM nocodazole in RPE1 cells. Before nuclear envelope breakdown (pre-NEB), NuMA is sequestered in the nucleus and p150 is visible at aster plus-ends (arrowheads), facing outward. After nuclear envelope breakdown (post-NEB), both NuMA and p150 concentrate at aster centers (arrowhead) where minus-ends are. (Similar to Figure 1B, where individual microtubules in the cell periphery with resolvable plus- and minus-ends were analyzed instead of the asters we show here.) Scale bar, 5 μm.
Figure 2 with 1 supplement

NuMA can localize to minus-ends independently of dynein.
See also Figure 2—figure supplement 1 and Video 4. (A–B) Models for targeting dynein to minus-ends. Model A, Structural Recognition: Cytoplasmic molecules may recognize the exposed α-tubulin interface at minus-ends and recruit dynein. Model B, Walk and Pile-up: Minus-end-directed dynein may walk to minus-ends and pile up. (C) Representative time-lapse live images and kymograph of PtK2 cell expressing GFP-NuMA, in which dynein-dynactin is inhibited by overexpression of p50 (dynamitin). K-fibers are unfocused and splayed, but NuMA is still robustly recruited to k-fiber minus-ends (arrowheads) created by ablation (‘X’). Time is in min:s, with frame captured immediately following ablation set to 00:00. ‘*’ marks plus-end of ablated k-fiber, and ‘o’ marks its sister. Scale bars, 5 µm. Kymograph (right) taken along dashed line path. (D) Plot of mean normalized GFP-NuMA intensity and SEM (shading) over time at ablation-created minus-ends. Time = 0 s at the first frame following ablation. n = 18 ablations, 7 cells for control; n = 14 ablations, 8 cells for dynein-inhibited (p50 overexpression). (E) Time from ablation to half maximum GFP-NuMA intensity, calculated for each individual ablation (see Methods) and then averaged for data in (D). Error bars show SEM. (F) Representative immunofluorescence images of inducible-Cas9 dynein heavy chain (DHC)-knockout HeLa cells (McKinley and Cheeseman, 2017) showing robust localization of NuMA and p150 (dynactin) at minus-ends when DHC is deleted. Scale bar, 5 μm.
Figure 2—figure supplement 1
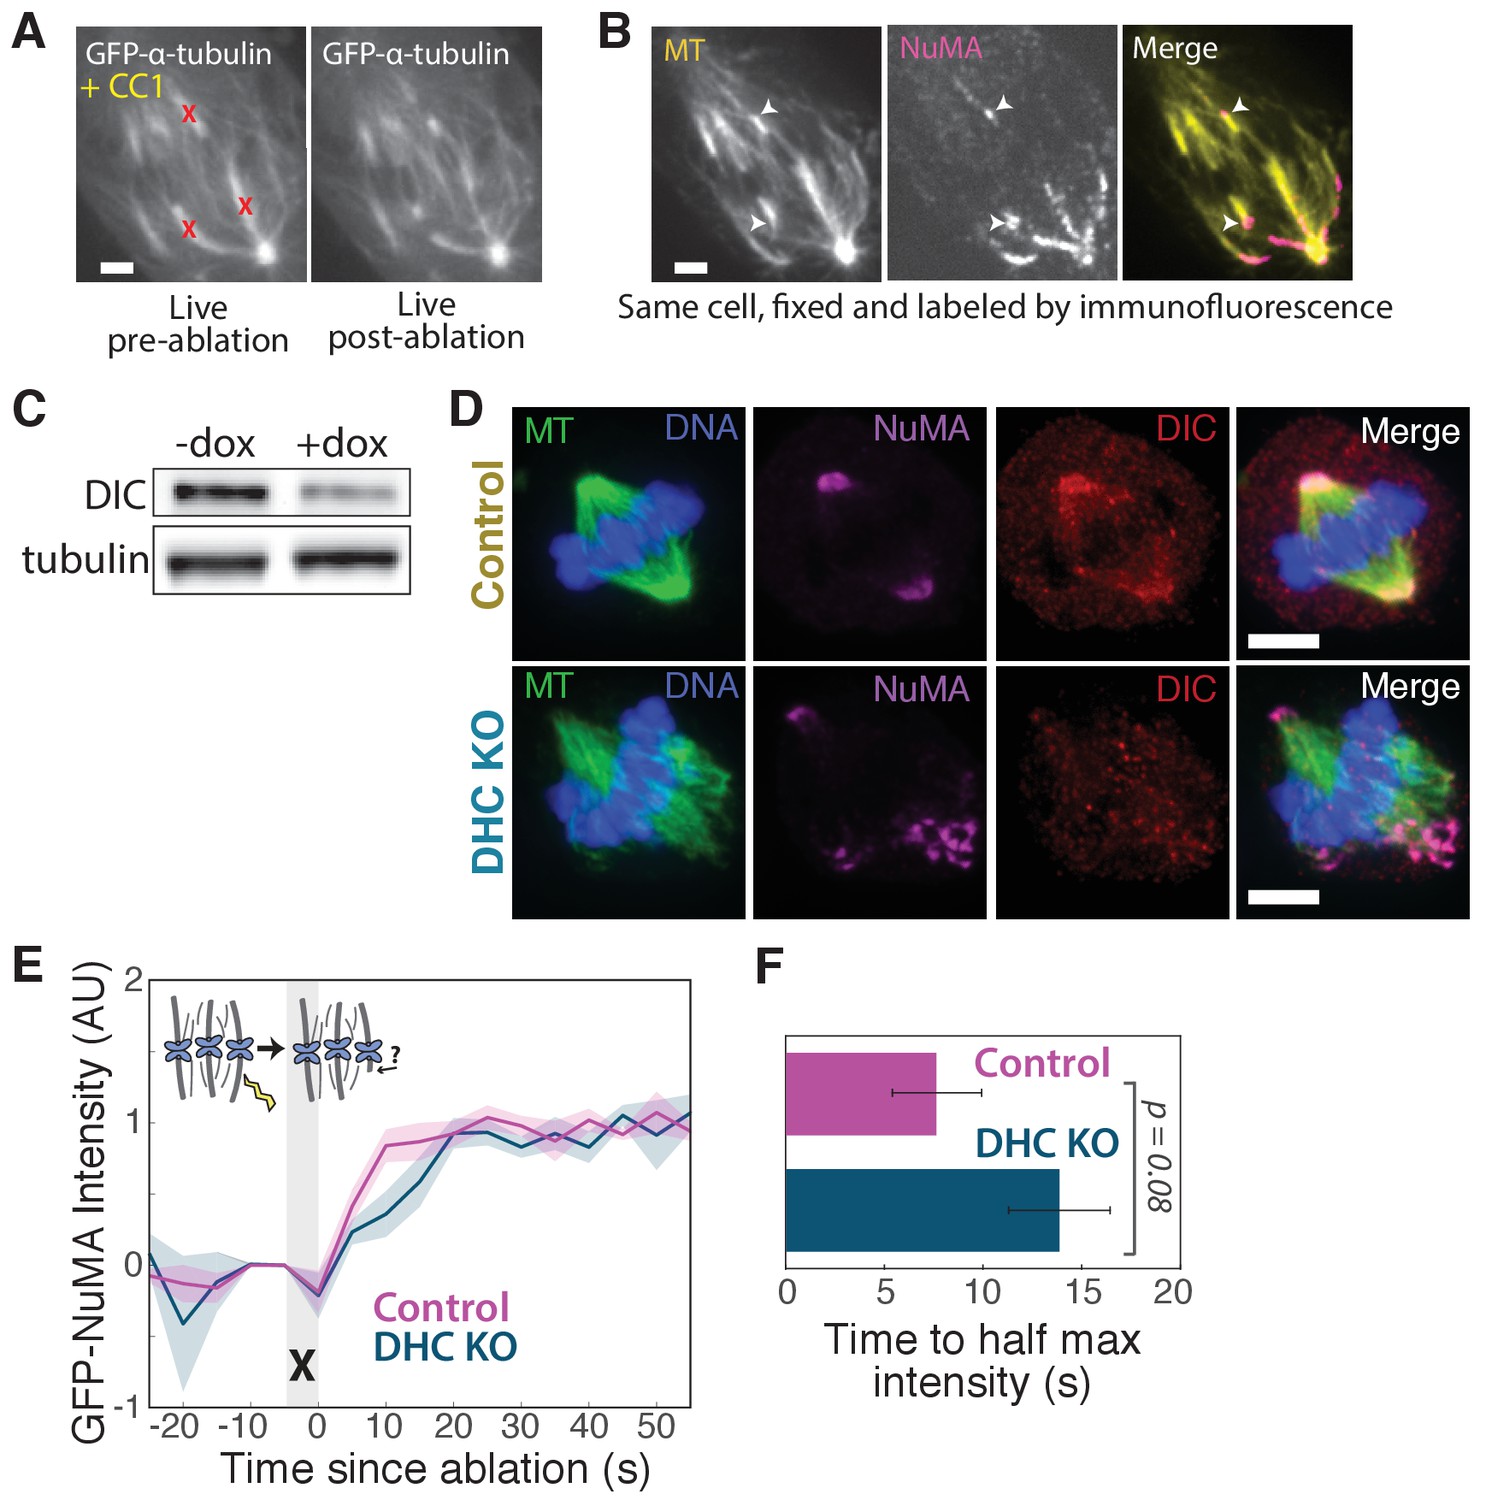
NuMA localizes to minus-ends despite dynein inhibition or knockout.
(A) Live images of GFP-α-tubulin immediately before and after k-fiber ablation at targeted sites (red ‘X’s) in a PtK2 cell in which dynein cargo-binding is inhibited by transfection of the dominant-negative p150-CC1 fragment (Quintyne and Schroer, 2002). Scale bar, 5 μm. (B) Immunofluorescence image of NuMA (magenta) and α-tubulin (yellow) in cell from (A), fixed after ablation. NuMA (arrowheads) localizes to new minus ends. Scale bar, 5 μm. (C) Western blot showing >65% depletion (normalized to α-tubulin) of dynein intermediate chain (DIC) protein at the cell population level after dynein heavy chain (DHC) depletion using inducible-Cas9 DHC-knockout HeLa cells (McKinley and Cheeseman, 2017). DIC depletion has been shown to correlate with DHC depletion (Levy and Holzbaur, 2008). Because knockout was heterogeneous across the population, dynein loss within individual cells chosen for analysis was always verified by immunofluorescence, as in (D), or by spindle phenotype. (D) Immunofluorescence images of inducible DHC-knockout HeLa cells show robust localization of NuMA at minus-ends after DHC knockout, in the absence of dynein (dynein intermediate chain; DIC). Scale bar, 5 μm. (E) Plot of mean normalized GFP-NuMA intensity and SEM (shading) over time at ablation-created minus-ends in HeLa cells with and without dynein deletion (DHC KO). Time = 0 s at the first frame following ablation (‘X’). n = 12 ablations, 7 cells for control; n = 10 ablations, 8 cells for DHC KO. (F) Time from ablation to half maximum GFP-NuMA intensity, calculated for each individual ablation (see Methods) and then averaged for data in (E). Error bars show SEM.
Figure 3 with 1 supplement
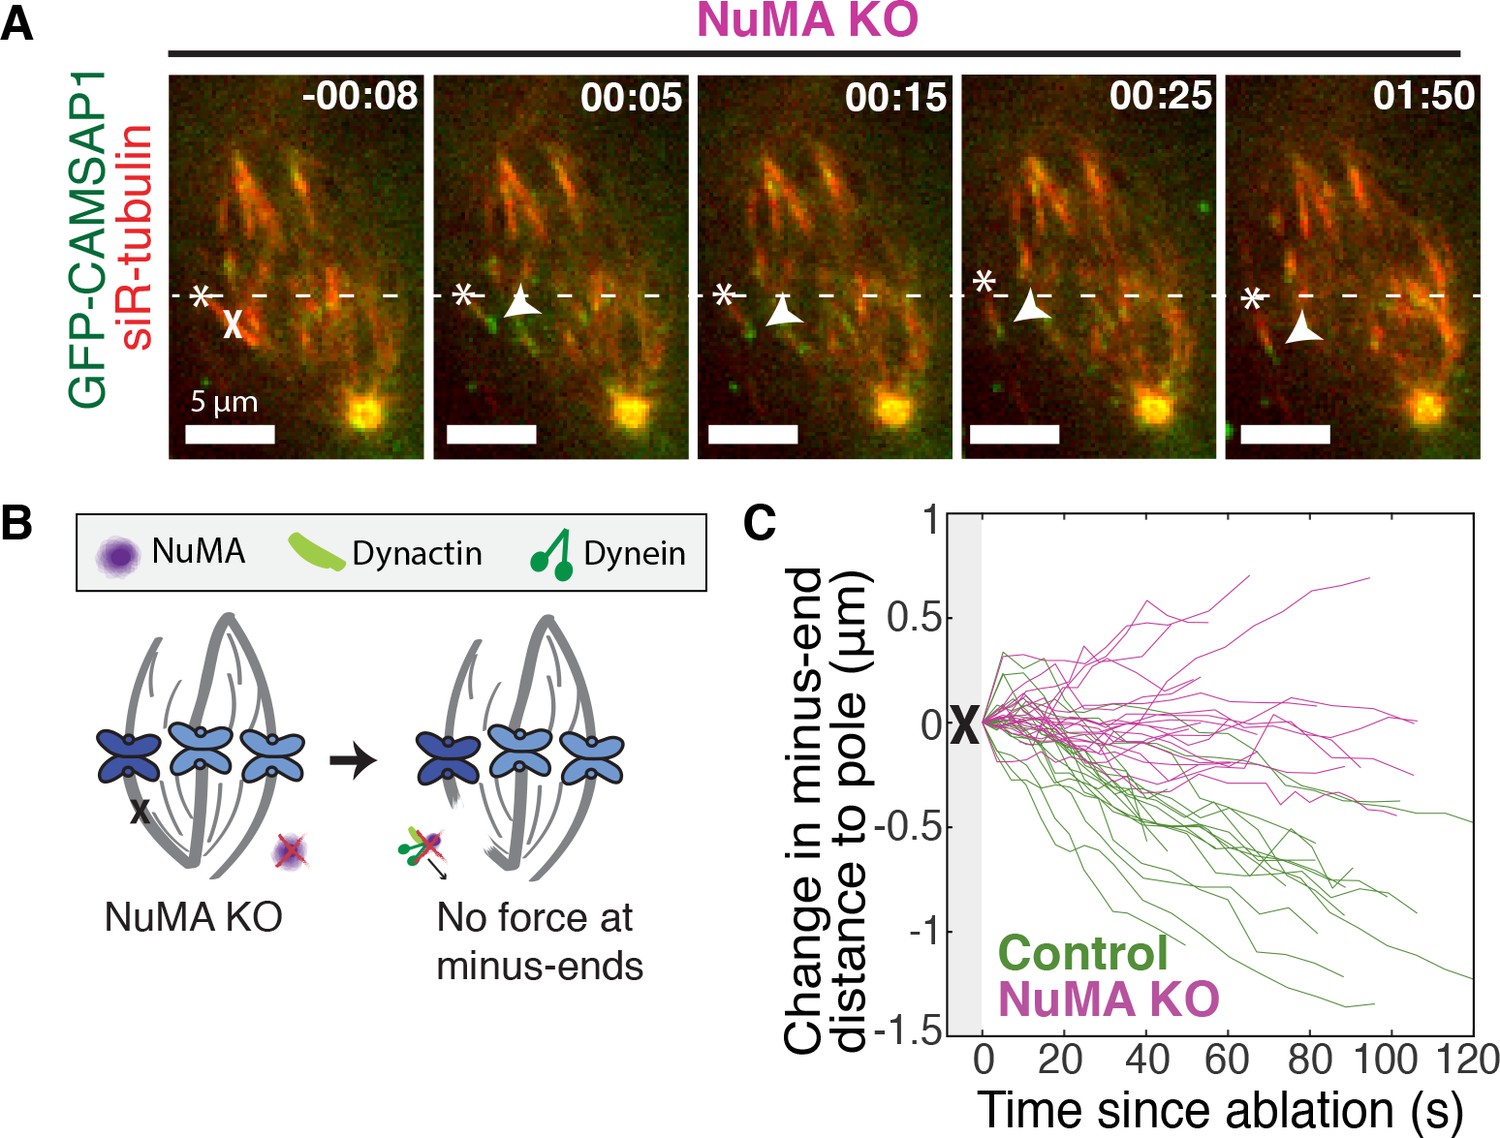
NuMA is required for force generation at minus-ends.
See also Figure 3—figure supplement 1 and Video 5. (A) Representative time-lapse live images of RPE1 cell in which NuMA has been knocked out using an inducible Cas9 system. GFP-CAMSAP1 is expressed to label minus-ends. After ablation (‘X’), the k-fiber minus-end (arrowhead) is not transported poleward by dynein and remains detached from the spindle. Time is in min:s, with the frame captured immediately following ablation set to 00:00 s. Plus-end of ablated k-fiber is marked by ‘*’. Scale bars, 5 μm. (B) Cartoon: In the absence of NuMA, force generation at ablation-created minus-ends is not observed. (C) Movement of ablation-created minus-ends (marked by GFP-CAMSAP1) relative to the pole. In control cells (green traces), minus-ends are transported toward the pole by dynein at consistent speeds, but this transport is lost when NuMA is knocked out (purple traces). n = 19 ablations, 8 cells (control); n = 20 ablations, 6 cells (NuMA knockout).
Figure 3—figure supplement 1
Inducible CRISPR/Cas9 NuMA knockout.
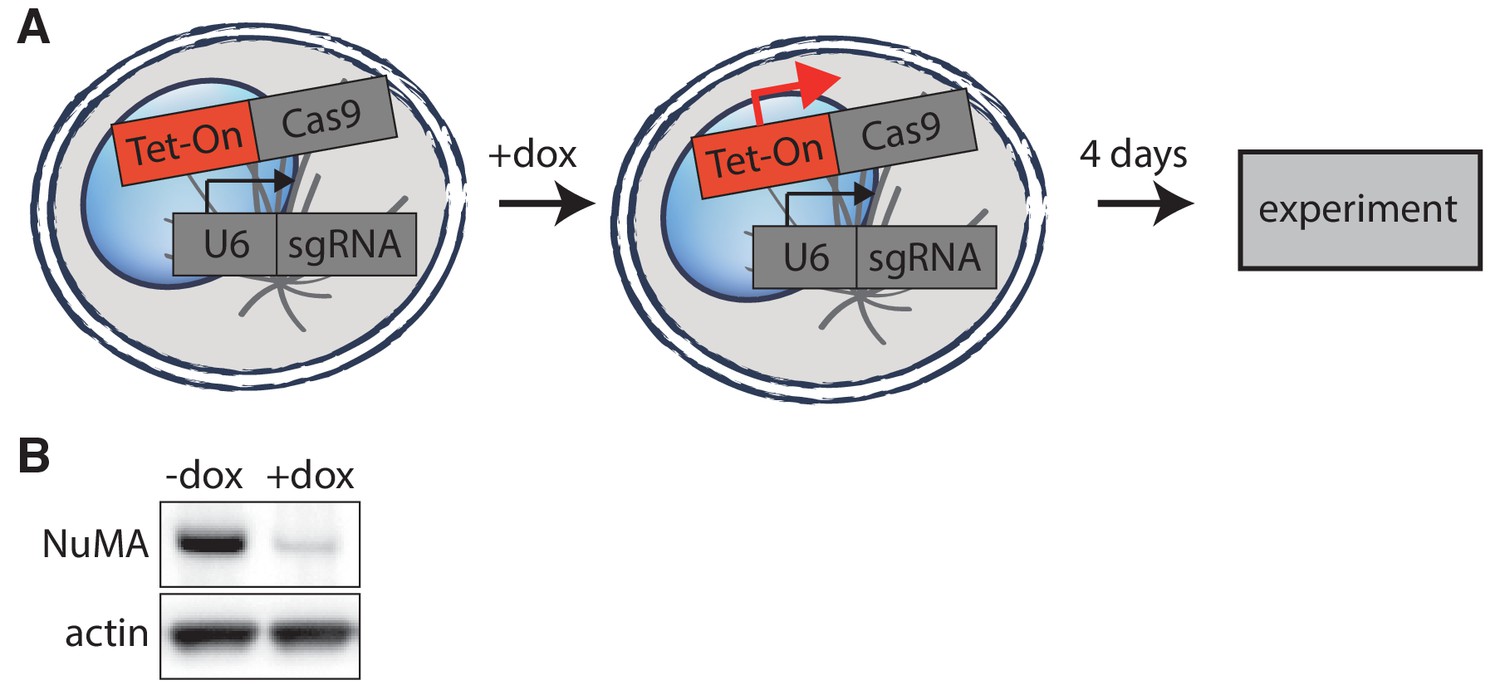
(A) Schematic of inducible CRISPR/Cas9 knockout system used (McKinley et al., 2015; Wang et al., 2015). Cell lines created have CRISPR/Cas9 and guide RNA stably integrated, but Cas9 expression is only induced upon doxycycline addition 4 days before imaging or analysis, allowing for genetic manipulation of essential mitotic genes. (B) Western blot showing >90% depletion (normalized to actin) of NuMA protein at the cell population level after knockout. Whenever possible, complete NuMA loss within individual cells analyzed was verified by immunofluorescence.
Figure 4
NuMA recruits dynactin to mitotic minus-ends.
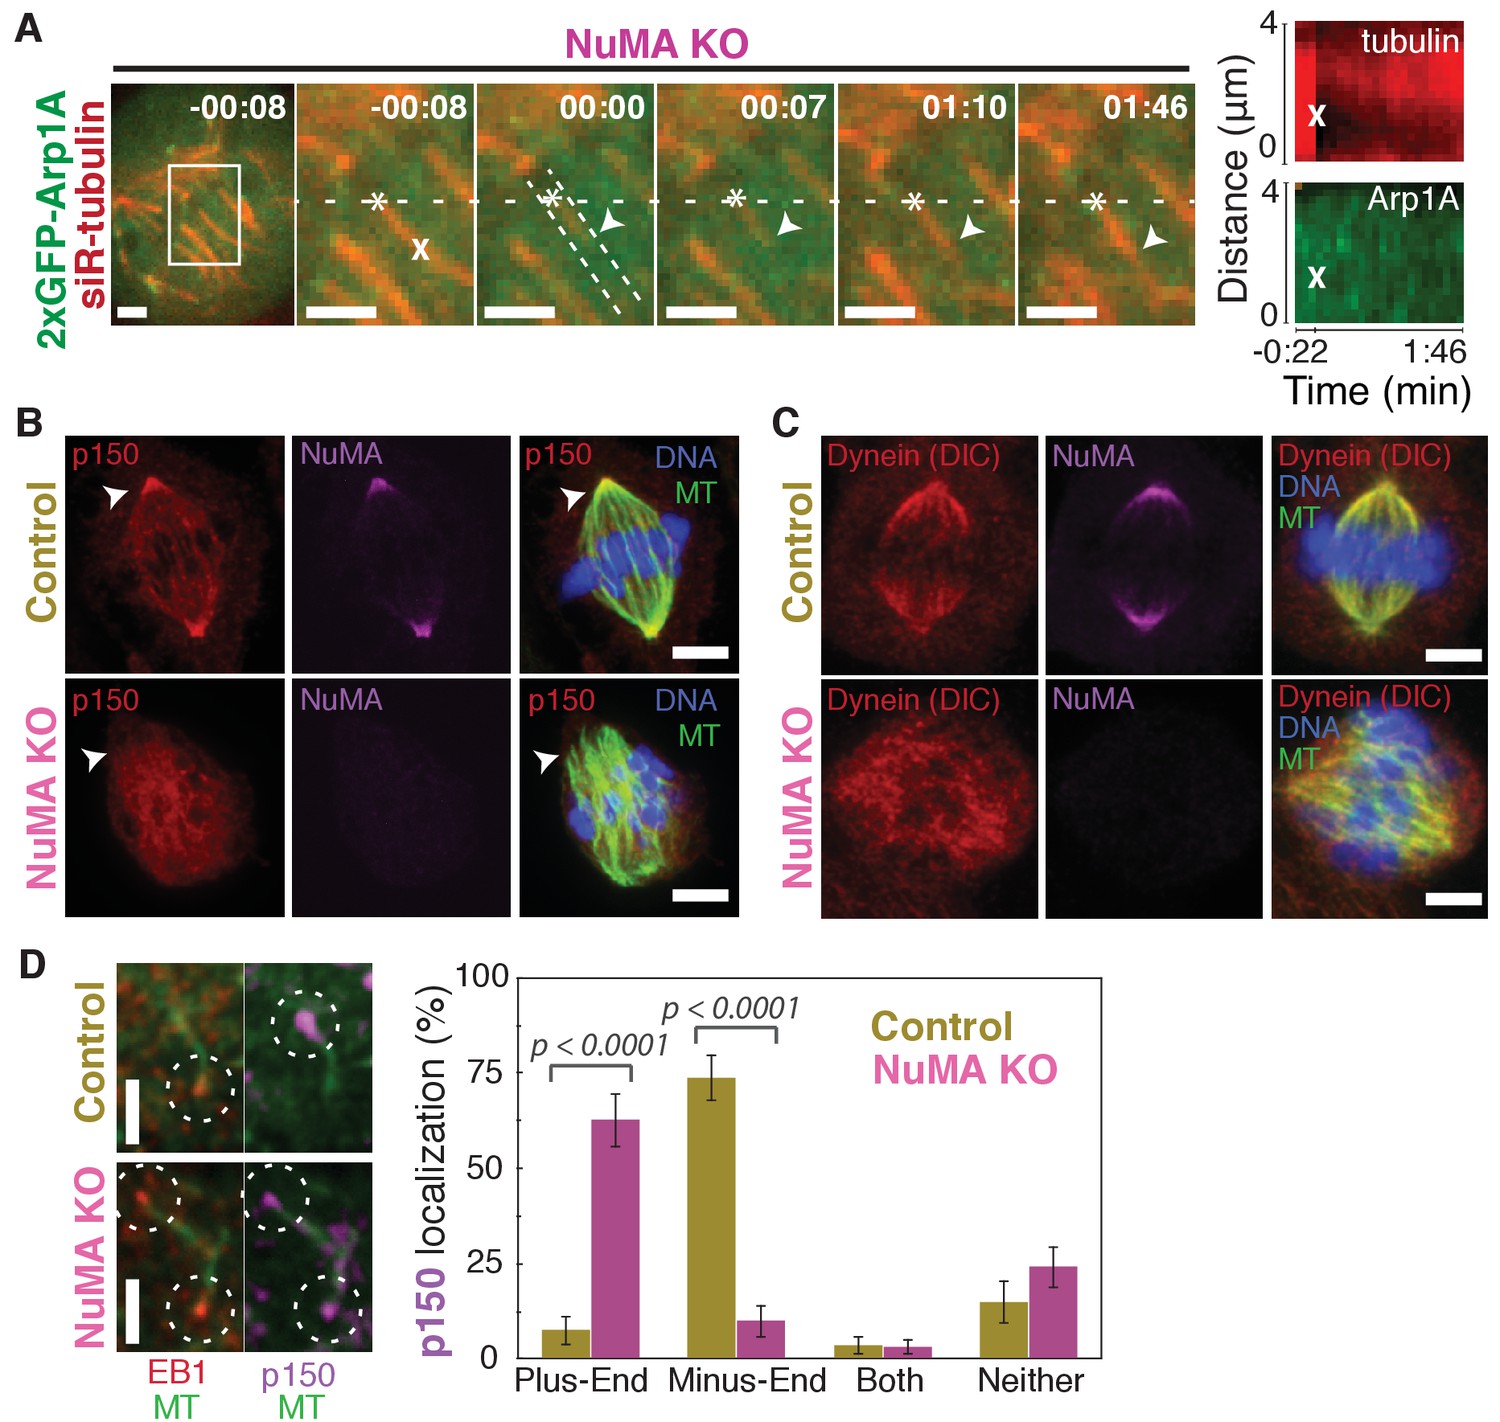
See also Video 6. (A) Representative time-lapse live images and kymograph of RPE1 cell in which NuMA has been knocked out using an inducible Cas9 system. 2xGFP-Arp1A recruitment was never observable at minus-ends (arrowheads) created by ablation (‘X’) (n = 16 ablations, 6 cells). Time is in min:s, with frame captured immediately following ablation set to 00:00. Plus-end of ablated k-fiber is marked by ‘*’. Scale bars, 2 µm. Kymographs (right) taken along dashed line path. (B) Representative immunofluorescence images of control and NuMA-knockout RPE1 spindles, showing a loss of p150 (dynactin) at minus-ends in the absence of NuMA. Scale bars, 5 μm. (C) Representative immunofluorescence images of control and NuMA-knockout RPE1 spindles. Dynein localizes along spindle microtubules in both conditions; its distribution is less noticeably altered by NuMA loss. Scale bars, 5 μm. (D) Representative immunofluorescence images of mitotic RPE1 cells (post-NEB) fixed after washout of 5 μM nocodazole, as in Figure 1A,B. In control cells, p150 (dynactin; purple) localizes to microtubule minus-ends, opposite EB1 (red). When NuMA is knocked out, p150 co-localizes with EB1 at plus-ends. Dashed white circles highlight ends. Scale bars, 2 μm. Graph displays mean percentage ±SEM of p150 at each location within each cell, for n = 72 microtubules, 8 cells (control); n = 72 microtubules, 11 cells (NuMA knockout).
Figure 5 with 1 supplement
NuMA localizes to minus-ends independently of known minus-end binding proteins.
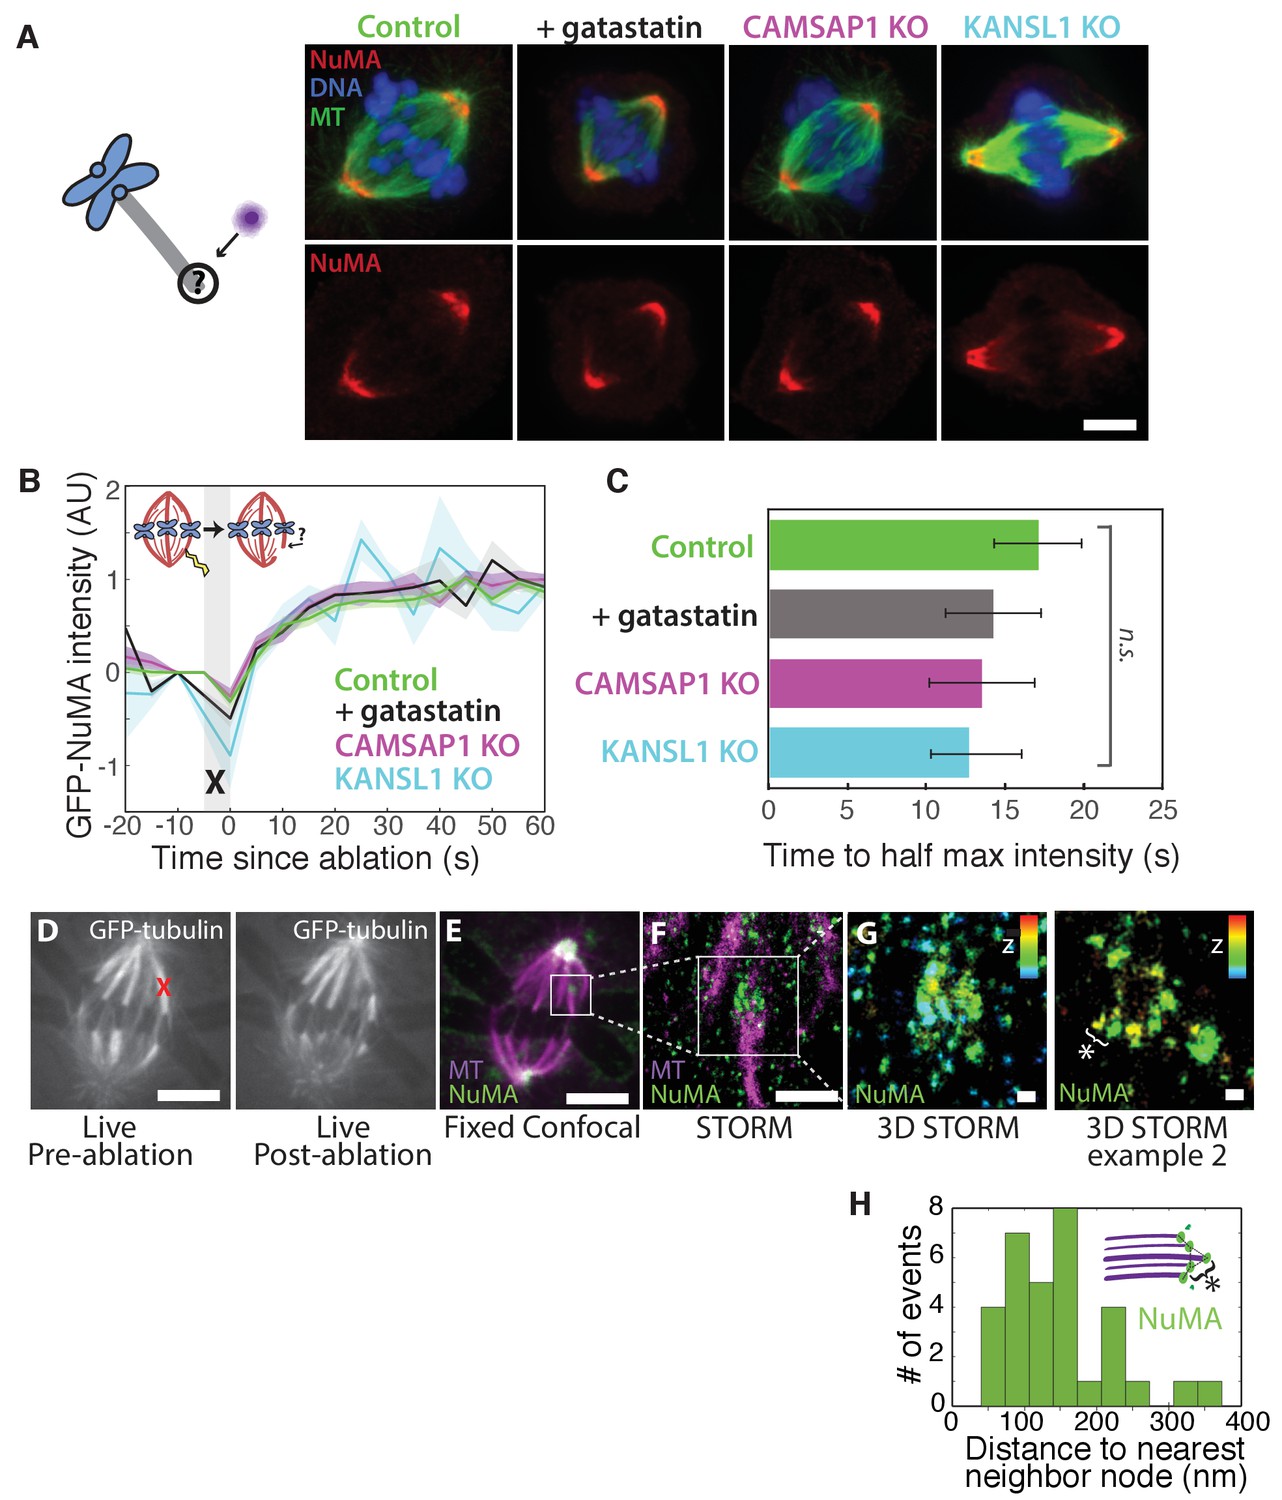
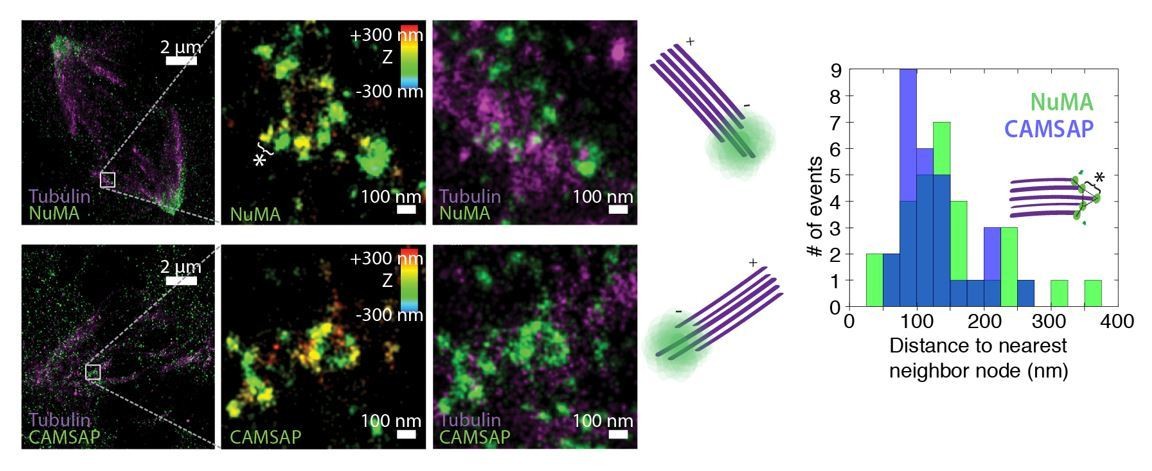
See also Figure 5—figure supplement 1. (A) Schematic of hypothesis that a minus-end binding protein recruits NuMA. Instead, representative immunofluorescence images show unchanged NuMA localization in control RPE1 cells and RPE1 cells in which direct mitotic minus-end binders are inhibited (30 μM gatastatin to inhibit γ-tubulin) or knocked out (CAMSAP1, KANSL1). Scale bar, 5 μm. (B) Plot of mean normalized GFP-NuMA intensity and SEM (shading) over time at ablation-created minus-ends. Time = 0 s at the first frame following ablation. n = 18 ablations, 7 cells (control); n = 9 ablations, 8 cells (+gatastatin); n = 10 ablations, 5 cells (CAMSAP1 knockout); n = 8 ablations, 4 cells (KANSL1 knockout). (C) Time from ablation to half maximum GFP-NuMA intensity was calculated for each individual ablation (see Materials and methods) and then averaged for data in (B). Error bars show SEM. ‘n.s.’ indicates no statistically significant difference. One-way ANOVA: F(3,42) = 0.45, p=0.72. (D–G) 3D STORM of NuMA at PtK2 k-fiber minus-ends created by ablation. (D) K-fibers were cut using ablation (red ‘X’), and cells were immediately fixed for immunofluorescence. Individual ablated spindles were imaged by spinning-disk confocal (E) and then by 3D STORM (F,G). In two right-most panels (G), structures are colored according to position in the Z-axis (red = +300 nm, blue = −300 nm). Scale bars: 5 μm in (D,E); 1 μm in (F); 100 nm in (G). (E) Distances between neighboring ‘nodes’ of NuMA (e.g., ‘*’ here and in (G)) are ~50–150 nm, consistent with measured spacing between individual microtubules within PtK2 k-fibers (McDonald et al., 1992). n = 32 nodes, 4 ablations.
Figure 5—figure supplement 1
Characterization of gatastatin treatment, CAMSAP1 knockout, and KANSL1 knockout.
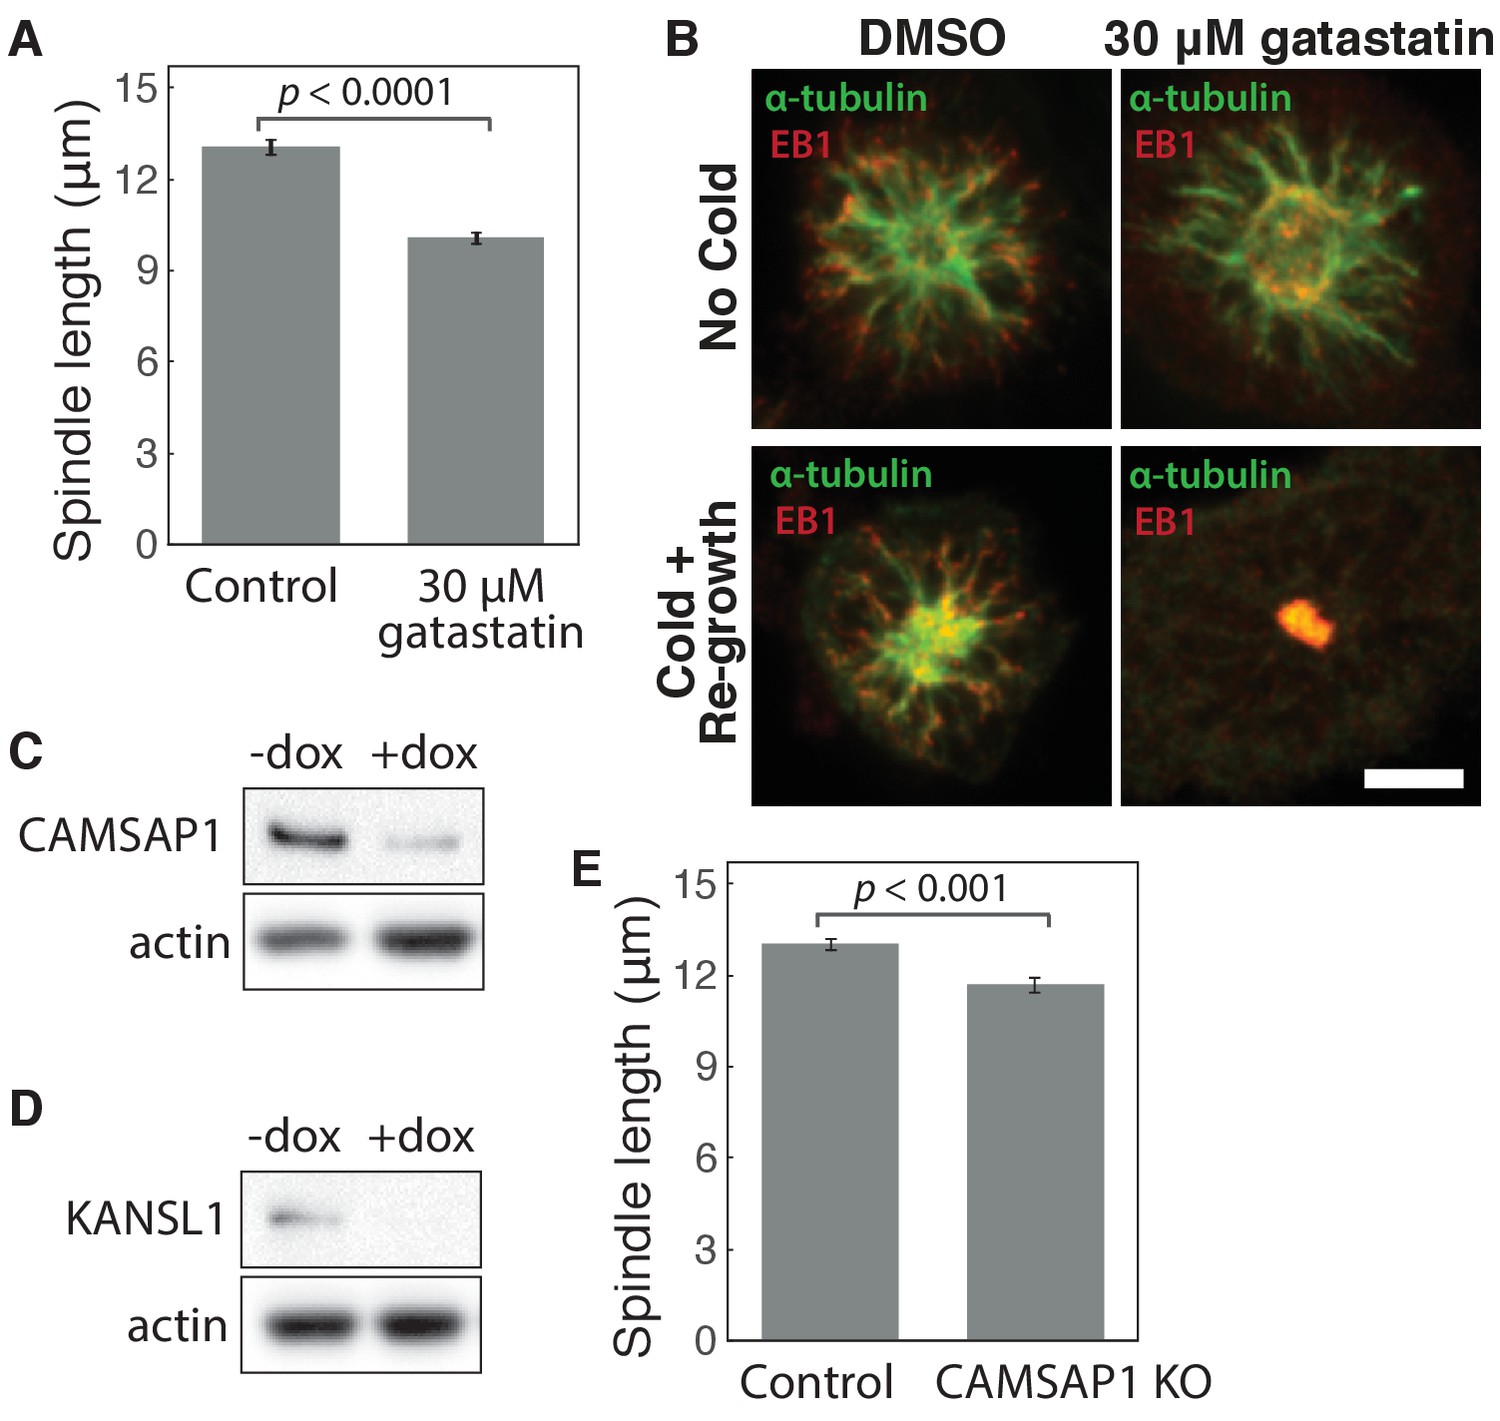
(A) Mean spindle length ± SEM in control RPE1 cells compared to cells treated with 30 μM gatastatin (γ-tubulin inhibitor) for 25 min. The mean length of gatastatin-treated spindles was reduced by 23%, very similar to previously reported measurements after γ-tubulin inhibition (Chinen et al., 2015). n = 24 control cells; n = 25 gatastatin-treated cells from three separate experiments. (B) Microtubule re-growth assay in STLC-arrested monopolar spindles after cold treatment (bottom panels) shows that 30 μM gatastatin blocks γ-TuRC’s ability to bind α-tubulin to nucleate microtubules. Because gatastatin specifically blocks γ-tubulin binding, not α- or β-tubulin, it does not depolymerize existing microtubule networks (top panels). Scale bar, 5 μm. (C–D) Western blot showing > 85% depletion (normalized to actin) of (B) CAMSAP1 and (C) KANSL1 protein at the cell population level after knockout (KO). Whenever possible, complete protein loss within individual cells analyzed was verified by immunofluorescence. (E) Mean spindle length ± SEM in control RPE1 cells (no doxycycline added) and CAMSAP1 knockout cells (after Cas9 induction by doxycycline). Complete CAMSAP1 loss was verified by immunofluorescence for all cells analyzed. n = 11 control cells; n = 12 CAMSAP1 knockout cells from one experiment.
Figure 6 with 1 supplement
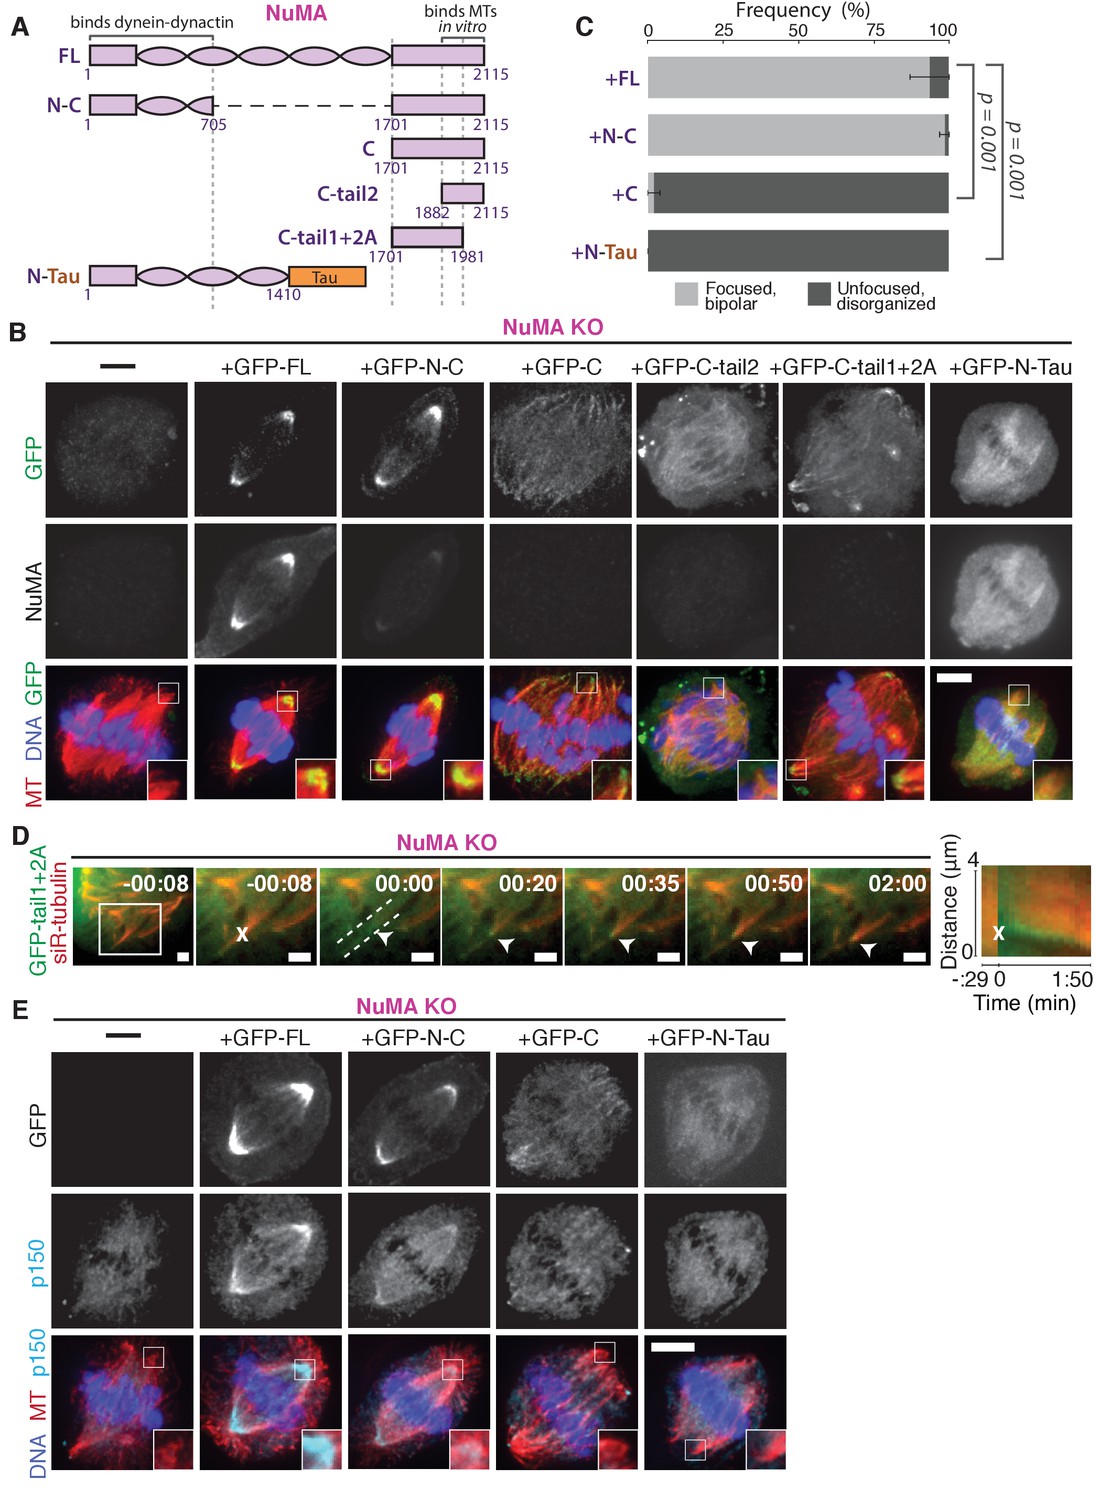
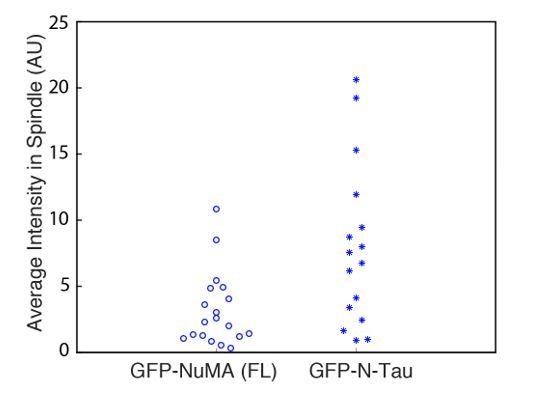
NuMA function requires both minus-end-recognition and dynactin-recruitment modules.
See also Table 1, Figure 6—figure supplement 1, and Video 7. (A) Schematic maps of NuMA truncations and chimeras used. ‘FL’ indicates full-length NuMA. ‘N-C,’ ‘C,’ ‘C-tail1,’ and ‘C-tail2’ are NuMA truncations as indicated. ‘N-Tau’ includes the microtubule binding domain of Tau (orange). Dynein-dynactin bind in the first 705 amino acids of NuMA (Kotak et al., 2012). ‘C-tail2’ was previously implicated in microtubule (MT) binding (Chang et al., 2017; Du et al., 2002; Gallini et al., 2016; Haren and Merdes, 2002). (B) Representative immunofluorescence images showing localization of GFP-tagged NuMA truncations and chimeras expressed in RPE1 cells in which endogenous NuMA has been knocked out. Canonical microtubule binding domains in tail2 localize all along spindle microtubules, while the addition of tail1 to tail2A confers minus-end localization. Note that NuMA antibody does not recognize NuMA’s C-terminus and only weakly recognizes its N-terminus. Scale bar, 5 μm. (C) Graph of the mean percentage of cells ± SEM for each condition from data in (B) that display bipolar spindles with focused poles (light gray) compared to disorganized spindle architecture characteristic of NuMA knockout (detached centrosomes, loss of two focused poles; dark gray). n = 19 (‘FL’); n = 32 (‘N-C’); n = 20 (‘C’); n = 16 (‘N-Tau’) from three to five independent experiments. p-Values calculated by Tukey post-hoc test after one-way ANOVA (F(3,10) = 267, p<0.00001). (D) Representative time-lapse live images and kymograph of RPE1 cell expressing GFP-C-tail1+2A in a NuMA-knockout background. After ablation (‘X’), C-tail1+2A is recruited to k-fiber minus-ends (arrowhead). The k-fiber stub slowly polymerizes, but its minus-end is not transported by dynein and remains detached from the spindle. Time is in min:s, with the frame captured immediately following ablation set to 00:00 s. Scale bars, 2 μm. Kymograph (right) taken along dashed line path. (E) Representative immunofluorescence images showing localization of dynactin (p150) after NuMA knockout and rescue with GFP-tagged NuMA truncations and chimeras in RPE1 cells. Constructs containing NuMA’s N-terminus recruit p150. Scale bar, 5 μm.
Figure 6—figure supplement 1

NuMA ‘C-tail1’ and ‘C-tail2A’ alone do not localize to minus-ends.
(A) Schematic maps of additional NuMA C-terminal tail truncations. (B) Representative immunofluorescence images showing localization of GFP-tagged NuMA truncations expressed in RPE1 cells in which endogenous NuMA has been knocked out. C-tail1 does not localize to microtubules and C-tail2A localizes all along spindle microtubules, while in combination (‘C-tail1+2A’, Figure 6) they localized at minus-ends. C-tail2B localizes to the cortex but not to microtubules. Scale bar, 5 μm.
Figure 7
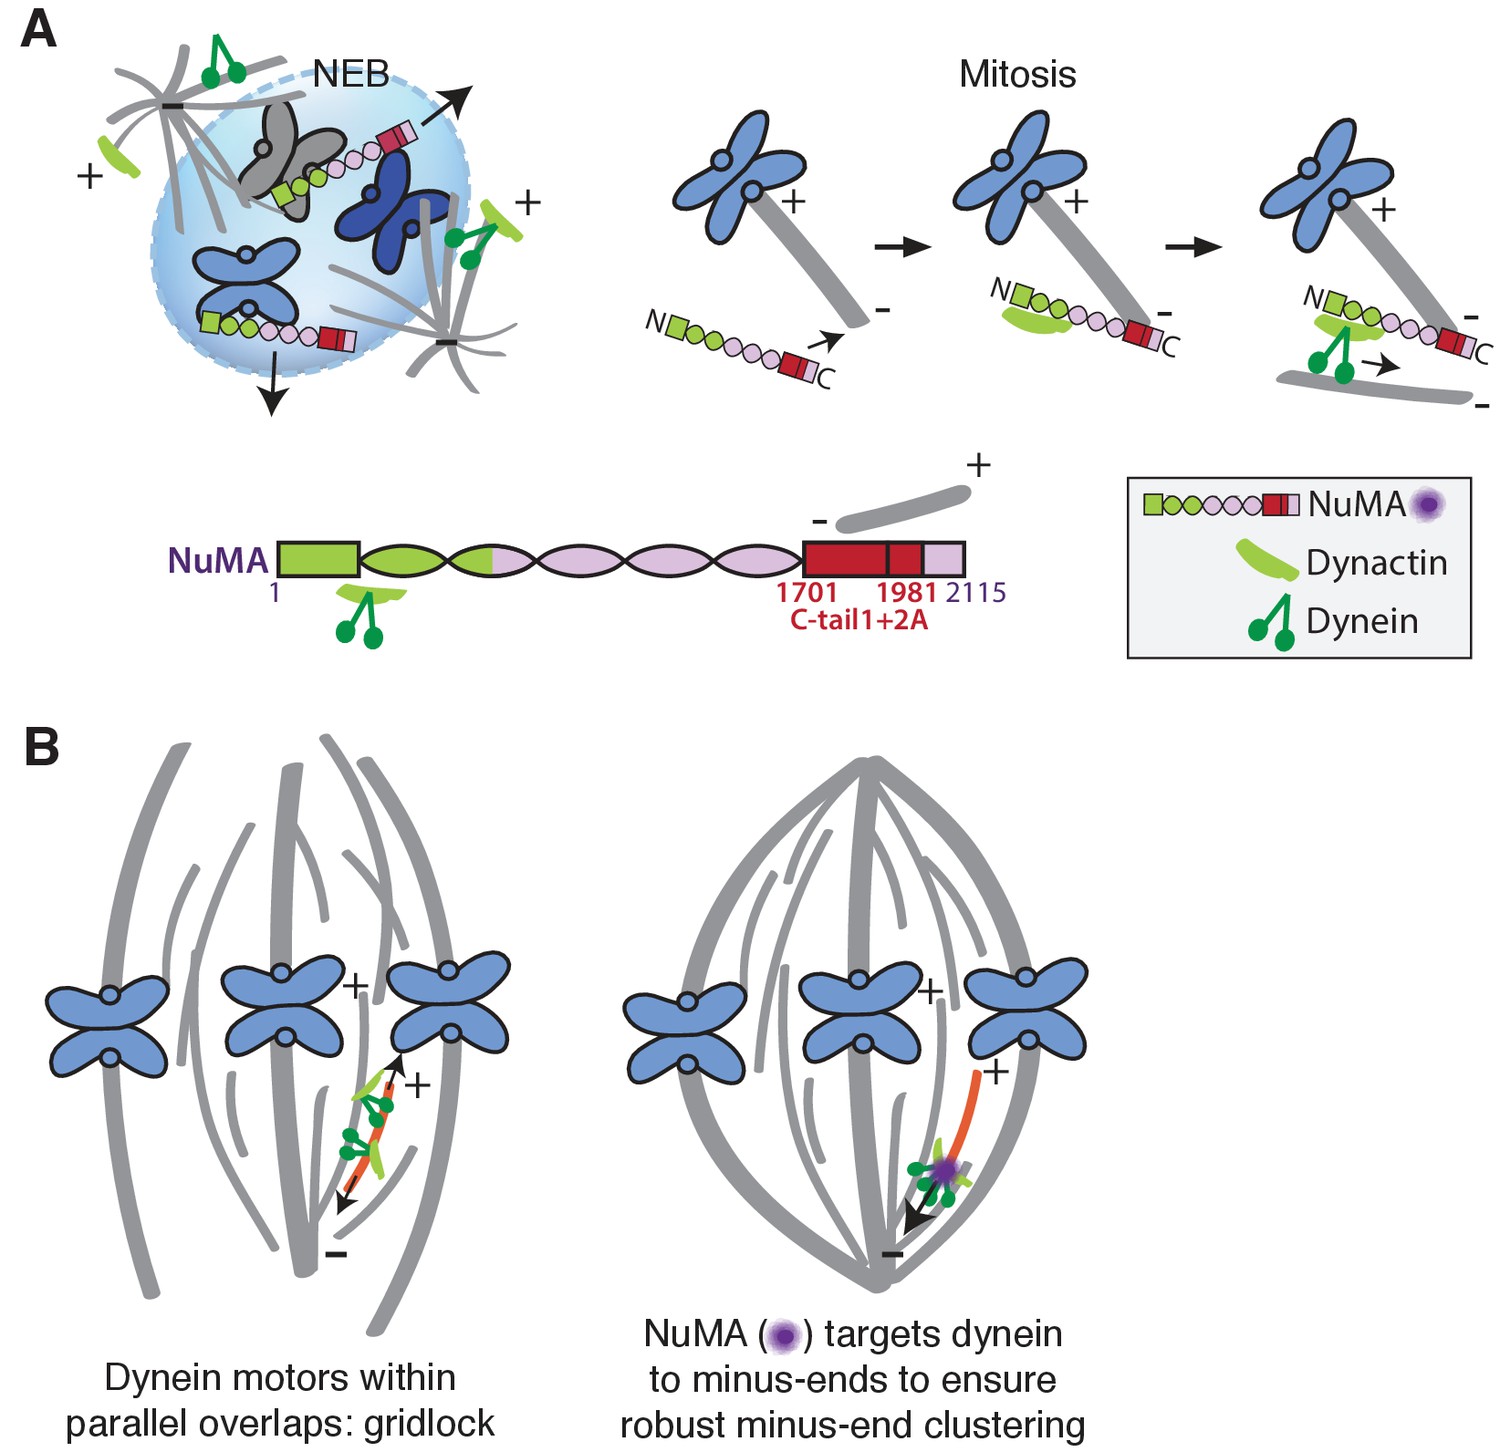
Model: NuMA spatially targets dynein activity to minus-ends at mitosis to ensure minus-end clustering into poles.
(A) Our findings suggest that NuMA confers minus-end targeting to the dynein-dynactin complex upon NEB, when NuMA is released from the nucleus. NuMA localization at minus-ends is mediated by a region of its C-terminus (amino acids 1701–1981, in red) that includes tail1 in addition to lattice-binding domain tail2A. NuMA targets dynactin to minus-ends, localizing dynein motor activity. (B) Model: Without minus-end targeting, dynein molecules acting on the red microtubule oppose each other, resulting in gridlock (left). NuMA-mediated targeting of force to minus-ends allows for productive clustering of the red microtubule into the pole (right). Altogether, the data support a model for mammalian spindle organization in which targeting poleward force to microtubule minus-ends specifically – by NuMA-mediated dynactin recruitment – provides robust clustering of microtubules into a focused, bipolar spindle.
Author response image 1
Author response image 2
Videos
Video 1
Dynactin is robustly recruited to new spindle microtubule minus-ends.
See also Figure 1C. Live confocal imaging of a PtK2 cell expressing GFP-Arp1A, with spindle microtubules labeled by siR-tubulin. GFP-Arp1A is recruited to k-fiber minus-ends (arrowhead) created by ablation (‘X’) and moves with them as dynein pulls them poleward (Elting et al., 2014). Time is in min:s, with the frame captured immediately following ablation set to 00:00. Plus-end of ablated k-fiber is marked by ‘*’. Scale bar, 5 μm.
Video 2
NuMA is robustly recruited to new spindle microtubule minus-ends.
See also Figure 1D. Live confocal imaging of a PtK2 cell expressing GFP-NuMA, with spindle microtubules labeled by siR-tubulin. GFP-NuMA is quickly recruited to k-fiber minus-ends (arrowhead) created by ablation (‘X’) and moves with them as dynein pulls them poleward (Elting et al., 2014). Time is in min:s, with the frame captured immediately following ablation set to 00:00. Plus-end of ablated k-fiber is marked by ‘*’. Scale bar, 5 μm.
Video 3
CAMSAP1 is robustly recruited to new spindle microtubule minus-ends.
See also Figure 1E. Live confocal imaging of a PtK2 cell expressing GFP-CAMSAP1, with spindle microtubules labeled by siR-tubulin. GFP-CAMSAP1 is immediately recruited to k-fiber minus-ends (arrowhead) created by ablation (‘X’) and moves with them as dynein pulls them poleward. Time is in min:s, with the frame captured immediately following ablation set to 00:00. Plus-end of ablated k-fiber is marked by ‘*’. Scale bar, 5 μm.
Video 4
NuMA quickly localizes to k-fiber minus-ends despite dynein-dynactin inhibition.
See also Figure 2C. Live confocal imaging of a PtK2 cell expressing GFP-NuMA, in which dynein-dynactin is inhibited by overexpression of p50 (dynamitin). K-fibers are unfocused and splayed due to dynein-dynactin inhibition, but NuMA is still robustly recruited to k-fiber minus-ends (arrowheads) created by ablation (‘X’). Time is in min:s, with frame captured immediately following ablation set to 00:00. Plus-end of ablated k-fiber is marked by ‘*’. Scale bar, 5 µm.
Video 5
NuMA is required for transport of minus-ends by dynein.
See also Figure 3A. Live confocal imaging of a RPE1 cell in which NuMA has been knocked out using an inducible Cas9 system, and GFP-CAMSAP1 is expressed to label minus-ends. After ablation (‘X’), the k-fiber minus-end (arrowhead) is not transported poleward by dynein and remains detached from the disorganized spindle. Time is in min:s, with the frame captured immediately following ablation set to 00:00 s. Plus-end of ablated k-fiber is marked by ‘*’. Scale bar, 5 μm.
Video 6
Dynactin is not recruited to minus-ends in the absence of NuMA.
See also Figure 4A. Live confocal imaging of a RPE1 cell in which NuMA has been knocked out using an inducible Cas9 system. In the absence of NuMA, 2xGFP-Arp1A does not localize to k-fiber minus-ends, and its recruitment is not detectable at new minus-ends (arrowheads) created by ablation (‘X’). Note that mislocalized 2xGFP-Arp1A puncta diffuse randomly within the spindle, including within microns of the new minus-end, but do not remain there. Time is in min:s, with frame captured immediately following ablation set to 00:00. Plus-end of ablated k-fiber is marked by ‘*’. Scale bar, 5 µm.
Video 7
The ‘tail1+2A’ region of NuMA’s C-terminus is sufficient for minus-end localization.
See also Figure 6D. Live confocal imaging of a RPE1 cell expressing GFP-C-tail1+2A in a NuMA knockout background. After ablation (‘X’), GFP-C-tail1+2A is recruited to k-fiber minus-ends (arrowhead). The k-fiber stub slowly polymerizes, but its minus-end is not transported by dynein and remains detached from the spindle. Note that C-tail1+2A does not rescue spindle architecture; video shows one confocal slice of a three-dimensionally disorganized spindle. Also note that bright GFP signal from a neighboring interphase cell is noticeable on the left side of the video. Time is in min:s, with the frame captured immediately following ablation set to 00:00 s. Plus-end of ablated k-fiber is marked by ‘*’. Scale bar, 5 μm.
Tables
Table 1
NuMA’s pole-focusing ability correlates with dynactin- and minus-end-binding.
See also Figure 6 and Figure 6—figure supplement 1.
| Knockout and rescue with NuMA version: | Recruits dynactin | Localizes to lattice (no end preference) | Localizes to preferentially to minus-ends | Rescues pole focusing |
|---|---|---|---|---|
| FL | + | - | + | + |
| N-C | + | - | + | + |
| N-Tau | + | + | - | - |
| C | - | - | + | - |
| C-tail1+2A | n.d. | - | + | - |
| C-tail2 | n.d. | + | - | - |
-
n.d.=not done, but unlikely to associate with dynactin given that the full C-terminus does not.
Key resources table
| Reagent type (species) or resource | Designation | Source or reference | Identifiers | Additional information |
|---|---|---|---|---|
| Cell line (Potorous tridactylus) (male) | PtK2 | T. Mitchison | ATCC Cat#CCL-56; RRID: CVCL_0514 | kidney epithelial |
| Cell line (P. tridactylus) (male) | PtK2 GFP-tubulin | PMID: 12604591 | kidney epithelial, stably expressing GFP-α-tubulin | |
| Cell line (Homo sapiens) (female) | RPE1 | ATCC | ATCC Cat#CRL-4000; RRID: CVCL_4388 | retina, epithelial |
| Cell line (H. sapiens) (female) | RPE1 NuMA knockout | this paper | RPE1 with stably integrated spCas9 (Tet-On promoter) and NuMA sgRNA #2 | |
| Cell line (H. sapiens) (female) | RPE1 CAMSAP1 knockout | this paper | RPE1 with stably integrated spCas9 (Tet-On promoter) and CAMSAP1 sgRNA #1 | |
| Cell line (H. sapiens) (female) | RPE1 KANSL1 knockout | this paper | RPE1 with stably integrated spCas9 (Tet-On promoter) and KANSL1 sgRNA #3 | |
| Cell line (H. sapiens) (female) | HeLa dynein heavy chain (DHC) knockout | PMID: 28216383 | cmk1a DYNC1H1 sgD1.1 | RPE1 with stably integrated spCas9 (Tet-On promoter) and DHC sgRNA |
| Recombinant DNA reagent (plasmid) | GFP-Arp1A | I. Cheeseman | Addgene 4432 | Progenitor: pBABE variant |
| Recombinant DNA reagent (plasmid) | 2xGFP-Arp1A | this paper | Progenitor: GFP-Arp1A | |
| Recombinant DNA reagent (plasmid) | DsRed-p150217-548 (CC1) | PMID: 12391026 | Progenitor: pDsRed-N1 (Clontech) | |
| Recombinant DNA reagent (plasmid) | mCherry-p50 | PMID: 19196984 | Progenitor: mCherry-C1 (Clontech) | |
| Recombinant DNA reagent (plasmid) | GFP-CAMSAP1 | PMID: 24486153 | Progenitor: pEGFP-C1 (Clontech) | |
| Recombinant DNA reagent (plasmid) | GFP-NuMA | PMID: 15561764 | Progenitor: pEGFP-N1 (Clontech) | |
| Recombinant DNA reagent (plasmid) | GFP-NuMA_resistant | this paper | Progenitor: GFP-NuMA. Invisible to NuMA sgRNA #2. NM_006185.3 | |
| Recombinant DNA reagent (plasmid) | GFP-NuMA 'N-C' | this paper | Progenitor: GFP-NuMA_resistant | |
| Recombinant DNA reagent (plasmid) | GFP-NuMA 'C' | this paper | Progenitor: GFP-NuMA_resistant | |
| Recombinant DNA reagent (plasmid) | GFP-NuMA 'C-tail1' | this paper | Progenitor: GFP-NuMA_resistant | |
| Recombinant DNA reagent (plasmid) | GFP-NuMA 'C-tail2' | this paper | Progenitor: GFP-NuMA_resistant | |
| Recombinant DNA reagent (plasmid) | GFP-NuMA 'C-tail2A' | this paper | Progenitor: GFP-NuMA_resistant | |
| Recombinant DNA reagent (plasmid) | GFP-NuMA 'C-tail2B' | this paper | Progenitor: GFP-NuMA_resistant | |
| Recombinant DNA reagent (plasmid) | GFP-N-Tau | this paper | Progenitors: GFP-NuMA_resistant; pmEmerald-MAPTau-C10 (M.Davidson) | |
| Antibody | anti-α-tubulin (DM1α; mouse) | Sigma | Sigma T6199 | IF (1:1000); WB (1:5000). RRID: AB_477583 |
| Antibody | anti-α-tubulin (DM1α; mouse) conjugated to AF488 | Cell Signaling | Cell Signaling 8058S | IF (1:200). RRID: AB_10860077 |
| Antibody | anti-α-tubulin (rabbit) | Abcam | Abcam ab18251 | IF (1:500). RRID: AB_2210057 |
| Antibody | anti-NuMA (rabbit) | Novus Biologicals | Novus Biologicals NB500-174 | IF (1:400); WB (1:1000). RRID: AB_10002562 |
| Antibody | anti-p150-Glued (mouse) | BD Biosciences | BD Biosciences 610473 | IF (1:400). RRID: AB_397845 |
| Antibody | anti-dynein intermediate chain (mouse) | Millipore | Millipore MAB1618MI | IF (1:250); WB (1:250). RRID: AB_2246059 |
| Antibody | anti-EB1 (rabbit) | Santa Cruz Biotech | Santa Cruz sc-15347 | IF (1:100). RRID: AB_2141629 |
| Antibody | anti-γ-tubulin (rabbit) | Sigma | Sigma T3559 | IF (1:500). RRID: AB_477575 |
| Antibody | anti-KANSL1 (rabbit) | Abnova | Abnova PAB20355 | WB (1:500). RRID: AB_10984400 |
| Antibody | anti-CAMSAP1 (rabbit) | Novus Biologicals | Novus Biologicals NBP1-26645 | WB (1:500). RRID: AB_1852845 |
| Antibody | anti-GFP (camel) conjugated to Atto488 | ChromoTek | ChromoTek gba-488 | IF (1:500). RRID: AB_2631434 |
| Dye | siR-tubulin | Cytoskeleton, Inc. | Cytoskeleton Inc. CYSC-002 | 100 nM |
| Drug | verapamil | Cytoskeleton, Inc. | Cytoskeleton Inc. CYSC-002 | 10 μM |
| Drug | gatastatin | PMID: 26503935 | 30 μM | |
| Drug | nocodazole | Sigma | Sigma M1404 | 5 μM |
| Drug | STLC | Sigma | Sigma 164739 | 10 μM |
| Sequence-based reagent | NuMA sgRNA #1 | this paper | 5'-ATGACACTCCACGCCACCCG-3' | |
| Sequence-based reagent | NuMA sgRNA #2* | this paper | 5'-AAGTCCAGTCTCTCTGACAC-3' | |
| Sequence-based reagent | NuMA sgRNA #3 | this paper | 5'-ACAGCAAATCTTGAAGCAGC-3' | |
| Sequence-based reagent | CAMSAP1 sgRNA #1* | this paper | 5'-GCCGCGTCGTAGCGGTCCAG-3' | |
| Sequence-based reagent | CAMSAP1 sgRNA #2 | this paper | 5'-CCGACAGTCTGTATAATATT-3' | |
| Sequence-based reagent | CAMSAP1 sgRNA #3 | this paper | 5'CCGAATATTATACAGACTGT-3' | |
| Sequence-based reagent | KANSL1 sgRNA #1 | this paper | 5'-GAGCCAGTTTGAACCGGATA-3' | |
| Sequence-based reagent | KANSL1 sgRNA #2 | this paper | 5'-ACACCATATCCGGTTCAAAC-3' | |
| Sequence-based reagent | KANSL1 sgRNA #3* | this paper | 5'-GAGCCCGTTTTCCCCCATTG-3' |
-
*Guide RNA expressed by cell line used for subsequent experiments, following initial verification of consistent spindle phenotypes.
Additional files
-
Transparent reporting form
- https://doi.org/10.7554/eLife.29328.023
Download links
A two-part list of links to download the article, or parts of the article, in various formats.
Downloads (link to download the article as PDF)
Open citations (links to open the citations from this article in various online reference manager services)
Cite this article (links to download the citations from this article in formats compatible with various reference manager tools)
NuMA recruits dynein activity to microtubule minus-ends at mitosis
eLife 6:e29328.
https://doi.org/10.7554/eLife.29328


