Glucose inhibits cardiac muscle maturation through nucleotide biosynthesis
- University of California, Los Angeles, United States
- Kyoto University, Japan
- National Institute for Materials Science, Japan
Figures
Figure 1
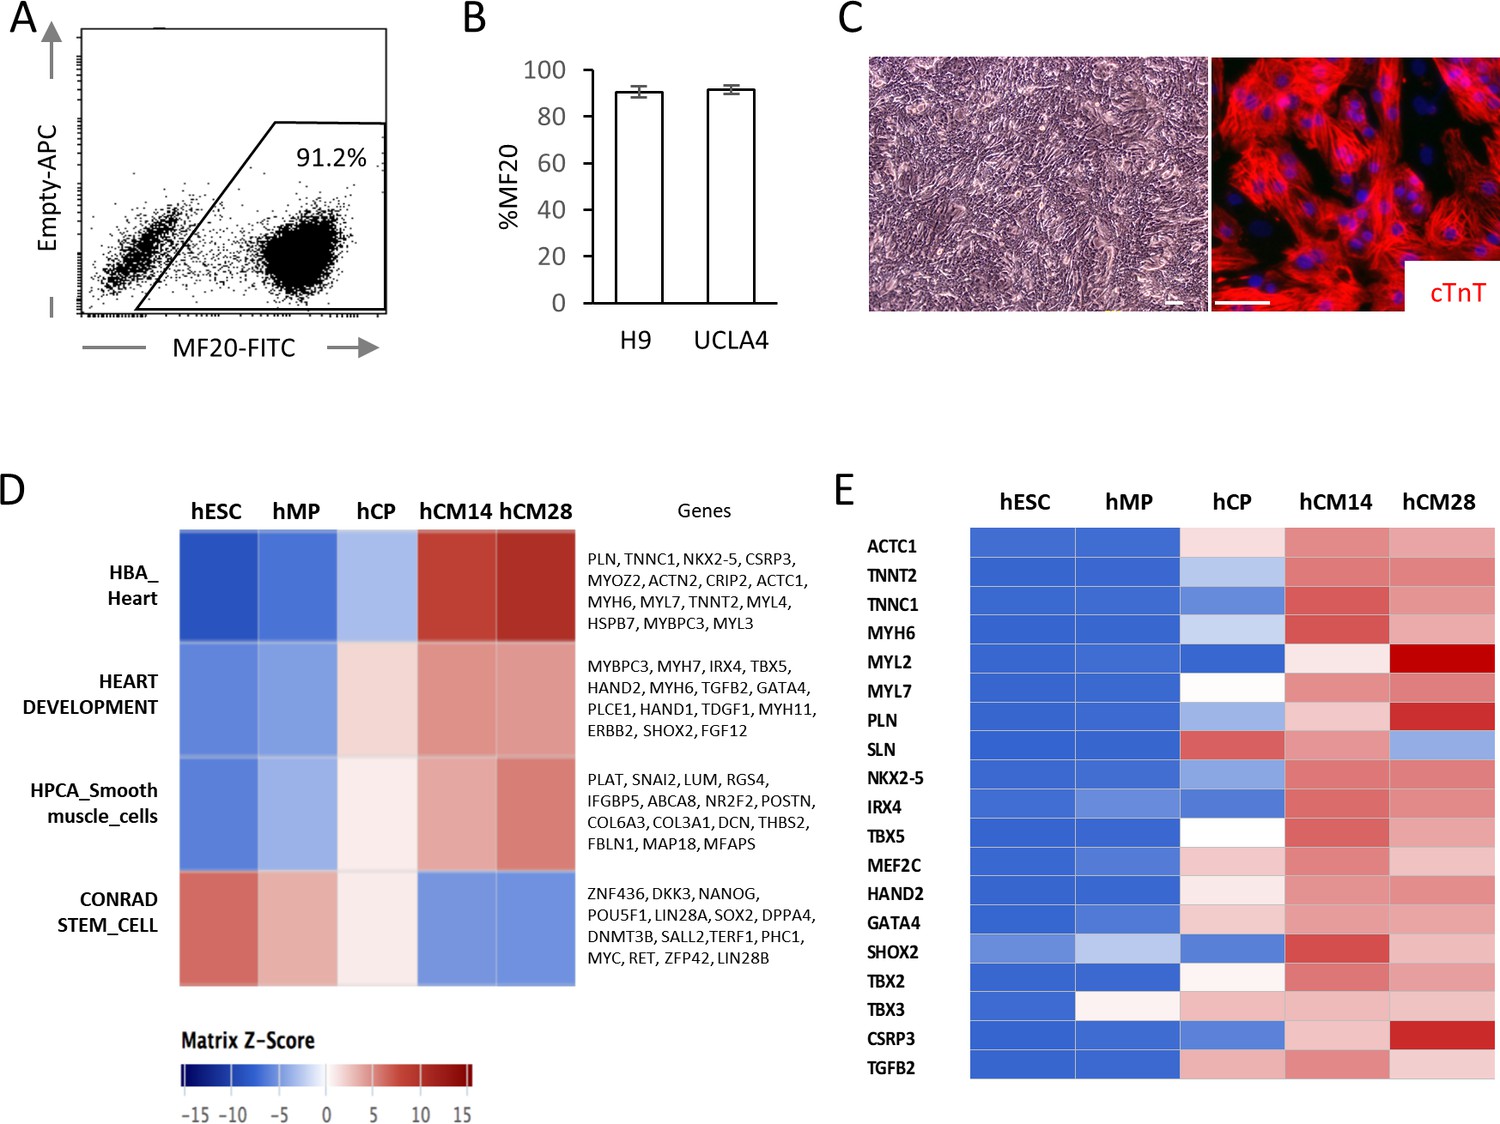
High yield hESC-CMs derived under chemically defined conditions recapitulate developmental time course.
(A) Representative flow cytometry analysis of a cardiac marker, MF20 (myosin) in hESC-CMs (H9) at day 14. (B) Bar chart of the percentage of MF20+ cardiomyocytes in hESC-CMs generated from H9 (n = 8) and UCLA4 cells (n = 3, mean ±S D), as determined by flow cytometry analysis. (C) Images of phase-contrast and Tnnt2 (cTnT: cardiac Troponin T) immunofluorescent staining of hESC-CMs at day 28. Scale bar = 50 μm. (D) The time course of the gene expression profile obtained by RNA-seq using MSigDB shown as a heatmap (n = 3). hCM14 or hCM28, human ESC-derived cardiomyocyte differentiation day 14 or 28; hCP, human cardiac progenitor; hESC, human embryonic stem cell; hMP, human mesodermal precursor. (E) Heatmap of representative cardiac genes from (D), showing progressive upregulation over the time.
-
Figure 1—source data 1
The contents of hESC-CM differentiation media.
- https://doi.org/10.7554/eLife.29330.004
Figure 2 with 1 supplement
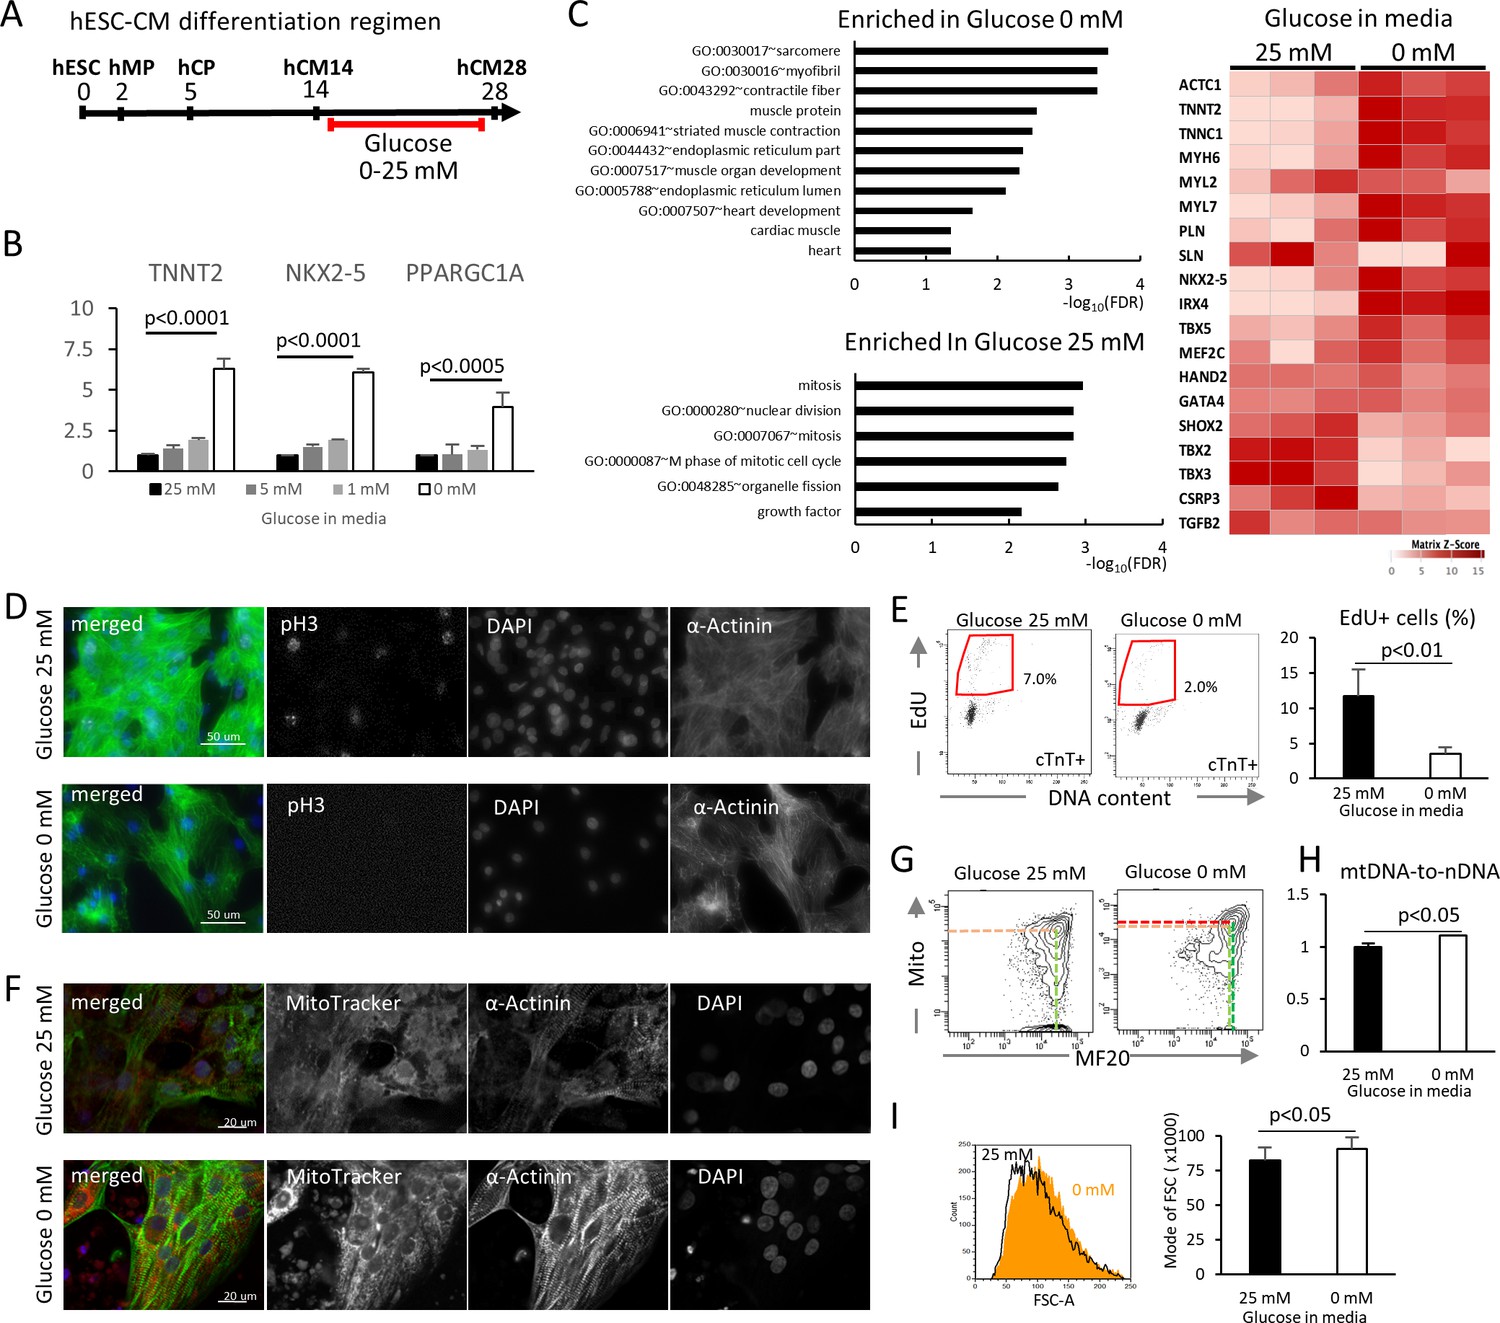
Glucose reduction promotes maturation of hESC-CMs.
(A) Experimental regimen. hESC-CMs are differentiated in the medium containing 25 mM glucose until day 14, when ~ 90% of the cells are already MF20+. Cells are analyzed at day 28 unless otherwise specified. (B) Relative mRNA expression of TNNT2, NKX2-5, and PPARGC1A as determined by qPCR. All these markers are upregulated in hESC-CMs in glucose-deprived conditions (n = 3, mean ± SD, p-value by one-way ANOVA test). (C) Pathway analysis of differentially expressed genes in 0 mM glucose (top left panel), and of differentially expressed genes enriched in hESC-CMs in 25 mM glucose (bottom left) based on RNA-seq data. The heatmap (right panel) shows the relative expression of representative cardiac genes compared between hESC-CM cultured with 25 mM glucose or without glucose. (D) Assessment of mitotic activity by pH3 immunostaining. Representative images of three independent experiments. (E) Assessment of mitotic activity. Representative data from EdU flow cytometry (left) and quantitation of %EdU+ cardiomyocytes (right) are shown. (n = 3, mean ± SD, p<0.01 by t-test.) (F) Assessment of the maturity of cardiomyocytes by MitoTracker (mitochondrial content) and α-actinin staining. Representative images of three independent experiments. (G) Assessment of the maturity of cardiomyocytes by flow cytometry for MF20 and MitoTracker. Representative images of at least three independent experiments are shown. (H) Assessment of mitochondrial DNA contents obtained by quantitative PCR for mitochondrial and nuclear DNA (n = 4, mean ± SD, p<0.05 by t-test). (I) Assessment of the cell size by forward scatter (FSC) from flow cytometry data. At least 10,000 cells were measured for each sample. Representative histogram from three flow cytometry data for each group (left) and the geometrical means of FSC (right). (n = 3, mean ± SD, p<0.05 by t-test.)
Figure 2—figure supplement 1

Glucose reduction promotes maturation of hESC-CMs.
(A) Expression of cardiac markers extracted from RNA-seq data. (n = 3, mean ±S D, by t-test). (B) Sarcomere length analysis. Representative traces of α-actinin and cellular architecture (left) and analysis of biological triplicates of measurements from 20–30 cells. (n = 3, mean ± SD, p=n.s. by t-test.) (C) Impact of 2-deoxy-D-glucose (2-DG), a competitive inhibitor of glucose, on MitoTracker and MF20 levels measured by flow cytometry. Representative contour plots (left) and quantitation from three independent experiments (right) are shown. (n = 3, mean ± SD, p<0.01 by t-test.)
Figure 3 with 1 supplement
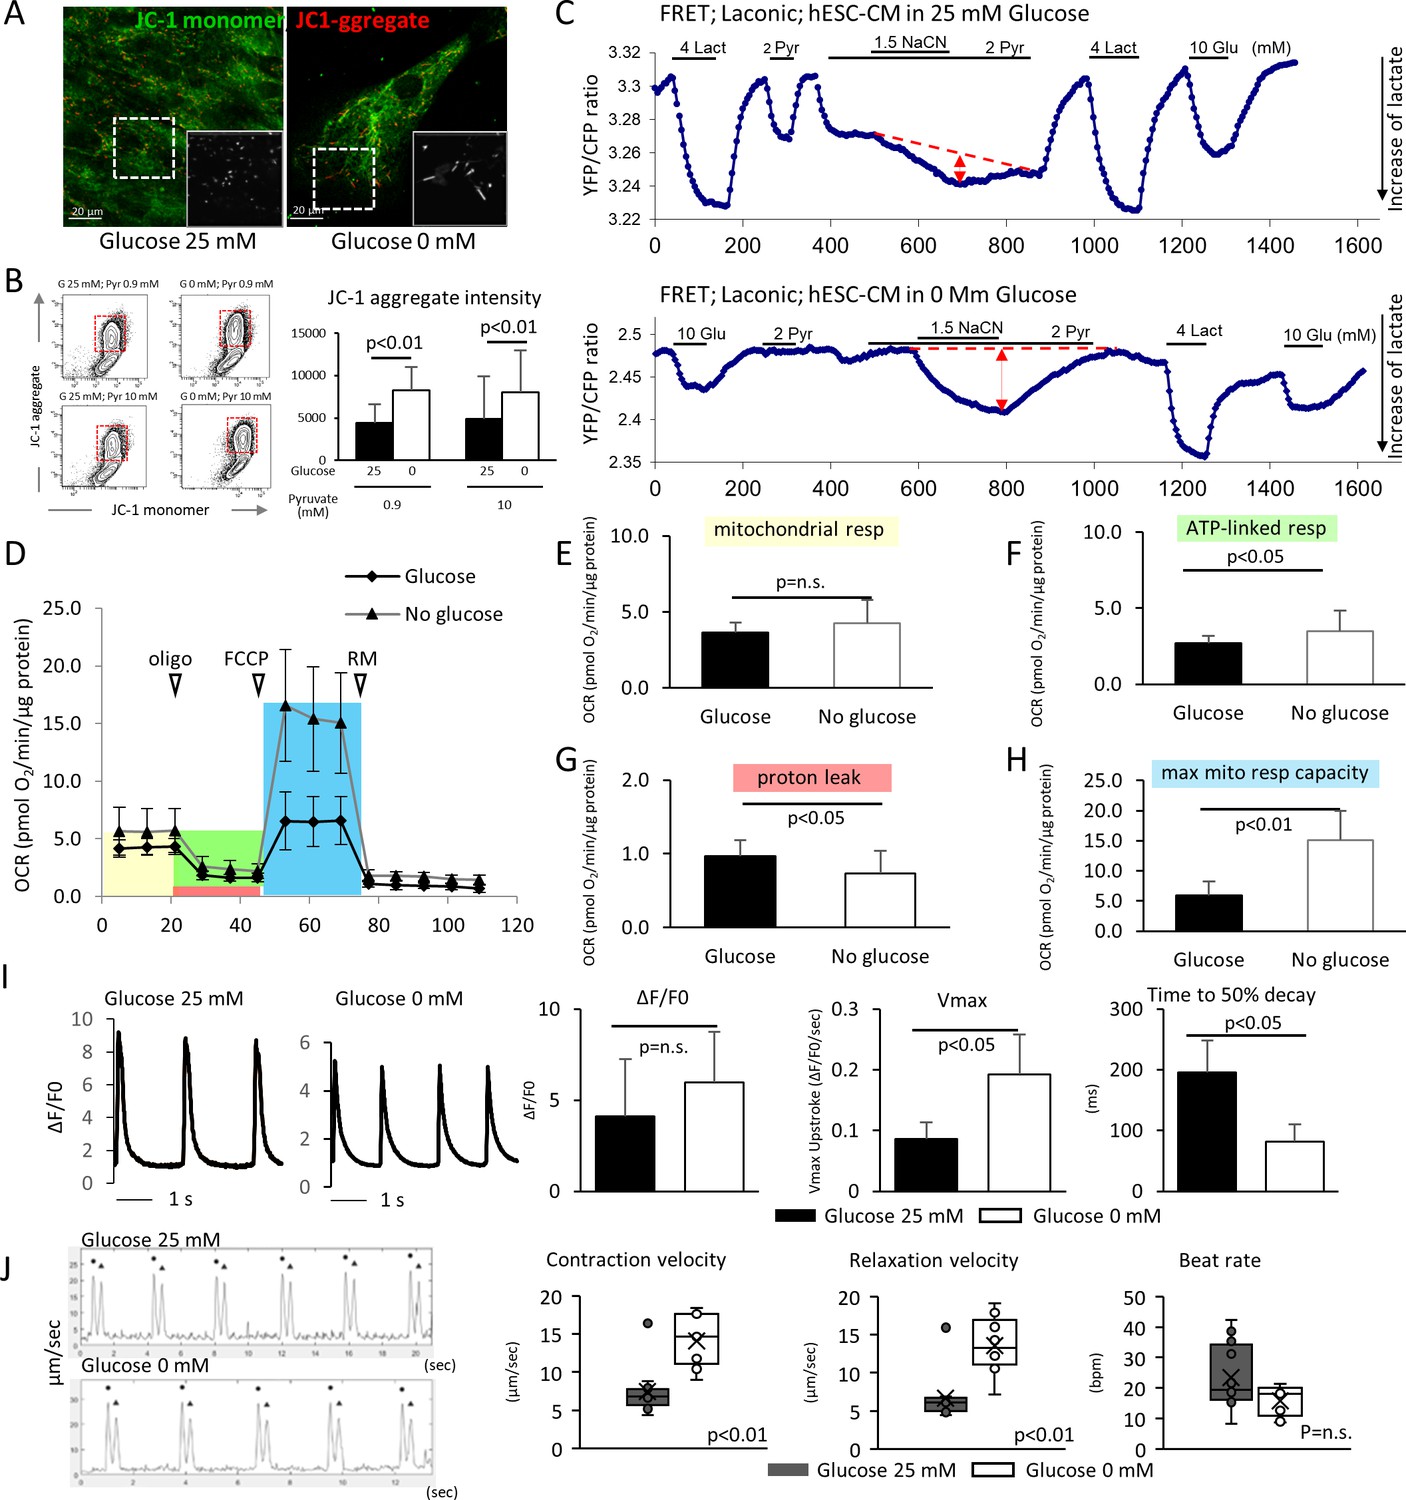
Glucose deprivation promotes the functional maturation of hESC-CM.
(A) Representative images of mitochondrial membrane potential assay using JC-1 dye in hESC-CMs cultured in the presence (left) and absence (right) of glucose. Note the elongated mitochondria in the hESC-CMs cultured in 0 mM glucose. (B) Flow cytometry analyses of JC-1of hESC-CMs cultured in different concentrations of glucose and pyruvate. Representative flow cytometry profile (left) and the quantitation of the intensity of JC-1 aggregates (right). (Mean intensity ± SD, p<0.01 by one-way ANOVA test.) (C) Changes in intracellular lactate level measured as YFP/CFP ratio with Laconic, a fluorescence resonance energy transfer (FRET)-based biosensor of lactate, in hESC-CMs cultured in the presence (upper panel) or absence (lower panel) of glucose. Increase in intracellular lactate level is indicated by a downwards shift in the trace. Note that, in hESC-CMs cultured in the absence of glucose, the addition of pyruvate (Pyr) does not lead to an increase in intracellular lactate. Data are representative of two independent experiments. (D–H) Oxygen consumption rate (OCR) measured with a Seahorse analyzer (D). ESC-CMs cultured in the absence of glucose show comparable mitochondrial respiration (E), but greater ATP-linked respiration (F), andmaximum mitochondrial respiration capacity (H) with slight difference in proton leak (G), suggesting that glucose-deprivation potentiates OXPHOS. (n = 19, each; mean ± SD, p<0.01 by t-test.) (I) Calcium transient assay of hESC-CMs cultured in the presence or absence of glucose. Representative waves, Vmax, ΔF/F0, and time to 50% decay are shown. (n = 10 (G25) and 11 (G0), p values by t-test.) (J) Motion speed analysis by digital image correlation. The first (•) and the second peak (▲) of the duplex represent the contraction and the relaxation speed, respectively (left). Contraction velocity, relaxation velocity, and beat rate are shown. (n = 12 (G25) and 9 (G0); mean ± SD, p values by t-test.)
Figure 3—figure supplement 1
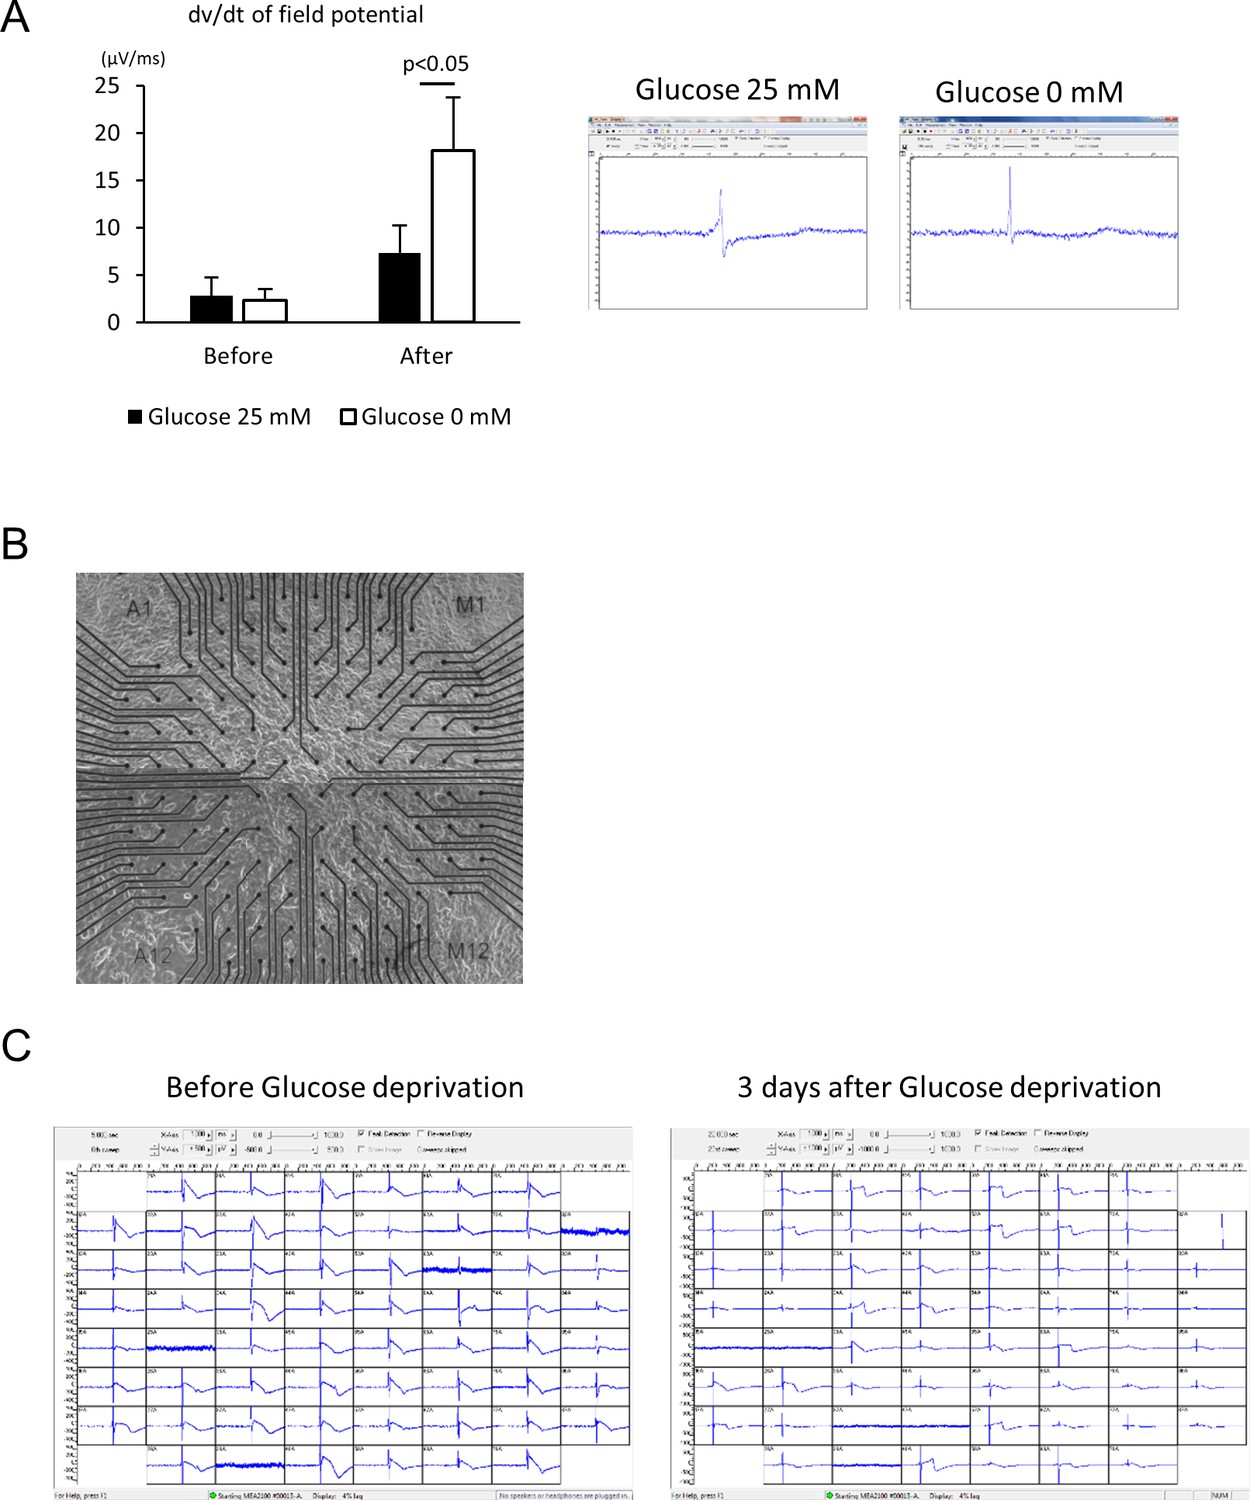
Electrophysiological analyses of the maturity of hESC-CMs by multi-electrode array (MEA).
(A) Maximum dv/dt of field potential obtained from three independent measurements of channels properly recorded by 120 electrodes with representative trace of recorded field potential; recorded before starting glucose reduction in the media and after 10 days of glucose reduction. (n = 3, each group. mean ± SD, p-value by t-test.) (B) Representative bright field image of the monolayer cells plated onto the MEA chip. (C) Snapshots of recorded field potential of hESC-CM culture with or without glucose.
Figure 4 with 4 supplements
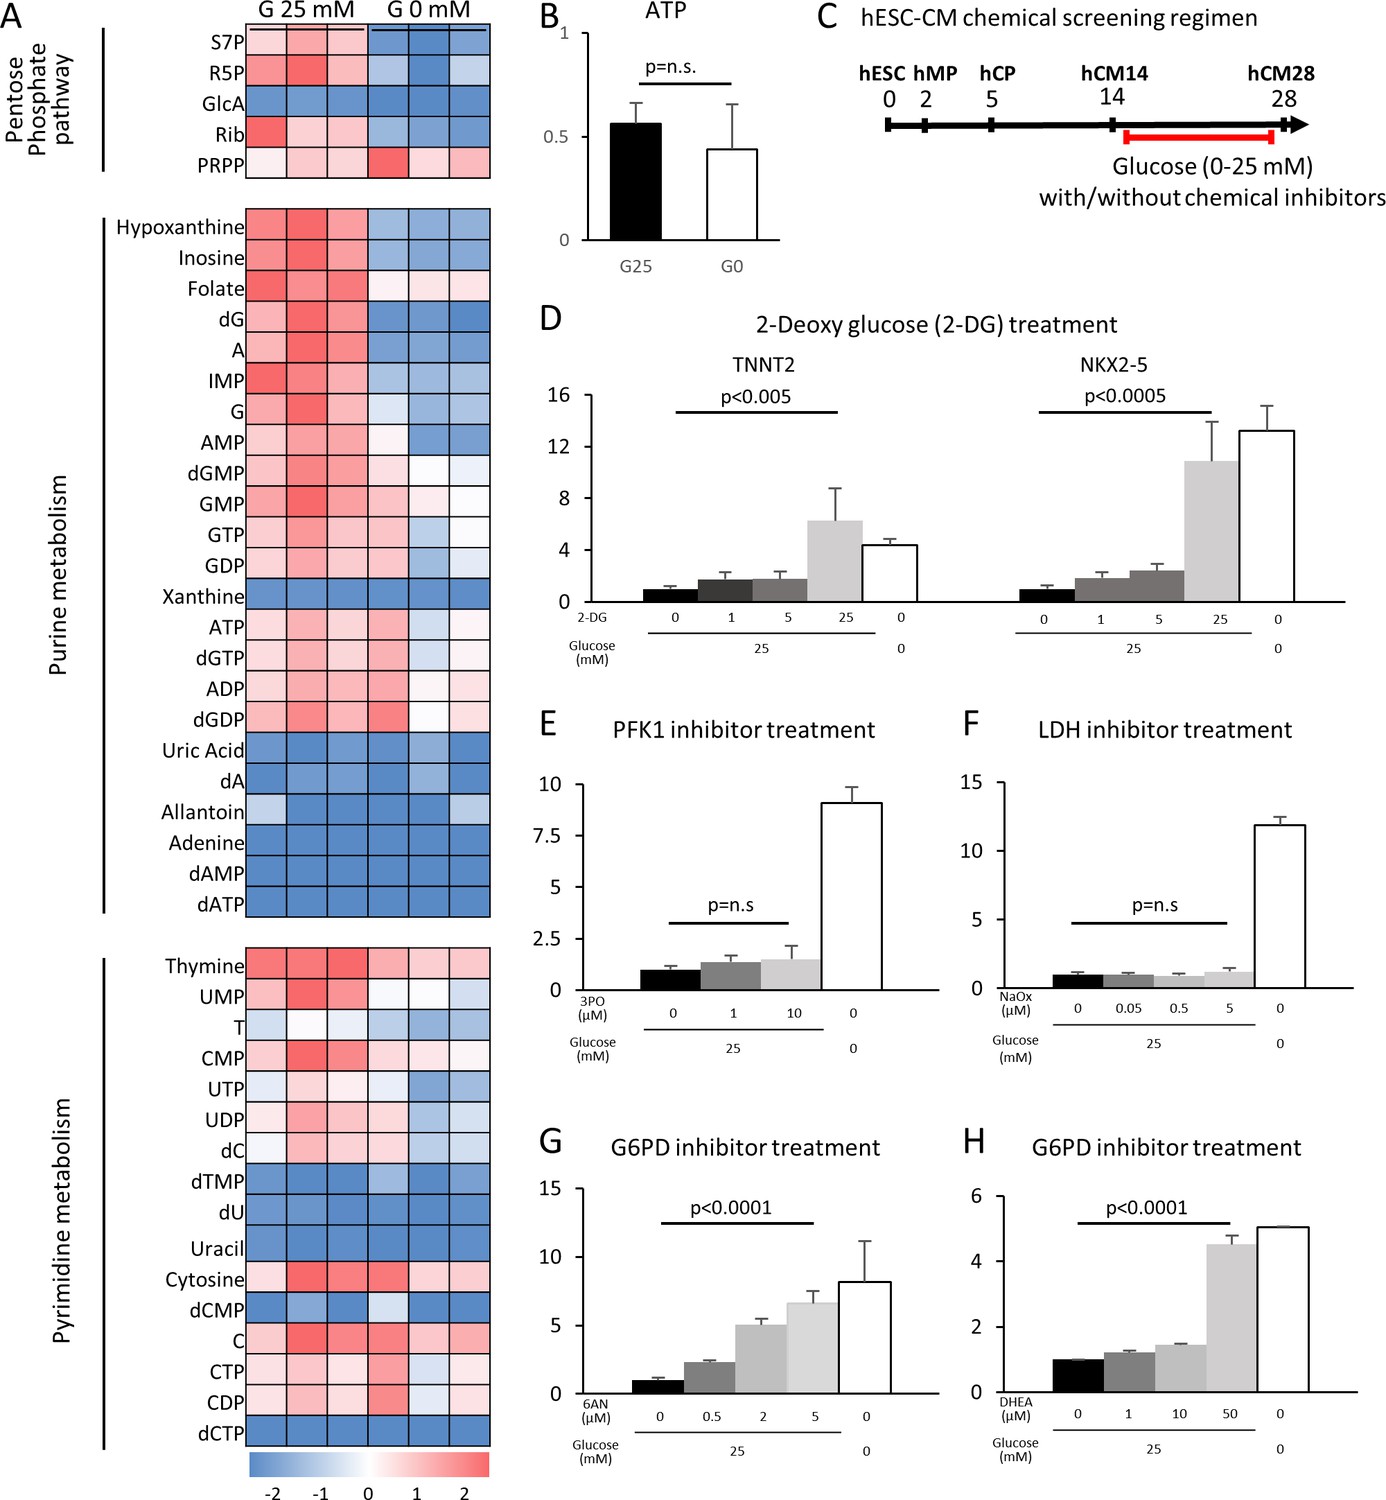
The pentose phosphate pathway inhibits cardiac maturation.
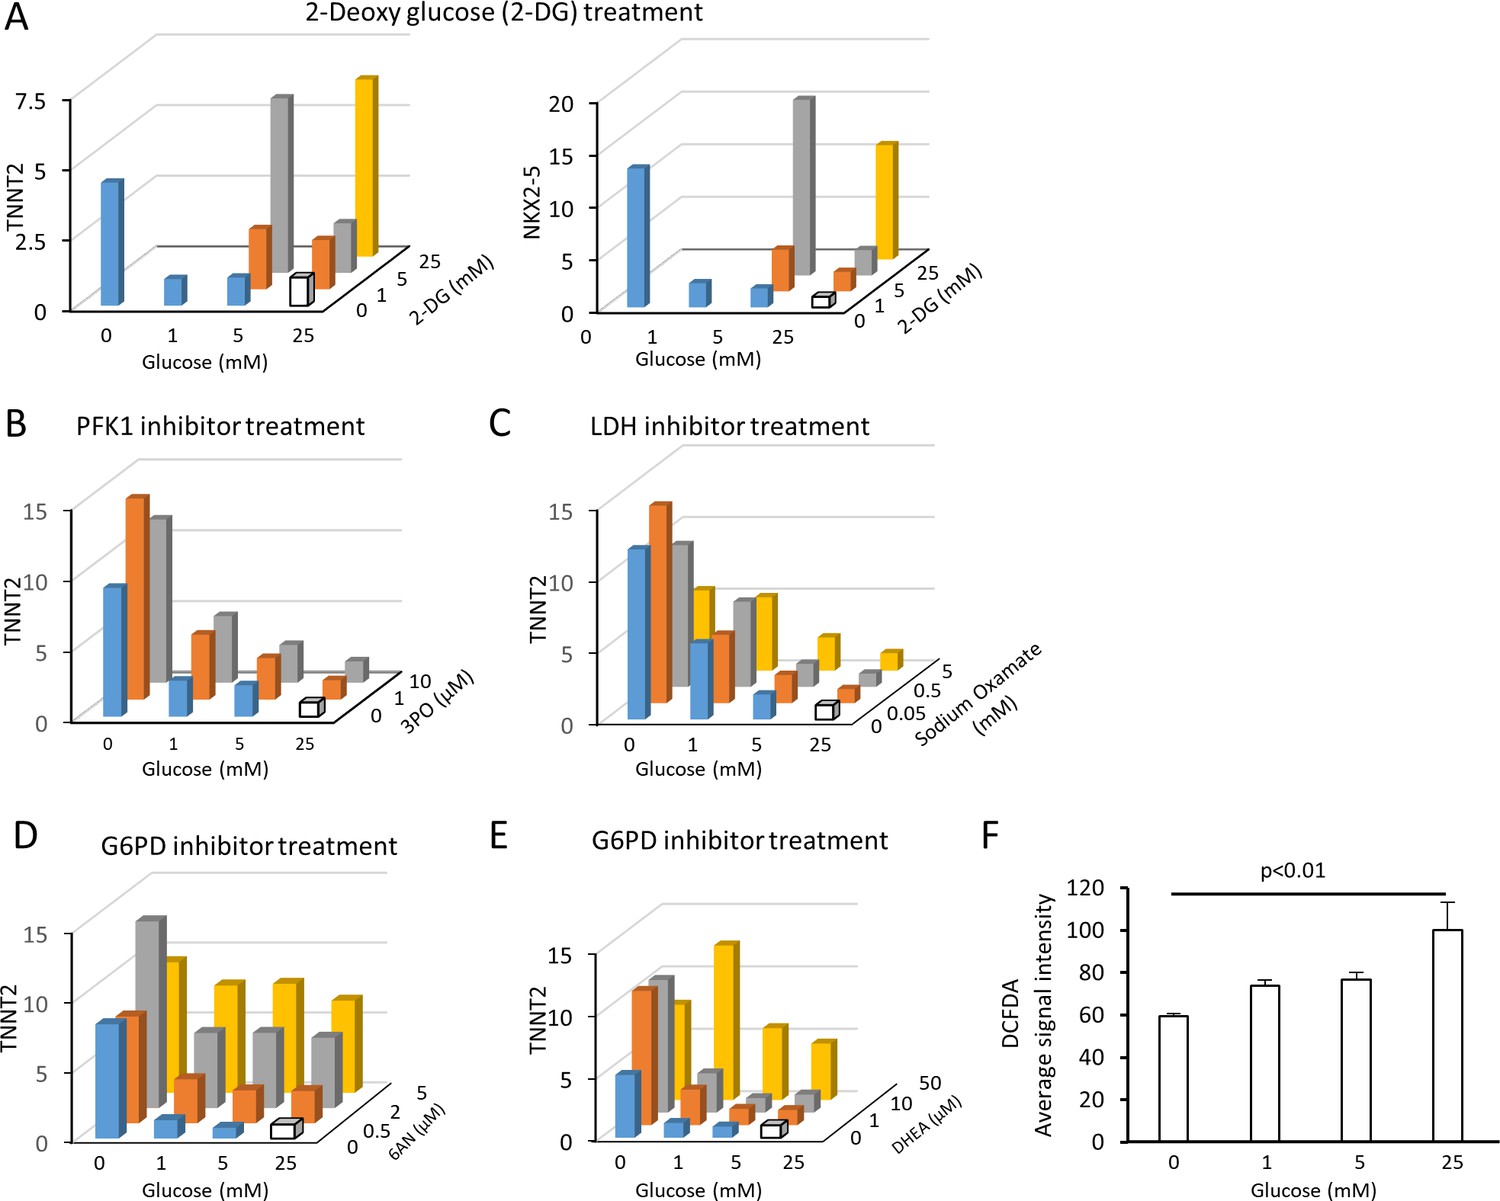
(A) Heatmap presentation of the metabolomics analysis of hESC-CMs cultured in the presence or absence of glucose. Note the decrease in the metabolites in purine metabolism, pyrimidine metabolism and the pentose phosphate pathway (PPP) in glucose-deprived conditions (n = 3, each). GlcA, glucuronic acid; R5P, ribose 5-phosphate; Rib, ribose; PRPP, phosphoribosyl pyrophosphate; S7P, sedoheptulose-7-phosphate. See also Figure 4—figure supplement 2. (B) ATP levels of hESC-CMs in 25 mM glucose medium (G25) and glucose-depleted medium (G0) (n = 3, mean ± SD, p = n .s. by t-test.) (C) Experimental regimen for chemical inhibition of glucose metabolic pathways. hESC-CMs are cultured in the medium containing four different glucose levels and different chemical inhibitors. See also Figure 4—figure supplement 3. (D) Relative mRNA expression of TNNT2 and NKX2-5 in different concentrations of glucose and 2-DG, a competitive inhibitor of glucose. 2-DG restored cardiac maturation in the presence of glucose. (E–H) Relative mRNA expression of TNNT2 in 0–25 mM glucose and with different chemical inhibitors of the glucose metabolic pathways: 0–10 μM 3PO (3-(3-pyridinyl)−1-(4-pyridinyl)−2-propen-1-one, a phosphofructokinase [PFK] inhibitor) (E); 0–5 mM sodium oxamate (NaOX; a lactate dehydrogenase [LDH] inhibitor) (F); 0–5 μM 6AN (6-aminonicotinamide, a glucose 6-phosphate dehydrogenase [G6PD] inhibitor) (G); and 0–50 μM DHEA (dehydroepiandrosterone, a G6PD inhibitor) (H). (n = 3, each. mean ± SD; p-value by one-way ANOVA.) See also Figure 4—figure supplement 4.
Figure 4—figure supplement 1
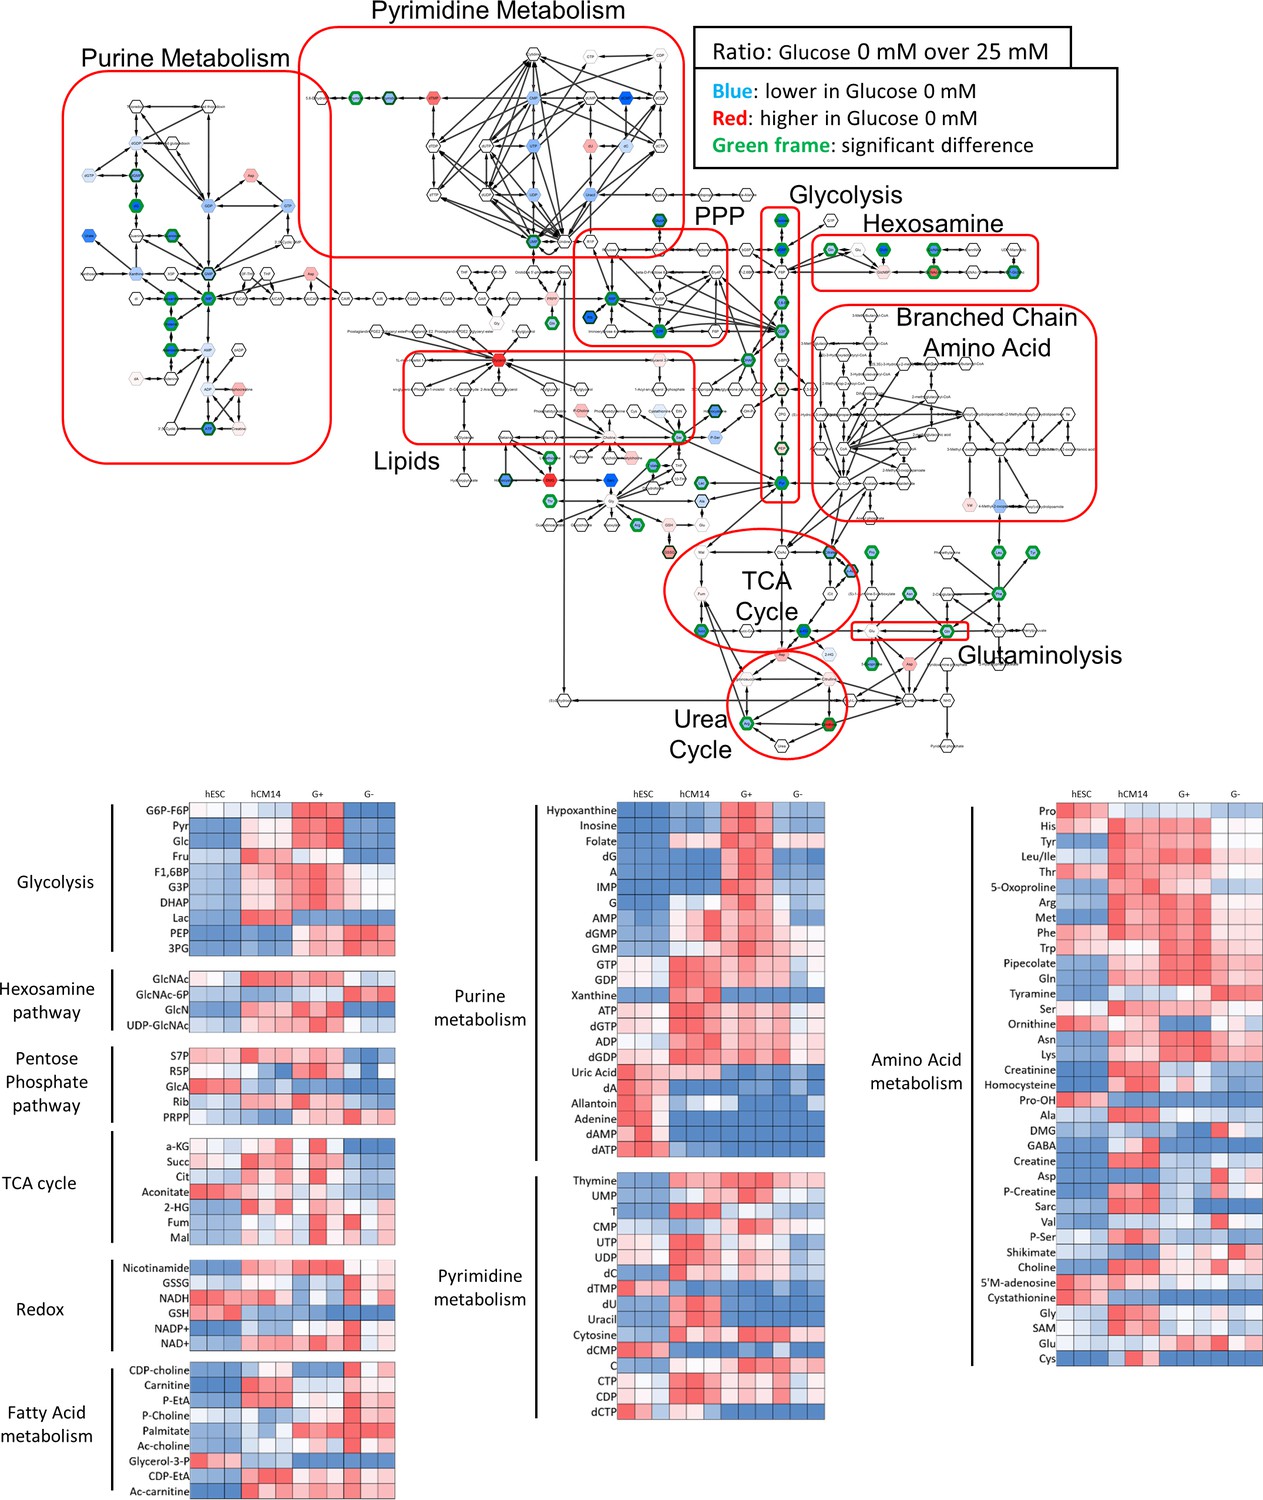
Metabolomics analyses by mass spectrometry.
The top diagram shows the comparison of metabolomics analysis by mass spectrometry of hESC-CMs cultured in the presence or absence of glucose. Each hexagon indicates a metabolite that is decreased (blue) or increased (red) in the absence of glucose. A green outline indicates statistically significant change. Note the decrease in the metabolites in purine metabolism, pyrimidine metabolism, the PPP, the hexosamine pathway, and glycolysis. (n = 3, each.) The bottom part of the figure shows the heatmap of metabolite levels measured by mass spectrometry of hESC, of hCM14, and of hCM28 cultured in 25mM glucose (G+) or without glucose (G–).
Figure 4—figure supplement 2
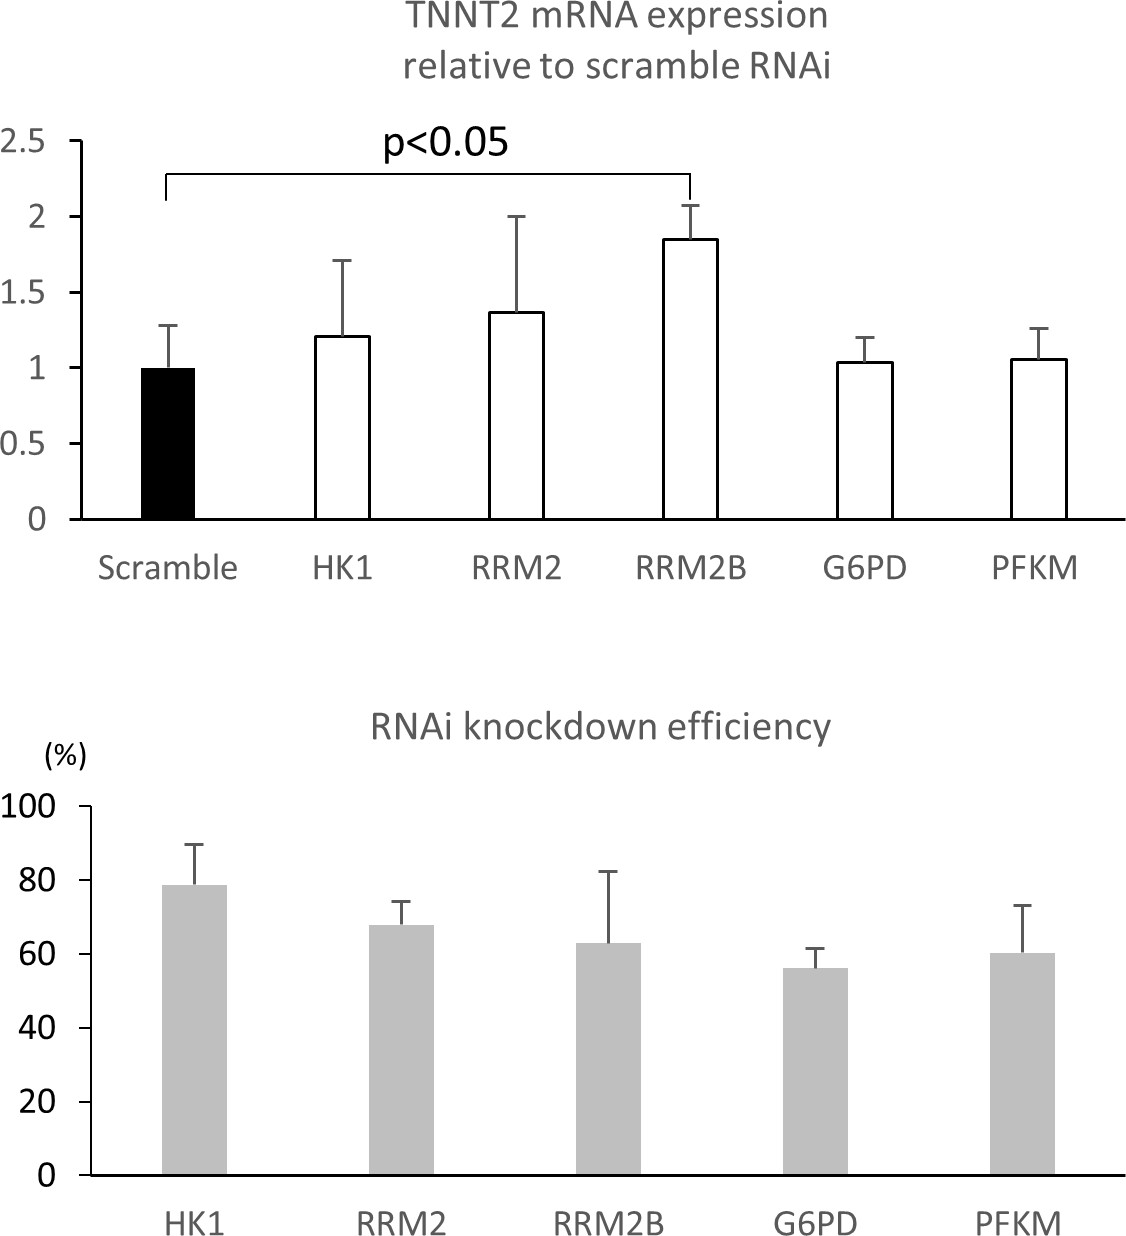
RNAi knockdown of glucose metabolic enzymes.
Relative TNNT2 expression after RNA interference (RNAi) knockdown. RNAi targeting scramble, HK1, RRM2, RRM2B, G6PD, and PFK were transfected by lipofection for 48 hr followed by 7 days’ incubation with 25 mM glucose. (n = 3, each group; mean ± SD, p<0.05 between RRM2B and scramble by t-test.) The bottom panel shows the RNAi knockdown efficiency for the glucose metabolic enzymes.
Figure 4—figure supplement 3
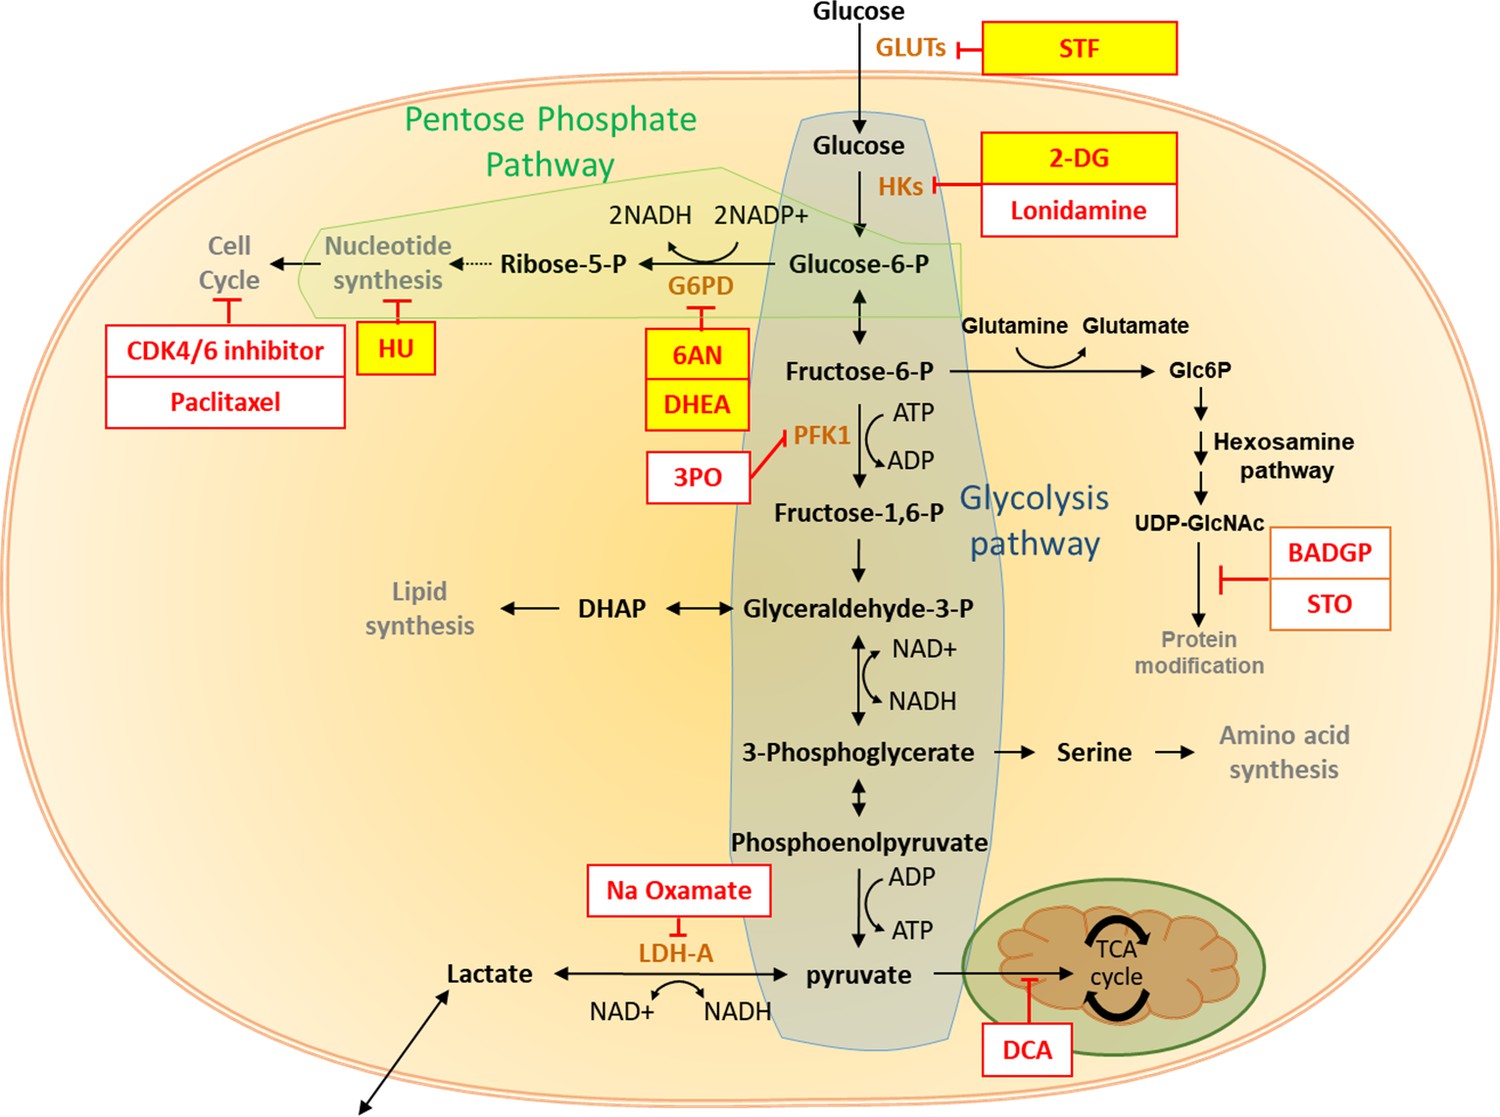
The pentose phosphate pathway inhibits cardiac maturation.
Summary of the impact of glucose metabolism inhibitors on cardiac maturity. The inhibitors tested are shown in red boxes, and the effective inhibitors are highlighted in yellow. There is clear evidence that inhibition of PPP increases the maturity of hESC-CMs.
Figure 4—figure supplement 4
Summary of the impact of glucose metabolism inhibitors on cardiac maturity.
(A) Relative mRNA expression of TNNT2 and NKX2-5 in conditions of 0–25 mM glucose and 0–25 mM 2-DG. No data were available for the samples with 2-DG concentration higher than its glucose level because of the cytotoxicity of 2-DG. 2-DG dose-dependently restored cardiac maturation in the presence of glucose. Data are representative of three independent experiments. (B) Relative mRNA expression of TNNT2 in 0–25 mM glucose and 0–10 μM 3PO (a PFK inhibitor). 3PO failed to restore the effect of glucose deprivation. Data are representative of three independent experiments. (C) Relative mRNA expression of TNNT2 in 0–25 mM of glucose and 0–5 mM sodium oxamate (NaOX; an LDH inhibitor). Sodium oxamate failed to restore the effect of glucose deprivation. Data are representative of three independent experiments. (D) Relative mRNA expression of TNNT2 in 0–25 mM of glucose and 0–5 μM 6AN (a G6PD inhibitor). 6AN dose-dependently restores the effect of glucose deprivation, suggesting that the pentose phosphate pathway plays a critical role in the glucose-dependent inhibition of cardiac maturation. Data are representative of three independent experiments. (E) Relative mRNA expression of TNNT2 in 0–25 mM of glucose and 0–50 μM DHEA (a G6PD inhibitor). DHEA dose-dependently restores the effect of glucose deprivation, suggesting that pentose phosphate pathway plays a critical role in the glucose-dependent inhibition of cardiac maturation. Data are representative of three independent experiments. (F) Reactive oxygen species (ROS) level is measured by the signal intensity of dichlorodihydrofluorescein diacetate (DCFDA). Glucose reduction does not cause an increase in ROS level despite the increased mitochondrial function of hESC-CMs cultured in low glucose medium. (n = 4; p-value by one-way ANOVA).
Figure 5 with 2 supplements
Nucleotide metabolism regulates cardiomyocyte maturation.
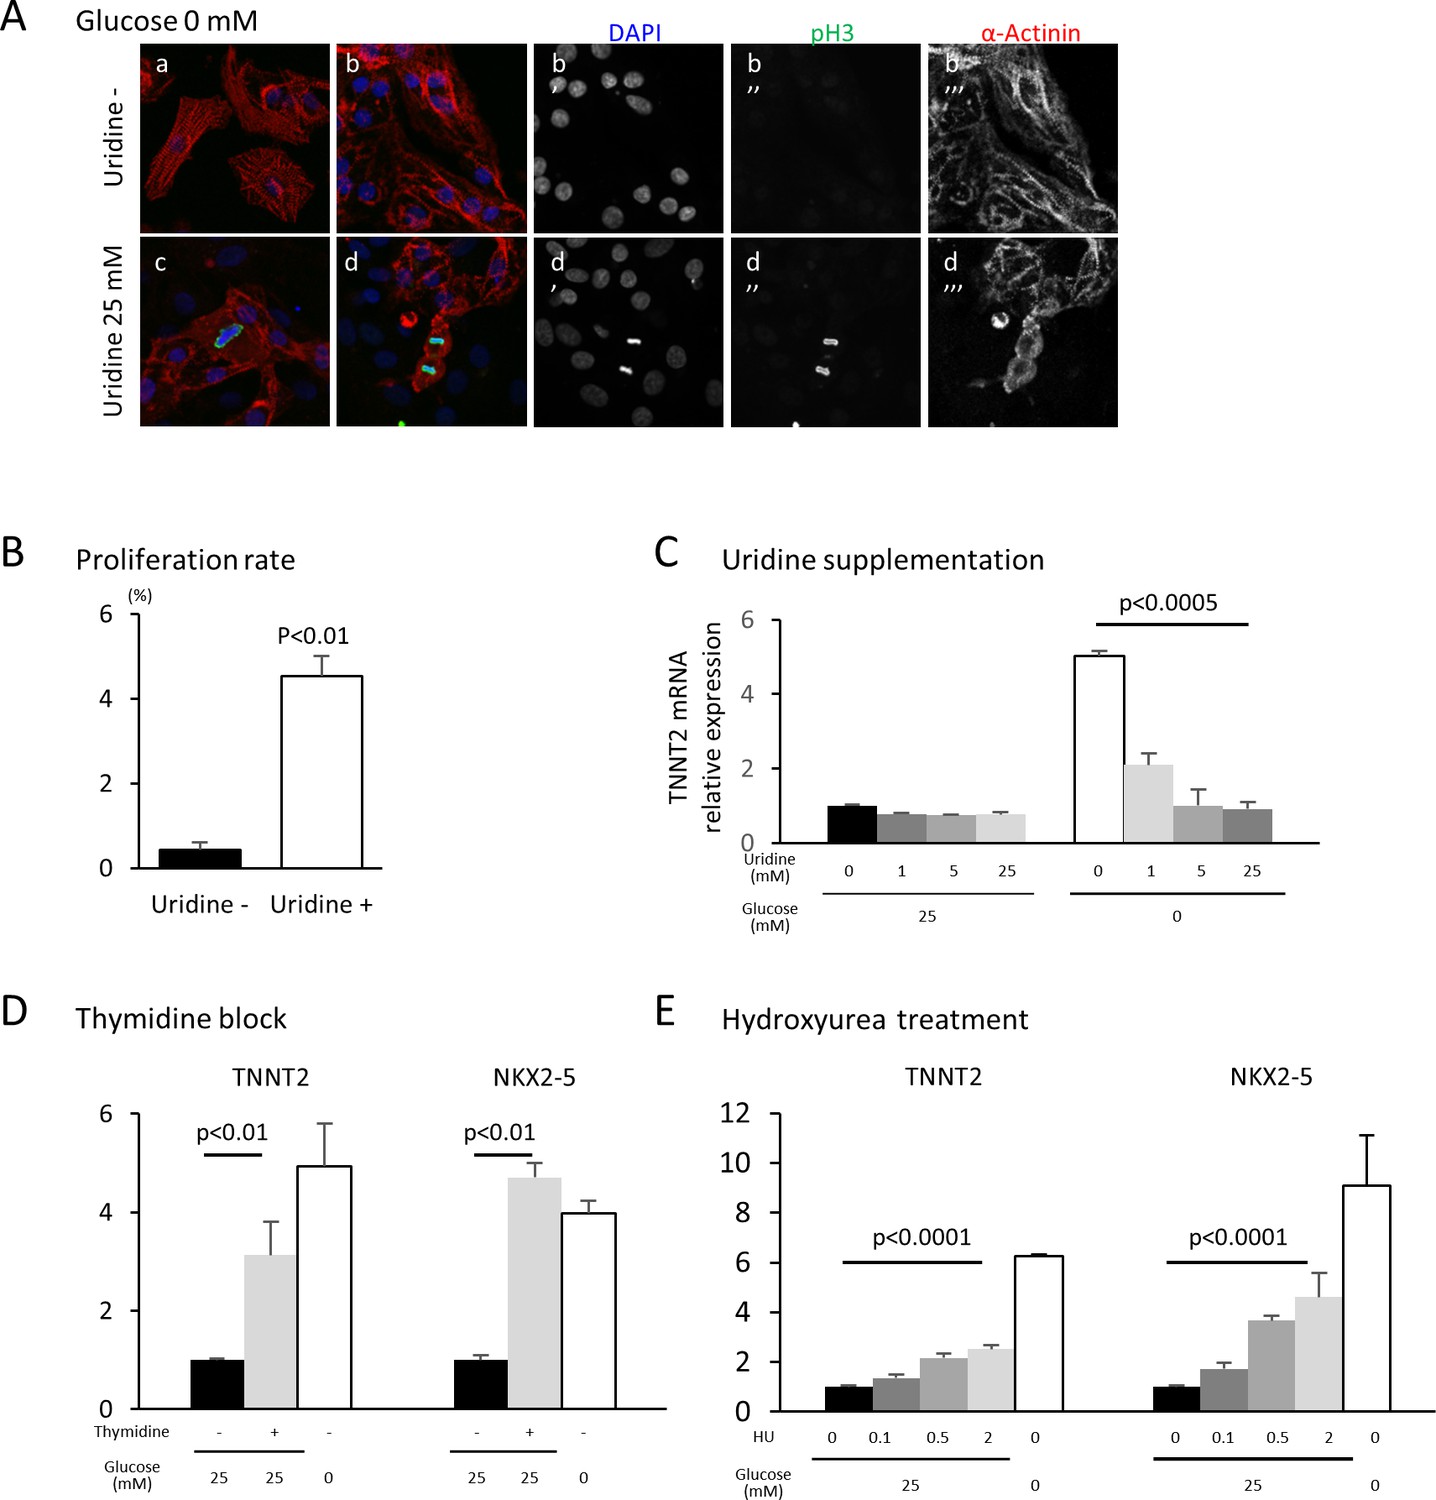
(A) Glucose-deprived hESC-CMs are cultured in the absence (a, b) or presence (c, d) of 25 mM uridine, and stained for pH3 (a mitosis marker). The addition of uridine restored proliferative activity even in the absence of glucose. Data are representative of three independent experiments. (B) Proliferation rate, presented as number of pH3+ cells/α-actinin+cells, seen in the stained images of Figure 5A. (n = 3, mean ± SD, p<0.01 by t-test.) (C) Relative mRNA expression of TNNT2 in hESC-CMs in 25 mM or 0 mM glucose with 0 or 25 mM uridine. Uridine dose-dependently inhibited the TNNT2 expression level in glucose-deprived conditions. (n = 3, mean ± SD, p<0.0005 by one-way ANOVA test.) See also Figure 5—figure supplement 1A. (D) Relative mRNA expression of TNNT2 and NKX2-5 in hESC-CMs cultured in 0–25 mM of glucose in the presence or absence of thymidine. Thymidine block increases the levels of TNNT2 and NKX2-5 (n = 3, mean ±SD, p<0.01 for a t-test comparing samples with or without 25 mM thymidine in 25 mM glucose. See also Figure 5—figure supplement 1B. (E) Relative mRNA expression of TNNT2 and NKX2-5 in hESC-CMs cultured in 0–25 mM glucose and 0–2 mM hydroxyurea (HU, a ribonucleotide reductase inhibitor). HU dose-dependently induced the expression of TNNT2 and NKX2-5 at 1, 5, and 25 mM glucose. (n = 3, mean ± SD, p-value by one-way ANOVA test.) See also Figure 5—figure supplement 1C.
Figure 5—figure supplement 1
Nucleotide inhibits hESC-CM maturation.
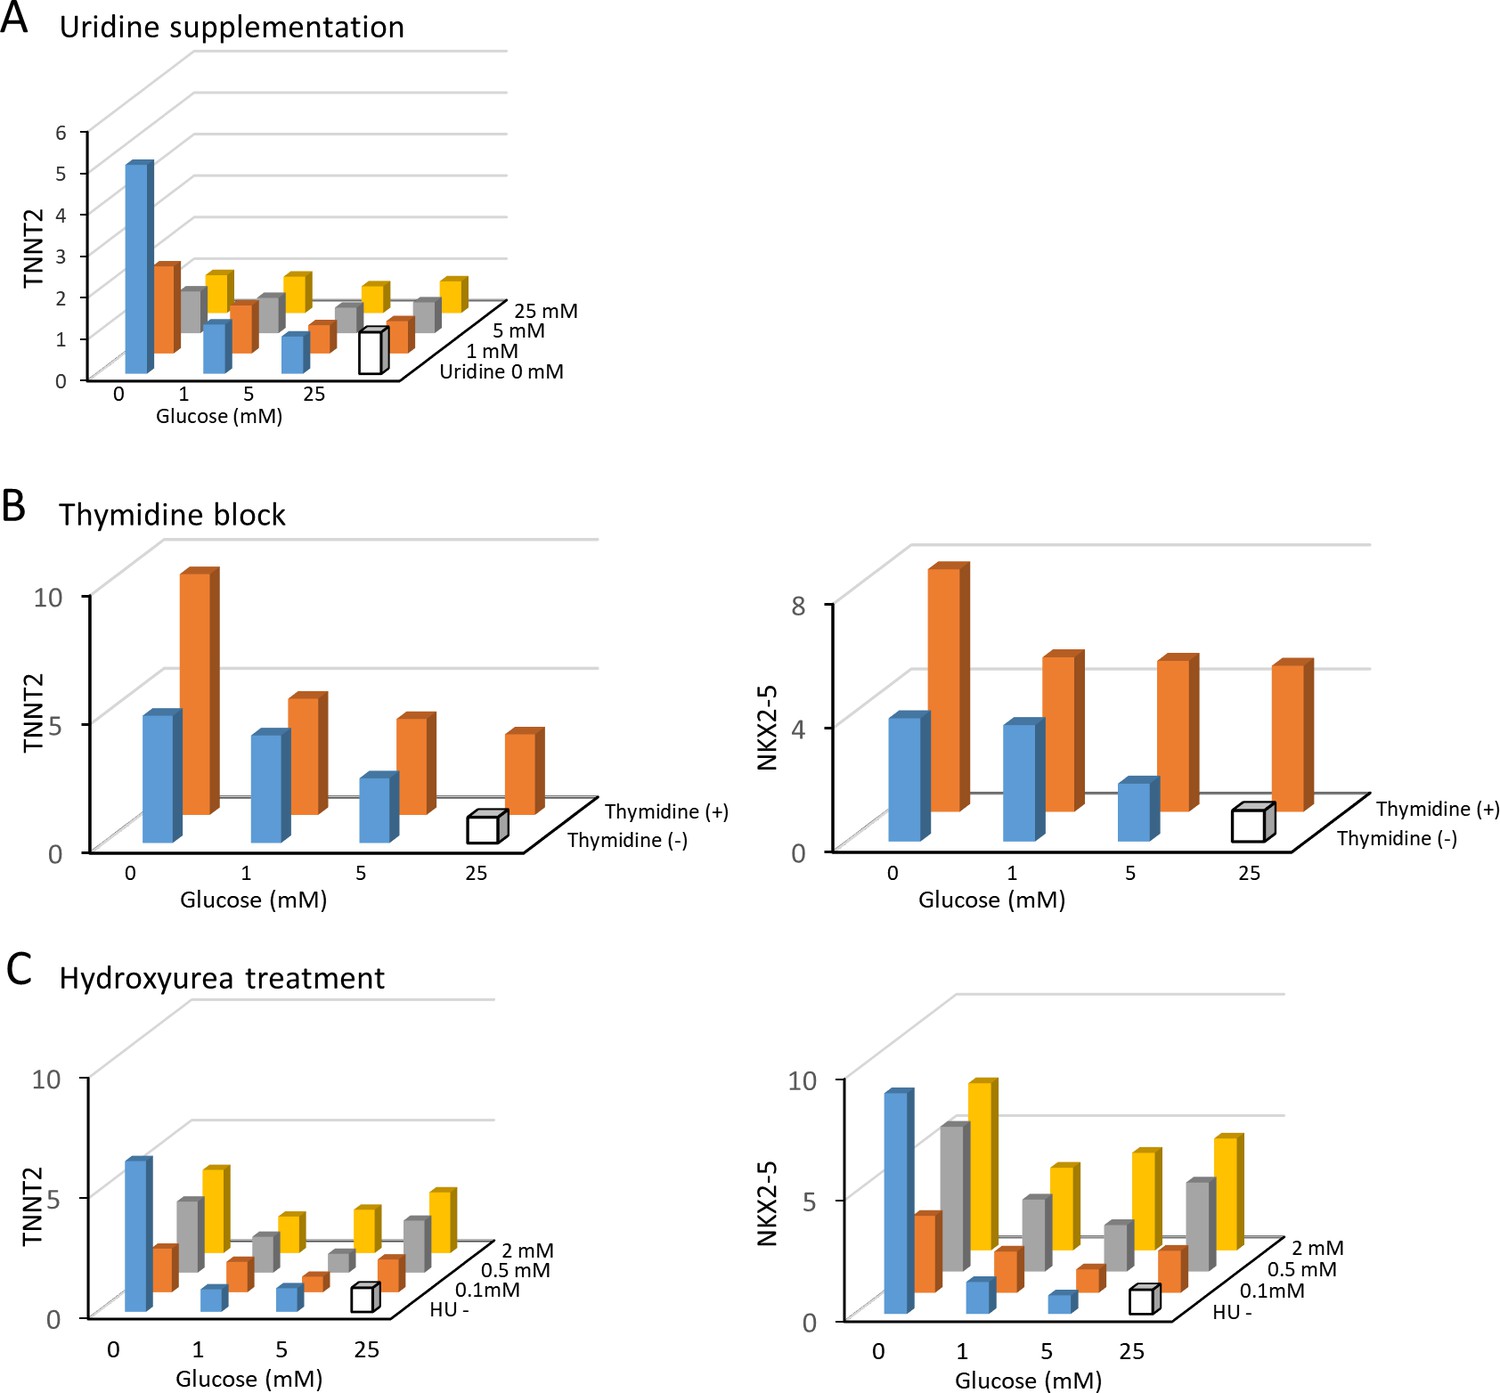
(A) The relative expression of TNNT2 mRNA measured by qPCR in hESC-CMs in 16 different conditions of 0–25 mM of glucose and 0–25 mM uridine. Uridine recapitulates the effect of glucose by dose-dependently inhibiting TNNT2 expression level. Data are representative of three independent experiments. (B) The relative mRNA expression of TNNT2 and NKX2-5 measured by qPCR in hESC-CMs cultured in 0–25 mM glucose in the presence or absence of thymidine. Thymidine block increases the levels of TNNT2 and NKX2-5. Data are representative of three independent experiments. (C) The relative mRNA expression of TNNT2 and NKX2-5 measured by qPCR in hESC-CMs cultured in 0–25 mM glucose and 0–2 mM hydroxyurea (HU, a ribonucleotide reductase inhibitor). HU dose-dependently induced the expression of TNNT2 and NKX2-5 at 1, 5, and 25 mM glucose. Data are representative of three independent experiments.
Figure 5—figure supplement 2

Nucleotide deprivation, not cell cycle block, is the primary inducer of cardiomyocyte maturation.
(A) The impact of CDK4/6 inhibitor on the relative mRNA expression of TNNT2 and NKX2-5 measured by qPCR. Cell cycle block by CDK4/6 inhibitor did not significantly induce the expression of cardiac markers. Data are representative of three independent experiments. (B) The impact of paclitaxel on the relative mRNA expression of TNNT2 and NKX2-5 measured by qPCR. Cell cycle block by paclitaxel did not significantly induce the expression of cardiac markers. Data are representative of three independent experiments.
Figure 6
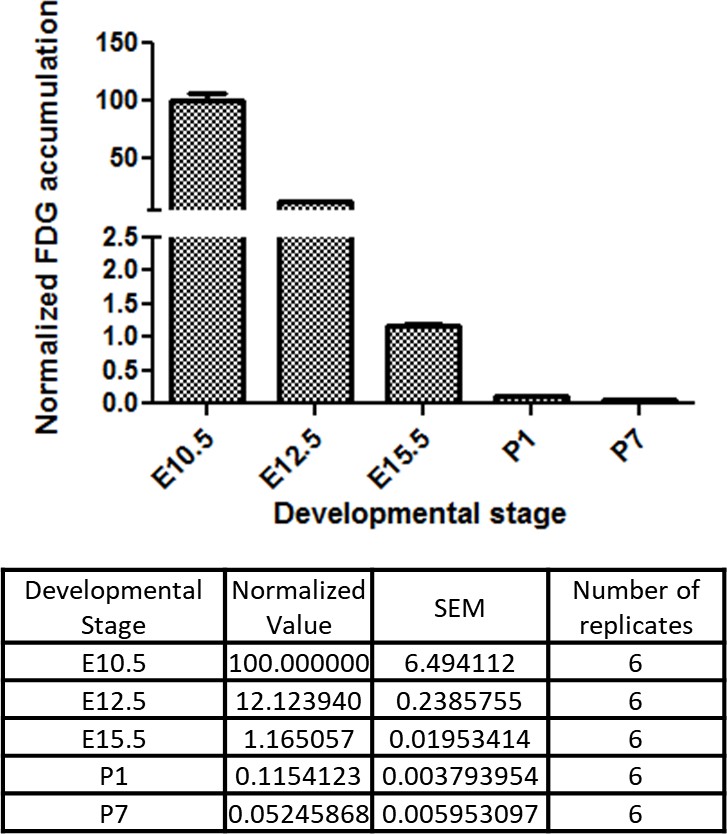
Developmental time course of cardiac glucose uptake measured by 18F-FDG accumulation.
The radioactivity of the entire heart was measured by γ-counter after tail vein i.v. (fetus) or i.p. (neonates) injections. Values were normalized to heart weight and total body signal (heart values/[heart weight * total body values]). Note a drastic decrease in glucose uptake during late gestational and neonatal stages (n = 6, each; p<0.0001 by one-way ANOVA test.)
Figure 7
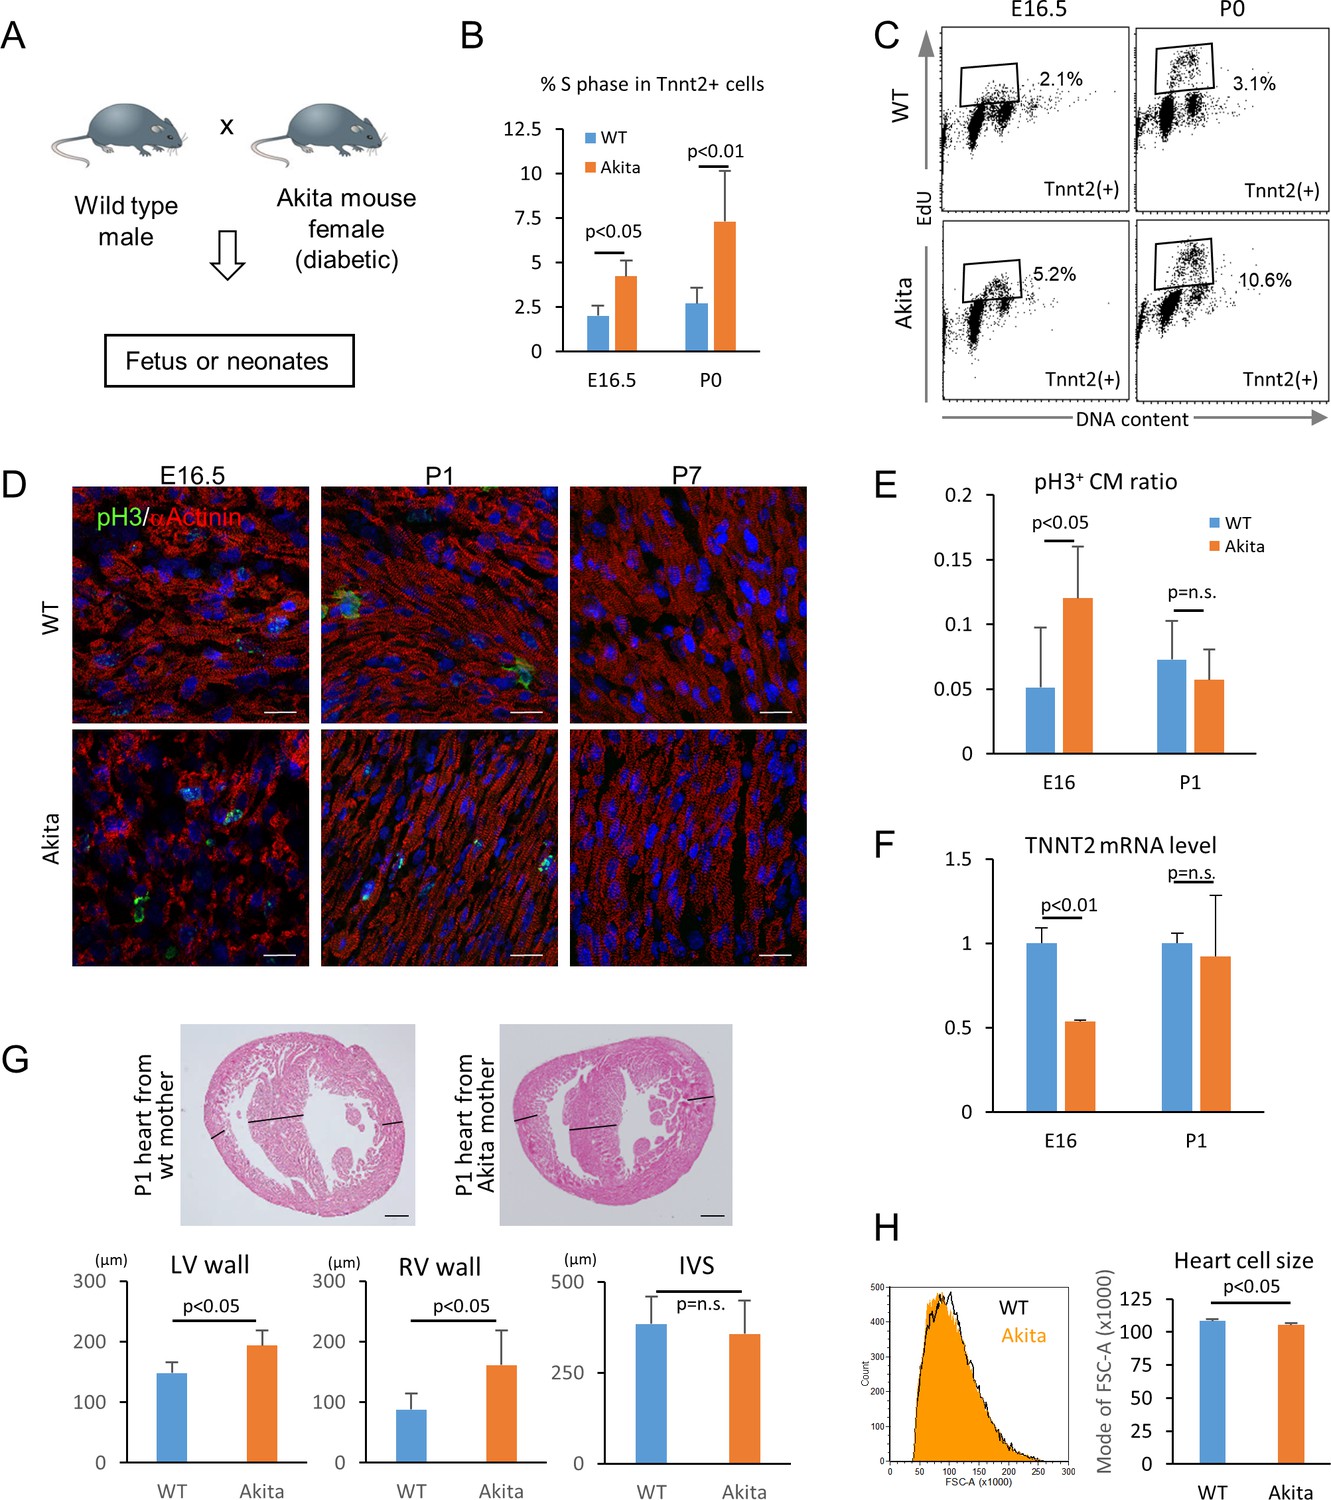
Hyperglycemia promotes the proliferation and inhibits the maturation of fetal cardiomyocytes in utero.
(A) Diagram illustrating in vivo analysis of the impact of maternal hyperglycemia on fetal heart development using a diabetic mouse model (Akita). (B,C) Cell cycle analyses of fetal and neonatal cardiomyocytes from normal and diabetic pregnancies. Tnnt2-positive cardiomyocytes from diabetic Akita mothers show a higher percentage of cells in S-phase at both E16.5 and P0. (n = 7, each; data shown are mean ± SD, p-value by t-test). (D,E) Double immunostaining for phospho-histone H3 (pH3, green) and α-actinin (red) of the heart from normal and diabetic pregnancies at E16.5, P1 and P7 (D). %pH3+ cells within α-actinin+ cardiomyocytes (CM) from normal (WT) and diabetic (Akita) pregnancies at E16.5 and P1 (E). At least 10,000 cardiomyocytes were counted for each of five hearts. (n = 7, each; mean ± SD, p-value by t-test.) (F) qPCR analysis for Tnnt2 expression in hearts from normal and diabetic pregnancies. The expression level is normalized to control at each stage (n = 3, each; p-value by t-test.) (G) Histological analysis of P1 hearts from normal (WT) and diabetic (Akita) pregnancies. Ventricular wall thickness (RV, right ventricle; LV, left ventricle) and interventricular septum (IVS) thickness were analyzed histologically. Scale bar = 200 μm. (n = 5 and 4 for WT and Akita, respectively; data shown are mean ± SD, p-value by t-test). (H) Cell-size analysis of the cells isolated from P1 hearts from normal (WT) and diabetic (Akita) pregnancies using forward scatter by flow cytometry (FSC). At least 25,000 cells were measured per sample. Representative histogram from three flow cytometry measurements for each group (left) and the geometrical means of FSC (right). (n = 3, p<0.05 by t-test).
Author response image 1
Author response image 2
Videos
Video 1
Beating hESC-CMs differentiation in glucose 25 mM medium.
This video shows beating of hESC-CMs differentiated in the medium containing 25 mM glucose from day 14 for 7 days.
Video 2
Beating hESC-CMs differentiation in glucose 0 mM medium.
This video shows beating of hESC-CMs differentiated in the medium containing 0 mM glucose from day 14 for 7 days.
Additional files
-
Transparent reporting form
- https://doi.org/10.7554/eLife.29330.021
Download links
A two-part list of links to download the article, or parts of the article, in various formats.
Downloads (link to download the article as PDF)
Open citations (links to open the citations from this article in various online reference manager services)
Cite this article (links to download the citations from this article in formats compatible with various reference manager tools)
Glucose inhibits cardiac muscle maturation through nucleotide biosynthesis
eLife 6:e29330.
https://doi.org/10.7554/eLife.29330


