CHIP as a membrane-shuttling proteostasis sensor
- Goethe University Frankfurt, Germany
Figures
Figure 1 with 1 supplement
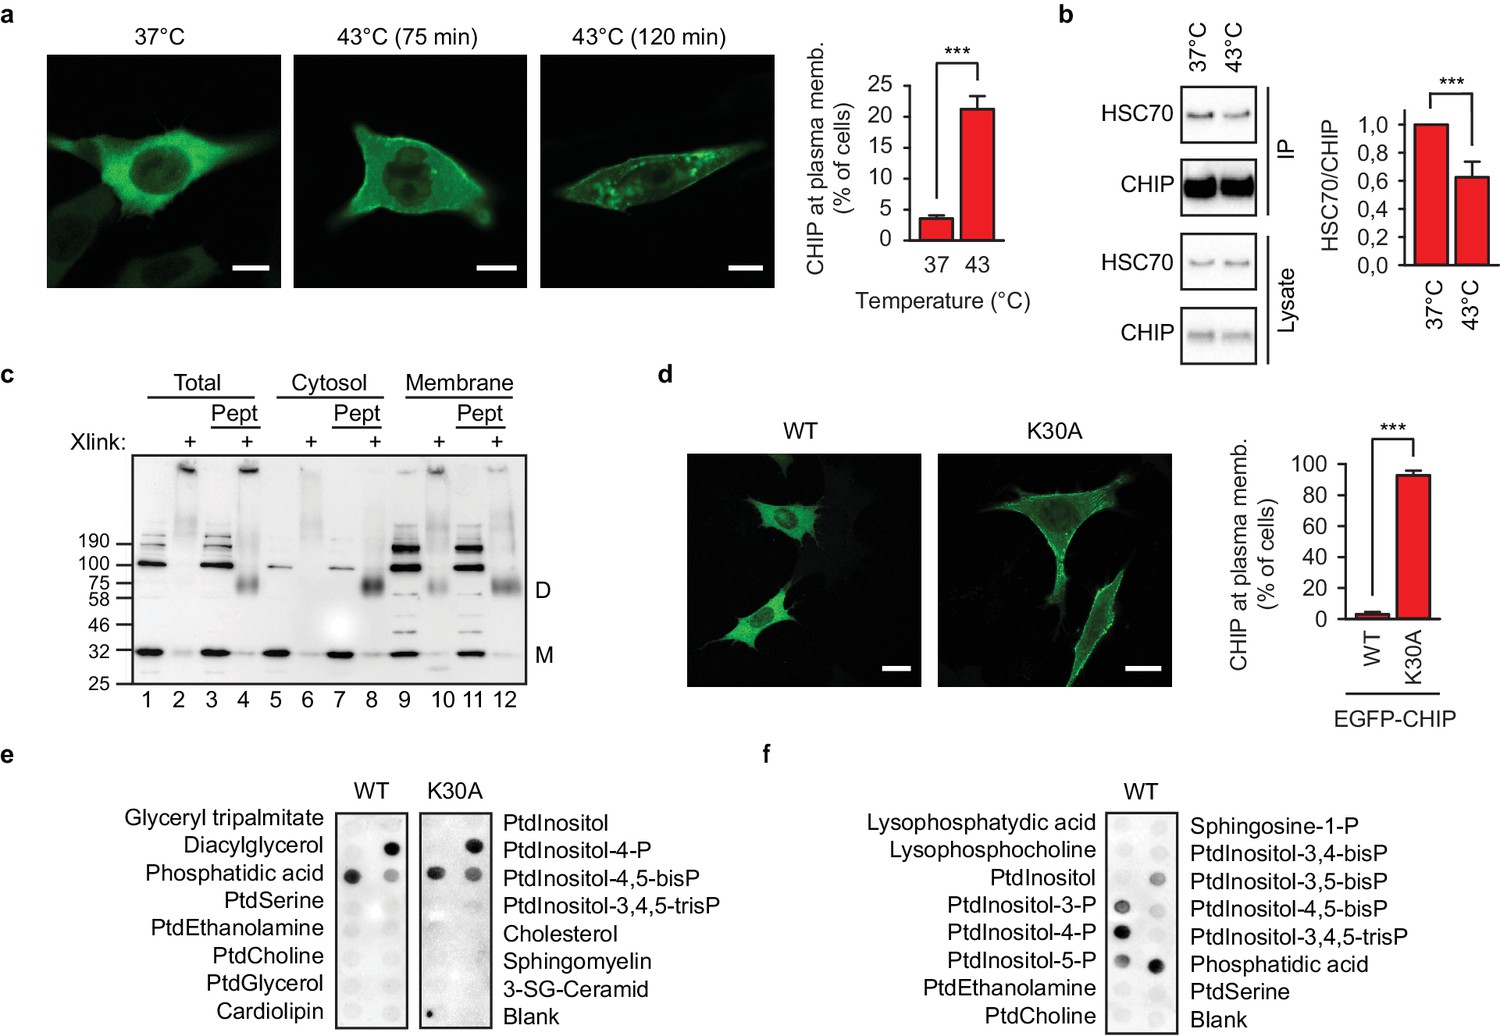
Chaperone-free CHIP interacts with cellular membranes in murine embryonic fibroblasts and a distinct set of phospholipids in vitro.
(a) Heat shock (43°C) mobilizes transiently transfected EGFP-CHIP for binding to membranes. Scale bar 10 μm. ***p<0.001, chi-square analysis; N = 3 independent experiments (mean ± SD). (b) CHIP loses its association with HSC70 during acute heat shock, 43°C for 60 min, as determined by immunoprecipitation (mean ± SD). ***p<0.001, t-test analysis; N = 4 independent experiments. One representative western blot is shown. (c) A fraction of endogenous CHIP in membranes exists in chaperone-free dimeric state as determined by subcellular fractionation and chemical crosslinking. Xlink, cross-linked samples; Pept, C-terminal octapepeptide from HSP70; M, monomer; D, dimer. One representative western blot out of three independent experiments is shown. (d) K30A mutant CHIP resides at the cellular membranes (mean ± SD). Scale bar 10 μm. One representative out of three independent experiments is shown. ***p<0.001, chi-square analysis; N = 3 independent experiments. (e) Chaperone-free wild-type CHIP and K30A variant bind to a set of cellular phospholipids as determined by lipid-binding assay. Ptd, phosphatidyl; P, phosphate. One representative out of three independent experiments is shown. (f) Phosphatidylinositol monophosphates are recognized by wild-type chaperone-free CHIP as determined by lipid-binding assay. One representative out of three independent experiments is shown.
Figure 1—figure supplement 1
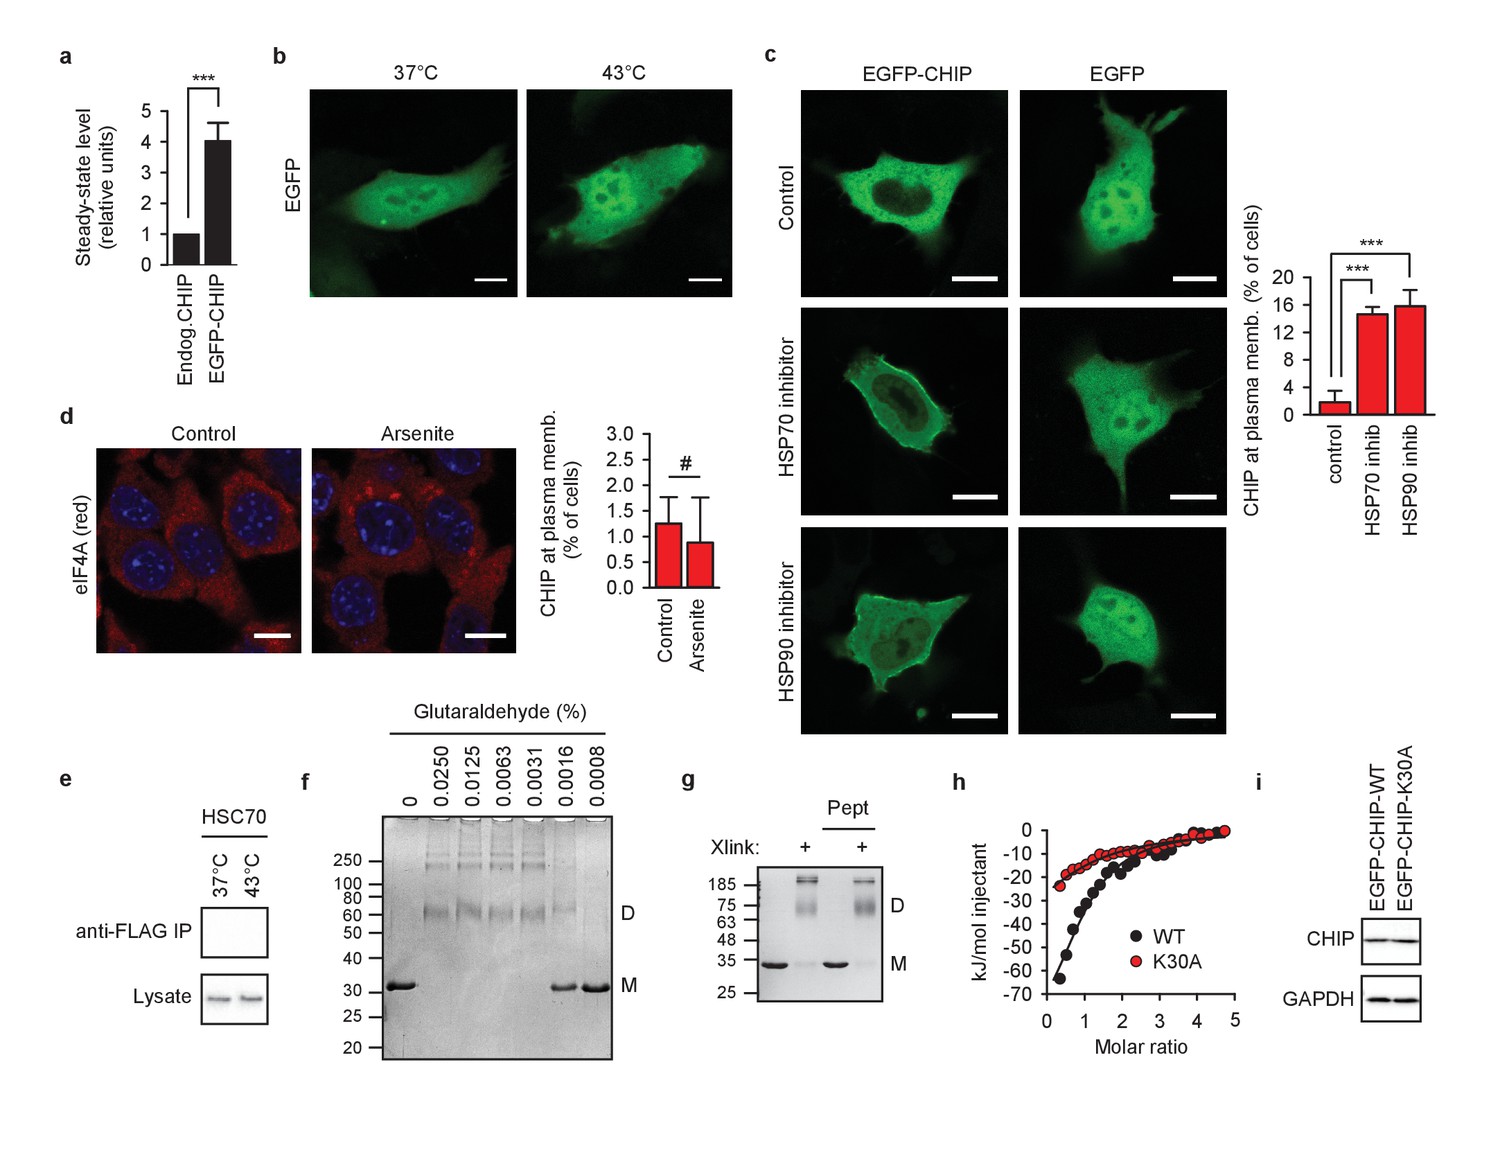
Chaperone-free CHIP association with cellular membranes.
(a) Comparison of steady-state levels of endogenous CHIP and EGFP-CHIP 24 hr after transfection by means of western blotting with anti-CHIP antibody (mean ± SD). ***p<0.001, t-test analysis, N = 3 independent experiments. (b) Heat shock at 43°C does not cause EGFP association with membranes. One representative out of three independent experiments is shown. Scale bar 10 μm. (c) Inhibitors of HSP70 (20 μM VER-155008 for 4 hr) and HSP90 (20 μM 17-AAG for 4 hr) mimic the heat shock effect in regard to CHIP relocalization to membranes in murine fibroblasts (mean ± SD). EGFP-transfected cells were used as control. One representative experiment out of three is shown. Scale bar 10 μm. ***p<0.001, chi-square analysis; N = 3 independent experiments. (d) 0.5 mM arsenite treatment for 30 min does not induce CHIP relocalization to membranes in murine fibroblasts (mean ± SD). #, no statistically significant difference according to chi-square analysis; N = 3 independent experiments. Immunofluorescent staining of eIF4A (red) was used to confirm stress granule formation. DAPI staining in blue. (e) HSC70 does not bind to anti-FLAG matrix in empty vector-transfected cell lysates. One representative experiment out of four is shown. (f) Chemical crosslinking captures CHIP dimers and oligomers in vitro as determined by Coomassie Blue-stained reducing SDS-PAGE gel. M, monomers; D, dimers. One representative out of three experiments is shown. (g) CHIP oligomers cannot be fully disassembled by excess of C-terminal octapeptide from HSP70 (Pept) in vitro as determined by Coomassie Blue-stained reducing SDS-PAGE gel. Xlink, crosslinked samples; M, monomers; D, dimers. One representative out of three experiments is shown. (h) K30A mutation affects CHIP binding to HSP70 as measured by isothermal titration calorimetry using C-terminal octapeptide of HSP70 at 37°C. WT, K30A, wild-type CHIP and K30A mutant, respectively. (i) WT and K30A mutant CHIP have similar steady-state levels upon transient transfection as determined by western blotting. GAPDH was used as loading control. One representative out of three independent experiments is shown.
Figure 2 with 1 supplement
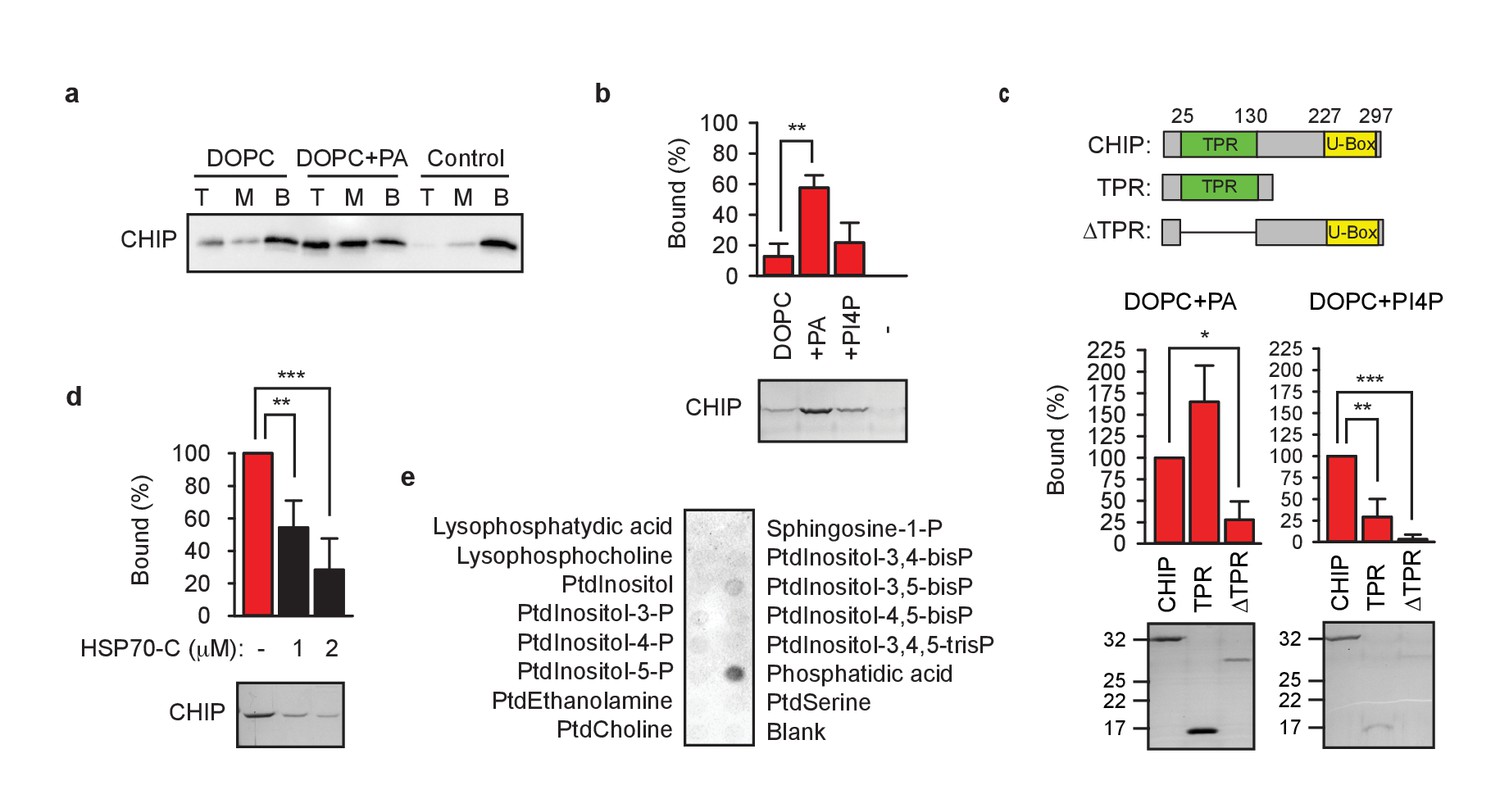
TPR domain mediates CHIP association with membranes.
(a) Phosphatidic acid (PA) enhances CHIP association with DOPC-liposomes in floatation assays. T, M, B, top, middle, bottom of the gradient, respectively. One representative western blot out of three independent experiments is shown. (b) PA strongly and phosphatidylinositol-4-phosphate (PI4P) weakly enhance CHIP association with DOPC-liposomes in pelleting assay (mean ± SD). **p<0.01, t-test analysis; N = 3 independent experiments. One representative Coomassie Blue-stained gel is shown. (c) TPR domain mediates binding of CHIP to indicated liposomes in pelleting assay (mean ± SD). Schematic depiction of protein variants used to test binding to liposomes indicates N-terminal TPR domain and C-terminal U-Box of CHIP. ***p<0.001, **p<0.01, *p<0.05, t-test analysis; N = 3 independent experiments. Representative Coomassie Blue-stained gels are shown. (d) C-terminal HSP70 (260 amino acid fragment, HSP70-C) affects association of CHIP with liposomes during liposome pelleting (mean ± SD). ***p<0.001, **p<0.01, t-test analysis; N = 4 independent experiments. One representative western blot is shown. (e) HSP70-C in ten-fold molar excess blocks interaction of CHIP with phospholipids as determined by lipid-binding assay. One representative out of three independent experiments is shown.
Figure 2—figure supplement 1
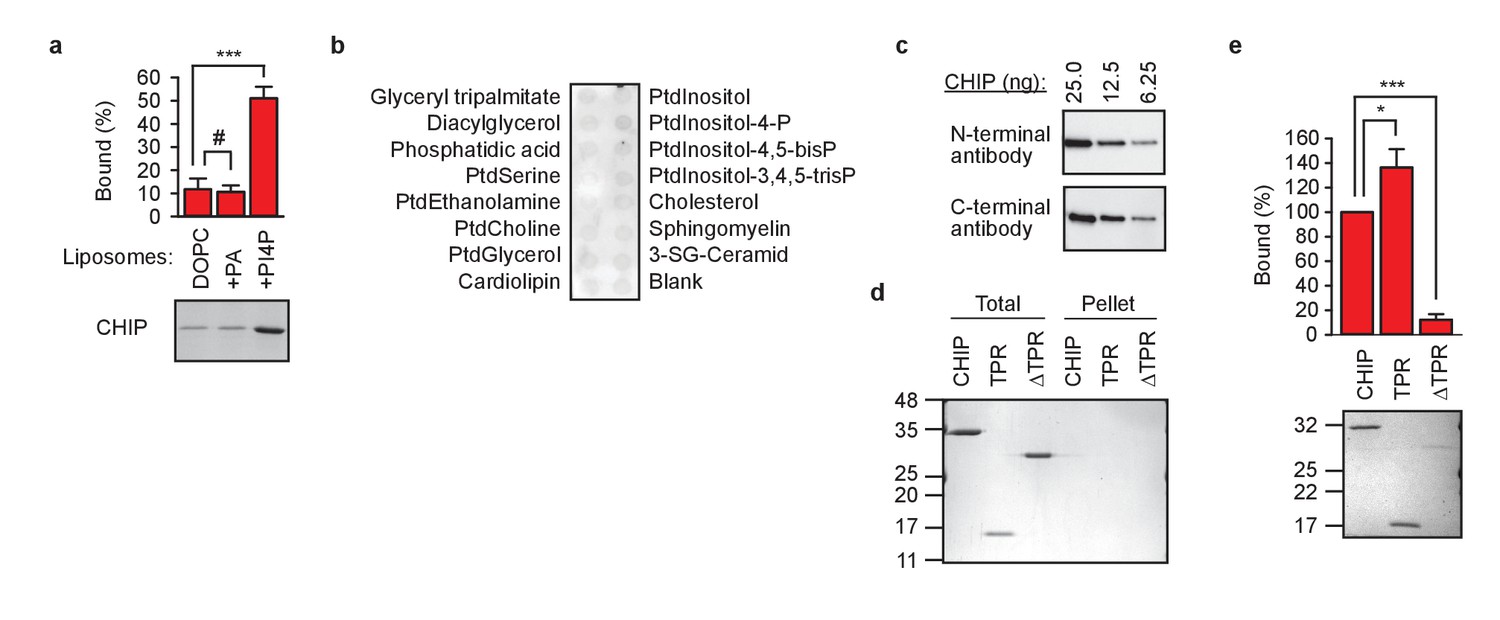
TPR domain-lipid interaction in vitro.
(a) 5% phosphatidylinositol-4-phosphate (PI4P) strongly enhance CHIP association with DOPC-liposomes in pelleting assay. 5% phosphatidic acid (PA) was insufficient to enhance binding of CHIP to DOPC-liposomes (mean ± SD). ***p<0.001, # indicates no significant difference, t-test analysis; N = 3 independent experiments. One representative Coomassie Blue-stained gel is shown. (b) TPR-reactive antibody (anti-N-terminal CHIP) cannot interact with lipid-bound CHIP in lipid-binding assay. One representative out of three independent experiments is shown. (c) N- and C-terminal CHIP-reactive antibodies show comparable sensitivity against recombinant CHIP. (d) Indicated proteins are not pelleted if centrifuged in the absence of liposomes. One representative Coomassie Blue-stained gel out of three independent experiments is shown. (e) TPR domain binding to DOPC-liposomes containing 5% phosphatidic acid in pelleting assay (mean ± SD). ***p<0.001, *p<0.05, t-test analysis; N = 3 independent experiments. One representative Coomassie Blue stained gel is shown.
Figure 3 with 1 supplement
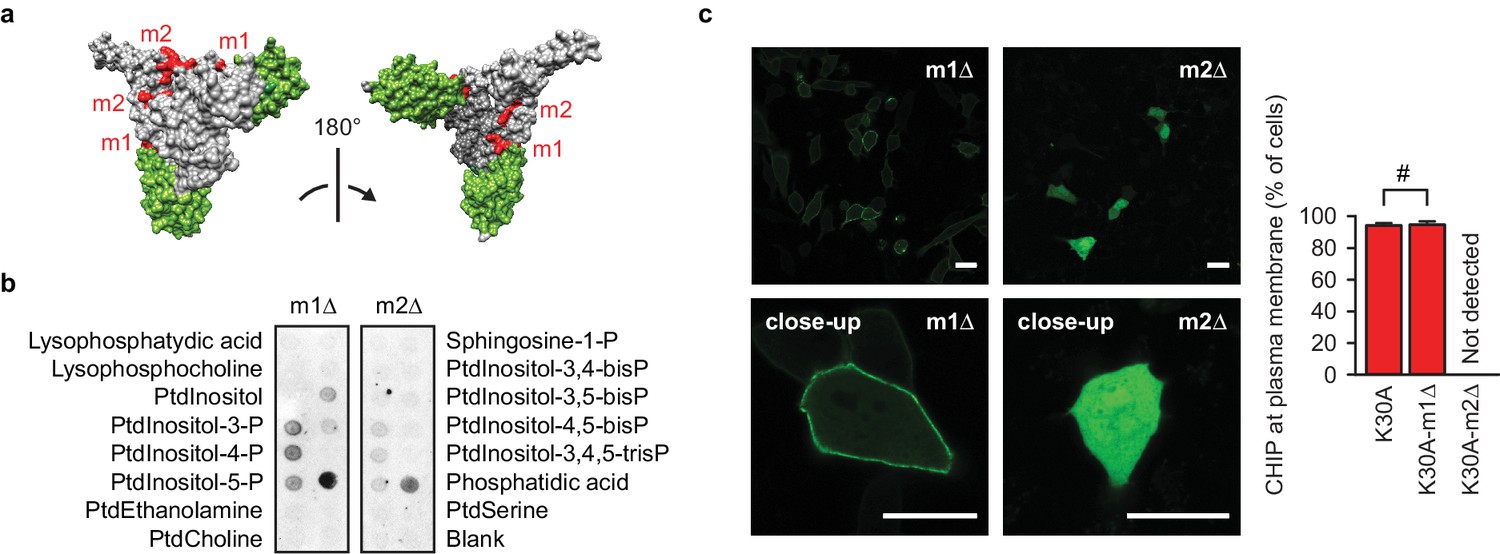
A positively charged patch is required for CHIP binding to phospholipids.
(a) Surface representation of CHIP dimer (PDB entry 2c2l) with TPR domains colored green. m1, m2, positively charged patches colored red. (b) m2-mutation (m2Δ) affects CHIP interaction with phospholipids in vitro as determined by lipid-binding assay. One representative out of three independent experiments is shown. (c) m2Δ CHIP loses association with membranes in vivo. Scale bar 20 μm. #, no statistically significant difference according to chi-square analysis; N = 3 independent experiments (mean ± SD).
Figure 3—figure supplement 1
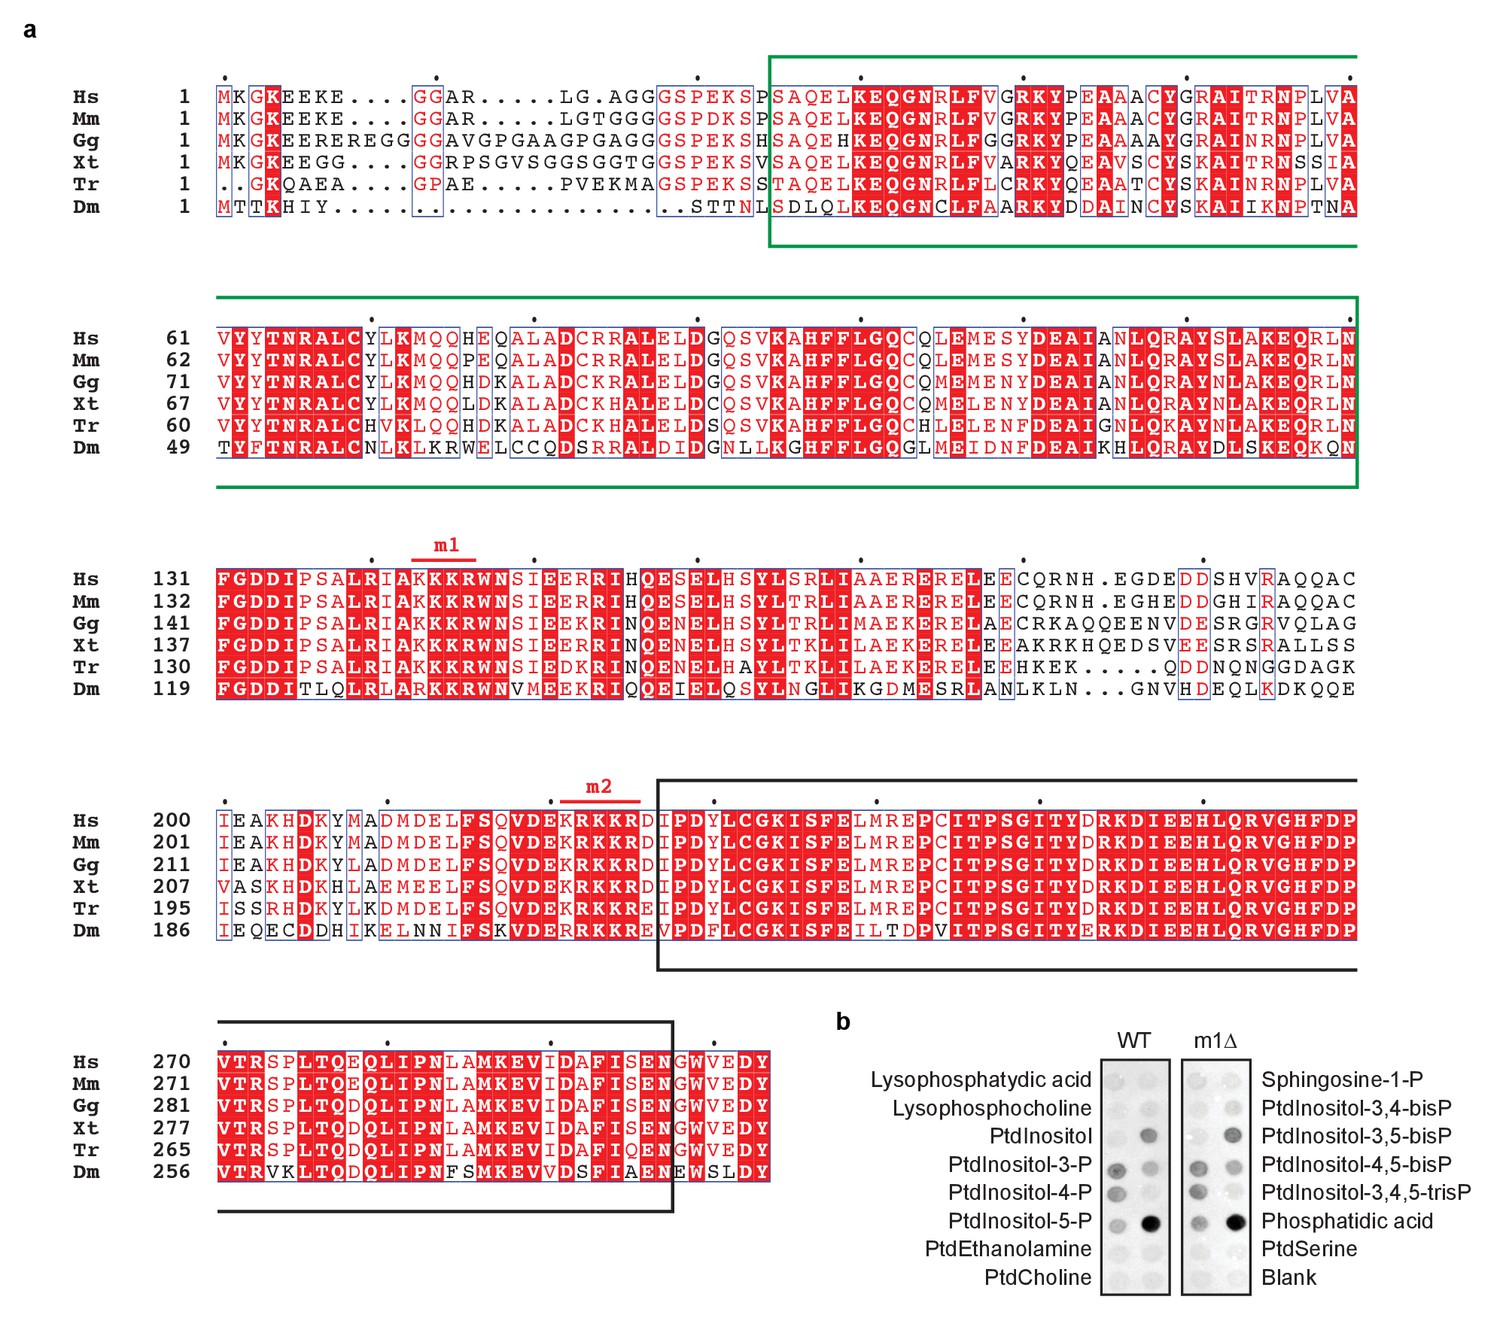
Positively charged patches in CHIP are conserved.
(a) Alignment of CHIP sequences from human (Hs, Homo sapiens), mouse (Ms, Mus musculus), chicken (Gg, Gallus gallus), xenopus (Xt, Xenopus tropicalis), fugu (Tr, Takifugu rubripes), and fruitfly (Dm, Drosophila melanogaster). TPR domain and U-box are marked by green and black boxes, respectively. Two positively charged patches are conserved and labelled m1 and m2. (b) Purified wild-type CHIP (WT) and its m1-mutated variant (m1Δ) show similar phospholipid binding specificity as determined by lipid-binding assay. One representative out of three experiments is shown.
Figure 4 with 1 supplement
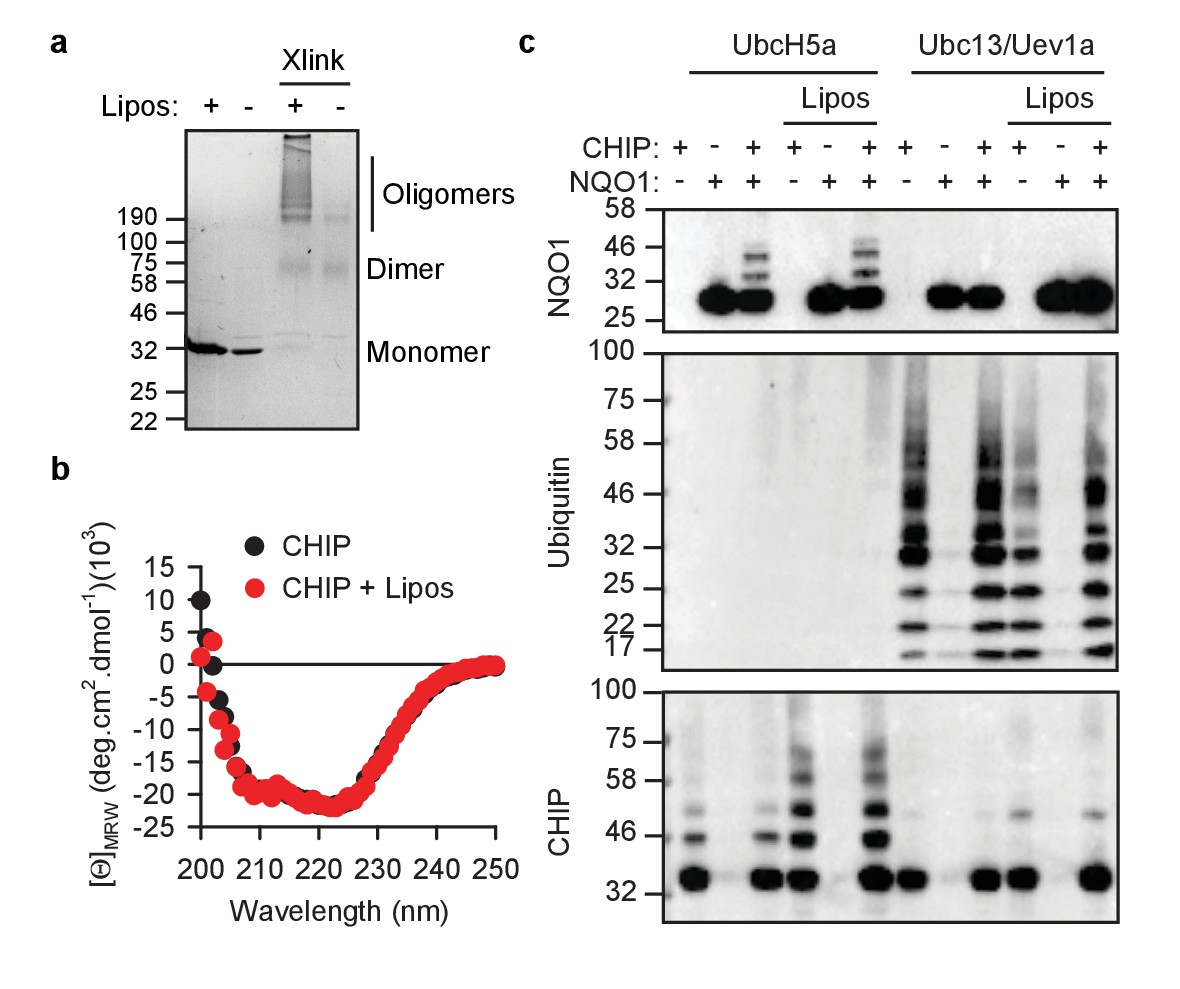
CHIP retains its activity on liposomes.
(a) CHIP can oligomerize on PA-containing liposomes (Lipos) as determined by chemical crosslinking. Xlink, crosslinked samples. (b) CHIP does not change its global content of secondary structures upon binding to liposomes as determined by CD spectroscopy. Mean values (from three independent experiments) at respective wavelength are plotted. (c) While attached to liposomes, CHIP remains capable to ubiquitylate the substrate protein NQO1 and form unattached K63-conjugated chains. In vitro ubiquitylation assays were performed using as E2 either UbcH5a (for substrate and auto-ubiquitylation) or the heterodimer Ubc13/Uev1a (for unattached ubiquitin K63 conjugation). One representative out of three independent experiments is shown.
Figure 4—figure supplement 1
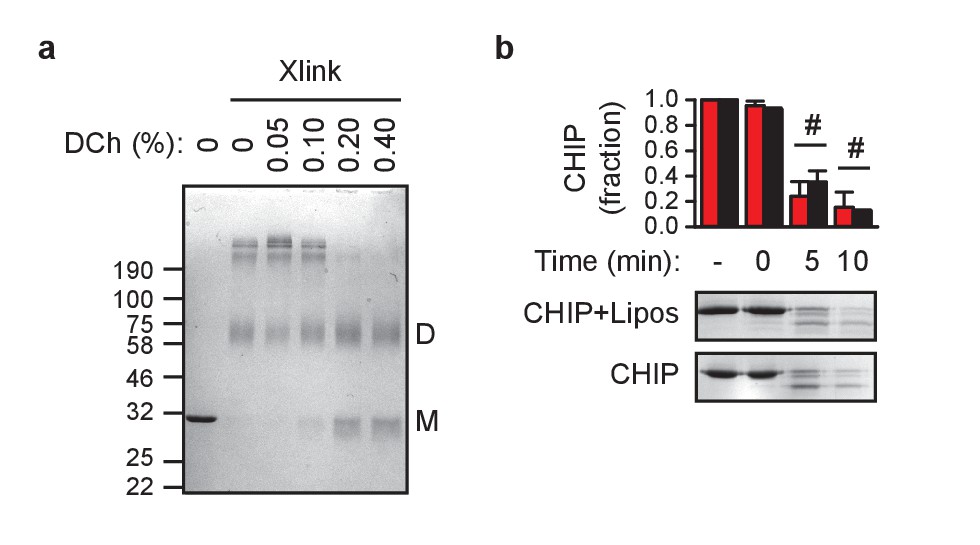
Characterization of CHIP associated with liposomes.
(a) Chemical crosslinking reveals that deoxycholate (DCh) monomerizes CHIP in vitro as determined by Coomassie Blue-stained reducing SDS-PAGE gel. Xlink, crosslinked samples; M, monomer; D, dimer. One representative out of three experiments is shown. (b) CHIP association with membranes does not change its sensitivity to proteolysis (mean ± SD). Black, CHIP in solution, red, CHIP on liposomes. # indicates no significant difference, t-test analysis; N = 3 independent experiments. One representative Coomassie Blue-stained gel is shown.
Figure 5 with 1 supplement
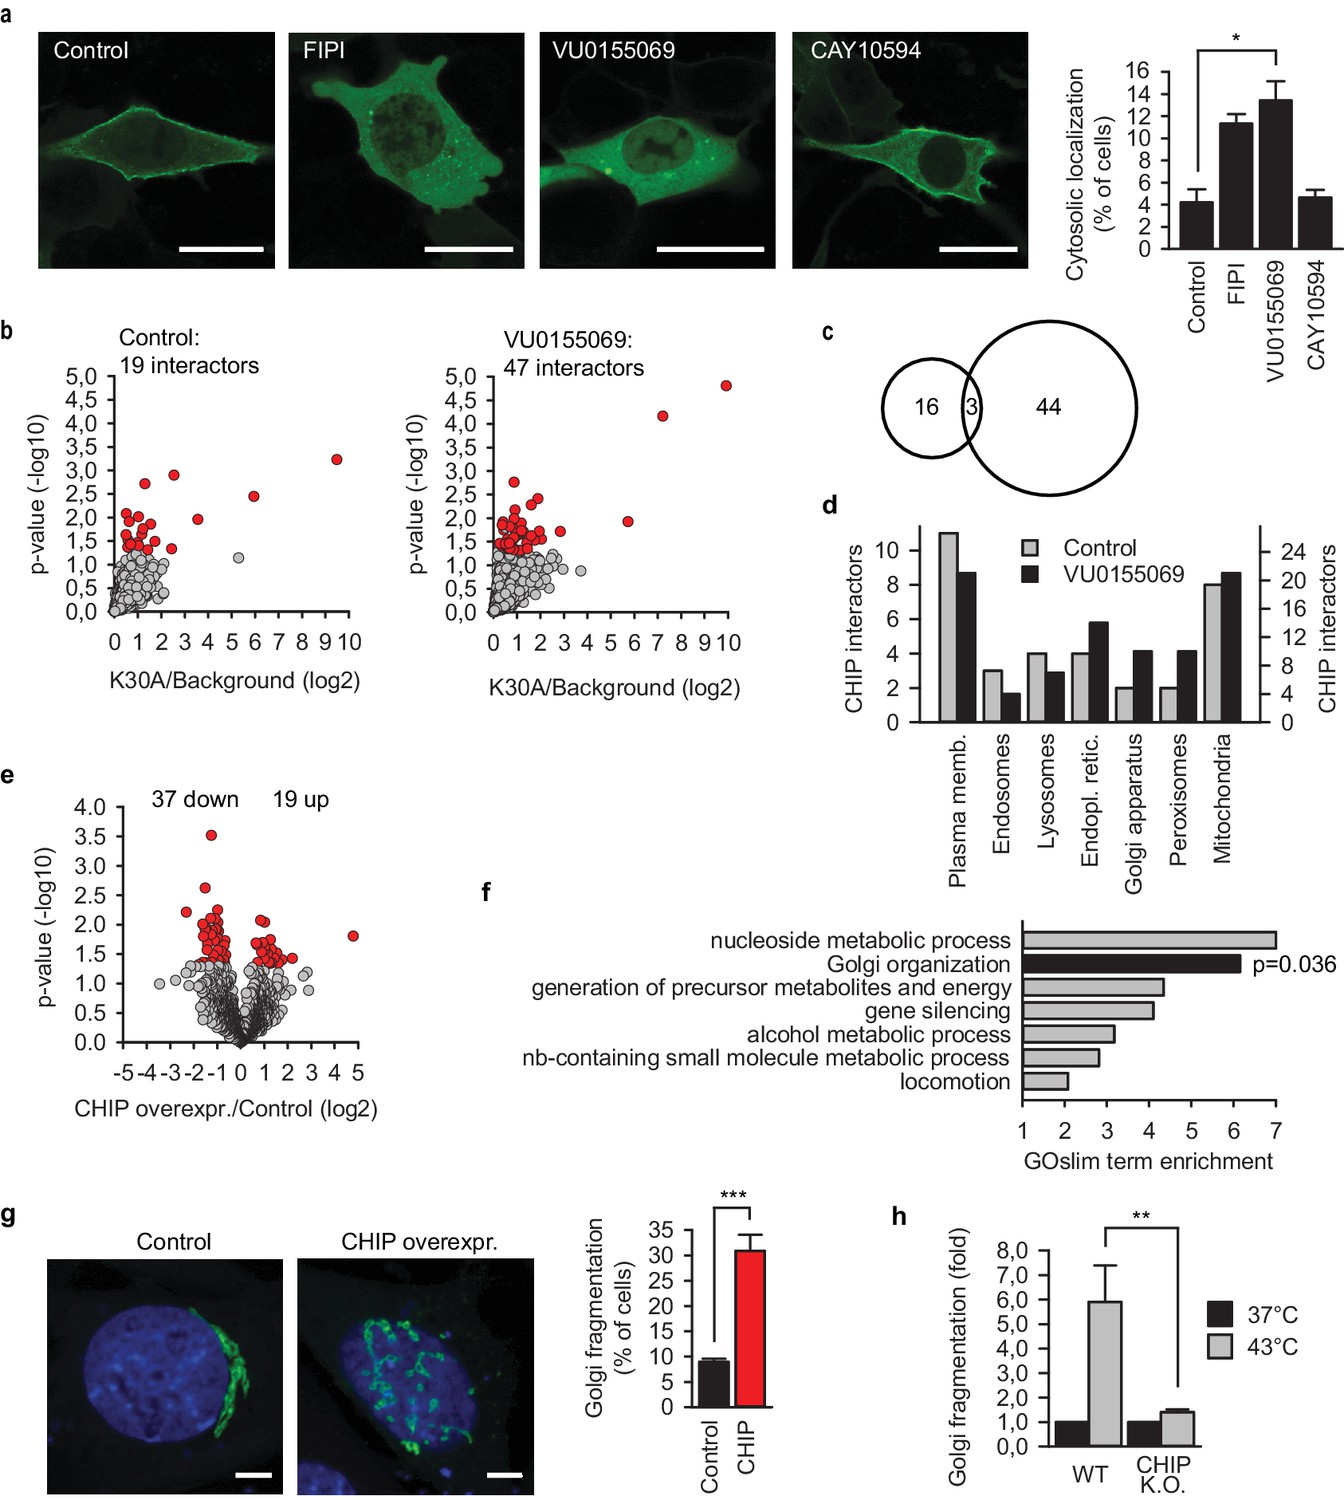
CHIP reorganizes cellular proteome and architecture.
(a) Inhibition of phospholipase D (PLD) releases EGFP-CHIP-K30A from cellular membranes. FIPI, isoform independent inhibitor of PLD; VU0155069 and CAY10594, inhibitors of PLD1 and PLD2, respectively. Scale bar 20 mm. *p<0.05, chi-square analysis; N = 4 independent experiments (mean ± SD). (b) Interactors of EGFP-CHIP-K30A in transiently transfected murine embryonic fibroblasts (MEF). Phospholipase D was inhibited using 500 nM VU0155069. EGFP pulldowns were prepared as detailed in Methods and label-free mass spectrometry was used to quantitate proteins associated with CHIP. N = 5 biologically independent experiments. Volcano plots indicate average enrichment of individual protein levels. Red color marks significantly enriched proteins as determined by two sample t-test (p-value<0.05) (c) Minimal overlap of CHIP interactors from control and upon phospholipase D inhibition visualized by a venn diagram. (d) Subcellular localization of CHIP interactors as assigned by GeneCards database (www.genecards.org). According to the database, proteins may display multiple localizations. The scales of y-axis were adjusted according to the interactome sizes (19 versus 47). (e) Label-free quantitative mass spectrometry was used to determine proteome changes in MEFs upon overexpression of CHIP for 24 hr (N = 4). Volcano plot indicates average changes of individual protein levels. Red color marks significantly changed proteins as determined by two sample t-test (p-value<0.05). (f) GOBPslim terms enriched above two in the group of proteins significantly changed upon CHIP overexpression. Fisher exact test was used to determine statistical significance. (g) Morphology of the Golgi apparatus upon transient CHIP overexpression in MEFs assessed by co-transfected Golgi marker. DAPI stain in blue. Scale bar 5 mm. ***p<0.001, chi-square analysis; N = 3 independent experiments (mean ± SD). (h) Fragmentation of Golgi apparatus during heat shock in wild-type (WT) and CHIP knock-out MEFs (CHIP K.O.). Fraction of cells with fragmented Golgi at 37°C was set to 1. Increase of cells with fragmented Golgi after 30 min at 43°C is plotted as mean ± SD from three independent experiments. **p<0.01, t-test analysis.
-
Figure 5—source data 1
LFQ of EGFP-CHIP-K30A interactors under the specified conditions.
Mass spectrometry raw files were processed with MaxQuant as detailed in Materials and methods.
- https://doi.org/10.7554/eLife.29388.012
-
Figure 5—source data 2
Significantly enriched proteins in EGFP-CHIP-K30A pull-downs.
Quantification was performed using label-free mass spectrometry. p<0.05, two-sample t-test analysis; N = 5 biologically independent experiments. Control, DMSO-treated samples; PLD inhibitor, 500 nM VU0155069-treated samples.
- https://doi.org/10.7554/eLife.29388.013
-
Figure 5—source data 3
LFQ of proteome changes under the specified conditions.
Mass spectrometry raw files were processed with MaxQuant as detailed in Materials and methods.
- https://doi.org/10.7554/eLife.29388.014
-
Figure 5—source data 4
Significant proteome changes upon CHIP overexpression in murine embryonic fibroblasts.
Quantification was performed using label-free mass spectrometry. p<0.05, two-sample t-test analysis; N = 4 biologically independent experiments.
- https://doi.org/10.7554/eLife.29388.015
Figure 5—figure supplement 1
Cellular reorganization by chaperone-free CHIP.
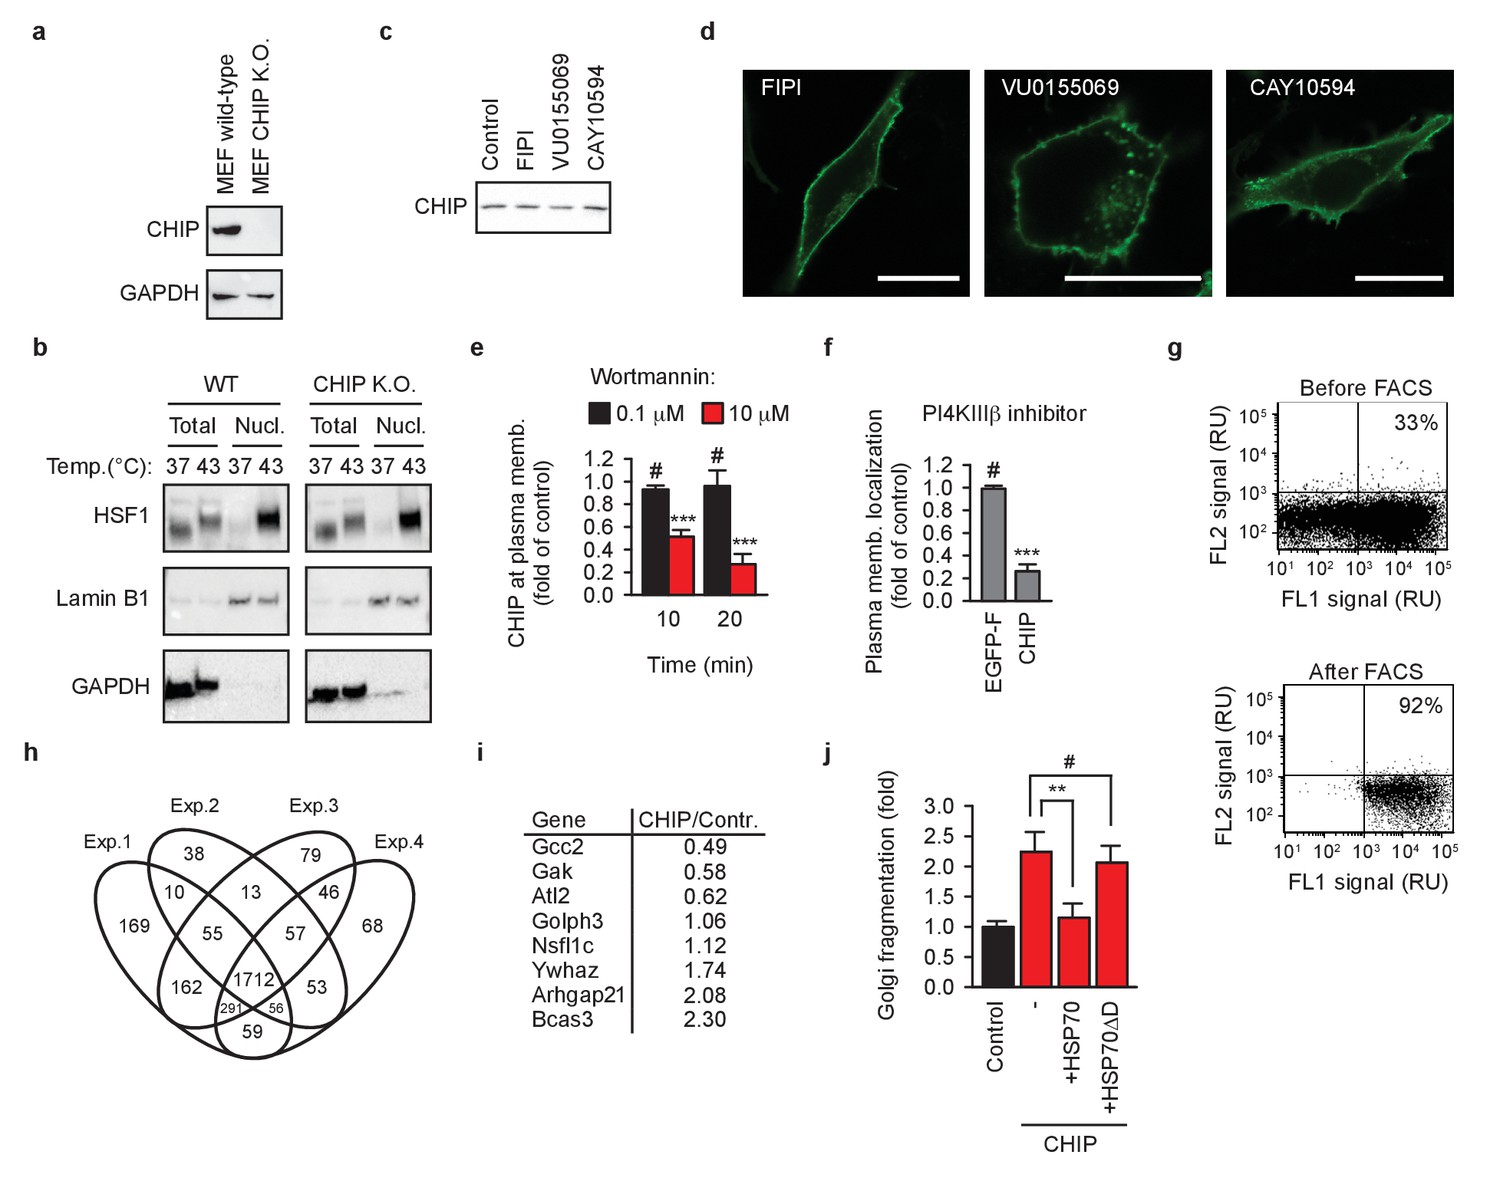
(a) Murine embryonic fibroblasts (MEF) lacking CHIP (CHIP K.O.) were engineered using CRISPR/Cas9 system. GAPDH was used as loading control. (b) HSF1 translocation into nucleus after 60 min at 43°C was analyzed by means of nuclei isolation as detailed in Materials and methods. Lamin B1 and GAPDH were used as markers of nuclei and cytosol, respectively. One representative out of three independent experiments is shown. (c) Phospholipase D inhibitors do not affect steady-state levels of transiently transfected EGFP-CHIP-K30A in MEFs as determined by western blotting. Samples were normalized to have the same protein concentration before loading on gel. One representative out of three independent experiments is shown. (d) Phospholipase D inhibitors do not affect membrane localization of transiently transfected farnesylated EGFP in MEFs. One representative out of three independent experiments is shown. Scale bar 20 μm. (e) Inhibition of type III phosphatidylinositol-4 kinases (PI4KIII) by wortmannin causes an acute undocking of EGFP-CHIP-K30A from cellular membranes (mean ± SD). ***p<0.001, # indicates no significant difference, t-test analysis; N = 3 independent experiments. (f) Inhibition of PI4KIIIβ by its specific inhibitor IN-10 for 20 min undocks EGFP-CHIP-K30A, but not farnesylated EGFP (EGFP-F) from cellular membranes (mean ± SD). ***p<0.001, # indicates no significant difference, t-test analysis; N = 3 independent experiments. (g) EGFP and CHIP co-transfected MEFs were sorted using FACS to enrich the transfected population from 33% to 92%. One representative out of four independent experiments is shown. The sorted cells were lysed and analyzed by quantitative mass spectrometry as detailed in Materials and methods. (h) Overlap of identified proteins in four biologically independent experiments. (i) Average changes of quantified proteins from GOBPslim group ‘Golgi organization’. N = 4 biologically independent experiments. (j) Inhibition of the Golgi fragmentation by co-transfected HSP70, but not by HSP70 mutant with altered CHIP-binding tail (HSP70ΔD) (mean ± SD). **p<0.01, # indicates no significant difference, t-test analysis; N = 3 independent experiments.
Additional files
-
Transparent reporting form
- https://doi.org/10.7554/eLife.29388.016
Download links
A two-part list of links to download the article, or parts of the article, in various formats.
Downloads (link to download the article as PDF)
Open citations (links to open the citations from this article in various online reference manager services)
Cite this article (links to download the citations from this article in formats compatible with various reference manager tools)
CHIP as a membrane-shuttling proteostasis sensor
eLife 6:e29388.
https://doi.org/10.7554/eLife.29388


