Modifications at K31 on the lateral surface of histone H4 contribute to genome structure and expression in apicomplexan parasites
- INSERM U1209, CNRS UMR5309, Université Grenoble Alpes, France
- Institut Pasteur, CNRS, ERL 9195, INSERM, Unit U1201, France
- Aix-Marseille Univ, CEA, CNRS, UMR 7265, BIAM-LEMIRE, France
- Université Grenoble Alpes, CEA, INSERM, France
Figures
Figure 1 with 4 supplements

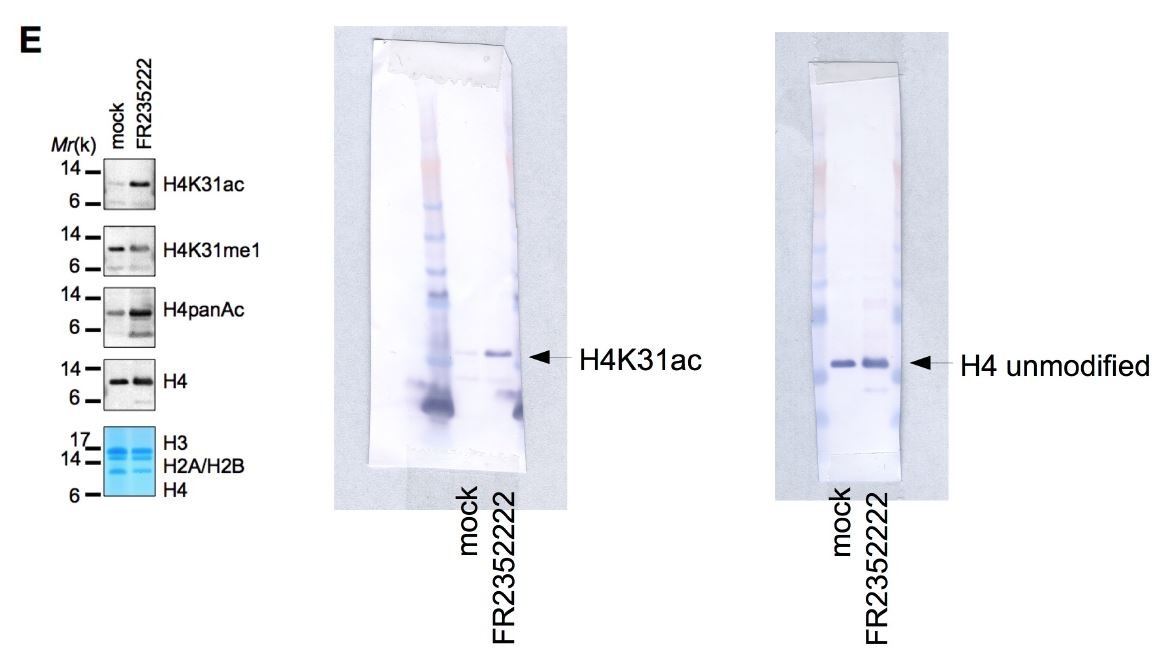
The residue K31 on the lateral surface of histone H4 is a novel PTM.
(a) The high-resolution MS/MS spectrum of the H4K31ac peptide generated from histone H4. H4K31ac was identified using the Mascot search engine in the DNIQGITK(ac)PAIR peptide. (b) Sequence alignment of the first 42 residues of histone H4 from the indicated organisms. Yellow boxes highlight the conserved residue H4K31. (c) Structural analysis of H4K31 modifications. Ball-and-sphere representation of the nucleosome core particle, showing key H3 and H4 lysine residues that are known to be modified. The histone proteins of the nucleosome (PDB code: 3AFA) are color-coded as follows: H2A cyan, H2B grey, H3 orange and H4 blue. The H4K31 residue, highlighted in red, is placed at the dyad axis and mediates key interactions with the DNA (in green). The bottom panel is rotated 90 degrees around the molecular dyad axis. On the right, close-up diagrams of the interactions established by H4K31 with a water molecule (red sphere) and residue R35; and impact of the modifications: methylation, acetylation and succinylation (mimicked by mutant K31E). The mutant H4K31Q (PDB code: 3AZI) partially mimics lysine acetylation. (d) Immunofluorescence analysis of H4K31ac (in red) in both human foreskin fibroblast (HFF) cells and parasite nuclei. DNA (top inset) was stained with Hoechst. Scale bar, 10 μm. (e) Immunoblots of native purified nucleosomes from T. gondii parasites treated with FR235222 or DMSO for 18 hr. Data are representative of two independent experiments.
Figure 1—figure supplement 1
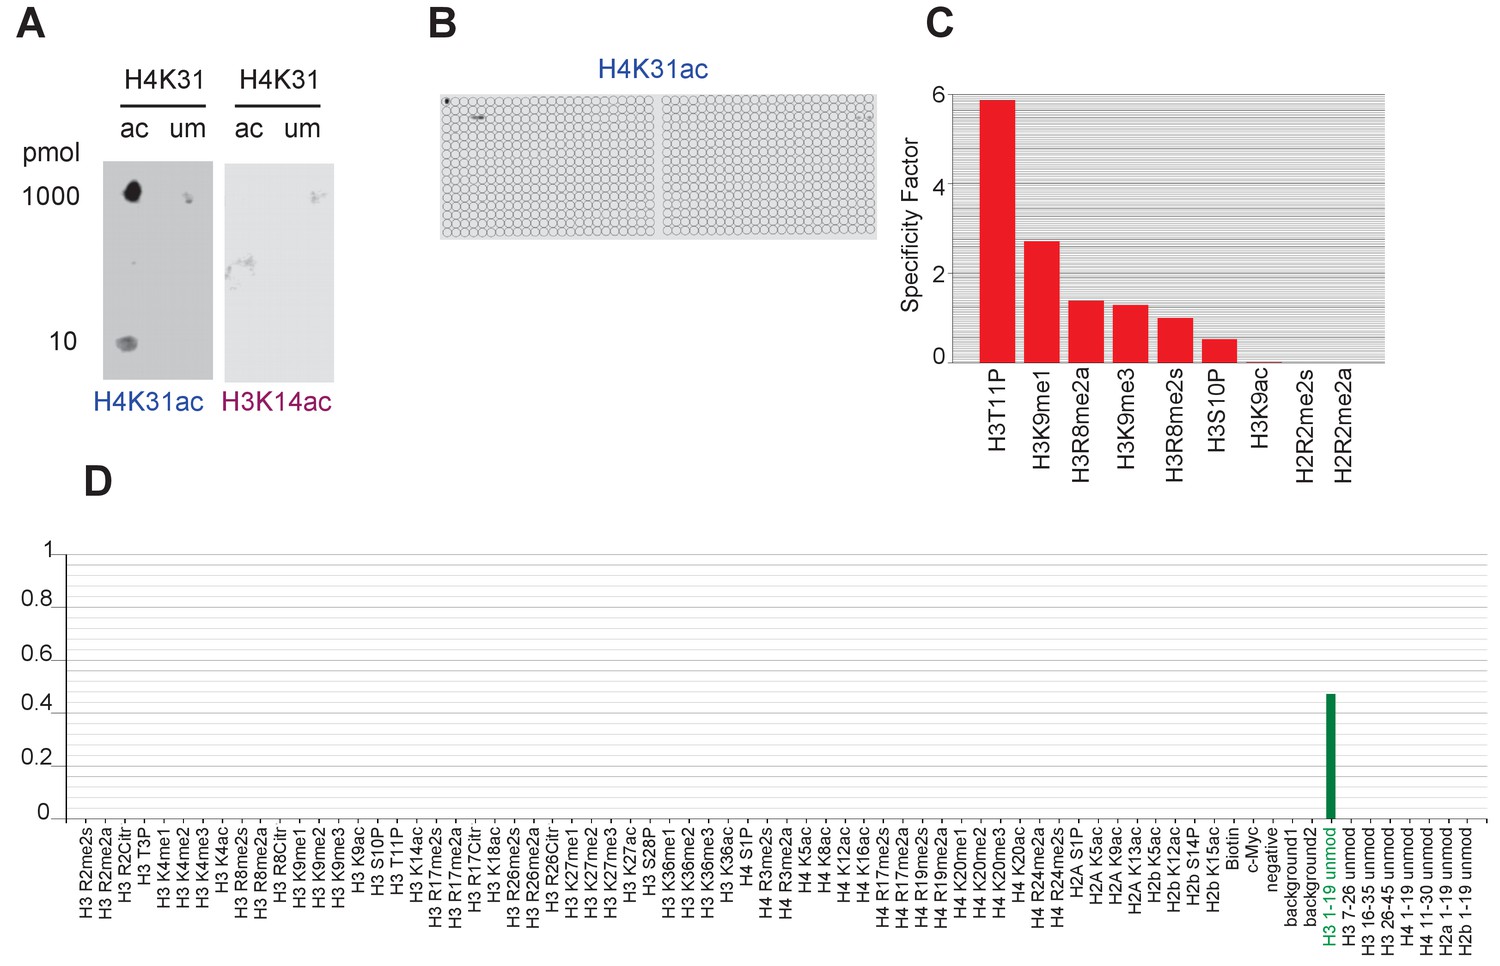
Specific binding of homemade H4K31ac-directed antibody to H4K31 acetylated peptide in vitro.
(a) Peptides with acetylated (ac) and unmodified (um) H4K31 were spotted at 10 or 1000 pmol and detected with home-made H4K31ac-directed antibody or with the control anti-H3K14ac. (b) A 59 PTM-containing MODified Histone Peptide Array (from Activemotif) was incubated with H4K31ac-directed antibody (1/2000) and (c–d) the signals were analyzed according to the manufacturer's instructions (see Materials and methods).
Figure 1—figure supplement 2
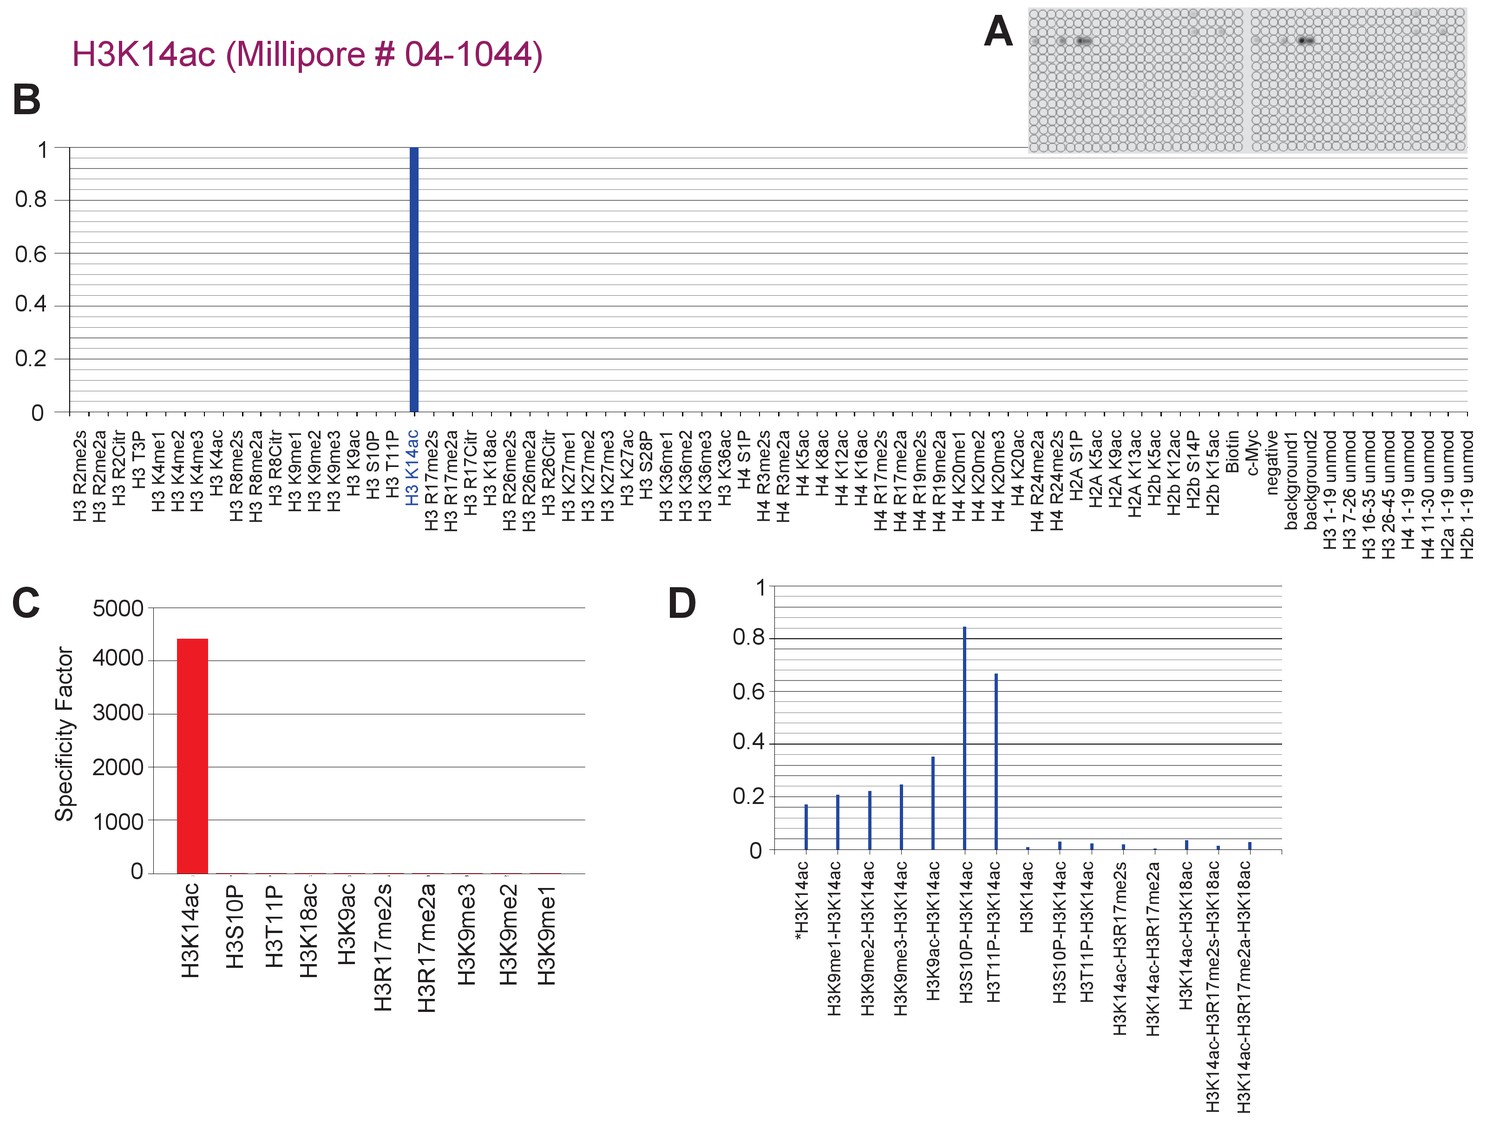
Specific binding of H3K14ac-directed antibody to H3K14ac-containing peptides in vitro.
(a) A 59 PTM-containing MODified Histone Peptide Array (from Activemotif) was incubated with H3K14ac-directed antibody (1/2000, from Chemicon) and (b–d) the signals were analyzed according to the manufacturer's instructions (see Materials and methods).
Figure 1—figure supplement 3
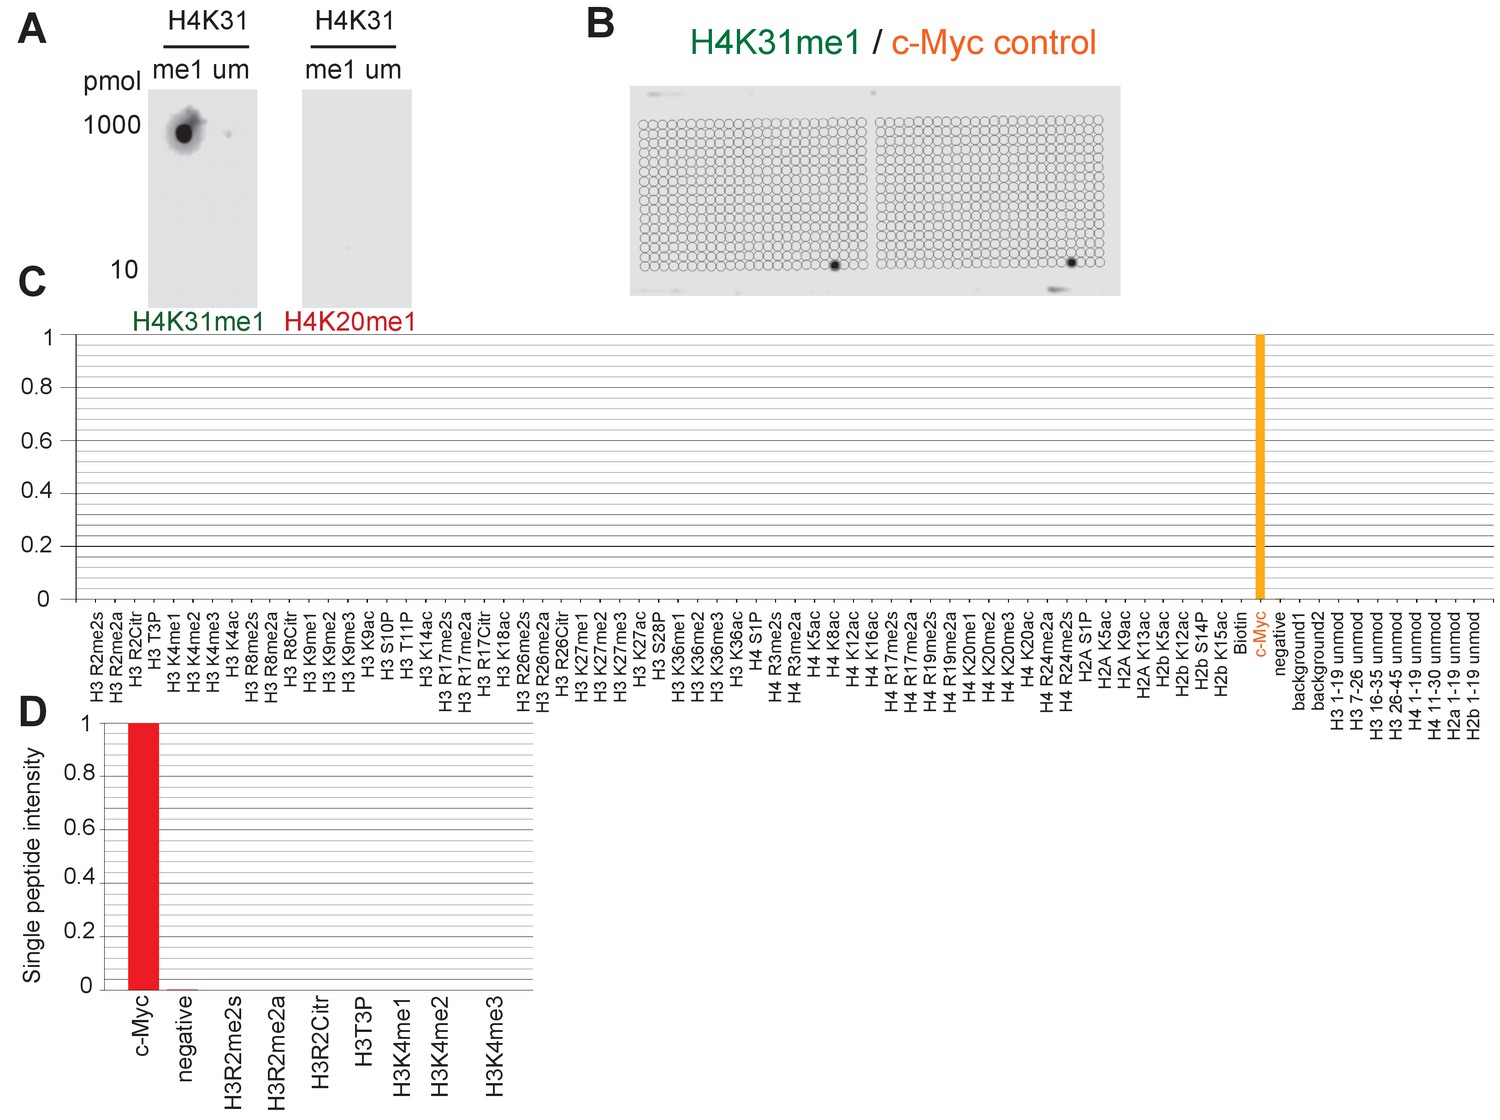
Specific binding of homemade H4K31me1-directed antibody to H4K31 methylated peptide in vitro.
(a) Peptides with monomethylated (me1) and unmodified (um) H4K31 were spotted at 10 or 1000 pmol and detected with homemade H4K31me1-directed antibodies or with the control anti-H4K20me1 (described by Sautel et al. [2007]). (b) A 59 PTM-containing MODified Histone Peptide Array (from Activemotif) was incubated with H4K31me1-directed antibody (1/1000) as well as the internal control c-Myc antibody (1/2000) and (c–d) the signals were analyzed according to the manufacturer's instructions (see Materials and methods).
Figure 1—figure supplement 4
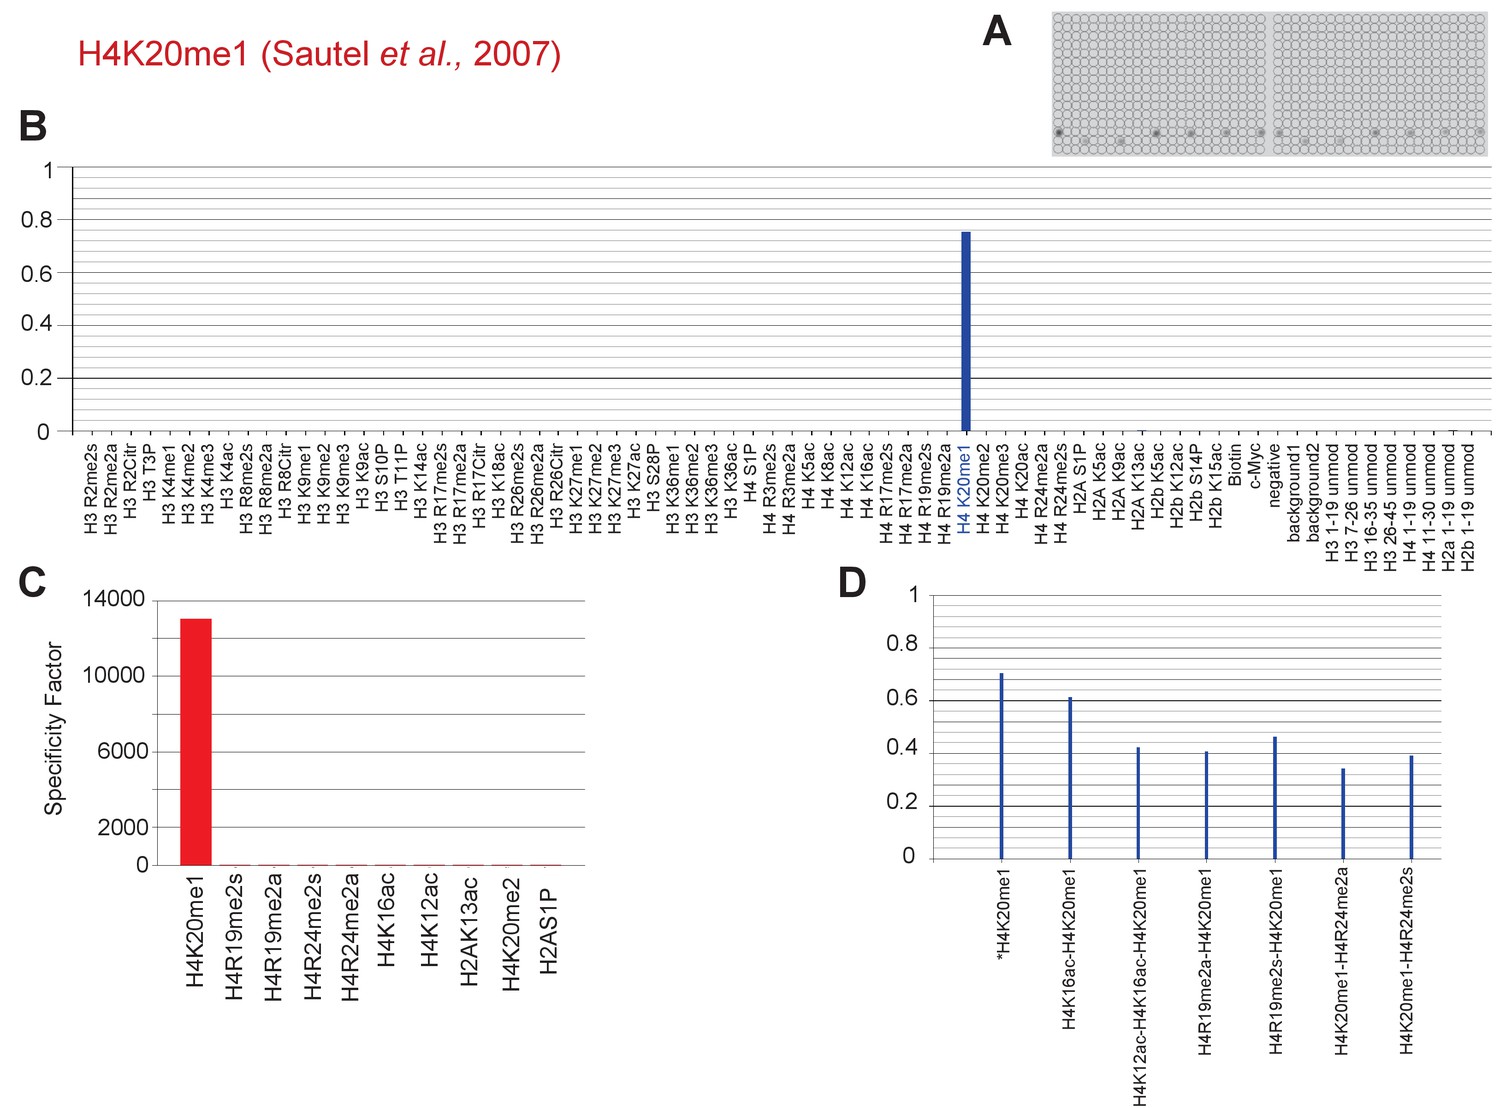
Specific binding ofH4K20me1-directed antibody to H4K20me1-containing peptides in vitro.
(a) A 59 PTM-containing MODified Histone Peptide Array (from Activemotif) was incubated with H4K20me1-directed antibody (1/3000; described by Sautel et al. [2007]) and (b–d) the signals were analyzed according to the manufacturer's instructions (see Materials and methods).
Figure 2
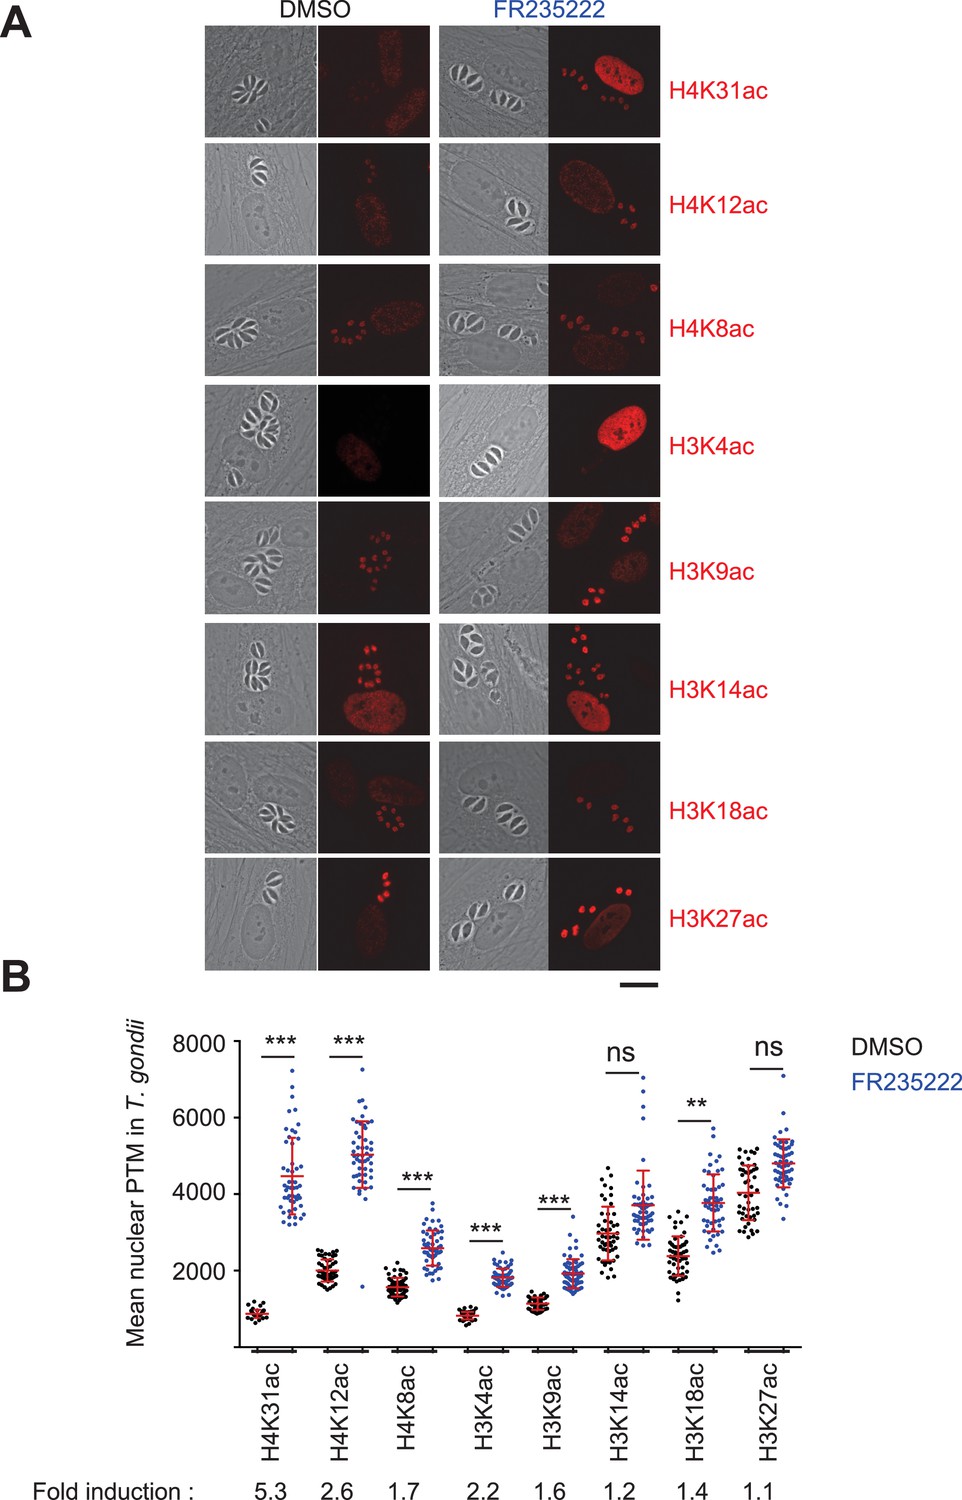
Immunofluorescence analysis of histone modifications in human cells infected with T. gondii.
(a) Confluent monolayers of HFF cells were infected with tachyzoites in the presence of FR235222 and DMSO as a control. Immunofluorescence analyses (IFAs) were carried out with antibodies against specific acetylated histone H3 and H4 lysine residues as indicated. All modifications showed specific and distinct localizations in both parasite and host cell nuclei (in red). Scale bar, 20 μm. (b) Quantification of the intensity of the aforementioned PTMs staining in each parasite nucleus following FR235222 stimulation. Each symbol marks the PTM density of a single parasite nucleus. The results are represented as mean ± standard deviations from two independent experiments; the number of nuclei quantified was at least 50. Asterisks indicate statistical significance when comparing each individual FR235222-treated PTM sample and the corresponding control (DMSO) as determined by an unpaired two-tailed Student's t-test, **p<0.05 and ***p<0.0001; n.s., not significant. Fold induction of each PTM by FR235222 in parasite nuclei is indicated.
Figure 3

Immunofluorescence analysis of histone modifications in P. falciparum and mouse embryonic fibroblast (MEF) cells.
(a) The blood stages of P. falciparum characterized by initial Ring, followed by mature trophozoite and segmented schizont stage. The three developmental stages represent the predominant asexual phase of the malaria parasite. (b) Immunofluorescence analysis of H4K31ac (in red) in asexual stages following 12 hr of treatment with DMSO (vehicle) or FR235222 HDACi. Parasite nuclear DNA was stained with Hoechst (blue). Scale bar, 10 μm. (c) Quantification of the intensity of H4K31ac staining in each P. falciparum nucleus following FR235222 stimulation of asexual stages. The results are represented as mean ± standard deviations from four independent experiments; the number of nuclei quantified was at least n = 25. Asterisks indicate statistical significance of H4K31ac difference between FR235222-treated sample and the corresponding control (DMSO) in the ring, trophozoite and schizont stages, as determined by an unpaired two-tailed Student's t-test, ***p<0.0001; n.s., not significant. (d) and (e) Immunofluorescence analysis of H4K31ac in MEF. DNA was stained with DAPI (blue); the bright foci mark pericentromeric heterochromatin. The signal for H4K31ac, along with H3K27ac, H3K4ac or H3K9ac, is enriched in euchromatic regions as shown in the merge. The mark is excluded from the DAPI dense foci that are associated with H3K9me3 and H4K20me3. Scale bar, 10 μm. Data are representative of three independent experiments.
Figure 4
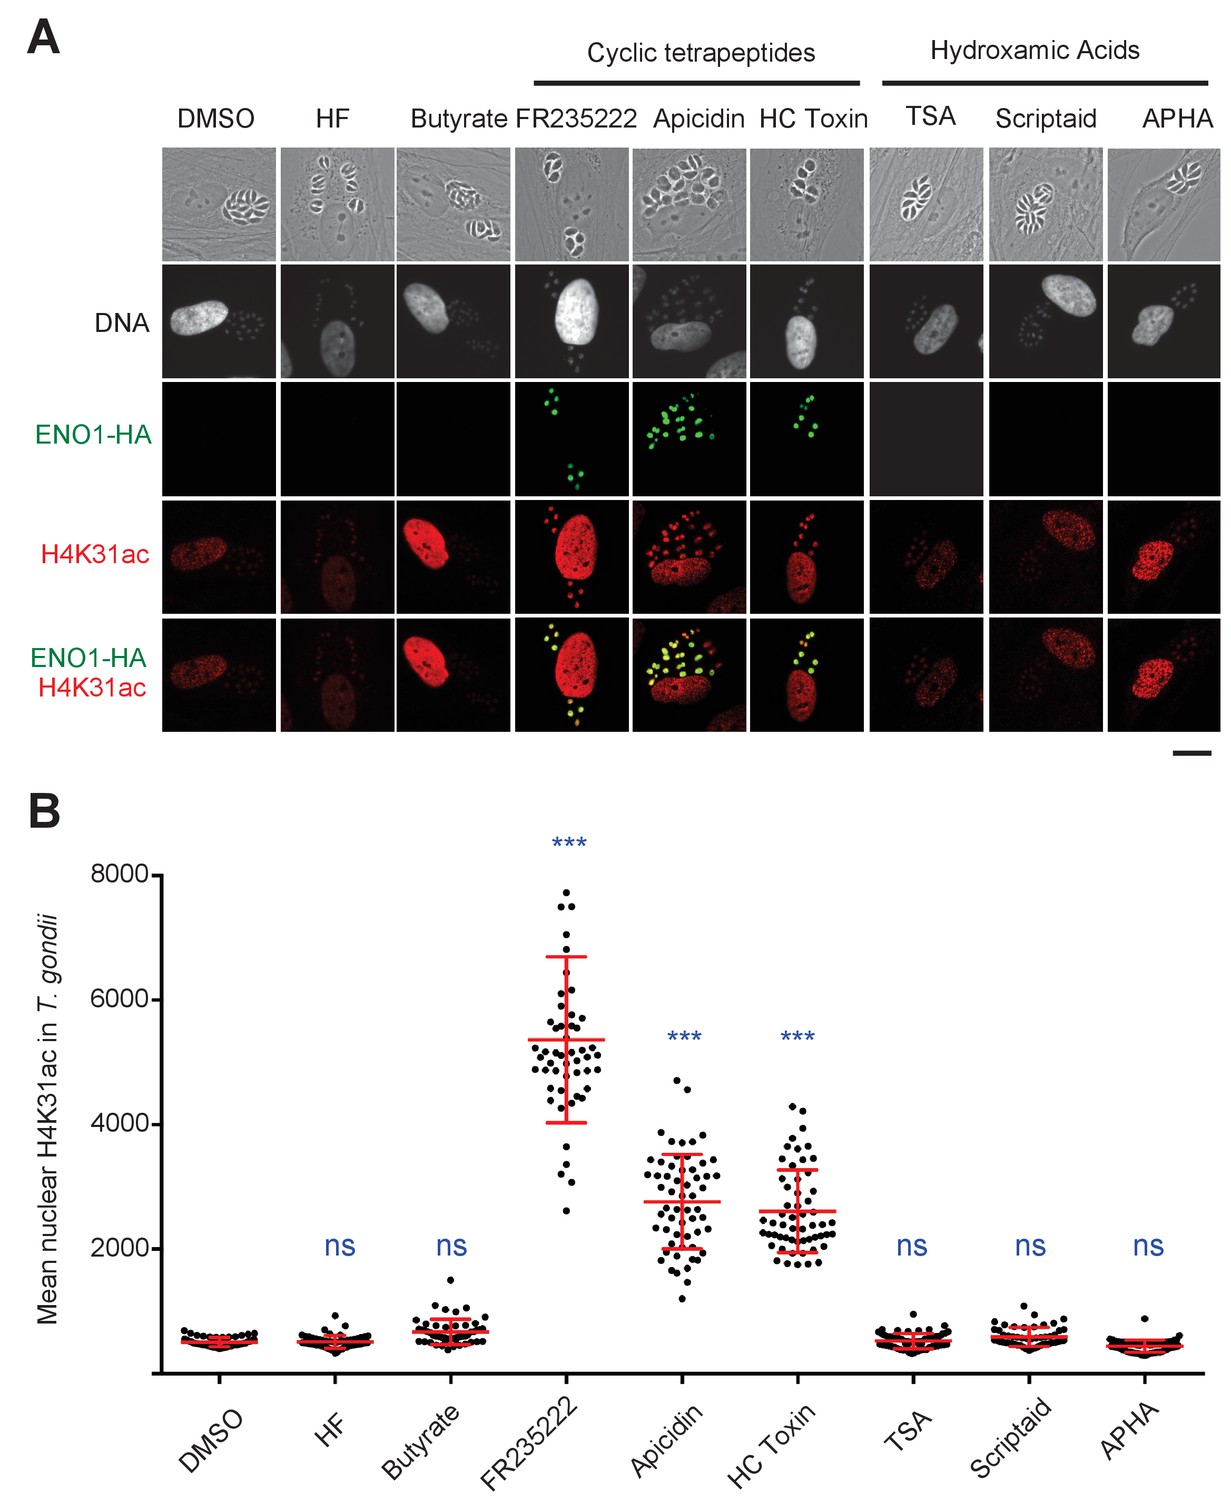
Chemical inactivation of TgHDAC3 promotes H4K31ac accumulation in T. gondii nuclei.
(a) Immunofluorescence analysis of H4K31ac (in red) in HFF cells infected with parasites expressing a HAFlag (HA)-tagged copy of the bradyzoite gene ENO1 treated for 18 hr with vehicle (DMSO) or individual HDAC inhibitors, including short-chain fatty acids (sodium butyrate), cyclic tetrapeptides and hydroxamic acids. Halofuginone (HF), a non-HDACi anticoccidial compound was used as a relevant control. ENO1 expression was detected by IFA in parasite nuclei (anti-HA, in green). Host-cell and parasite nuclei were stained with Hoechst. Scale bar, 20 μm. TSA, Trichostatin A; APHA, aroyl pyrrolyl hydroxamic acid. (b) Quantification of the intensity of H4K31ac staining in each parasite nucleus following HDAC inhibitors and vehicle (DMSO) stimulations. Each symbol marks the PTM density of a single parasite nucleus. The results are represented as mean ± s.d. from three independent experiments; the number of nuclei quantified was at least 50. Asterisks indicate statistical for H4K31ac significance between DMSO and each HDACi as determined by a two-way ANOVA with Bonferroni’s multiple comparison test, ***p<0.0001 ; n.s., not significant.
Figure 5
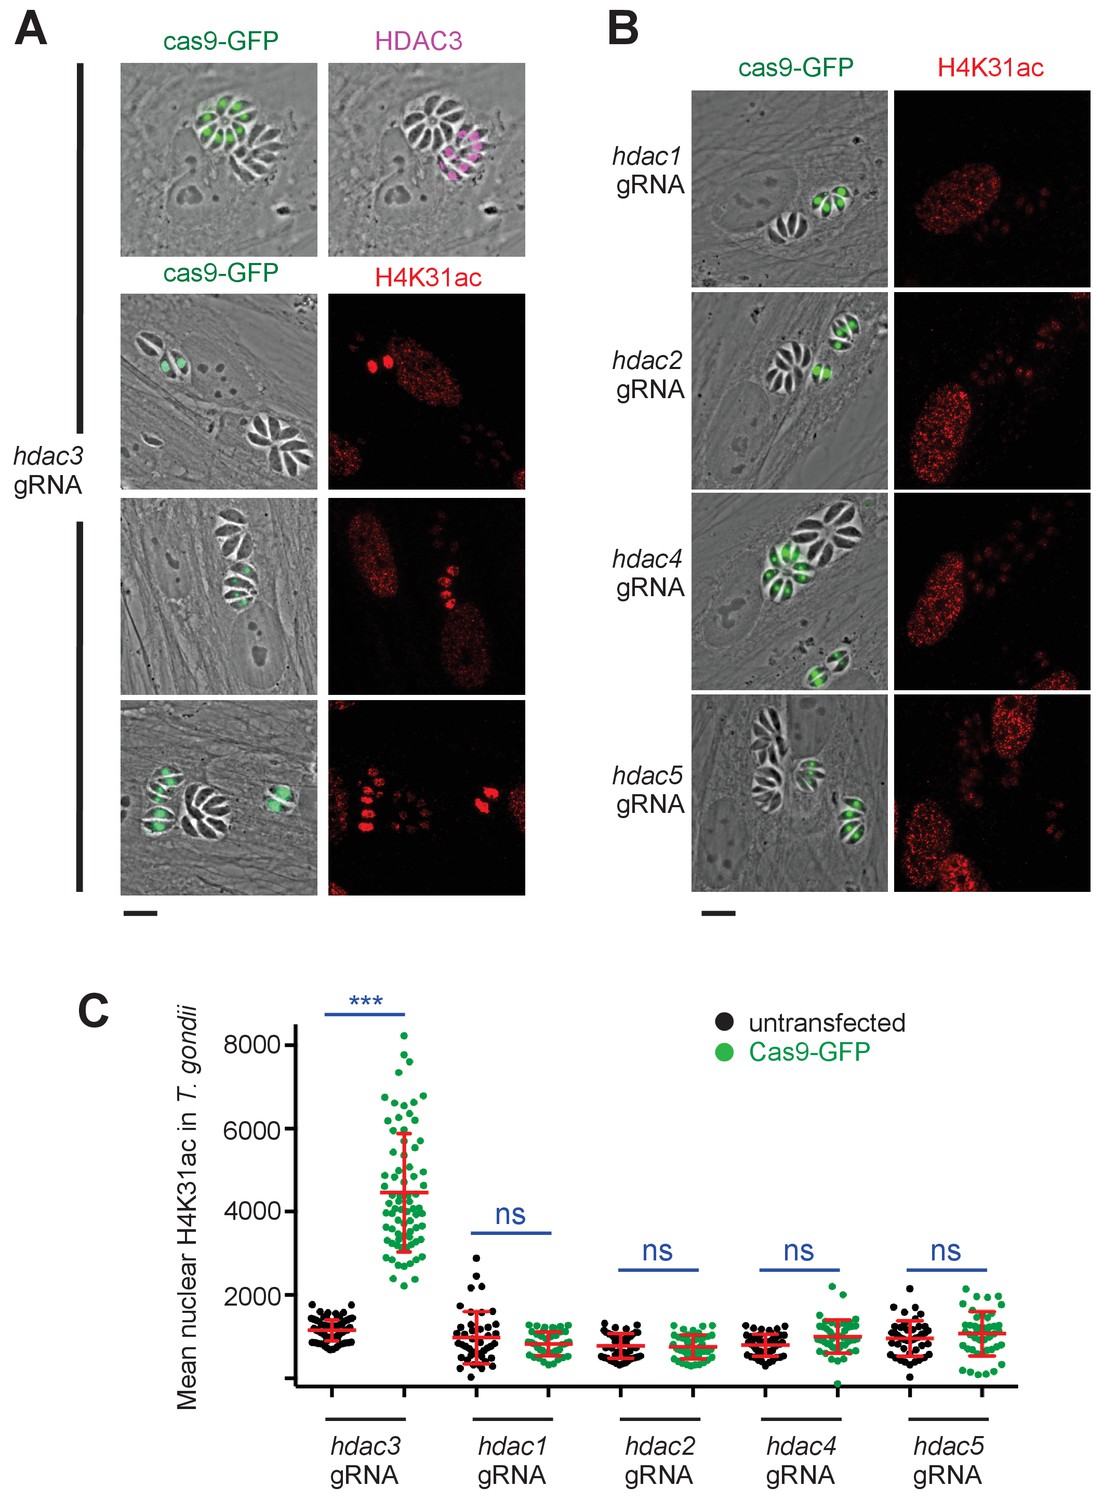
Genetic inactivation of TgHDAC3 promotes H4K31ac accumulation in T. gondii nuclei.
(a) Representative micrographs showing intracellular tachyzoites in which the TgHDAC3 gene was disrupted by transient transfection of CRISPR/Cas9. The efficiency of TgHDAC3 disruption in Cas9-expressing parasites was monitored by anti-TgHDAC3 staining (in pink) and cas9-GFP expression (in green). The levels of H4K31ac (in red) were monitored in TgHDAC3-disrupted parasites (green fluorescent protein [GFP]-positive) and compared to untransfected parasites (GFP-negative). Scale bar, 10 μm. (c) Levels of H4K31ac (in red) were monitored in TgHDAC-knockout parasites. Scale bar, 10 μm. Data are representative of four independent experiments. (b) Quantification of the intensity of the H4K31ac nuclear staining of T. gondii expressing gRNA directed against TgHDAC as indicated (GFP-positive cells) or left untransfected. Each symbol marks the H4K31ac density of a single parasite nucleus. The results are represented as mean ± s.d. from four independent experiments; the number of nuclei quantified was at least 60. Asterisks indicate statistical significance for H4K31ac difference between cas9-GFP-positive and untransfected parasites, as determined by an unpaired two-tailed Student's t-test, ***p<0.0001 ; n.s., not significant.
Figure 6

TgGCN5b acetylates H4K31 in T. gondii.
(a) Levels of H4K31ac (in red) were monitored in both host-cell and parasite nuclei following CRISPR/Cas9-mediated disruption of individual T. gondii HAT enzymes. Transfected vacuoles in which H4K31 acetylation was impaired are indicated by a white arrows. Scale bar, 10 μm. (b) Quantification of the intensity of the H4K31ac nuclear staining of T. gondii expressing the gRNAs directed against TgHAT (GFP-positive cells) or left untransfected. Each symbol marks the H4K31ac density of a single parasite nucleus. The results are represented as mean ± s.d. from three independent experiments; the number of nuclei quantified was at least 40. Asterisks indicate statistical significance of H4K31ac signal differences between cas9-GFP-positive and untransfected parasites as determined by an unpaired two-tailed Student's t-test, ***p<0.0001; n.s., not significant. (c) Levels of H3K14 acetylation (in red) were monitored in TgGCN5b-knockout parasites. Scale bar, 10 μm. (d) Quantification of the intensity of the H3K14ac nuclear staining of T. gondii expressing the gRNAs directed against gcn5b (GFP-positive cells) or left untransfected. Data are representative of three independent experiments. ***p<0.0001 (unpaired two-tailed Student's t-test).
Figure 7
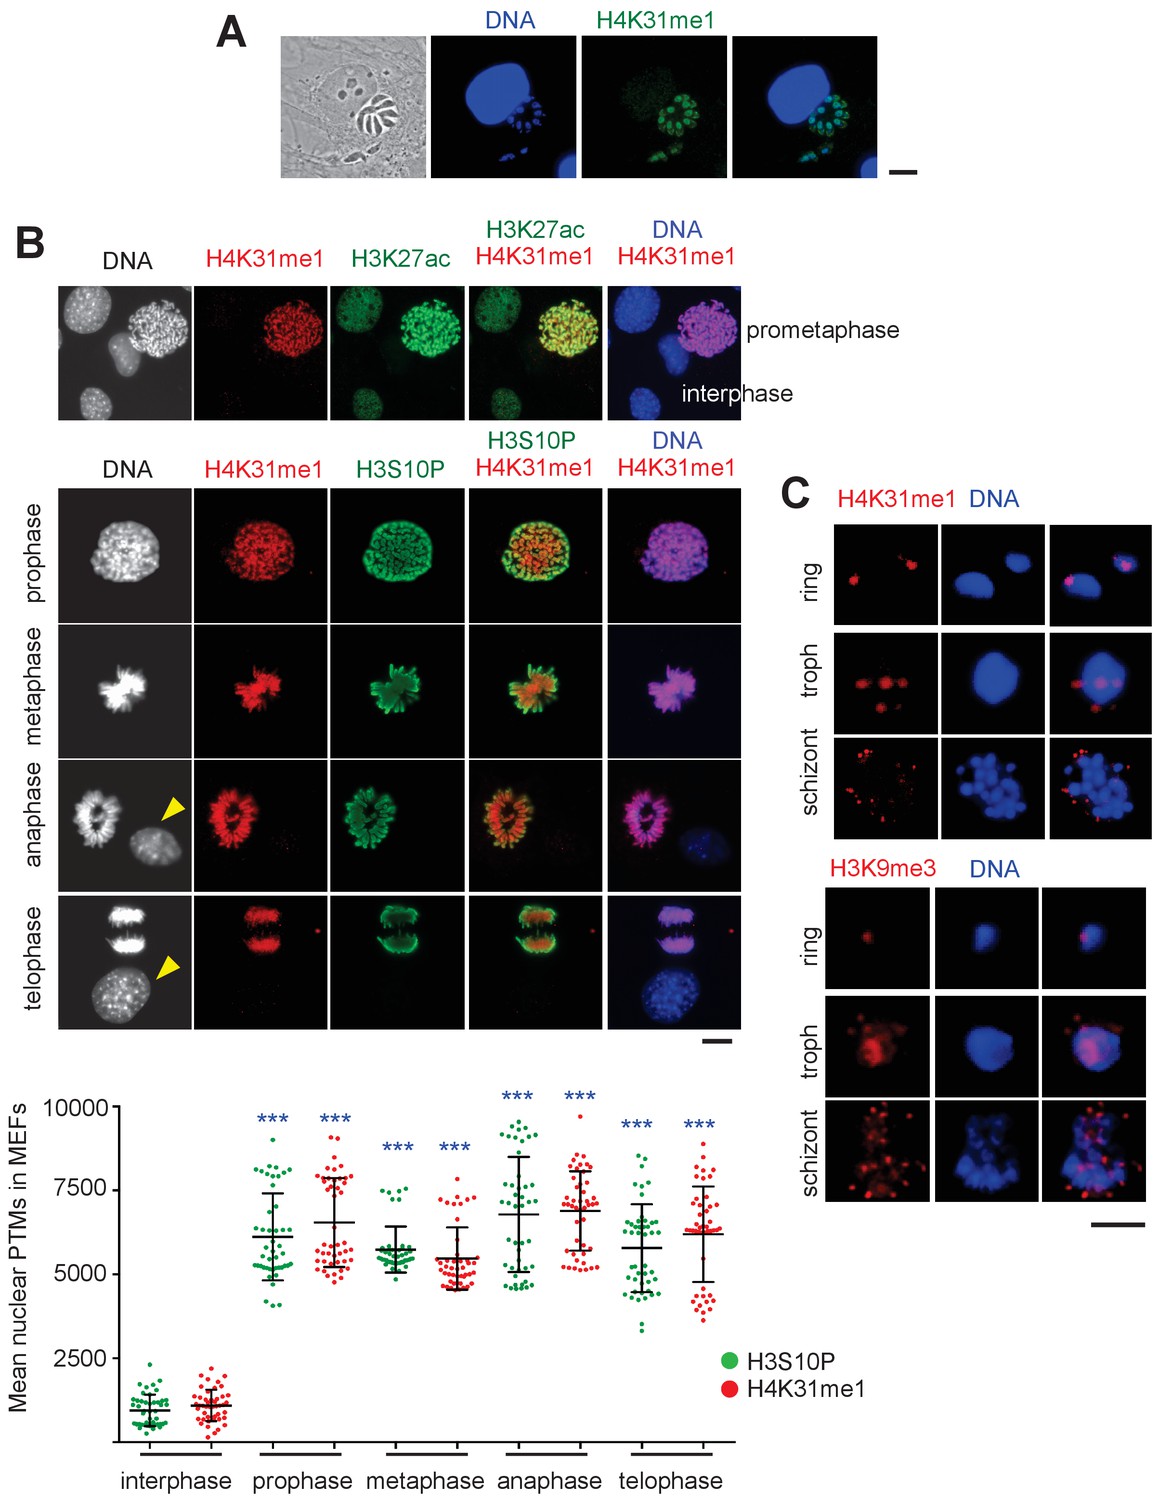
Distribution of H4K31me1 in host-cell and parasite nuclei.
(a) Immunofluorescence analysis of H4K31me1 (in green) in intracellular parasite nuclei. DNA was stained with Hoechst (blue). Scale bar, 10 μm. (b) The localization of H4K31me1 (in red), H3K27ac (in green) and H3S10P (in green) were tested by immunofluorescence in prophase, metaphase, anaphase and telophase MEFs. DNA was stained with Hoechst (blue). Scale bar, 10 μm. Quantification of H4K31me1 and H3S10P staining for each MEF analysed in its respective phase of the cell cycle. In total, 45 cells were scored for each phase. Each dot represents a single cell nucleus. The results are represented as mean ± s.d. from three independent experiments. Asterisks indicate statistical significance of the difference in H4K31me1 or H3S10P signal between interphase (background control) and each phase of the cell cycle as determined by a two-way ANOVA with Bonferroni’s multiple comparison test, ***p<0.0001; n.s., not significant. (c) Immunofluorescence analysis of H4K31me1 (in red) or H3K9me3 in asexual stages of Pf-3D7. Scale bar, 5 μm. Data are representative of three independent experiments.
Figure 8 with 3 supplements
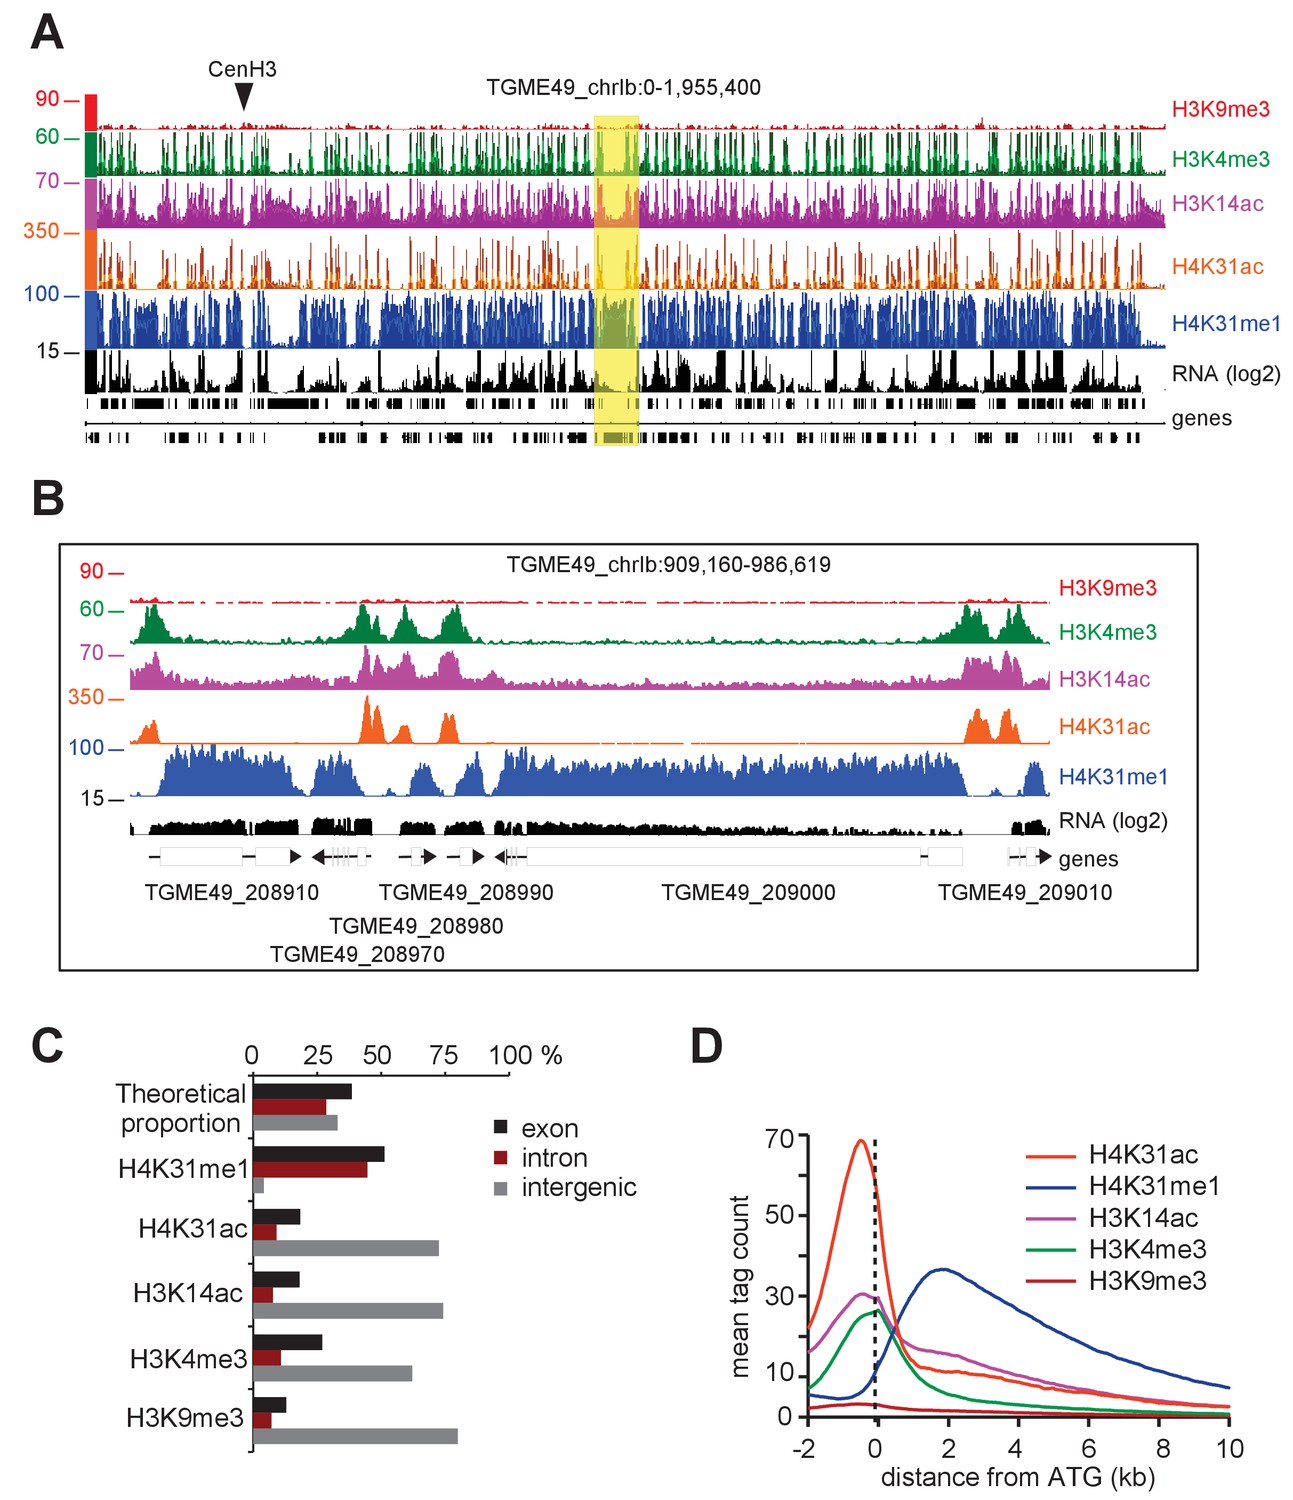
Genome-wide analysis of H4K31ac and H4K31me1 chromatin occupancy in T. gondii.
(a) A genome browser (IGB) snapshot showing normalized reads for different histone marks across T. gondii chromosome 1b reveals a peak-like distribution of H4K31ac and H4K31me1 ChIP-seq enrichments. The y-axis depicts read density. Genes are depicted above the profiles in black. (b) A zoomed-in view of a Chr. Ib region (yellow box in a) showing the distribution of the aforementioned PTMs. (c) Distribution of PTM-occupied regions relative to the T. gondii reference genome annotation. (d) Correlation of the enrichment of H4K31 modifications with that of other marks. The average signal profiles of each histone modification was plotted over a −2 kb to +10 kb region with respect to T. gondii genes' ATG. The y-axis shows the average tag count of the enrichment. The vertical dashed line indicates the position of the ATG.
Figure 8—figure supplement 1

ChIP-seq enrichments in biological replicates are highly correlated.
Scatterplot comparing the difference in H4K31ac (a) or H4K31me1 (b) enrichment measured in the two independent replicate experiments. The x- and y-axes show the average tag count of the enrichment. IGB screenshot of T. gondii Chr. X (c) and Ia (d) genomic regions showing reads for H4K31ac (replicates R1 and R2) and H4K31me1 (replicates R1 and R2).
Figure 8—figure supplement 2
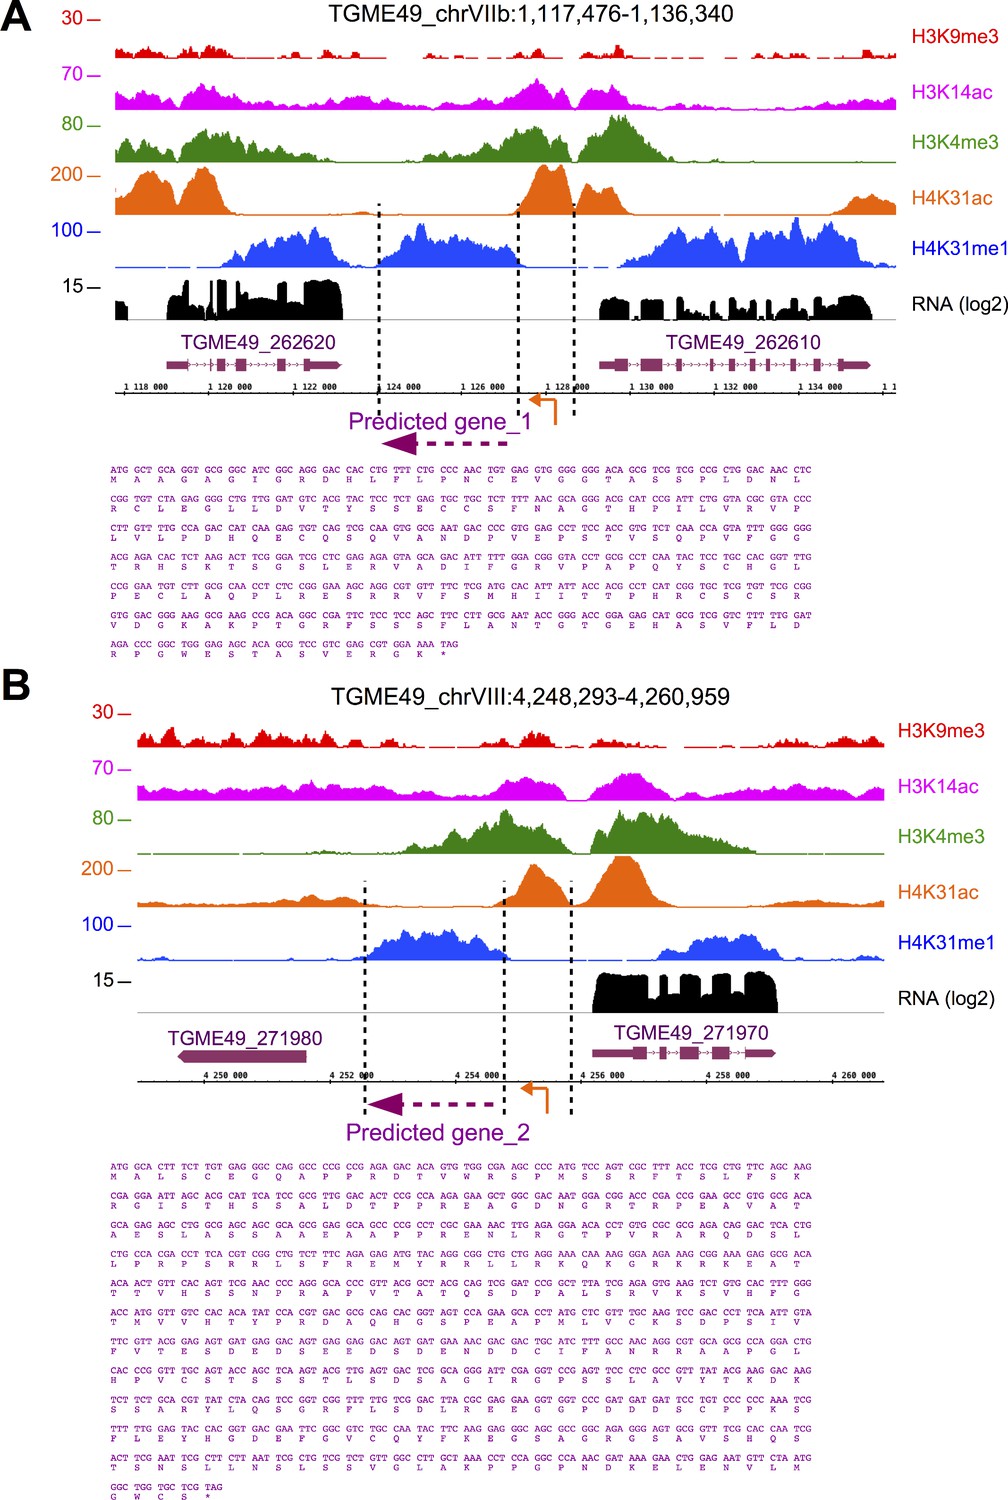
H4K31me1 explicitly predicts unannotated genes.
IGB screenshot of T. gondii Chr. VIIb (a) and VIII (b) genomic regions showing reads for various histone marks as well as RNA-seq data (in black). Predicted genes are indicated in magenta along with their putative translated sequence.
Figure 8—figure supplement 3
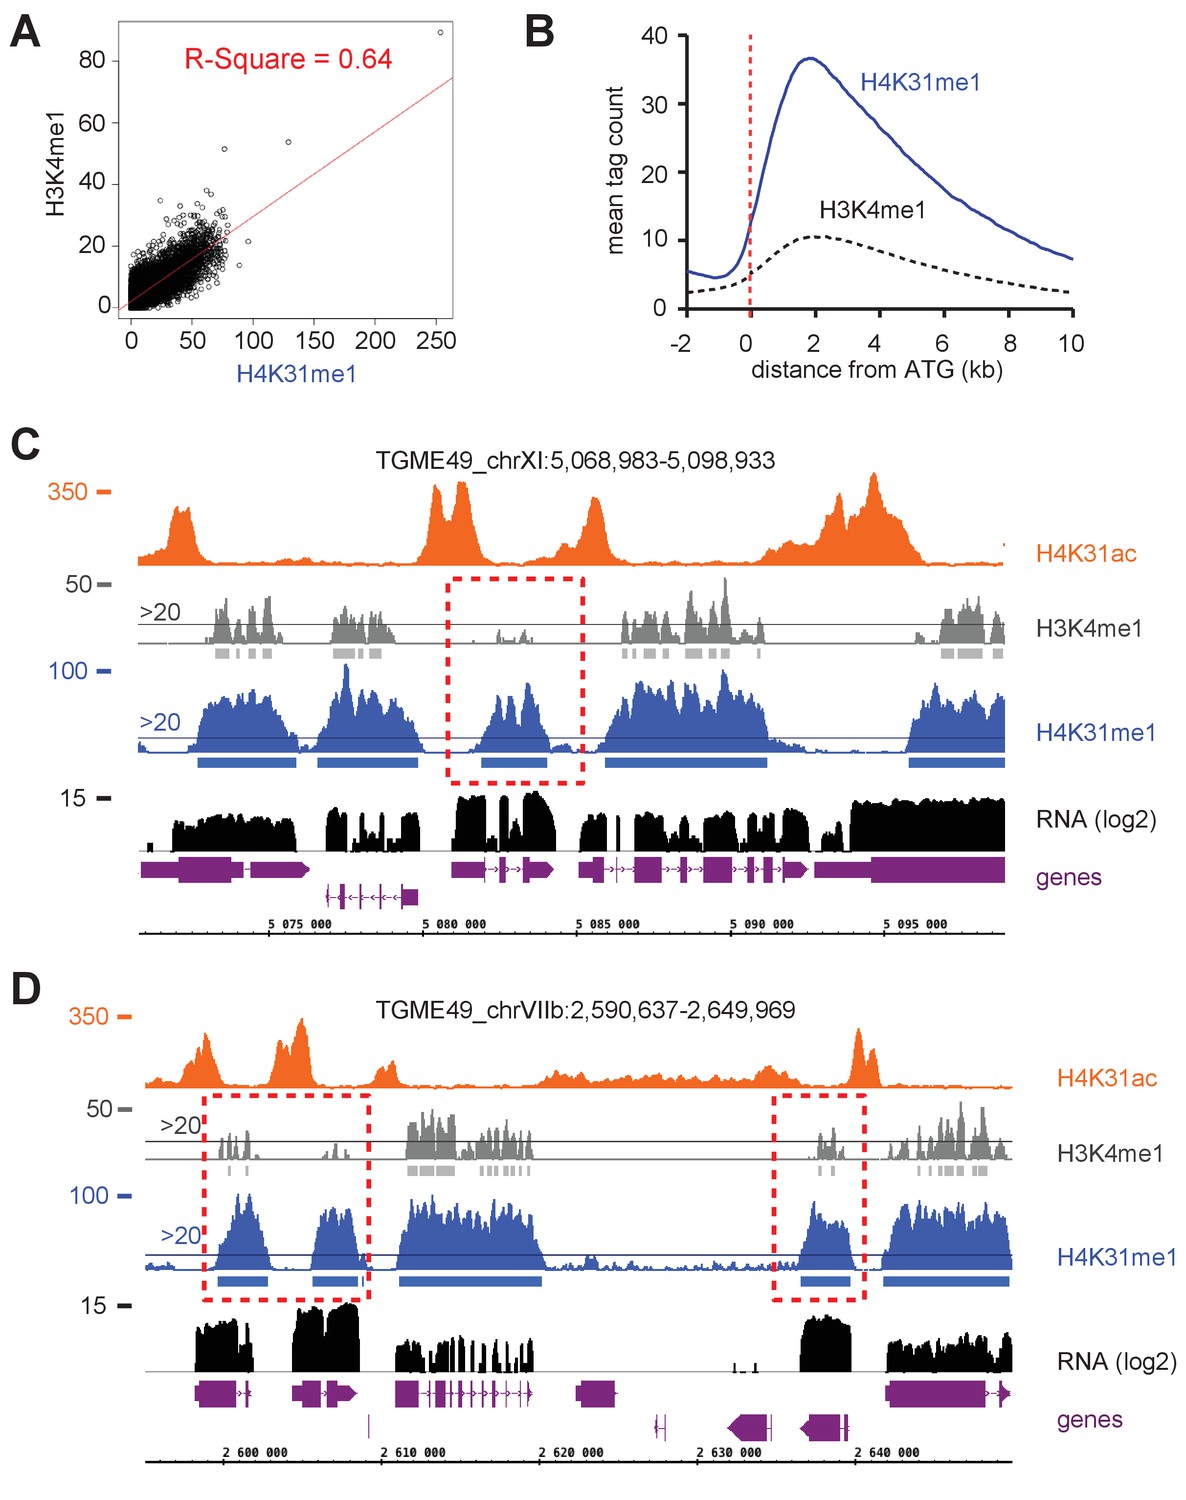
H4K31me1 and H3K4me1 are both enriched in gene bodies in T. gondii.
(a) Scatterplot comparing the enrichment difference of H4K31me1 and H3K4me1. The x- and y-axes show the average tag count of the enrichment. (b) Genome-wide correlation of H4K31me1and H3K4me1 enrichment at peri-ATG regions. The average signal profiles of each histone modification were plotted over a −2 kb to +10 kb region with respect to T. gondii genes' ATG. The y-axis shows the average tag count of the enrichment. The vertical dashed line indicates the position of the ATG. (c, d) IGB screenshot of T. gondii Chr. XI (c) and VIIb (d) genomic regions showing reads for various histone marks as well as RNA-seq data (in black). Predicted genes are indicated in magenta along with their putative translated sequence.
Figure 9 with 1 supplement
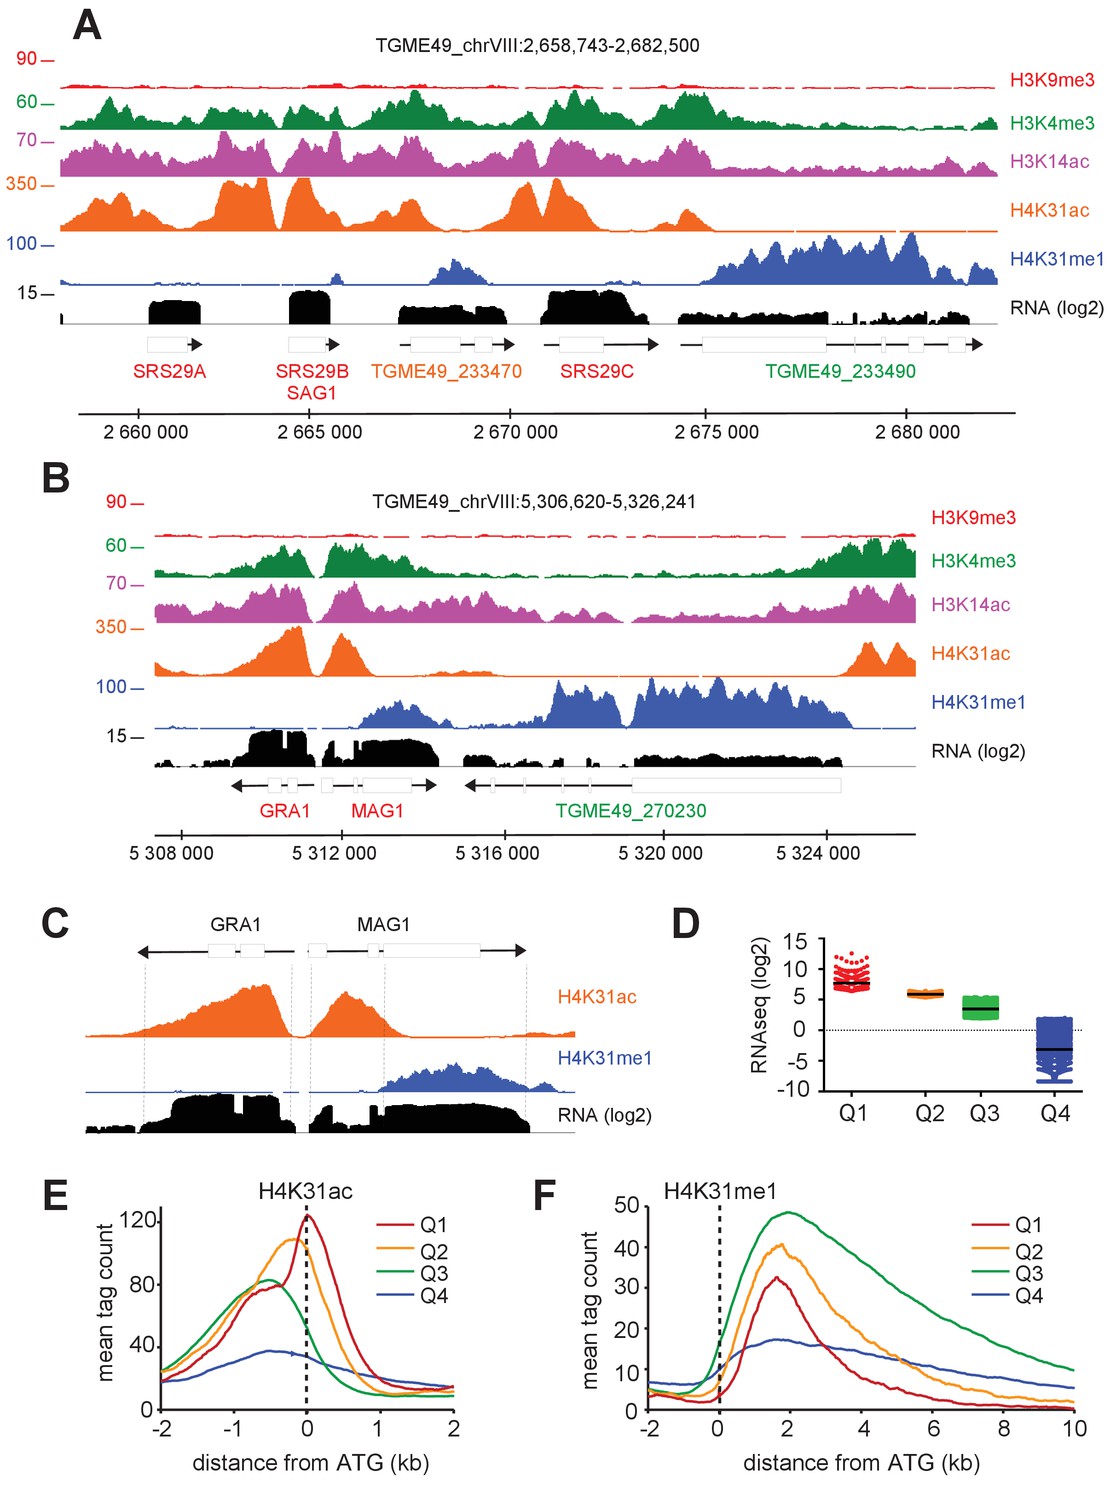
The enrichment of H4K31ac and H4K31me1 at transcribed genes correlates with gene expression levels in T. gondii.
(a, b) IGB screenshots of T. gondii Chr. VIII genomic regions showing reads for various histone marks as well as RNA-seq data (in black). (c) A zoomed-in view of the T. gondii GRA1-MAG1 locus. The y-axis depicts read density. (d) Boxplot showing the normalized expression distribution of T. gondii genes in the tachyzoite stage subdivided into four ranges of expression (clusters Q1 to Q4). Genome-wide H4K31ac (e) and H4K31me1 (f) occupancy profiles at peri-ATG regions are plotted for the gene groups ranked by their mRNA levels. The y-axis shows the average tag count of the enrichment. The vertical dashed line indicates the position of the ATG.
-
Figure 9—source data 1
Table corresponding to Figure 9D containing the normalized expression distribution of T. gondii genes in the tachyzoite stage subdivided into four ranges of expression (clusters Q1 to Q4).
- https://doi.org/10.7554/eLife.29391.019
Figure 9—figure supplement 1
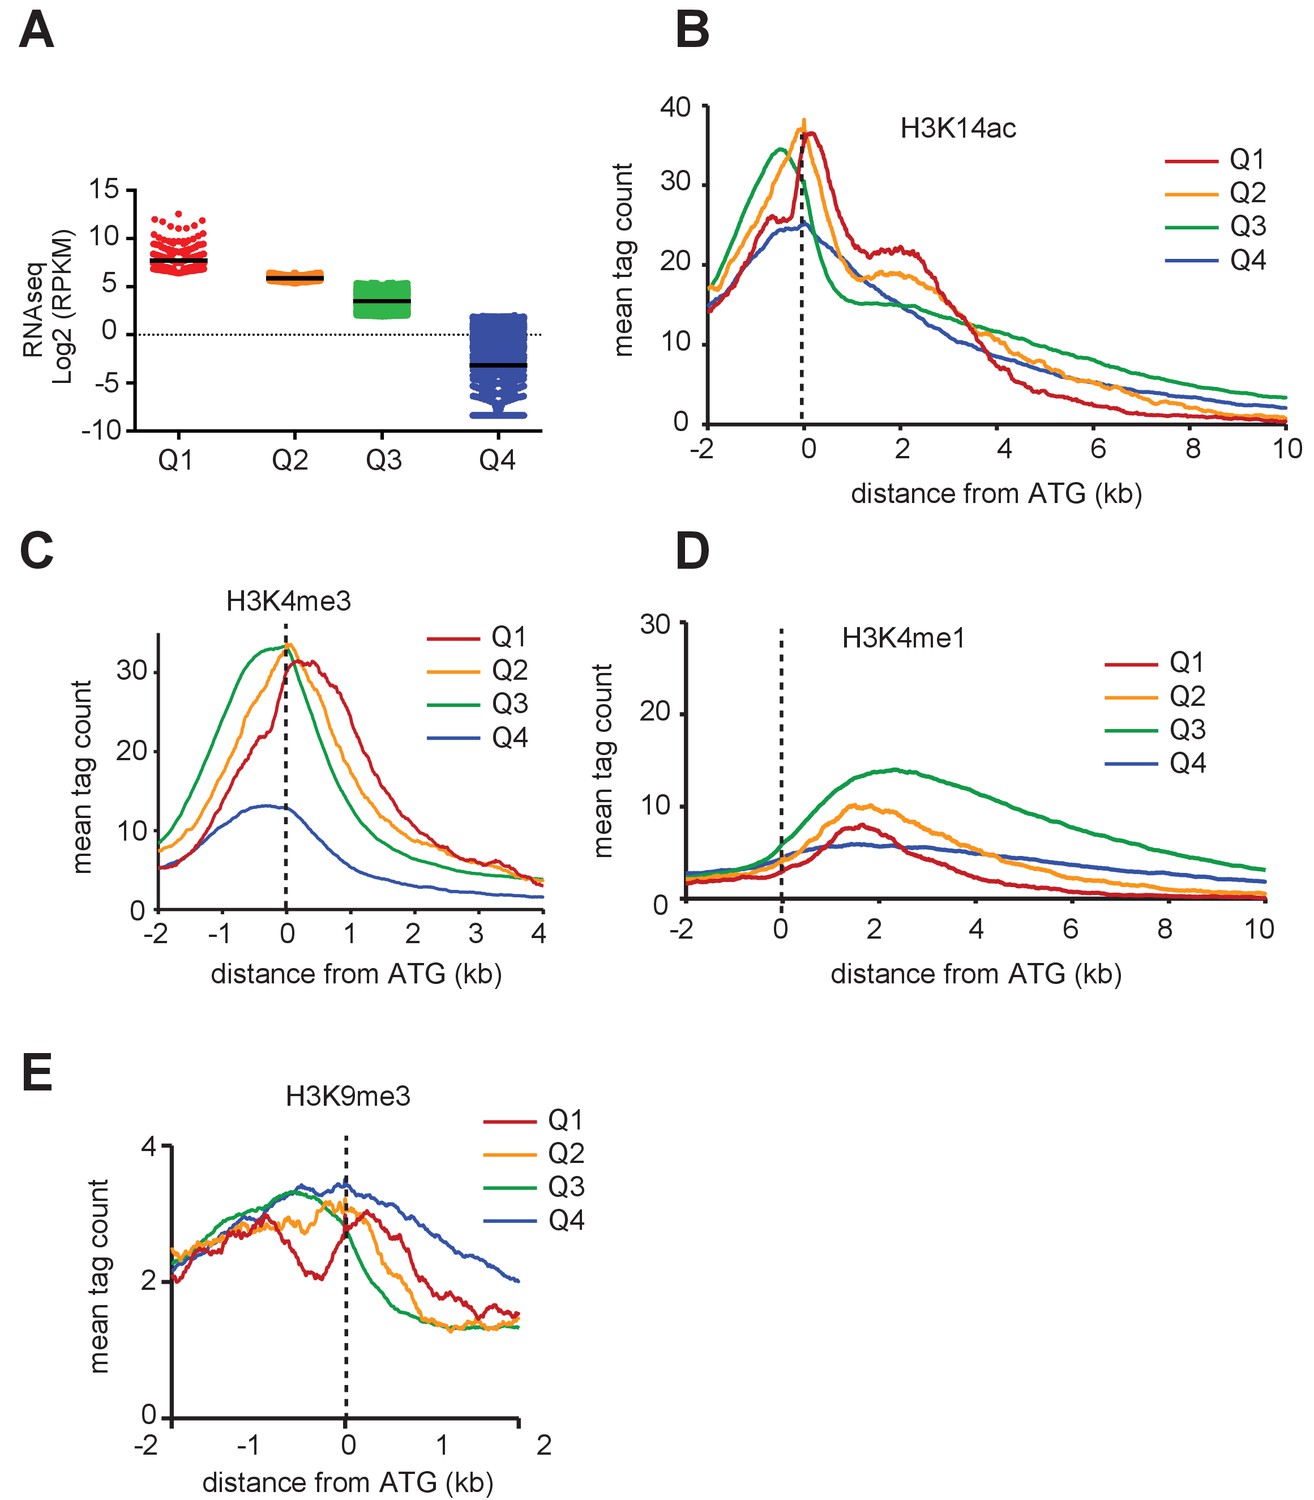
PTM distribution and gene expression in T. gondii.
Genome-wide PTM occupancy profiles at peri-ATG regions are plotted for the gene groups ranked by (a) their mRNA levels, (b) H3K14ac, (c) H3K4me3, (d) H3K4me1, and (e) H3K9me3 are shown. The y-axis shows the average tag count of the enrichment. The vertical dashed line indicates the position of the ATG.
Figure 10 with 5 supplements
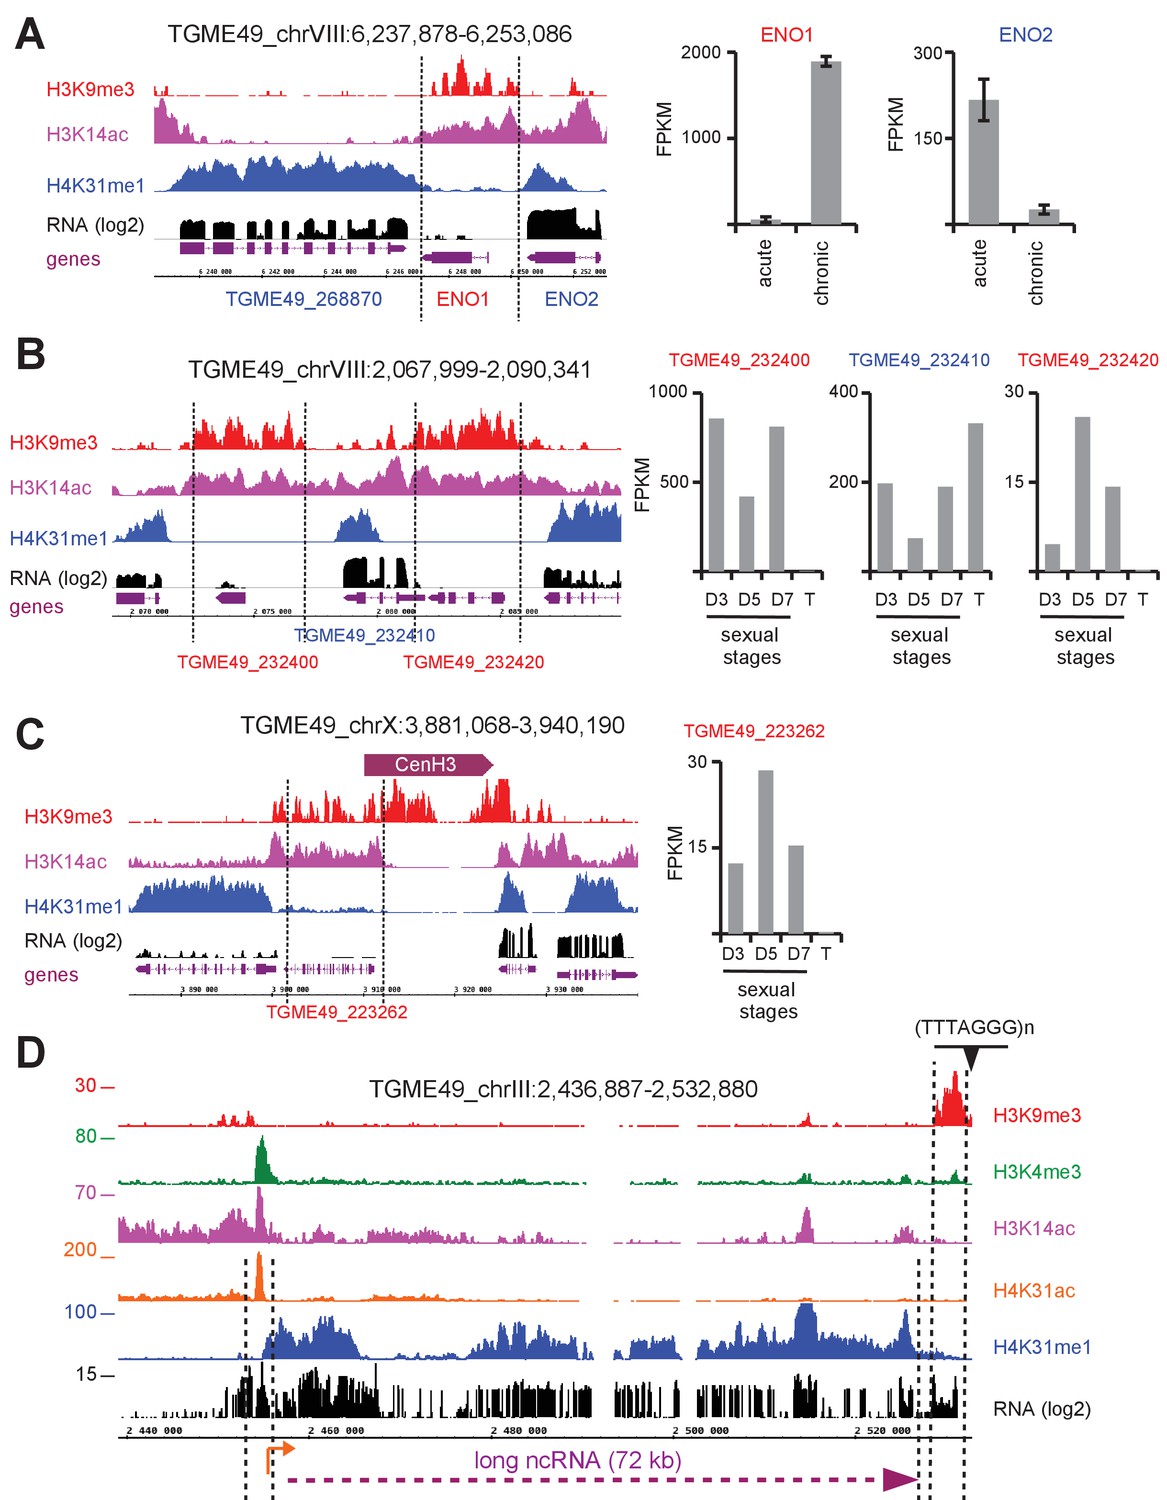
H4K31me1 marks long non-coding RNA but not pericentromeric heterochromatin in T. gondii.
(a) Left panel : IGB screenshot of T. gondii ENO1 and ENO2 loci on Chr. VIII , showing reads for various histone marks as well as RNA-seq data (in black) and predicted genes (in magenta). The y-axis depicts read density. Right panel: bar graphs showing the expression (fragments per kilobase of transcript per million mapped reads [FPKM] values) of ENO1 and ENO2 genes during acute (tachyzoite) or chronic (bradyzoite) infection in mice (data source: ToxoDB [Pittman et al., 2014]). (b) Left panel: IGB screenshot of two sexual stages genes (in red) surrounding a house-keeping gene (in blue). Right panel: bar graphs showing expression (FPKM values) of the genes in cultured tachyzoites (T) and parasites harvested from cat at day 3 (D3; merozoites), day 5 (D5; merozoites and sexual stages) and day 7 (D7; sexual stages and oocysts) (data source : ToxoDB [Hehl et al., 2015]). (c) A zoomed-in view of the T. gondii Chr. X peri-centromeric region and neighboring genes including TGME49_223262, whose expression is restricted to sexual stages as seen in the bar graph. (d) IGB screenshot of the T. gondii Chr. III genomic region showing reads for various histone marks as well as RNA-seq data. A predicted lncRNA of 72 kb is indicated in magenta.
Figure 10—figure supplement 1
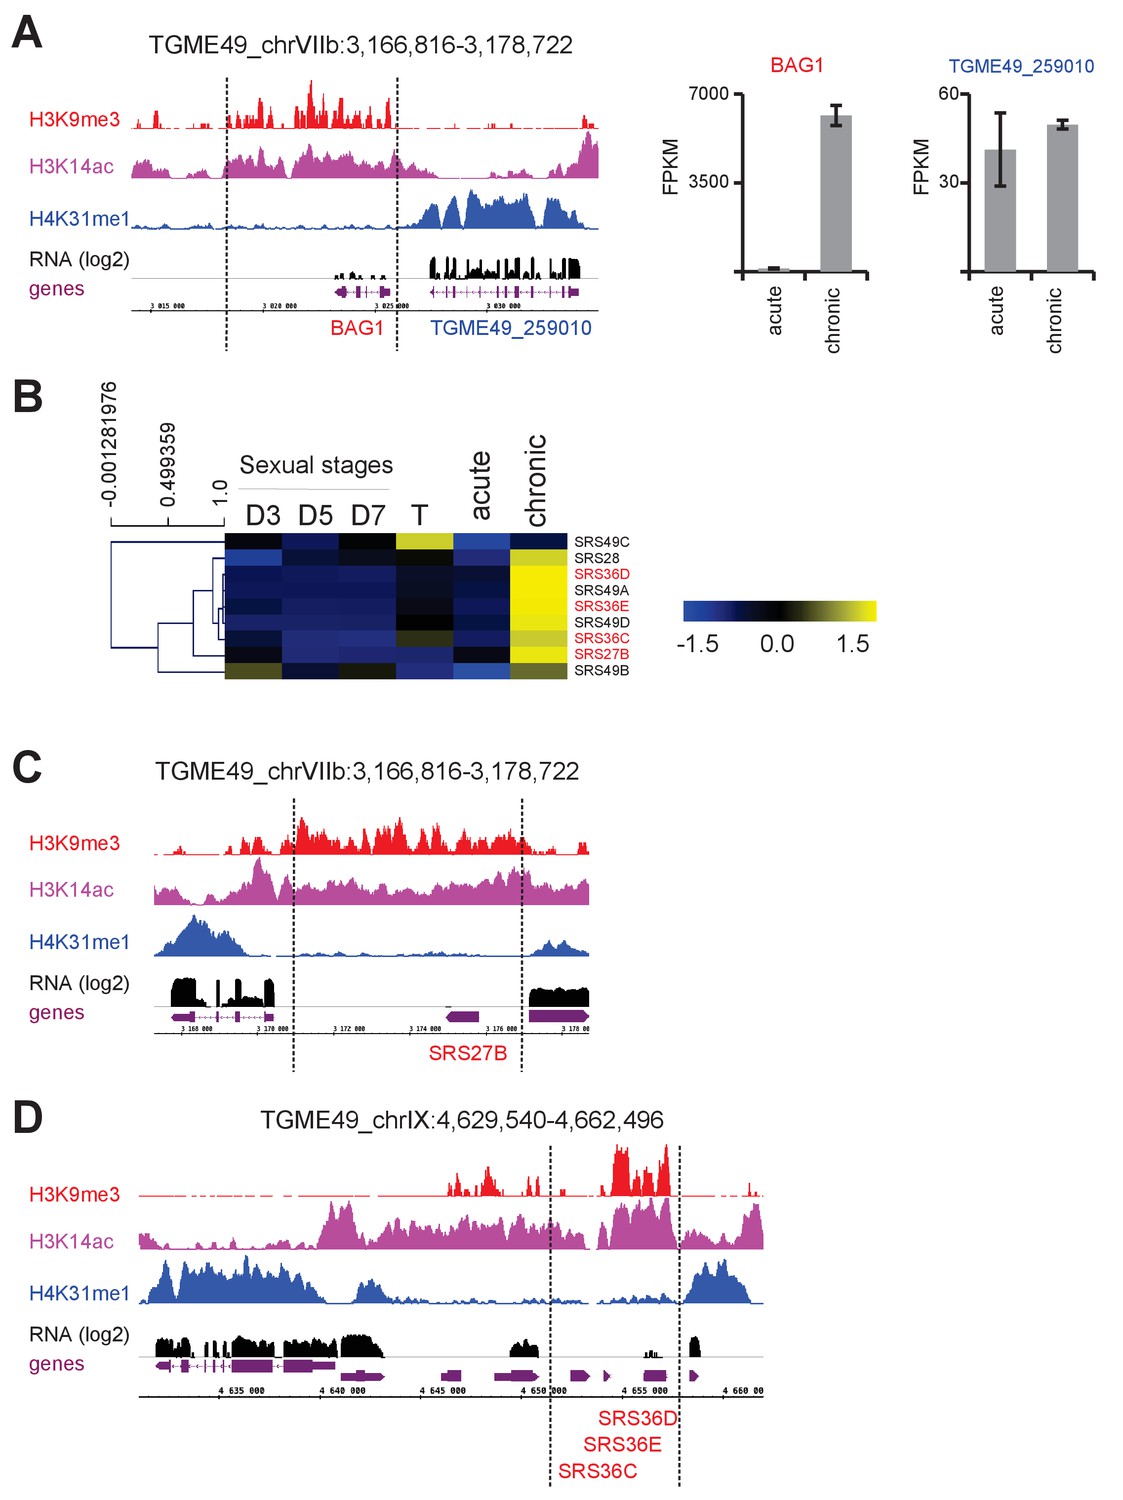
(a) IGB screenshot of the T. gondii BAG1 locus on Chr. VIIb showing reads for various histone marks as well as RNA-seq data (in black) and predicted genes (in magenta). The y-axis depicts read density. Right panel: bar graphs showing the expression (FPKM values) of genes during acute and chronic infection in mice. (b) Heatmap representation of chronic-stage bradyzoite expression of SRS genes in different life-cycle stages. Gene expression values were mean log2 transformed and median centered for clustering. Transcriptomic data from cultured tachyzoite (T) and sexual stages isolated from mice at day 3 (D3; merozoites), 5 (D5; merozoites and sexual stages) and 7 (D7; sexual stages and oocysts) post-infection (Hehl et al., 2015), as well as those from acute and chronic murine toxoplasmosis (Pittman et al., 2014), are available on ToxoDB. (c, d) IGB screenshots of selected bradyzoite SRS genes showing reads for various histone marks as well as RNA-seq data (in black) and predicted genes (in magenta). The y-axis depicts read density.
Figure 10—figure supplement 2

(a) Heatmap representation of T. gondii genes that are specifically expressed in sexual stages as described above. (b–d) IGB screenshots of selected T. gondii genes whose expression is restricted to sexual stages. Reads are shown for various histone marks as well as RNA-seq data (in black) and predicted genes (in magenta). The y-axis depicts read density.
Figure 10—figure supplement 3
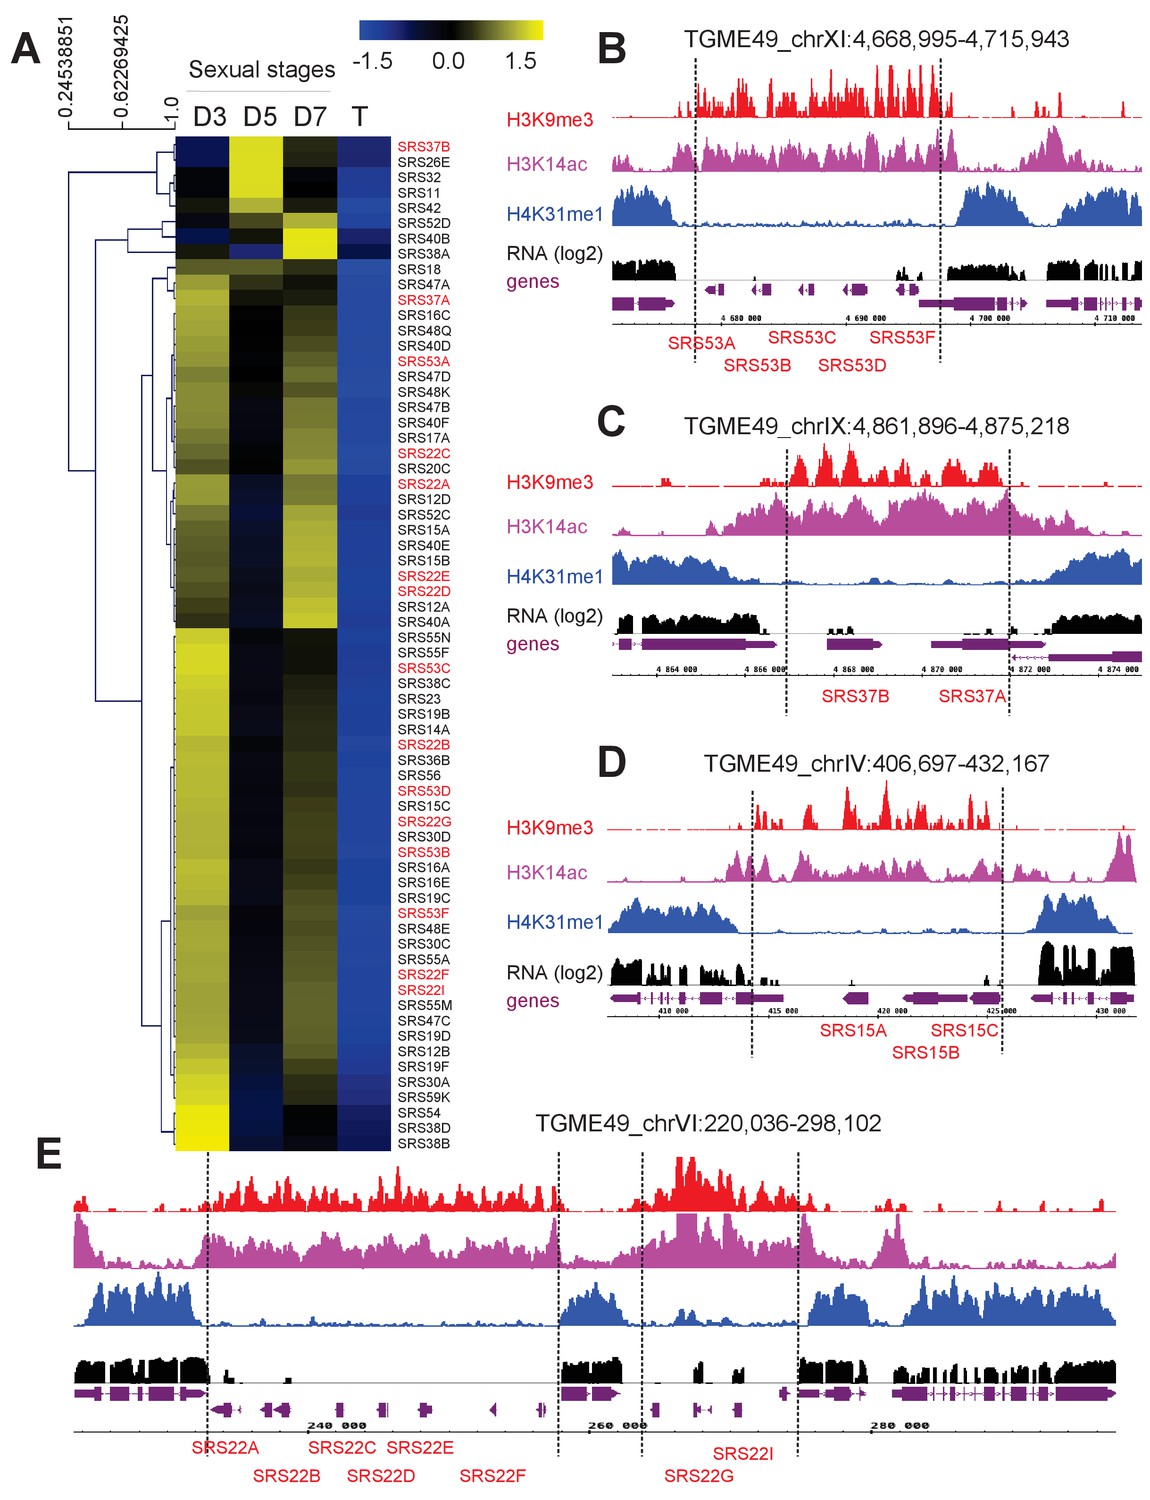
(a) Heatmap representation of T. gondii SRS genes that are specifically expressed in sexual stages as described above. (b–e) IGB screenshots of SRS genes whose expression is restricted to sexual stages. Readsfor various histone marks as well as RNA-seq data (in black) and predicted genes (in magenta) are shown. The y-axis depicts read density.
Figure 10—figure supplement 4
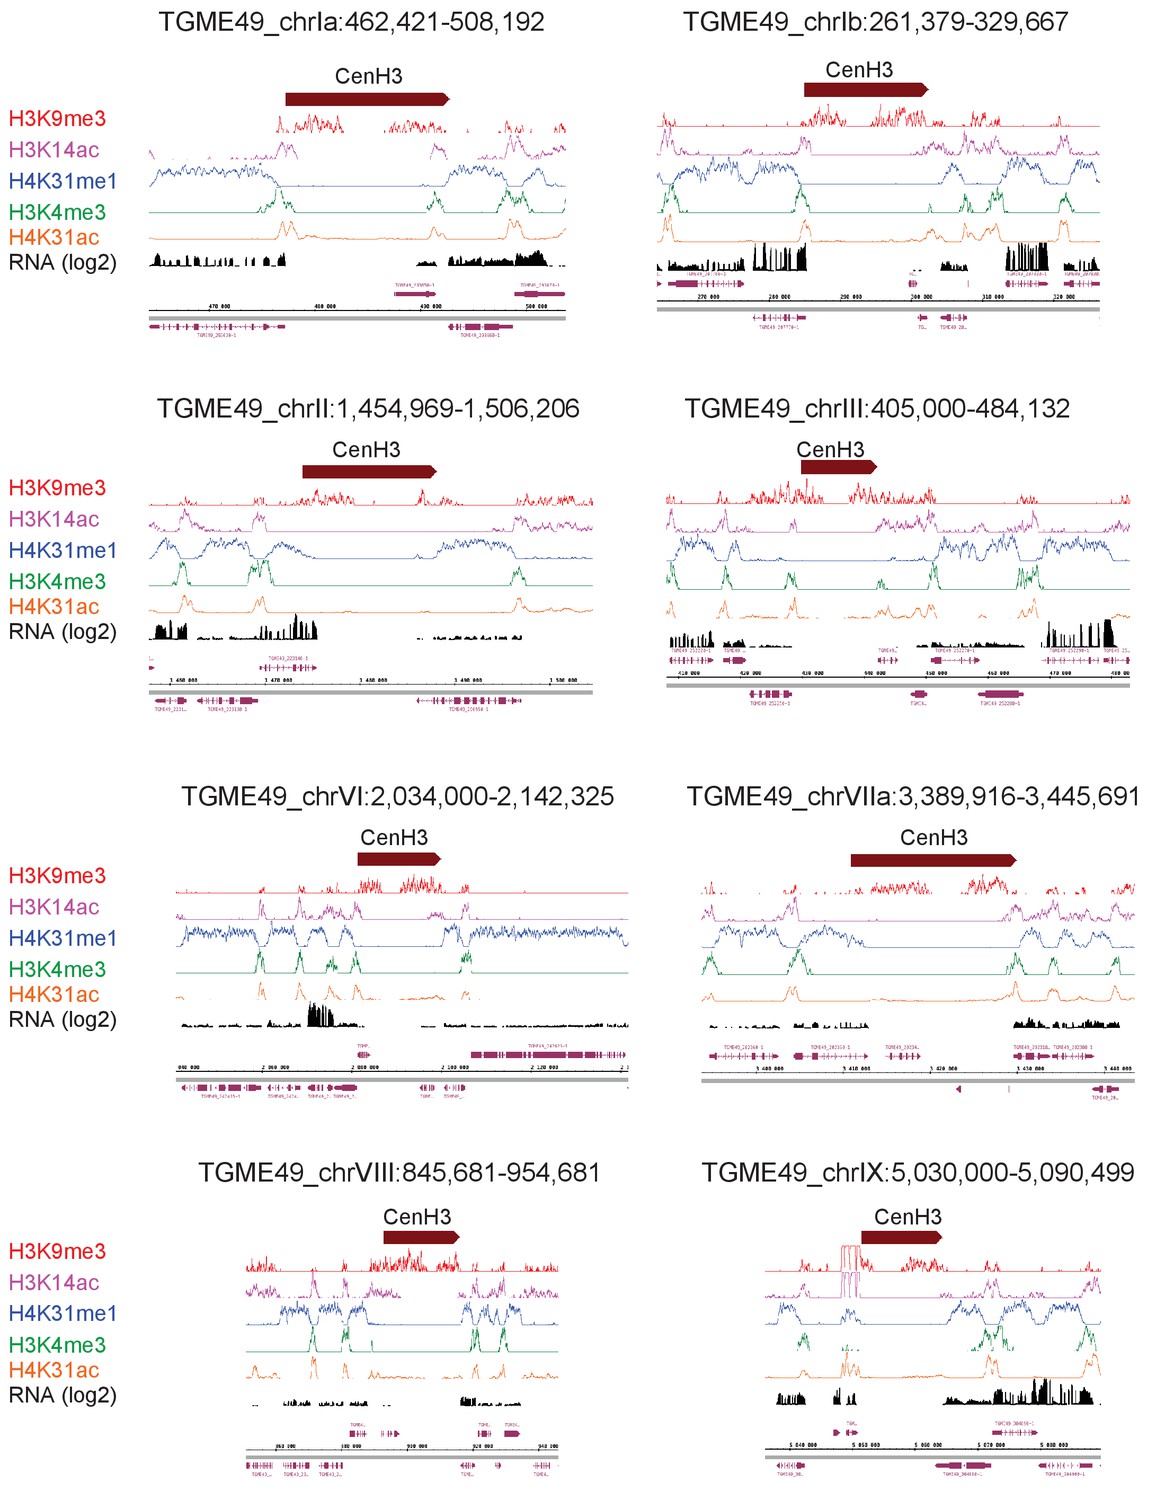
T. gondii peri-centromeric regions.
(a) IGB screenshots of T. gondii peri-centromeric region of chromosomes Ia, II, III, VI, VIIa, VIII, IX and X.
Figure 10—figure supplement 5
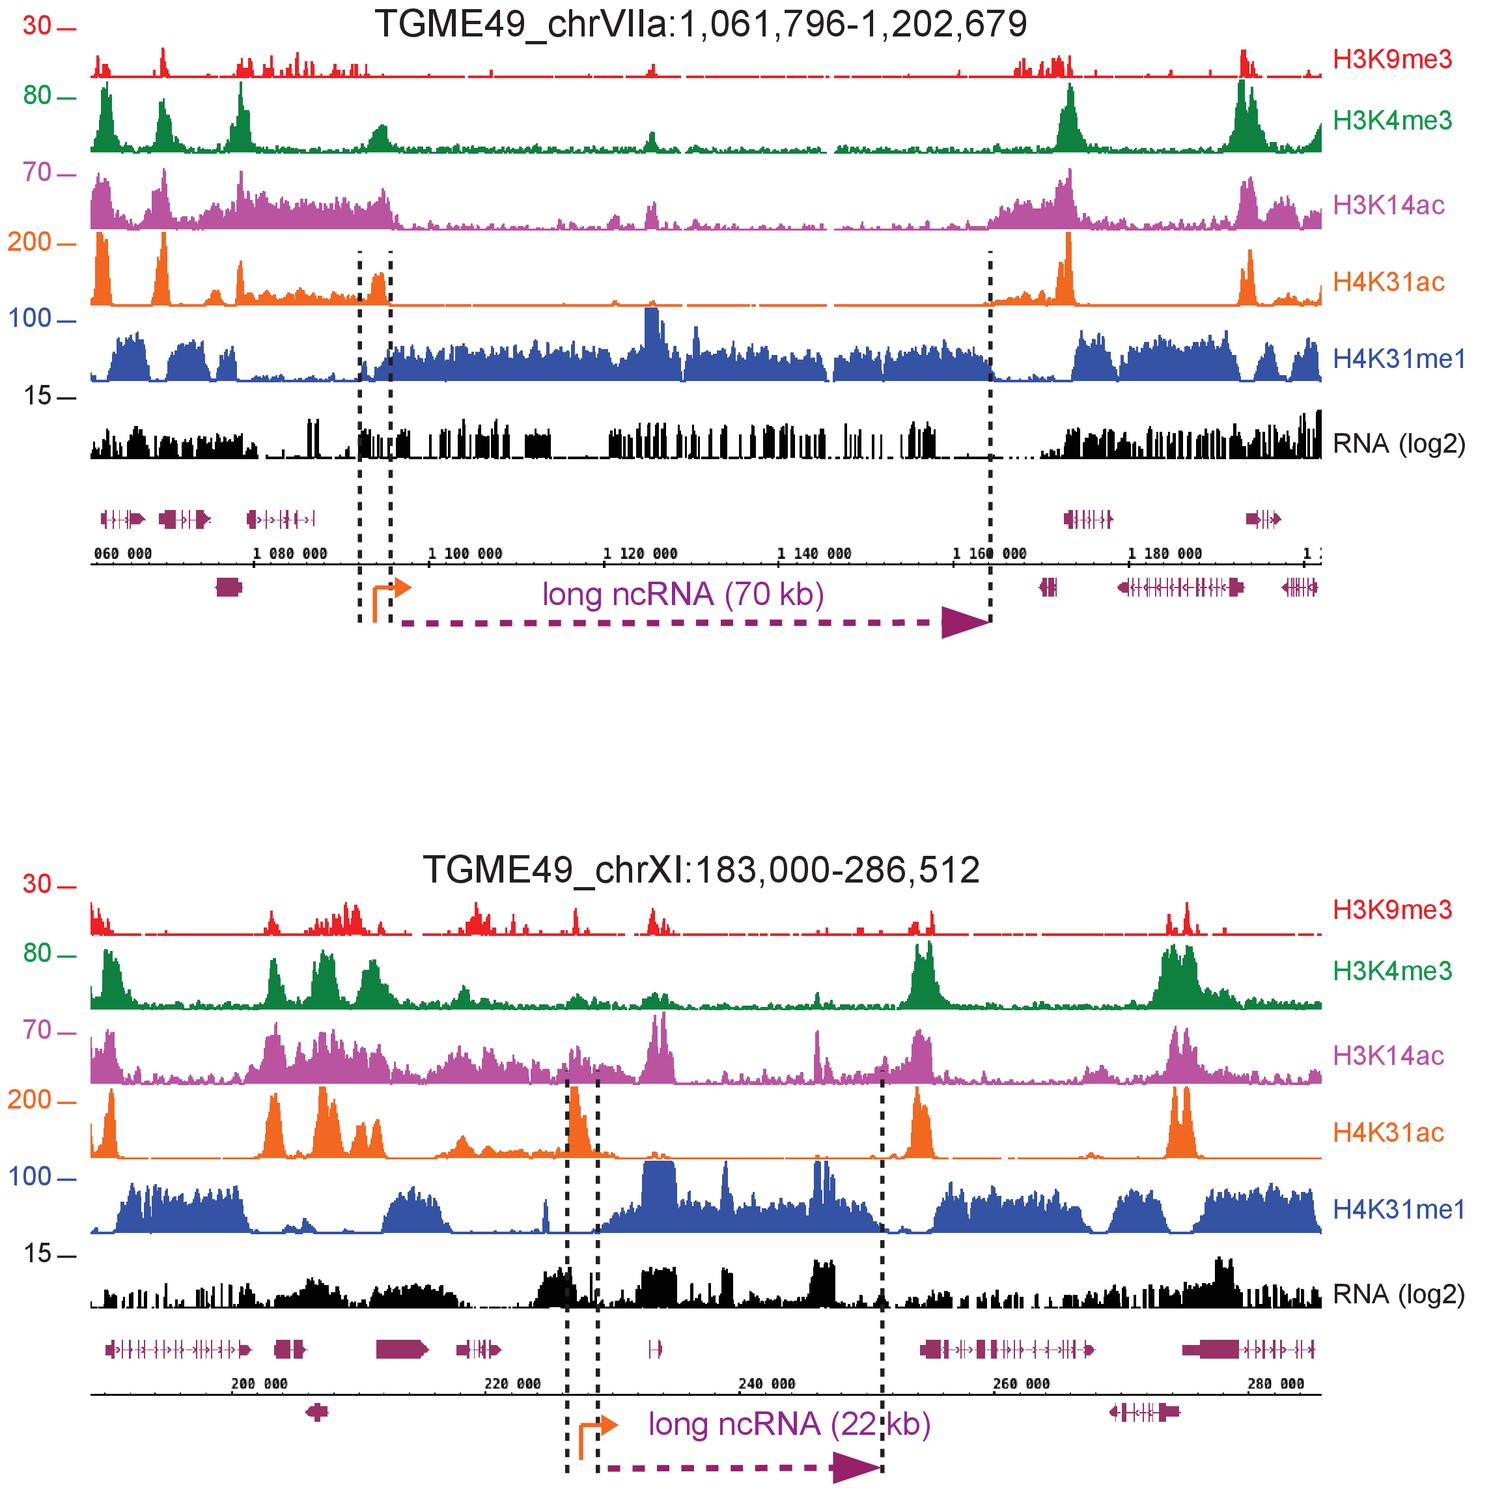
H4K31me1 marks long non-coding RNAs.
IGB screenshot of T. gondii (a) Chr. VIIa and (b) XI genomic regions showing reads for various histone marks as well as RNA-seq data. Predicted lncRNAs of (a) 70 kb and (b) 22 kb are indicated in magenta.
Figure 11 with 3 supplements
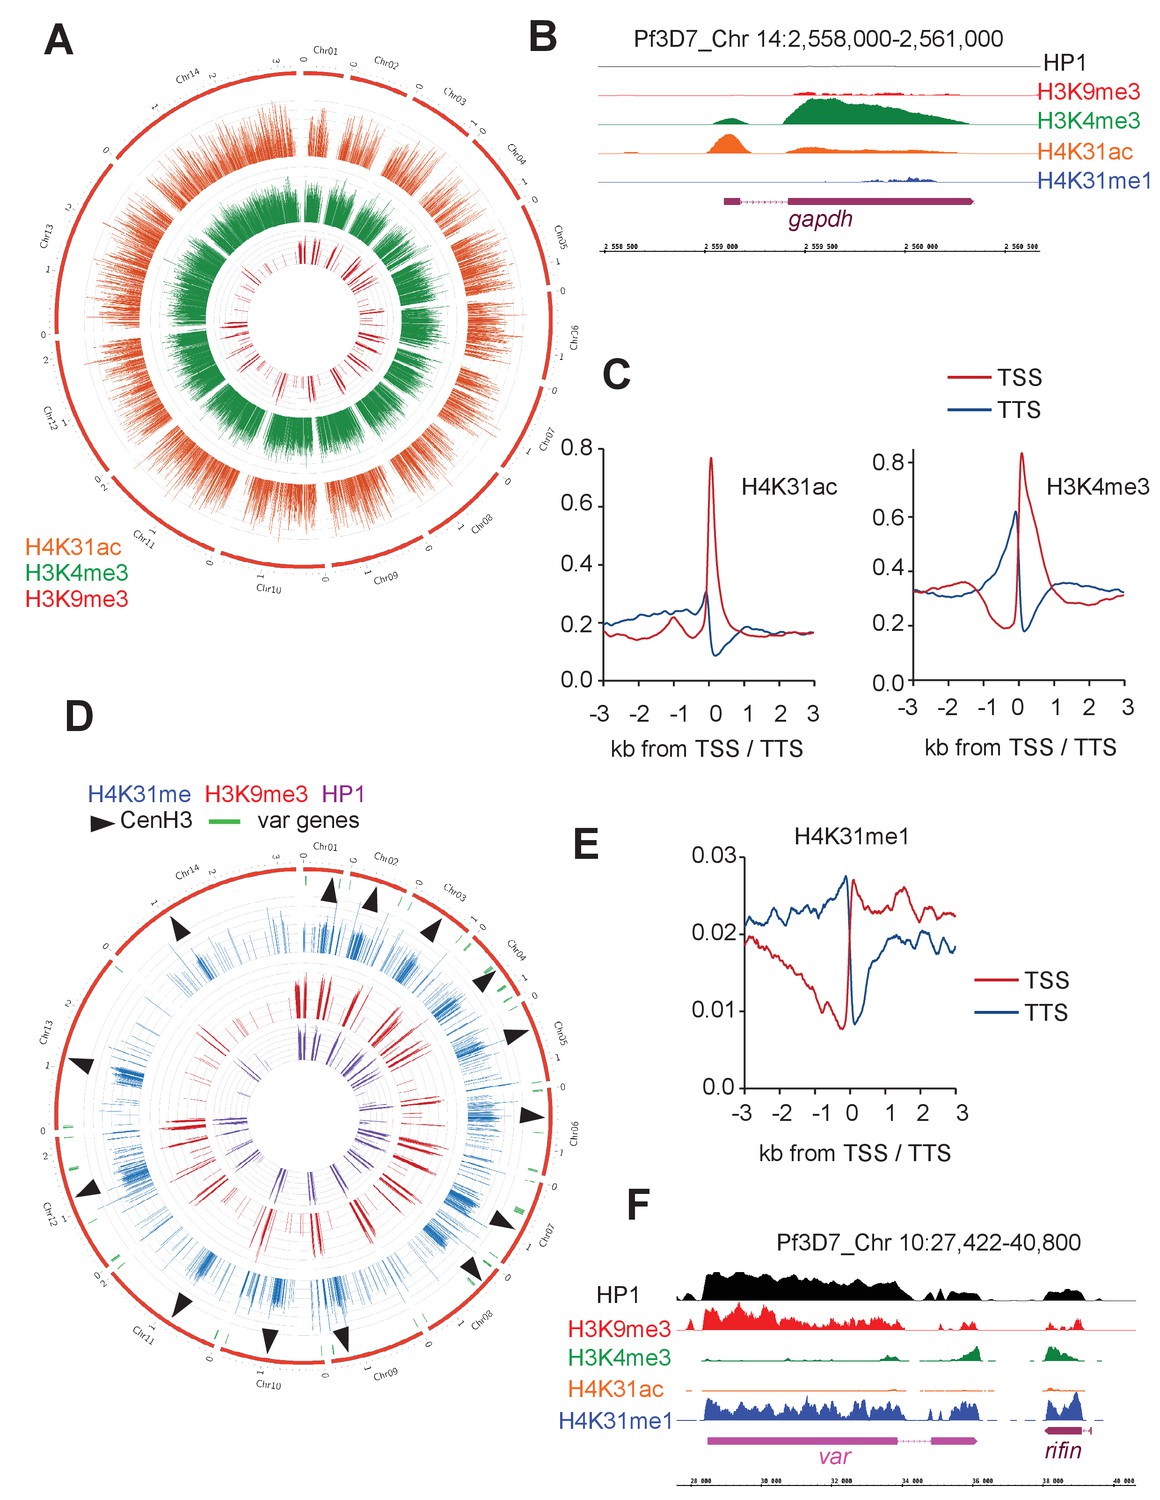
Genome-wide analysis of H4K31ac and H4K31me1 chromatin occupancy in P. falciparum.
(a) Chromosomal projection of H4K31ac, H3K9me3 and H3K4me3 occupancies in P. falciparum. The full set of chromosomes is represented as the circular plot. (b) Zoomed-in view of PTMs and HP1 enrichment along the gapdh locus. (c) Plot of genome-wide H4K31ac and H3K4me3 occupancy profiles at peri-TSS (Transcription Start Sites) and –TTS (Transcription Termination Sites) regions. (d) Chromosomal projection of H4K31me1, H3K9me3 and HP1 occupancies in P. falciparum. The full set of chromosomes is represented as the circular plot where CenH3 locations (black arrow) and var genes (in green) are indicated. (e) Plot of genome-wide H4K31me1 occupancy profiles at peri-TSS and –TTS regions. (f) IGB view of a section of chromosome 10 showing enrichment of H4K31me1, H3K9me3 and HP1 at var gene.
Figure 11—figure supplement 1
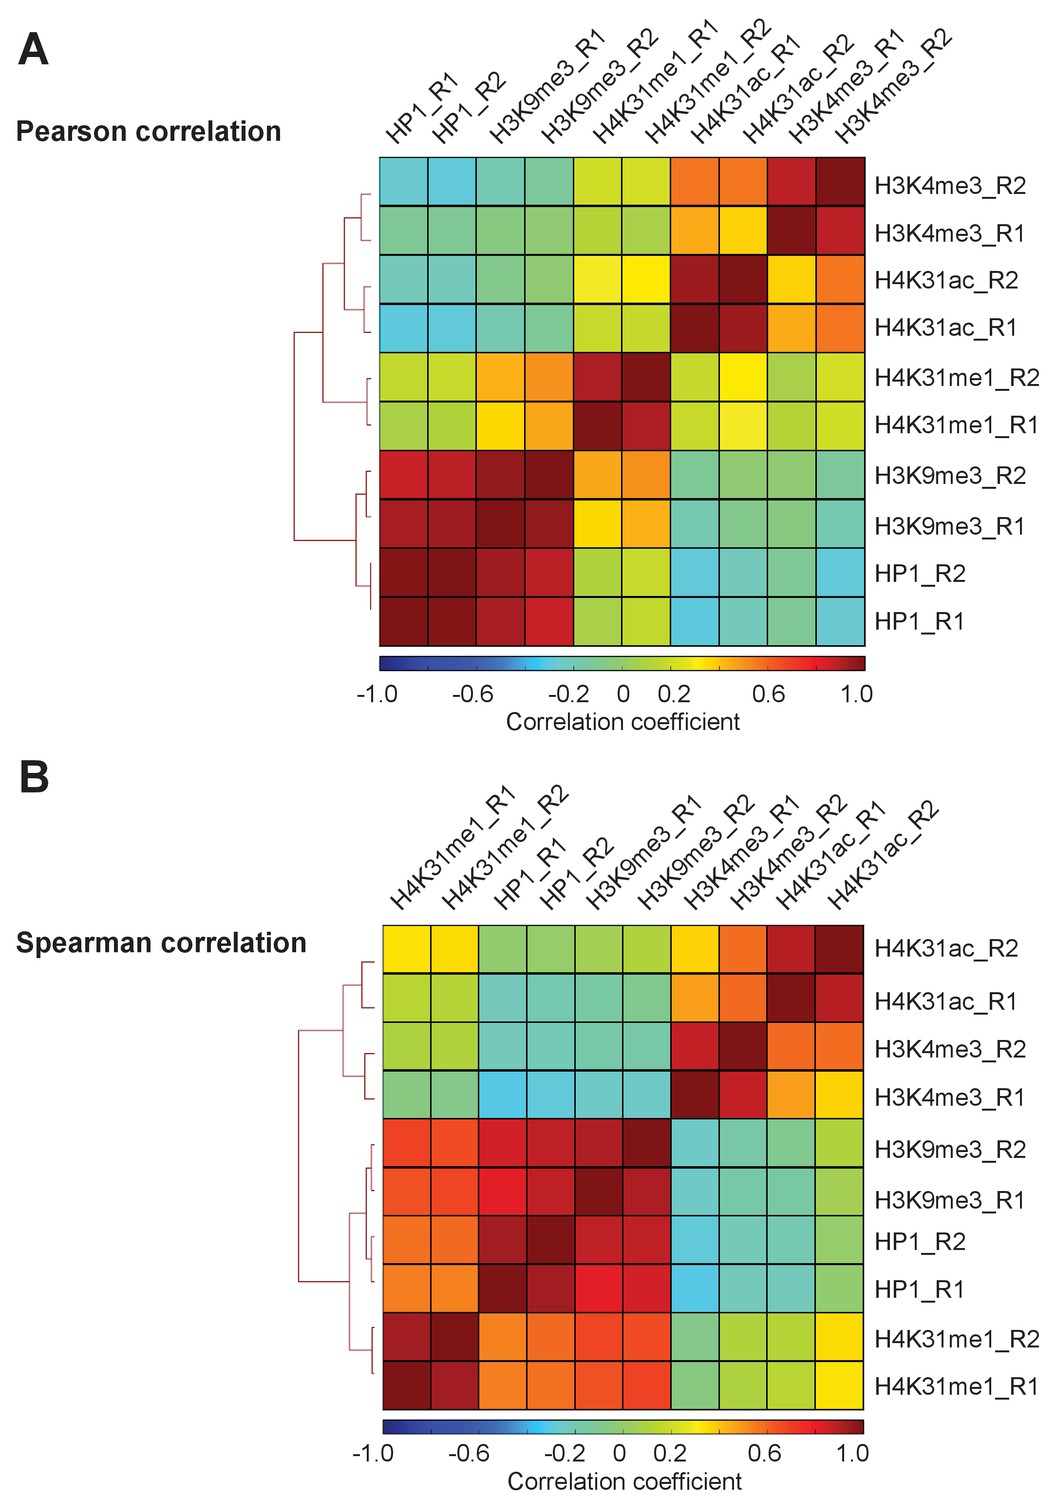
Correlation matrix between P. falciparum ChIP-seq experiments.
Heatmap displaying (a) Pearson and (b) Spearman rank correlations between all pairwise comparisons for all P. falciparum ChIPs. Spearman correlations were calculated using the normalized read depth across the entire set of binding sites identified for all ChIP-seq experiments.
Figure 11—figure supplement 2

Chromosomal projection of H4K31ac, H3K9me3 and H3K4me3 occupancies in P. falciparum.
The full set of chromosomes is represented in this circular plot.
Figure 11—figure supplement 3
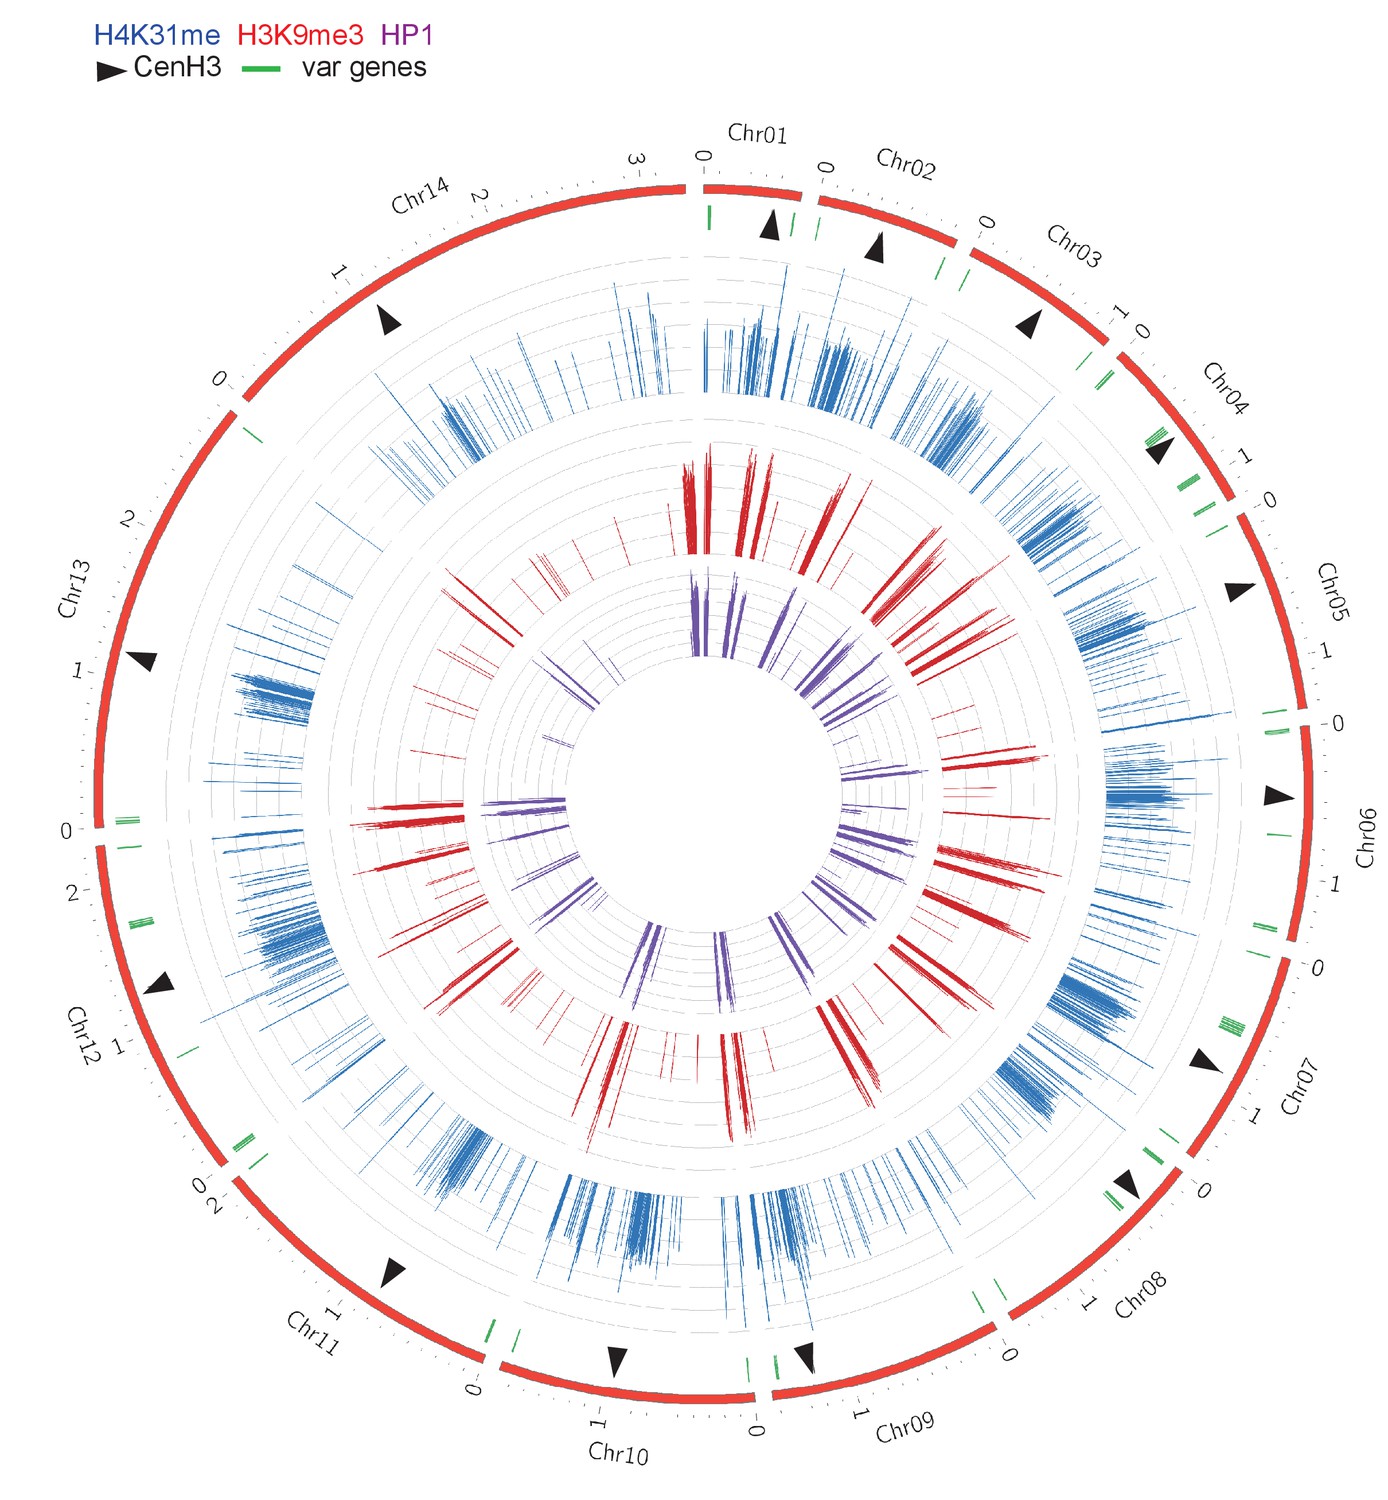
Chromosomal projection of H4K31me1, H3K9me3 and HP1 occupancies in P. falciparum.
The full set of chromosomes is represented in this circular plot, in which centromeric regions are marked by black arrows.
Figure 12 with 2 supplements
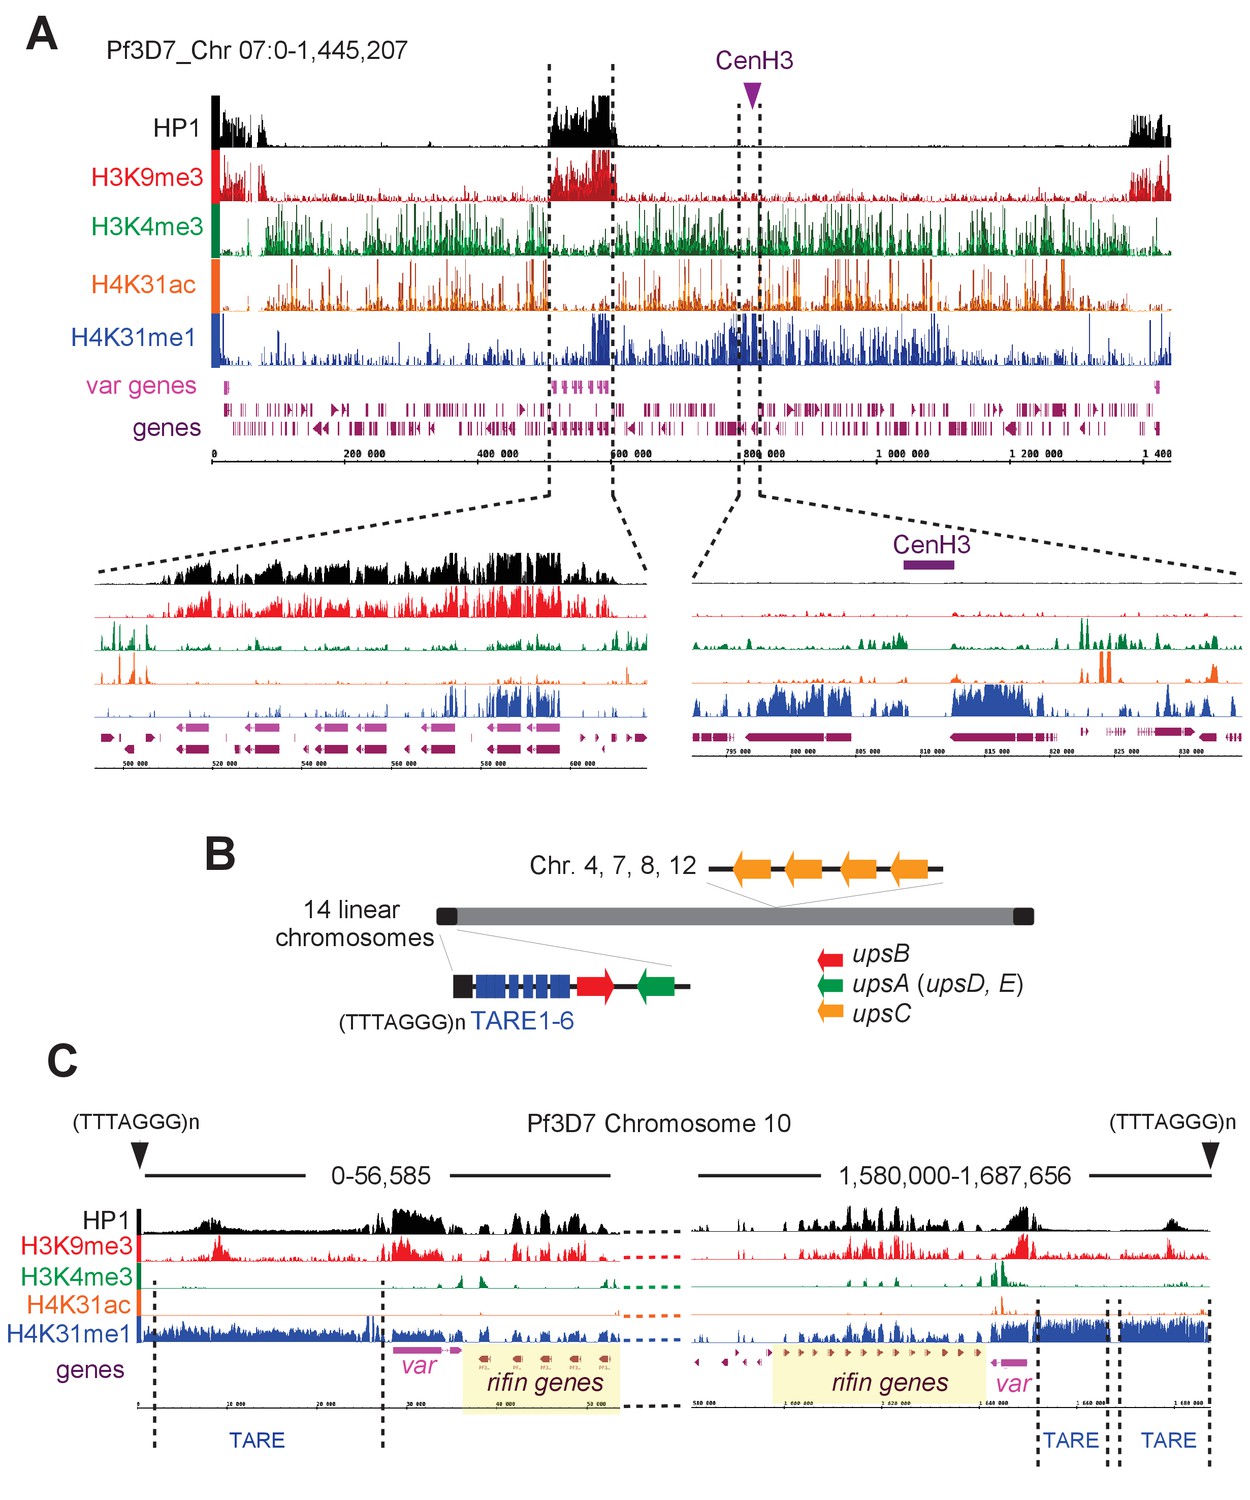
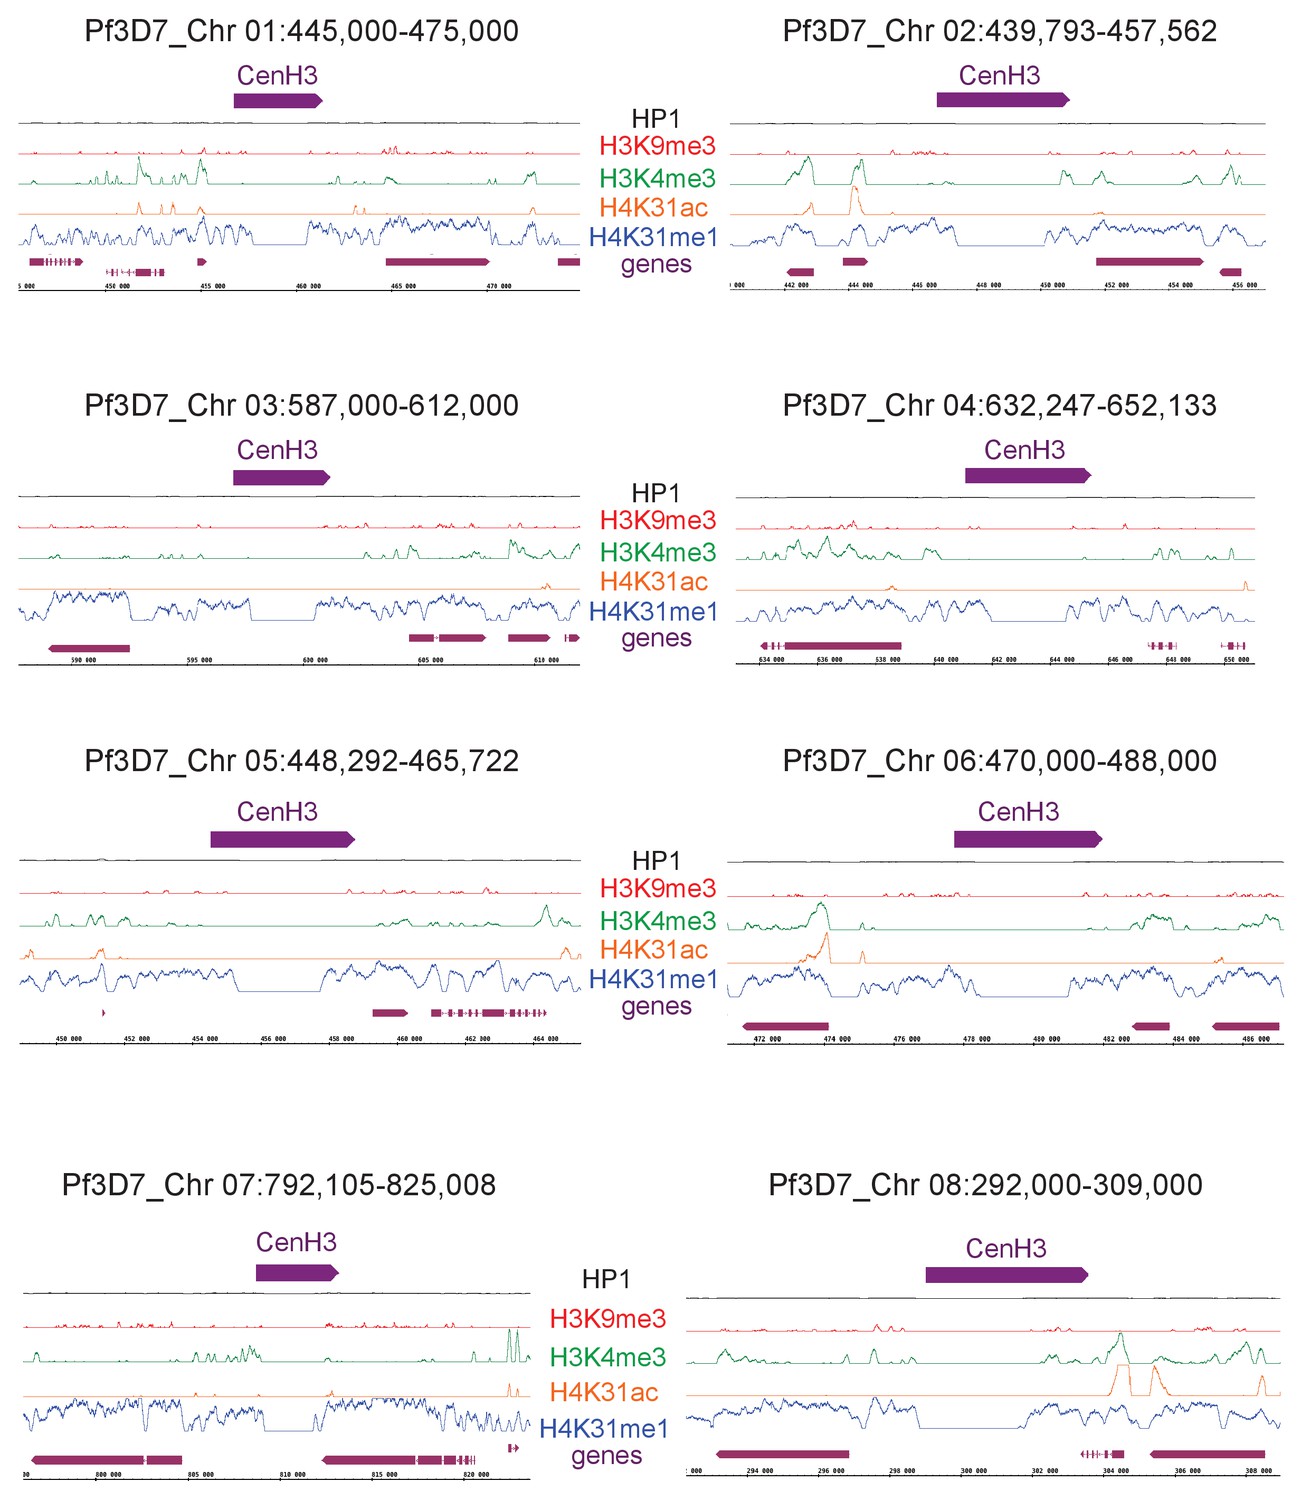
H4K31me1 singularly marks peri-centromeric heterochromatin in P. falciparum.
(a) (Top) Chromosome-wide coverage plot of histone modifications and PfHP1 on P. falciparum Chr. 7. CenH3 was mapped according to Hoeijmakers et al. (2012) and var genes are indicated. (Bottom) Zoomed-in views of the var-genes-containing internal locus (left) and the centromeric region (right) from P. falciparum Chr. 7. (b) Genomic organization and nuclear position of var genes and telomere-associated repeat elements (TAREs) in P. falciparum. (c) IGB screenshots of P. falciparum sub-telomeric regions of chromosome 10. rifin and var genes as well as TAREs are highlighted.
Figure 12—figure supplement 1
H4K31me1 marks pericentromeric chromatin in P. falciparum.
Zoomed-in views of centromeric and peri-centromeric chromatin from P. falciparum chromosomes.
Figure 12—figure supplement 2
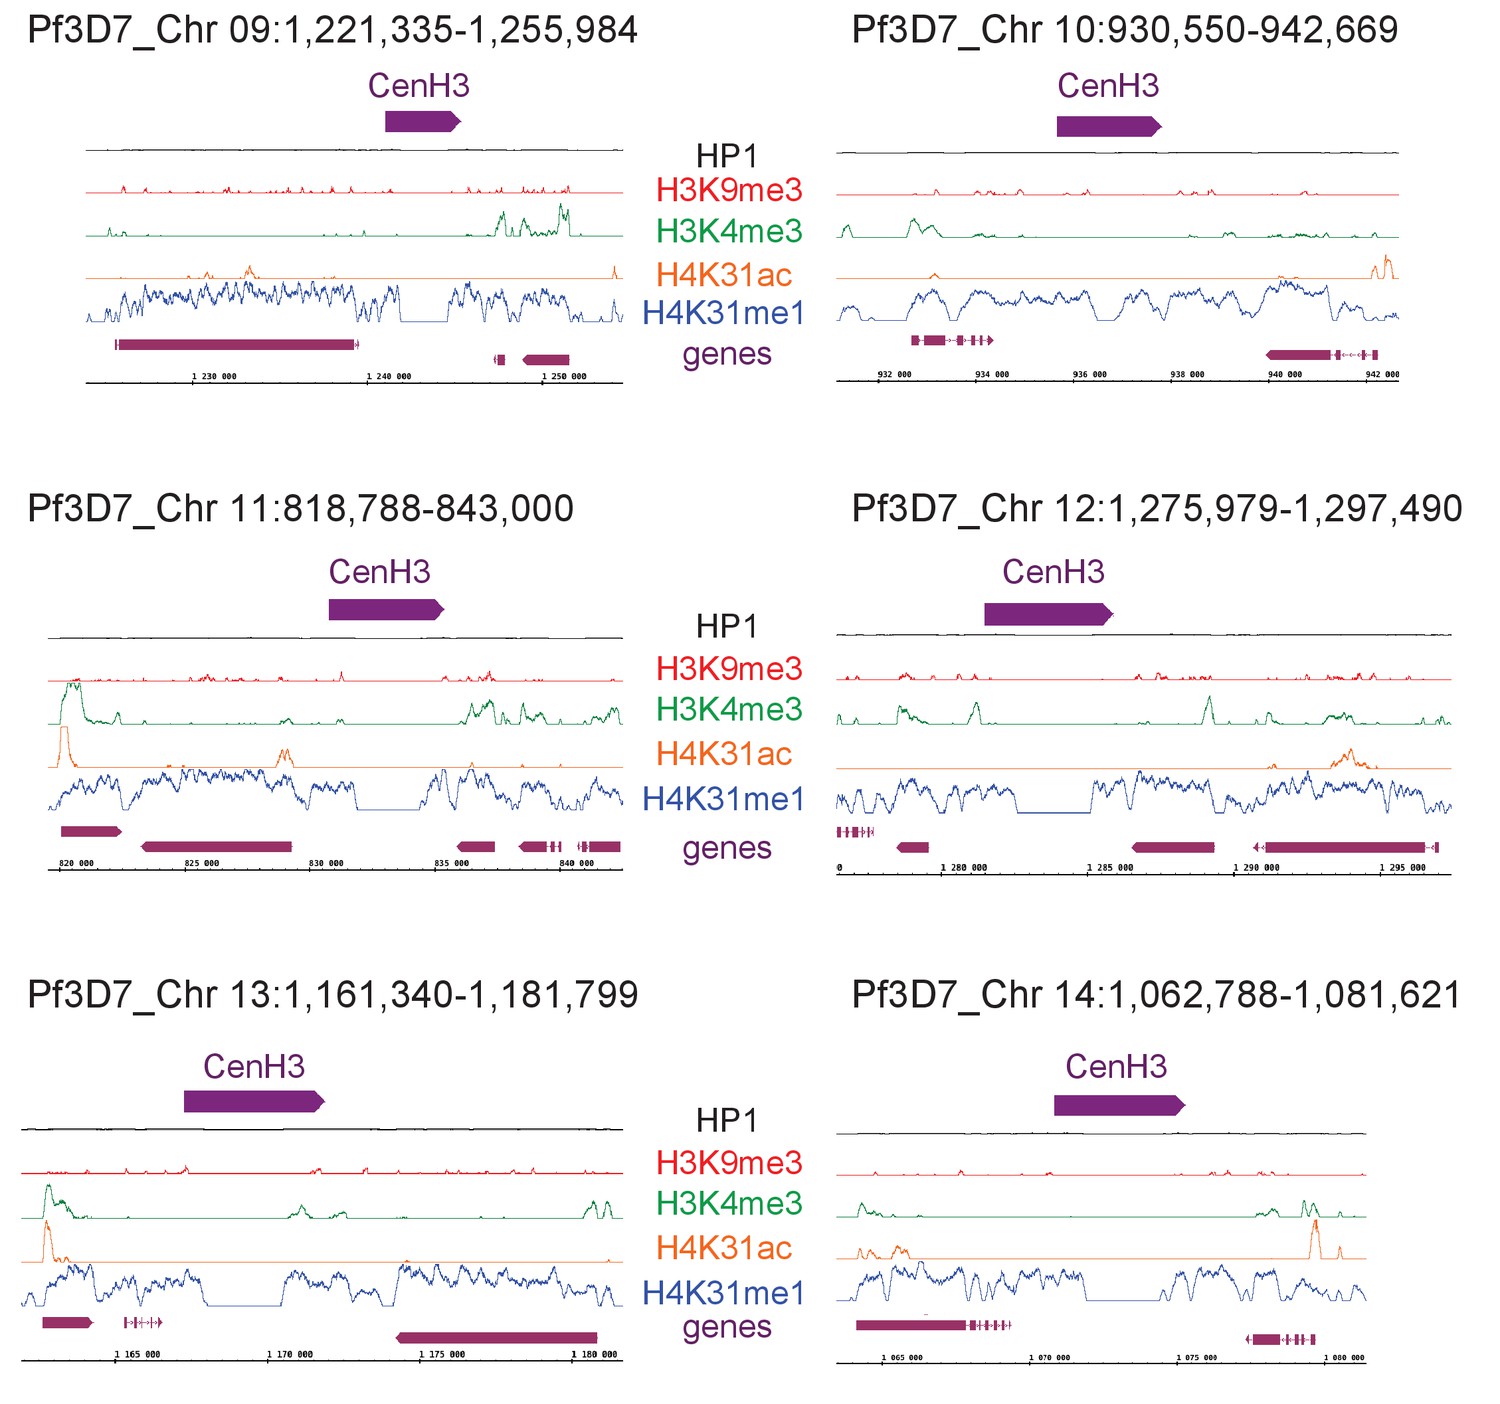
H4K31me1 marks pericentromeric chromatin in P. falciparum.
Zoomed-in views of centromeric and peri-centromeric chromatin from P. falciparum chromosomes.
Author response image 1
Additional files
-
Transparent reporting form
- https://doi.org/10.7554/eLife.29391.033
Download links
A two-part list of links to download the article, or parts of the article, in various formats.
Downloads (link to download the article as PDF)
Open citations (links to open the citations from this article in various online reference manager services)
Cite this article (links to download the citations from this article in formats compatible with various reference manager tools)
Modifications at K31 on the lateral surface of histone H4 contribute to genome structure and expression in apicomplexan parasites
eLife 6:e29391.
https://doi.org/10.7554/eLife.29391


