Infectious polymorphic toxins delivered by outer membrane exchange discriminate kin in myxobacteria
- University of Wyoming, United States
- University of California, United States
Figures
Figure 1
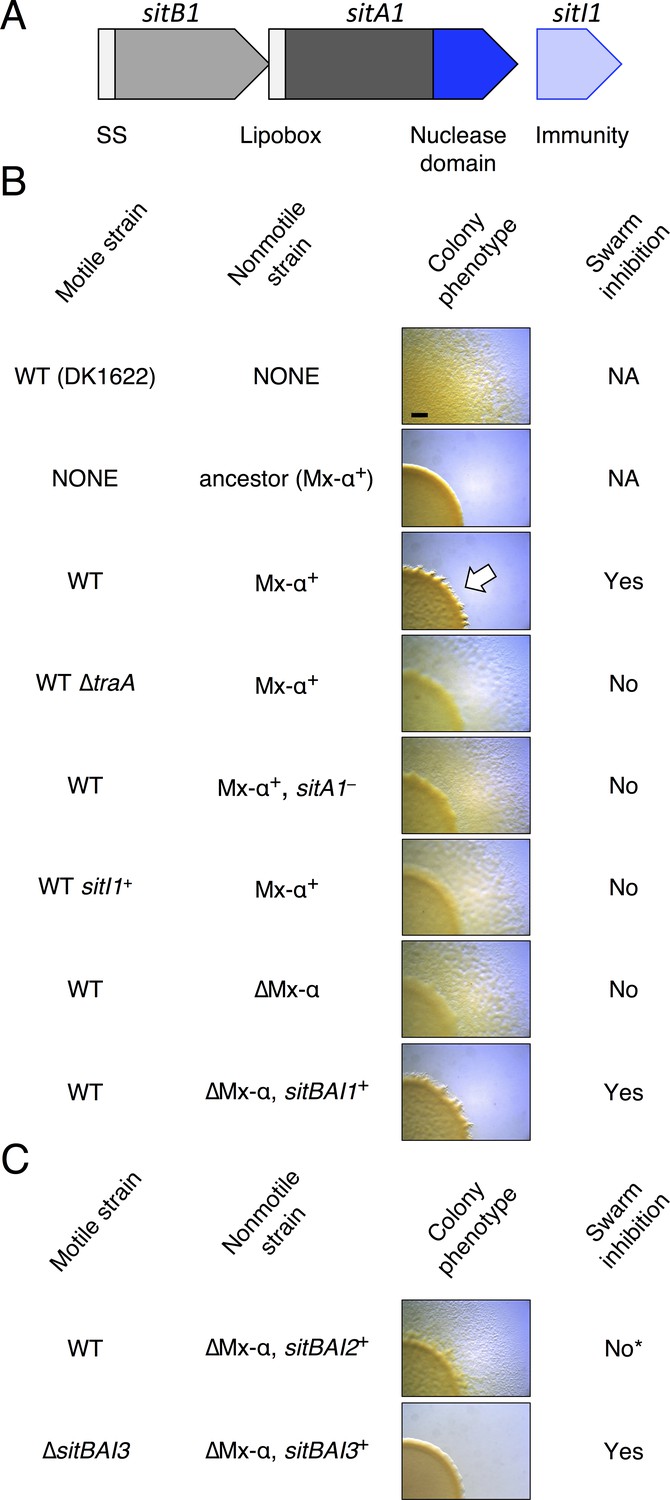
SitA1 is the swarm inhibition determinant.
(A) sitBAI1 operon found on one of the Mx-alpha elements that was lost from DK1622. SS, signal sequence. (B) Swarm inhibition assays with indicated motile and nonmotile strains. White arrow illustrates swarm inhibition with control strains. NA, not applicable. Bar, 1 mm. (C) Expression of sitBAI2 in a non-antagonistic nonmotile background results in modest swarm inhibition (indicated by *) compared to sitBAI1+ (shown in B). Expression of sitBAI3 in the non-antagonistic nonmotile background results in complete swarm inhibition of ∆sitBAI3. Here and elsewhere see Supplementary file 2A for strain details.
Figure 2 with 3 supplements

SitA polymorphic toxins found on Mx-alpha units are delivered by OME.
(A) Strain DK101 (the ancestor of DK1622) carries three Mx-alpha repeats, whereas DK1622 retains only one copy. Each Mx-alpha unit contains a unique sitBAI cassette. SitB proteins contain type I signal sequences (white boxes) whereas SitA proteins contain type II signal sequences (white boxes) with a lipobox and C-terminal toxin domains. The relative sequence identities are shown. (B) Competition outcomes when inhibitor strains each expressing one of three sitBAI cassettes were competed against susceptible target strains that lack the corresponding sitBAI cassette. Mock-inhibitor control is shown at left (WT vs. WT). See text for the calculation of competitive index. Strain genotypes (‘–’, traA deletion) are shown below histograms and further strain details provided in Supplementary file 2A. (C) Cells harvested from an agar co-culture of a strain expressing a SitA1-mCherry fusion with a GFP-labeled target at 0 and 6 hr. GFP targets are traA+ in the top panel and ∆traA in the bottom panel. Yellow arrows indicate two examples of GFP cells that have acquired the mCherry reporter. Boxes represent the number of mCherry positive GFP cells out of 100. Bar, 5 μm. (D) Fixed-cell immunofluorescence of C-terminal FLAG-tagged SitA1 and untagged control. Bar, 2.5 μm. Immunoblot of protein isolated from the same strains (right). SitAFLAG predicted size is 62.6 kDa. (E) Competition outcomes when inhibitor expresses one of the three sitBAI cassettes and the target strains express one of the three sitI genes. Data points at <0.001 indicate that no target cells remained. (F) E. coli MG1655 plating efficacy when equal number of cells were 10-fold serially diluted, spotted onto arabinose-supplemented agar and incubated overnight. Strains express either SitA1 or SitA3 C-terminal toxin domain (CTD) from a pBAD plasmid either in the absence (‘–’, empty vector) or presence of the indicated sitI genes expressed constitutively from a separate plasmid (pKSAT). This image is representative of three biological replicates. In this figure and the figures below, error bars represent standard error of the mean from at least three independent experiments.
Figure 2—figure supplement 1
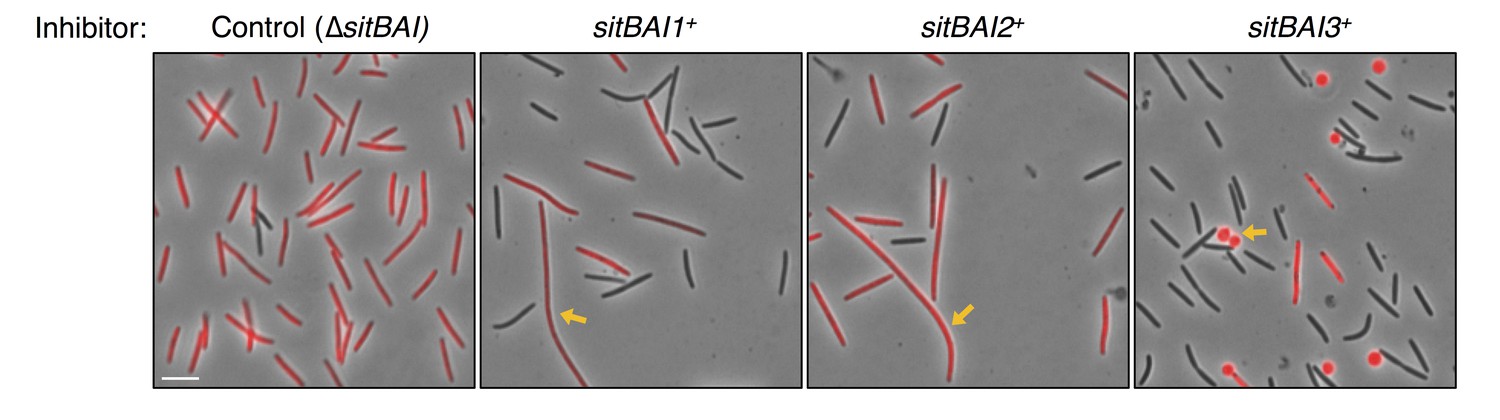
Morphology of SitA-poisoned target cells.
Target cells (red) were competed with sitBAI inhibitor strains or a ∆sitBAI mock inhibitor control at a 20 to 1 ratio. After 24 hr on agar media, cells were harvested and placed on glass slides for microscopy. Yellow arrows indicate an example of filamentous morphology for SitA1 and SitA2-poisoned cells and indicate an example of rounded cells for SitA3-poisoned cells. Bar, 5 μm.
Figure 2—figure supplement 2
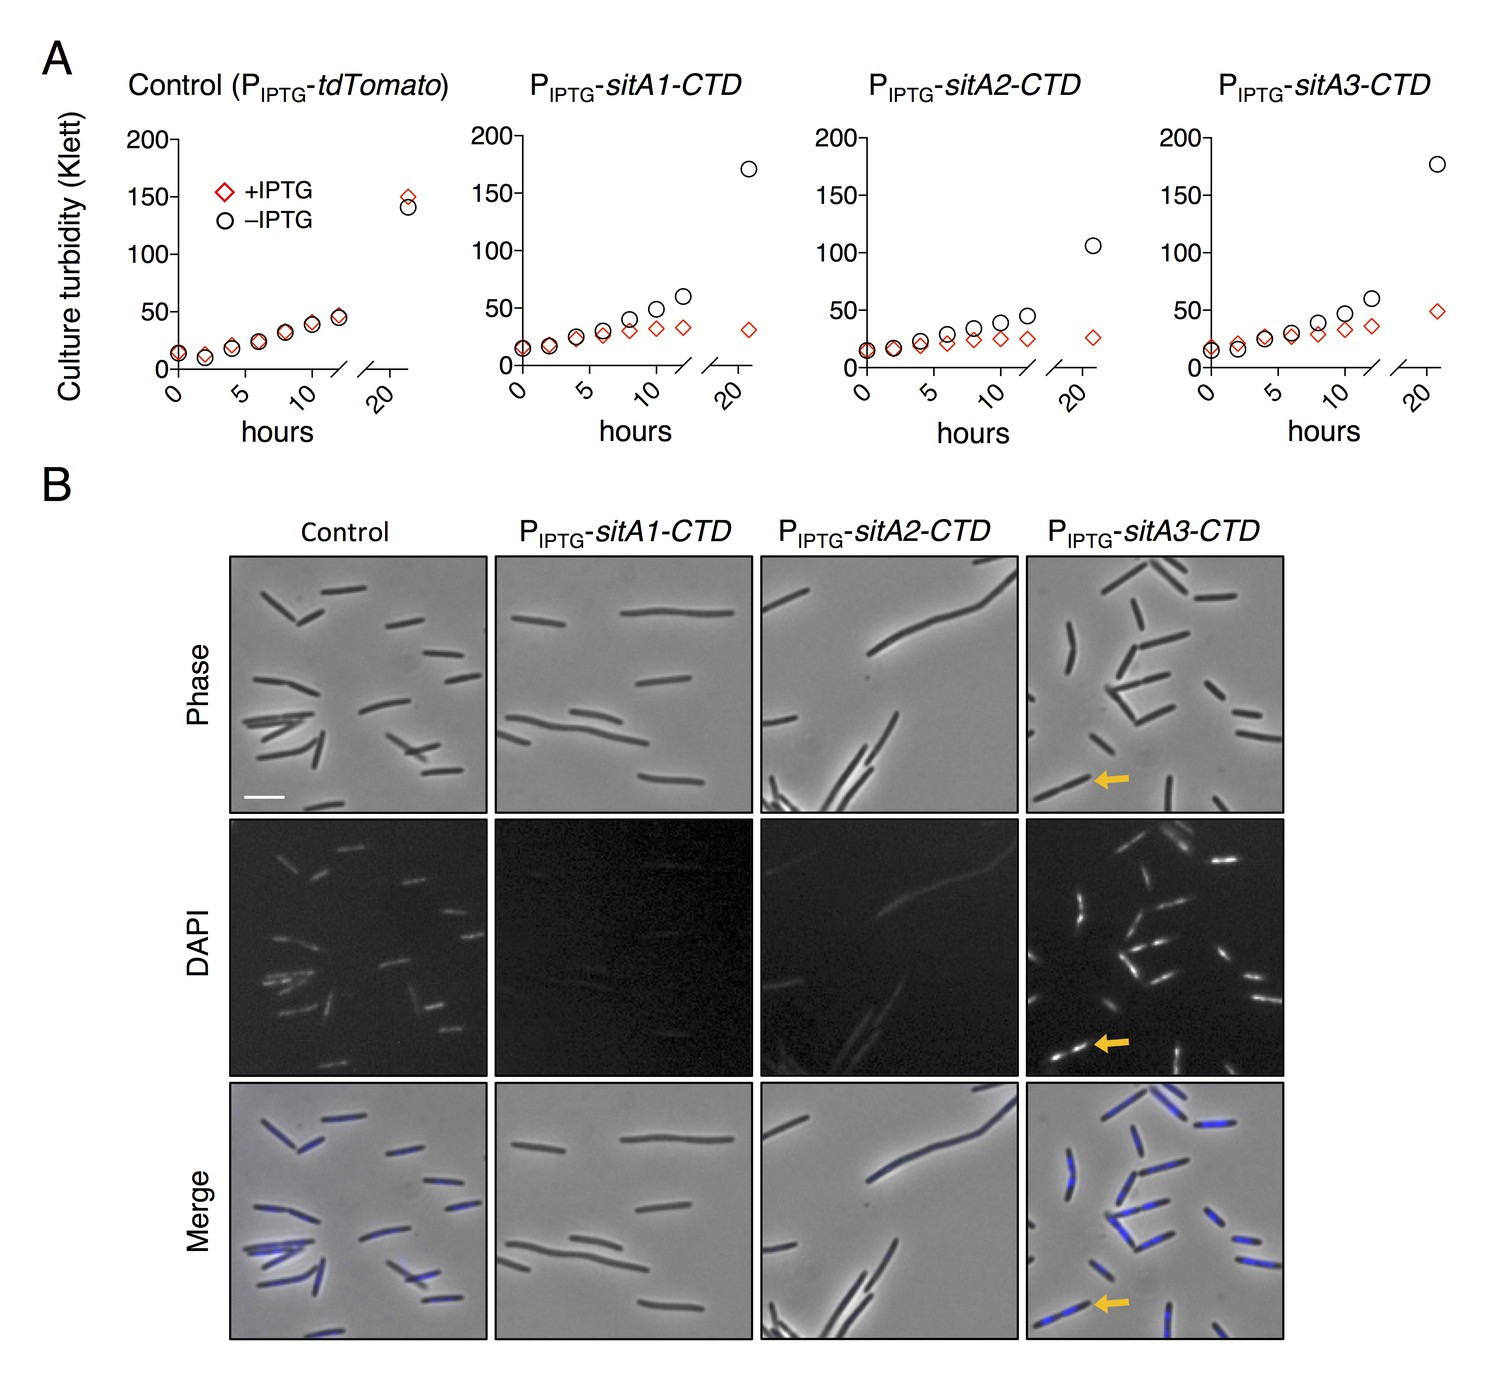
SitA-CTD expression in M. xanthus is toxic.
(A) Culture growth of strains was measured over 24 hr, in the presence or absence of IPTG. Each strain expressed a SitA-CTD or a control protein (tdTomato) from an IPTG-inducible promoter. Red diamonds, + IPTG (1 mM); black circles, – IPTG. (B) Cell morphology and DAPI stain of the strains from (A) when grown with 1 mM IPTG for 30 hr. Yellow arrows highlight an example cell which was arrested during cell division and contains two nucleoids. Bar, 5 μm.
Figure 2—figure supplement 3
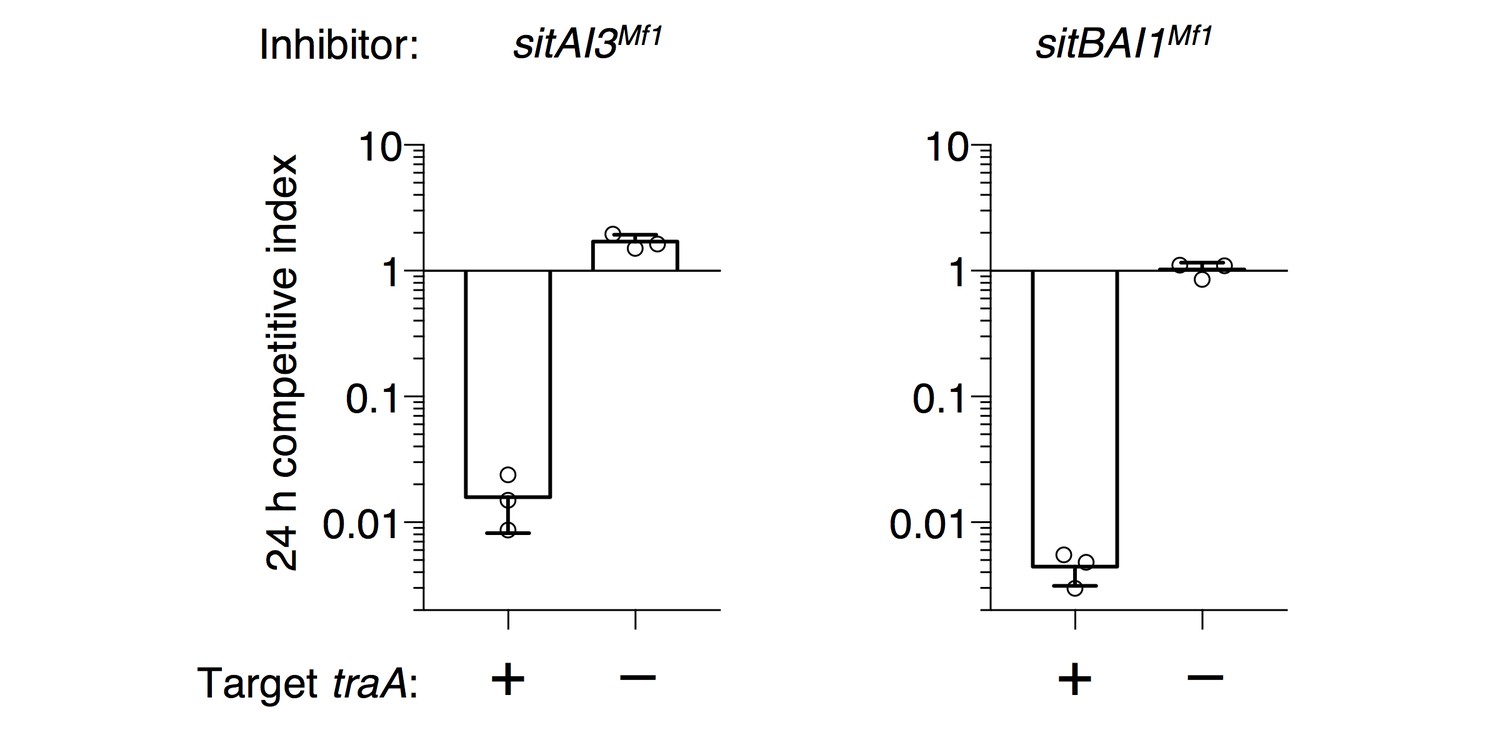
Heterologous sitAI cassettes from M. fulvus HW-1 are active in DK1622.
sitA3Mf1 (SitA3 homolog, LILAB_02580) and its associated sitI3Mf1, or sitA1Mf1 (SitA1 homolog, LILAB_05795) and its associated sitB1Mf1 and sitI1Mf1, were expressed in DK1622. Competitive indices against WT (DK1622) and DK1622 ∆traA cells were determined at 24 hr.
Figure 3 with 1 supplement

Toxic function of SitA1 and SitA3 CTDs.
(A) SitA3-CTD is a toxic tRNase. Expression of the indicated CTDs was induced with arabinose in E. coli, and cell growth monitored by measuring the optical density of the cultures at 600 nm (OD600). OD600 values are reported as the average ± standard error for three independent experiments (left). RNA was isolated after 90 min of toxin expression and analyzed by Northern blot hybridization using probes to the indicated tRNAs (right). The arrow indicates cleaved tRNAUGCAla. (B) SitA1-CTD has DNase activity. E. coli cells were stained with DAPI at 0 hr and after 6 hr of toxin expression. Cells expressing sitA1-CTD became filamentous and lost DAPI staining at 6 hr (left). In contrast, sitA3-CTD expressing cells retained DAPI staining (right), though their nucleoids became compacted (yellow arrow). Bar, 5 μm.
Figure 3—figure supplement 1

Alignment of SitA3-CTD with CdiA-CTD tRNase toxins.
SitA3-CTD shares homology with CdiA-CTD domains from Burkholderia pseudomallei 1026b (BP1026B_II2207) and Yersinia pseudotuberculosis YPIII (Ga0077885_11584). Predicted nuclease active-site residues are conserved and marked in red (Morse et al., 2012).
Figure 4
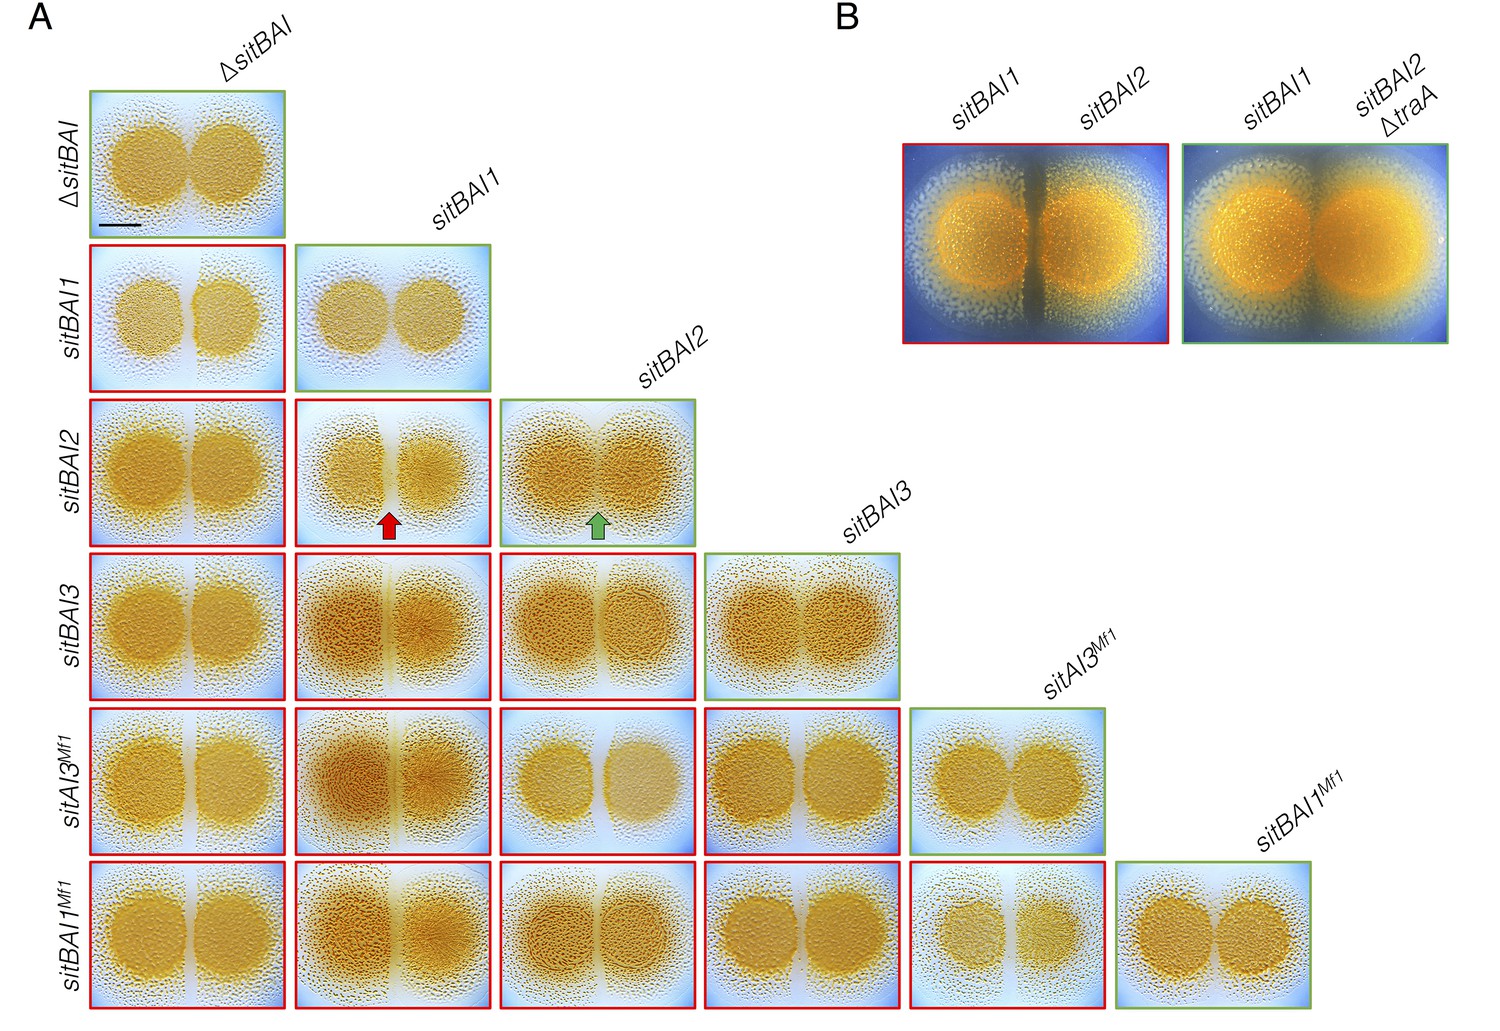
sitAI alleles determine the social compatibility of M. xanthus swarms.
(A) M. xanthus colonies expressing identical sitAI cassettes merge (as illustrated by the green arrow) when spotted adjacent to one another (top of each column). Strains that express different sitAI cassettes form demarcation zones between colonies (illustrated by the red arrow). Labels on the left indicate toxin expressed by left colony, while top labels indicate toxin expressed by colony on the right. Green borders indicate colony merging and red indicates demarcation. (B) Demarcation zone formation is traA-dependent. Bar, 5 mm.
Figure 5 with 1 supplement
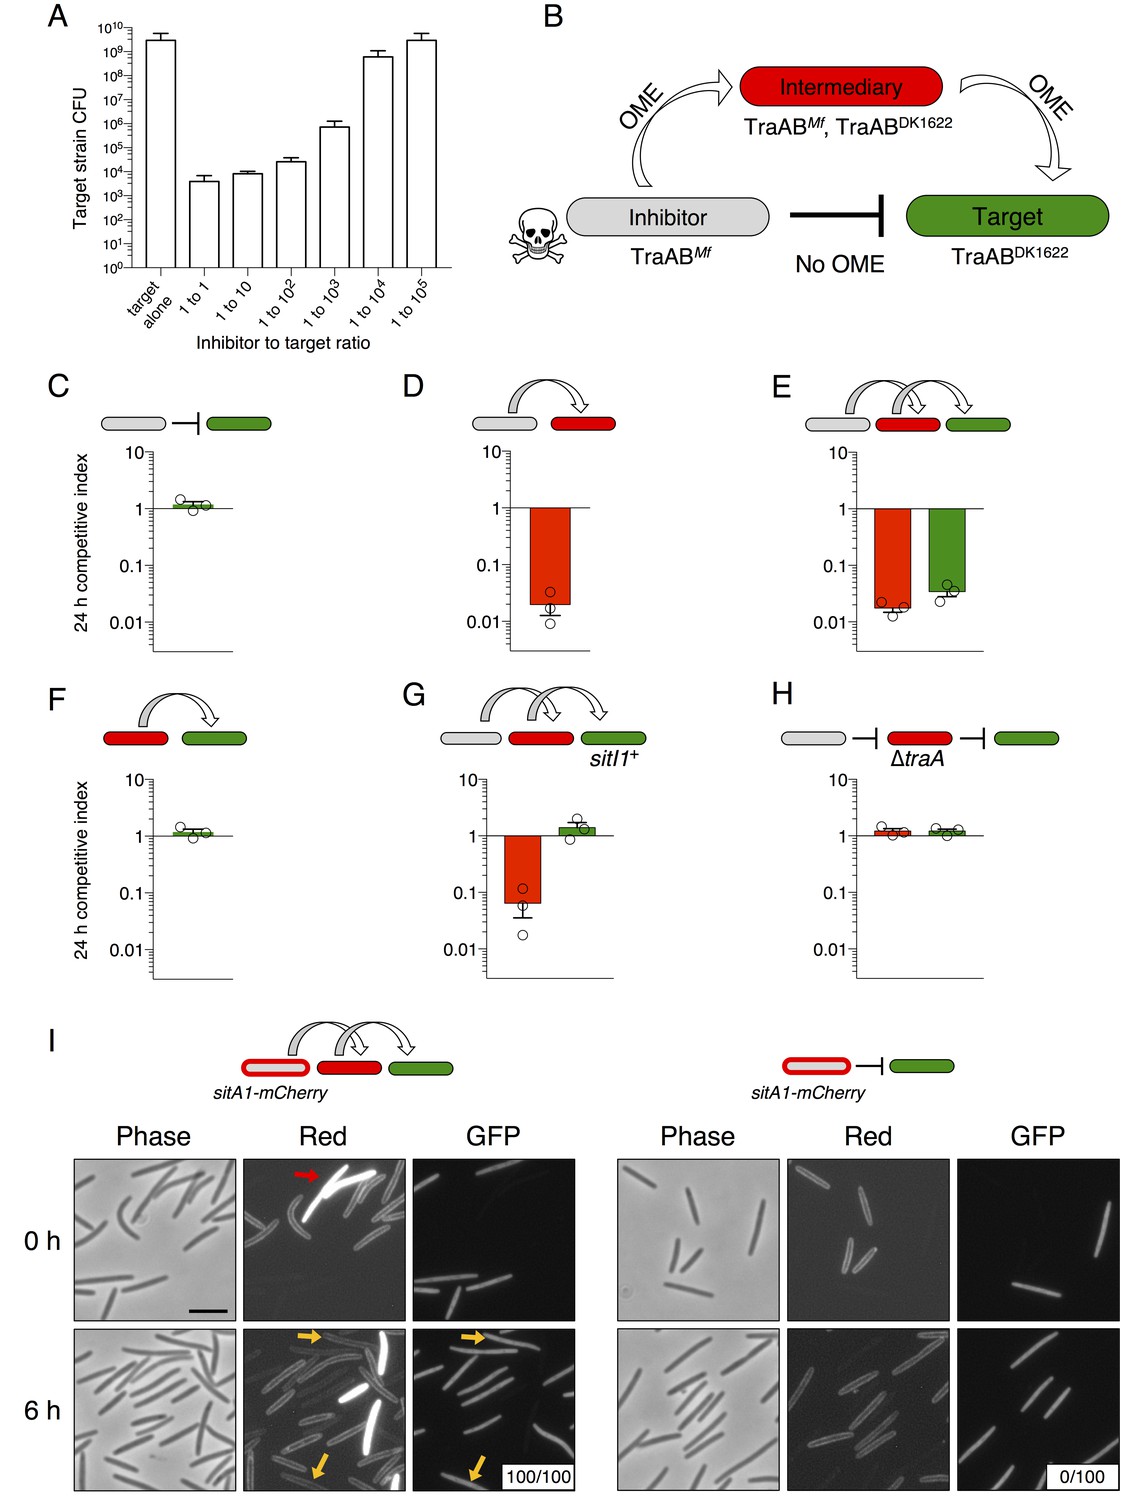
SitA toxins are serially transferred by OME.
(A) Viable cells (CFU) of a target population as a function of inhibitor to target cell ratio quantifies the efficiency of SitA1 and OME delivery. Strains were co-cultured on agar for 48 hr at indicated ratios before determining CFU of the marked (Kmr) target strain. (B) Experimental design to test serial transmissibility of SitA1. The grey cell produces the SitA1 toxin and contains traABMf alleles. The target cells (green) are susceptible, but carry incompatible traABDK1622 alleles that preclude OME with inhibitors. Intermediary cells (red) express both traAB alleles. (C–F) Competitive indices of intermediary (red) and target (green) strains from two- and three-strain co-cultures. (G) Three-strain competition when the target strain expresses SitI1. (H) Three strain competition when the intermediary strain is ∆traA. Competition outcomes were determined at 24 hr by fluorescent microscopy. Competitive index was calculated relative to the inhibitor (C–E, G–H) or relative to intermediary strain (F). Starting ratio was 1:5:5 inhibitor to intermediary to target. (I) Serial transfer of the SitA1-mCherry fusion. The left panel shows a 10:1:1 mixture of sitA1-mCherry cells to intermediary to target visualized at 0 and 6 hr. Red arrow indicates a representative example of an intermediary cell that expresses cytoplasmic tdTomato (which does not transfer). Yellow arrows indicate GFP-labeled target cells that have acquired an OM-localized mCherry signal at 6 hr. Boxes represent the number of mCherry positive GFP cells out of 100. Right panel: otherwise identical experiment omitting the intermediary strain. Bar, 5 μm.
Figure 5—figure supplement 1
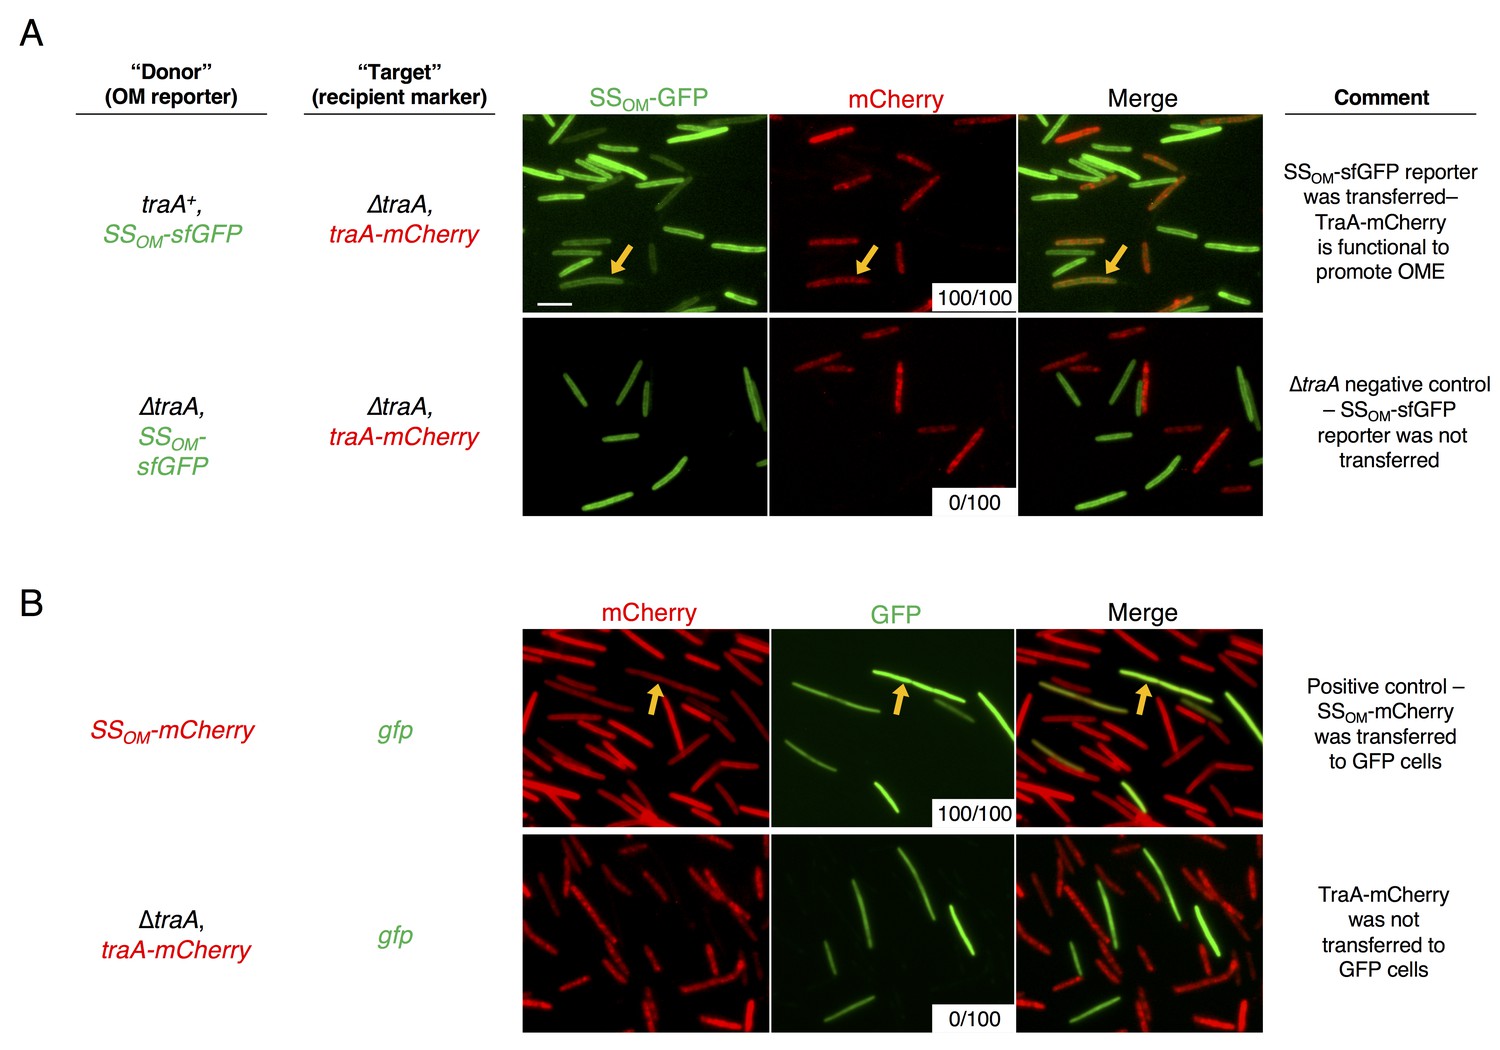
TraA is not transferred during OME.
(A) TraA-mCherry fusion protein is functional. Cells expressing TraA-mCherry were mixed with either traA+ (top) or ∆traA (bottom) donors that express an OM lipoprotein reporter, SSOM-sfGFP. Arrows indicate a TraA-mCherry cell that has acquired SSOM-sfGFP after 6 hr on agar media. White insets indicate the number of recipient cells where transfer was detected from a total of 100 scored recipient cells. (B) TraA-mCherry is not transferred during OME. Top: positive control in which donors that express an OM lipoprotein reporter, SSOM-mCherry, were mixed with cytoplasmic GFP expressing cells for 24 hr on agar media. Arrows indicate a GFP cells that has acquired the mCherry signal. Bottom: TraA-mCherry expressing cells were mixed with cells expressing cytoplasmic GFP for 24 hr. No mCherry signal was visible in the GFP cells. Bar, 5 μm.
Figure 6
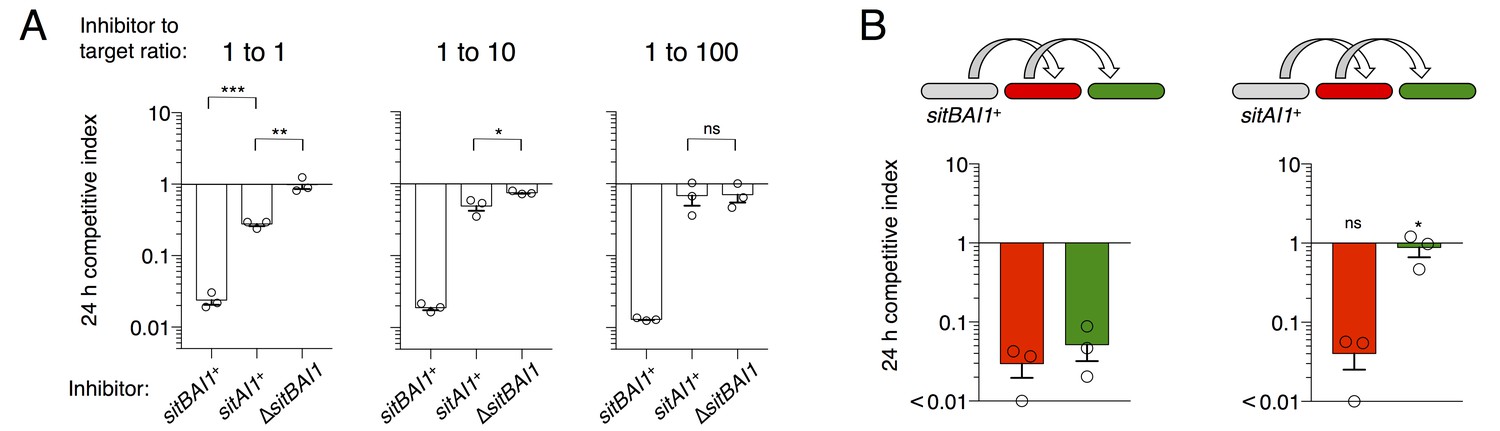
SitB contributes to SitA function and serial transfer.
(A) The indicated SitA1 inhibitor strains were co-cultured with target cells at three different inhibitor to target ratios. Competitive index was measured at 24 hr by counting the ratios of fluorescently marked cells. Asterisks indicate level of statistical significance, ns = not significant. P-values of indicated comparisons from left to right: 0.0002, 0.006, 0.0257, 0.9359. (B) Serial transfer was monitored as in Figure 5 using sitBAI or sitAI inhibitors that express traABMf. Co-cultures were seeded at a 10:1:1 ratio of inhibitor to intermediary to target strains. Significance indicators refer to comparisons between the inhibitor strains. P-values from left to right: 0.6341, 0.0193.
Figure 7

TraA and SitA are dominant determinants of competitive outcome within TraA recognition groups.
(A) Line graphs represent strain ratio over time when the three indicated, DK1622-derived strains, which were fluorescently labelled, were competed with wild isolates (A66, A88, DK801). These isolates belong to the same TraA recognition group as DK1622. Histograms indicate viable cells (CFU) of the DK1622-derived strains (Tcr) after the 24 hr competition. (B) Identical experiments as in A, except the lab strains were competed with wild isolates that belong to different TraA recognition groups.
Figure 8

Model for serial transfer of SitA.
(A) SitA is delivered cell-to-cell by OME. After OME, SitA may enter the cytoplasm or linger (lag) in the OM. (B) In the delayed entry model, the infected cell can undergo OME of SitA to another naïve cell before all SitA molecules enter the cytoplasm and before cell death. n = number of target cells poisoned by infected cell. (C) Alternative, but non-exclusive model in which OME and SitA transfer occurs between three or more cells simultaneously. Here SitA is delivered to a tertiary cell via an intermediary cell.
Additional files
-
Supplementary file 1
Homologs of SitA toxins.
- https://doi.org/10.7554/eLife.29397.016
-
Supplementary file 2
Strains, plasmids, and primers used in this study.
- https://doi.org/10.7554/eLife.29397.017
-
Supplementary file 3
Alignment of representative SitA toxins and their predicted functional annotations.
- https://doi.org/10.7554/eLife.29397.018
Download links
A two-part list of links to download the article, or parts of the article, in various formats.
Downloads (link to download the article as PDF)
Open citations (links to open the citations from this article in various online reference manager services)
Cite this article (links to download the citations from this article in formats compatible with various reference manager tools)
Infectious polymorphic toxins delivered by outer membrane exchange discriminate kin in myxobacteria
eLife 6:e29397.
https://doi.org/10.7554/eLife.29397


